Talent vs Luck: the role of randomness in success and failure A. Pluchino * , A. E. Biondo † , A. Rapisarda ‡ Abstract The largely dominant meritocratic paradigm of highly competitive Western cultures is rooted on the belief that success is due mainly, if not exclusively, to personal qualities such as talent, intelligence, skills, smartness, efforts, willfulness, hard work or risk taking. Sometimes, we are willing to admit that a certain degree of luck could also play a role in achieving significant material success. But, as a matter of fact, it is rather common to underestimate the importance of external forces in individual successful stories. It is very well known that intelligence (or, more in general, talent and personal qualities) exhibits a Gaussian distribution among the population, whereas the distribution of wealth - often considered a proxy of success - follows typically a power law (Pareto law), with a large majority of poor people and a very small number of billionaires. Such a discrepancy between a Normal distribution of inputs, with a typical scale (the average talent or intelligence), and the scale invariant distribution of outputs, suggests that some hidden ingredient is at work behind the scenes. In this paper, with the help of a very simple agent-based toy model, we suggest that such an ingredient is just randomness. In particular, we show that, if it is true that some degree of talent is necessary to be successful in life, almost never the most talented people reach the highest peaks of success, being overtaken by mediocre but sensibly luckier individuals. As to our knowledge, this counterintuitive result - although implicitly suggested between the lines in a vast literature - is quantified here for the first time. It sheds new light on the effectiveness of assessing merit on the basis of the reached level of success and underlines the risks of distributing excessive honors or resources to people who, at the end of the day, could have been simply luckier than others. With the help of this model, several policy hypotheses are also addressed and compared to show the most efficient strategies for public funding of research in order to improve meritocracy, diversity and innovation. Keywords: Success, Talent, Luck, Randomness, Serendipity, Funding strategies. 1 Introduction The ubiquity of power-law distributions in many physical, biological or socio-economical complex systems can be seen as a sort of mathematical signature of their strongly correlated dynamic behavior and their scale invariant topological structure [1, 2, 3, 4]. In socio-economic context, * Department of Physics and Astronomy, University of Catania and INFN Sezione di Catania, Italy; alessan- [email protected]† Dept. of Economics and Business, Univ. of Catania, Italy; [email protected]‡ Department of Physics and Astronomy, University of Catania and INFN Sezione di Catania, Italy; Complexity Science Hub Vienna; [email protected]1 arXiv:1802.07068v3 [physics.soc-ph] 9 Jul 2018
Transcript
Talent vs Luck:
the role of randomness in success and failure
A. Pluchino∗, A. E. Biondo†, A. Rapisarda‡
Abstract
The largely dominant meritocratic paradigm of highly competitive Western cultures isrooted on the belief that success is due mainly, if not exclusively, to personal qualities such astalent, intelligence, skills, smartness, efforts, willfulness, hard work or risk taking. Sometimes,we are willing to admit that a certain degree of luck could also play a role in achievingsignificant material success. But, as a matter of fact, it is rather common to underestimatethe importance of external forces in individual successful stories. It is very well knownthat intelligence (or, more in general, talent and personal qualities) exhibits a Gaussiandistribution among the population, whereas the distribution of wealth - often considereda proxy of success - follows typically a power law (Pareto law), with a large majority ofpoor people and a very small number of billionaires. Such a discrepancy between a Normaldistribution of inputs, with a typical scale (the average talent or intelligence), and the scaleinvariant distribution of outputs, suggests that some hidden ingredient is at work behindthe scenes. In this paper, with the help of a very simple agent-based toy model, we suggestthat such an ingredient is just randomness. In particular, we show that, if it is true thatsome degree of talent is necessary to be successful in life, almost never the most talentedpeople reach the highest peaks of success, being overtaken by mediocre but sensibly luckierindividuals. As to our knowledge, this counterintuitive result - although implicitly suggestedbetween the lines in a vast literature - is quantified here for the first time. It sheds newlight on the effectiveness of assessing merit on the basis of the reached level of success andunderlines the risks of distributing excessive honors or resources to people who, at the endof the day, could have been simply luckier than others. With the help of this model, severalpolicy hypotheses are also addressed and compared to show the most efficient strategies forpublic funding of research in order to improve meritocracy, diversity and innovation.
The ubiquity of power-law distributions in many physical, biological or socio-economical complexsystems can be seen as a sort of mathematical signature of their strongly correlated dynamicbehavior and their scale invariant topological structure [1, 2, 3, 4]. In socio-economic context,
∗Department of Physics and Astronomy, University of Catania and INFN Sezione di Catania, Italy; [email protected]†Dept. of Economics and Business, Univ. of Catania, Italy; [email protected]‡Department of Physics and Astronomy, University of Catania and INFN Sezione di Catania, Italy; Complexity
after Pareto’s work [5, 6, 7, 8, 9], it is well known that the wealth distribution follows a power-law, whose typical long tailed shape reflects the deep existing gap between the rich and the poorin our society. A very recent report [10] shows that today this gap is far greater than it had beenfeared: eight men own the same wealth as the 3.6 billion people constituting the poorest halfof humanity. In the last 20 years, several theoretical models have been developed to derive thewealth distribution in the context of statistical physics and probability theory, often adopting amulti-agent perspective with a simple underlying dynamics [11, 12, 13, 14, 15, 16, 17].
Moving along this line, if one considers the individual wealth as a proxy of success, one couldargue that its deeply asymmetric and unequal distribution among people is either a consequenceof their natural differences in talent, skill, competence, intelligence, ability or a measure of theirwillfulness, hard work or determination. Such an assumption is, indirectly, at the basis of the so-called meritocratic paradigm: it affects not only the way our society grants work opportunities,fame and honors, but also the strategies adopted by Governments in assigning resources andfunds to those who are considered the most deserving individuals.
However, the previous conclusion appears to be in strict contrast with the accepted evidencethat human features and qualities cited above are normally distributed among the population,i.e. follow a symmetric Gaussian distribution around a given mean. For example, intelligence,as measured by IQ tests, follows this pattern: average IQ is 100, but nobody has an IQ of 1,000or 10,000. The same holds for efforts, as measured by hours worked: someone works more hoursthan the average and someone less, but nobody works a billion times more hours than anybodyelse.
On the other hand, there is nowadays an ever greater evidence about the fundamental roleof chance, luck or, more in general, random factors, in determining successes or failures in ourpersonal and professional lives. In particular, it has been shown that scientists have the samechance along their career of publishing their biggest hit [18]; that those with earlier surnameinitials are significantly more likely to receive tenure at top departments [19]; that the distribu-tions of bibliometric indicators collected by a scholar might be the result of chance and noiserelated to multiplicative phenomena connected to a publish or perish inflationary mechanism[20]; that one’s position in an alphabetically sorted list may be important in determining ac-cess to over-subscribed public services [21]; that middle name initials enhance evaluations ofintellectual performance [22]; that people with easy-to-pronounce names are judged more pos-itively than those with difficult-to-pronounce names [23]; that individuals with noble-soundingsurnames are found to work more often as managers than as employees [24]; that females withmasculine monikers are more successful in legal careers [25]; that roughly half of the variancein incomes across persons worldwide is explained only by their country of residence and by theincome distribution within that country [26]; that the probability of becoming a CEO is stronglyinfluenced by your name or by your month of birth [27, 28, 29]; that the innovative ideas are theresults of a random walk in our brain network [30]; and that even the probability of developinga cancer, maybe cutting a brilliant career, is mainly due to simple bad luck [31, 32]. Recentstudies on lifetime reproductive success further corroborate these statements showing that, iftrait variation may influence the fate of populations, luck often governs the lives of individuals[33, 34].
In recent years many authors, among whom the statistician and risk analyst Nassim N.Taleb [35, 36], the investment strategist Michael Mauboussin [37] and the economist Robert H.Frank [38], have explored in several successful books the relationship between luck and skill infinancial trading, business, sports, art, music, literature, science and in many other fields. They
2
reach the conclusion that chance events play a much larger role in life than many people onceimagined. Actually, they do not suggest that success is independent of talent and efforts, sincein highly competitive arenas or ’winner-takes-all’ markets, like those where we live and worktoday, people performing well are almost always extremely talented and hard-working. Simply,they conclude that talent and efforts are not enough: you have to be also in the right place atthe right time. In short: luck also matters, even if its role is almost always underestimated bysuccessful people. This happens because randomness often plays out in subtle ways, therefore itis easy to construct narratives that portray success as having been inevitable. Taleb calls thistendency ”narrative fallacy” [36], while the sociologist Paul Lazarsfeld adopts the terminology”hindsight bias”. In his recent book ”Everything Is Obvious: Once You Know the Answer”[39], the sociologist and network science pioneer Duncan J. Watts, suggests that both narrativefallacy and hindsight bias operate with particular force when people observe unusually successfuloutcomes and consider them as the necessary product of hard work and talent, while they mainlyemerge from a complex and interwoven sequence of steps, each depending on precedent ones:if any of them had been different, an entire career or life trajectory would almost surely differtoo. This argument is also based on the results of a seminal experimental study, performedsome years before by Watts himself in collaboration with other authors [40], where the successof previously unknown songs in an artificial music market was shown not to be correlated withthe quality of the song itself. And this clearly makes very difficult any kind of prediction, asalso shown in another more recent study [41].
In this paper, by adopting an agent-based statistical approach, we try to realistically quantifythe role of luck and talent in successful careers. In section 2, building on a minimal number ofassumptions, i.e. a Gaussian distribution of talent [42] and a multiplicative dynamics for bothsuccesses and failures [43], we present a simple model, that we call ”Talent vs Luck” (TvL) model,which mimics the evolution of careers of a group of people over a working period of 40 years. Themodel shows that, actually, randomness plays a fundamental role in selecting the most successfulindividuals. It is true that, as one could expect, talented people are more likely to become rich,famous or important during their life with respect to poorly equipped ones. But - and this is aless intuitive rationale - ordinary people with an average level of talent are statistically destinedto be successful (i.e. to be placed along the tail of some power law distribution of success) muchmore than the most talented ones, provided that they are more blessed by fortune along theirlife. This fact is commonly experienced, as pointed in refs.[35, 36, 38], but, to our knowledge, itis modeled and quantified here for the first time.
The success of the averagely-talented people strongly challenges the ”meritocratic” paradigmand all those strategies and mechanisms, which give more rewards, opportunities, honors, fameand resources to people considered the best in their field [44, 45]. The point is that, in thevast majority of cases, all evaluations of someone’s talent are carried out a posteriori, just bylooking at his/her performances - or at reached results - in some specific area of our society likesport, business, finance, art, science, etc. This kind of misleading evaluation ends up switchingcause and effect, rating as the most talented people those who are, simply, the luckiest ones[46, 47]. In line with this perspective, in previous works, it was advanced a warning againstsuch a kind of ”naive meritocracy” and it was shown the effectiveness of alternative strategiesbased on random choices in many different contexts, such as management, politics and finance[48, 49, 50, 51, 52, 53, 54, 55]. In section 3 we provide an application of our approach and sketcha comparison of possible public funds attribution schemes in the scientific research context. Westudy the effects of several distributive strategies, among which the ”naively” meritocratic one,
3
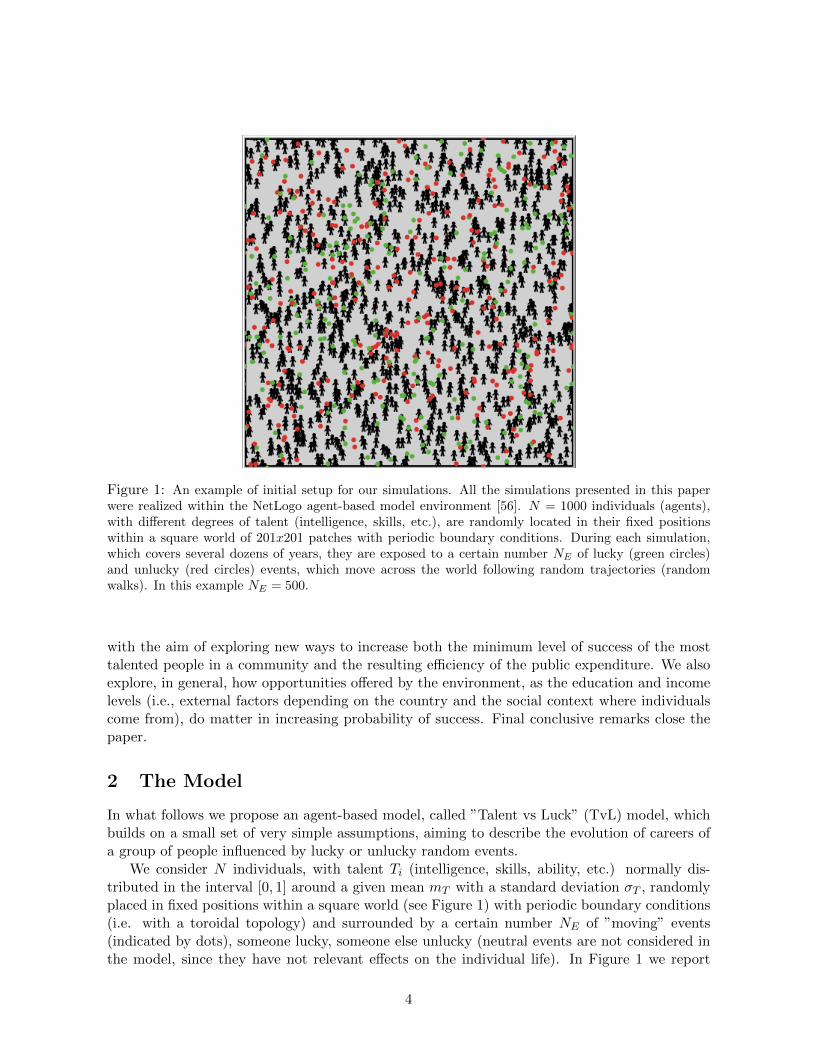
Figure 1: An example of initial setup for our simulations. All the simulations presented in this paperwere realized within the NetLogo agent-based model environment [56]. N = 1000 individuals (agents),with different degrees of talent (intelligence, skills, etc.), are randomly located in their fixed positionswithin a square world of 201x201 patches with periodic boundary conditions. During each simulation,which covers several dozens of years, they are exposed to a certain number NE of lucky (green circles)and unlucky (red circles) events, which move across the world following random trajectories (randomwalks). In this example NE = 500.
with the aim of exploring new ways to increase both the minimum level of success of the mosttalented people in a community and the resulting efficiency of the public expenditure. We alsoexplore, in general, how opportunities offered by the environment, as the education and incomelevels (i.e., external factors depending on the country and the social context where individualscome from), do matter in increasing probability of success. Final conclusive remarks close thepaper.
2 The Model
In what follows we propose an agent-based model, called ”Talent vs Luck” (TvL) model, whichbuilds on a small set of very simple assumptions, aiming to describe the evolution of careers ofa group of people influenced by lucky or unlucky random events.
We consider N individuals, with talent Ti (intelligence, skills, ability, etc.) normally dis-tributed in the interval [0, 1] around a given mean mT with a standard deviation σT , randomlyplaced in fixed positions within a square world (see Figure 1) with periodic boundary conditions(i.e. with a toroidal topology) and surrounded by a certain number NE of ”moving” events(indicated by dots), someone lucky, someone else unlucky (neutral events are not considered inthe model, since they have not relevant effects on the individual life). In Figure 1 we report
4
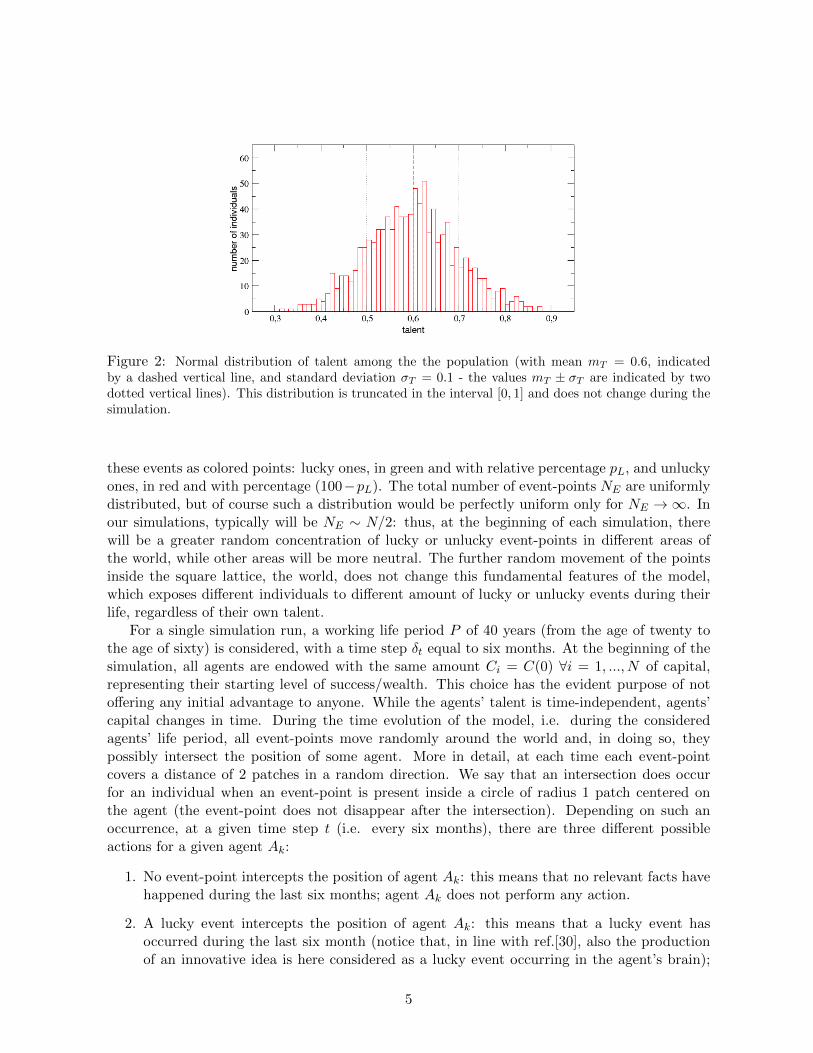
Figure 2: Normal distribution of talent among the the population (with mean mT = 0.6, indicatedby a dashed vertical line, and standard deviation σT = 0.1 - the values mT ± σT are indicated by twodotted vertical lines). This distribution is truncated in the interval [0, 1] and does not change during thesimulation.
these events as colored points: lucky ones, in green and with relative percentage pL, and unluckyones, in red and with percentage (100−pL). The total number of event-points NE are uniformlydistributed, but of course such a distribution would be perfectly uniform only for NE →∞. Inour simulations, typically will be NE ∼ N/2: thus, at the beginning of each simulation, therewill be a greater random concentration of lucky or unlucky event-points in different areas ofthe world, while other areas will be more neutral. The further random movement of the pointsinside the square lattice, the world, does not change this fundamental features of the model,which exposes different individuals to different amount of lucky or unlucky events during theirlife, regardless of their own talent.
For a single simulation run, a working life period P of 40 years (from the age of twenty tothe age of sixty) is considered, with a time step δt equal to six months. At the beginning of thesimulation, all agents are endowed with the same amount Ci = C(0) ∀i = 1, ..., N of capital,representing their starting level of success/wealth. This choice has the evident purpose of notoffering any initial advantage to anyone. While the agents’ talent is time-independent, agents’capital changes in time. During the time evolution of the model, i.e. during the consideredagents’ life period, all event-points move randomly around the world and, in doing so, theypossibly intersect the position of some agent. More in detail, at each time each event-pointcovers a distance of 2 patches in a random direction. We say that an intersection does occurfor an individual when an event-point is present inside a circle of radius 1 patch centered onthe agent (the event-point does not disappear after the intersection). Depending on such anoccurrence, at a given time step t (i.e. every six months), there are three different possibleactions for a given agent Ak:
1. No event-point intercepts the position of agent Ak: this means that no relevant facts havehappened during the last six months; agent Ak does not perform any action.
2. A lucky event intercepts the position of agent Ak: this means that a lucky event hasoccurred during the last six month (notice that, in line with ref.[30], also the productionof an innovative idea is here considered as a lucky event occurring in the agent’s brain);
5
as a consequence, agent Ak doubles her capital/success with a probability proportional toher talent Tk. It will be Ck(t) = 2Ck(t − 1) only if rand[0, 1] < Tk, i.e. if the agent issmart enough to profit from his/her luck.
3. An unlucky event intercepts the position of agent Ak: this means that an unlucky event hasoccurred during the last six month; as a consequence, agent Ak halves her capital/success,i.e. Ck(t) = Ck(t− 1)/2.
The previous agents’ rules (including the choice of dividing by a factor of 2 the initial capitalin case of unlucky events and doubling it in case of lucky ones, proportionally to the agent’stalent), are intentionally simple and can be considered widely shareable, since they are basedon the common sense evidence that success, in everyone life, has the property to both grow ordecrease very rapidly. Furthermore, these rules gives a significant advantage to highly talentedpeople, since they can make much better use of the opportunities offered by luck (includingthe ability to exploit a good idea born in their brains). On the other hand, a car accident ora sudden desease, for example, are always unlucky events where talent plays no role. In thisrespect, we could more effectively generalise the definition of ”talent” by identifying it with ”anypersonal quality which enhances the chance to grab an opportunity”. In other words, by theterm ”talent” we broadly mean intelligence, skill, smartness, stubbornness, determination, hardwork, risk taking and so on. What we will see in the following is that the advantage of having agreat talent is a necessary, but not a sufficient, condition to reach a very high degree of success.
2.1 Single run results
In this subsection we present the results of a typical single run simulation. Actually, such resultsare very robust so, as we will show later, they can be considered largely representative of thegeneral framework emerging from our model.
Let us consider N = 1000 agents, with a starting equal amount of capital C(0) = 10 (indimensionless units) and with a fixed talent Ti ∈ [0, 1], which follows a normal distributionwith mean mT = 0.6 and standard deviation σT = 0.1 (see Figure 2). As previously written,the simulation spans a realistic time period of P = 40 years, evolving through time steps ofsix months each, for a total of I = 80 iterations. In this simulation we consider NE = 500event-points, with a percentage pL = 50% of lucky events.
At the end of the simulation, as shown in panel (a) of Figure 3, we find that the simpledynamical rules of the model are able to produce an unequal distribution of capital/success,with a large amount of poor (unsuccessful) agents and a small number of very rich (successful)ones. Plotting the same distribution in log-log scale in panel (b) of the same Figure, a Pareto-like power-law distribution is observed, whose tail is well fitted by the function y(C) ∼ C−1.27.Therefore, despite the normal distribution of talent, the TvL model seems able to capture thefirst important feature observed in the comparison with real data: the deep existing gap betweenrich and poor and its scale invariant nature. In particular, in our simulation, only 4 individualshave more than 500 units of capital and the 20 most successful individuals hold the 44% ofthe total amount of capital, while almost half of the population stay under 10 units. Globally,the Pareto’s ”80-20” rule is respected, since the 80% of the population owns only the 20% ofthe total capital, while the remaining 20% owns the 80% of the same capital. Although thisdisparity surely seems unfair, it would be to some extent acceptable if the most successful people
6
Figure 3: Final distribution of capital/success among the population, both in log-lin (a) and in log-log(b) scale. Despite the normal distribution of talent, the tail of distribution of success - as visible in panel(b) - can be well fitted with a power-law curve with slope −1.27. We also verified that the capital/successdistribution follows the Pareto’s ”80-20” rule, since 20% of the population owns 80% of the total capital,while the remaining 80% owns the 20% of the capital.
were the most talented one, so deserving to have accumulated more capital/success with respectto the others. But are things really like that?
In panels (a) and (b) of Figure 4, respectively, talent is plotted as function of the final capi-tal/success and vice-versa (notice that, in panel (a), the capital/success takes only discontinuousvalues: this is due to the choice of having used an integer initial capital equal for all the agents).Looking at both panels, it is evident that, on one hand, the most successful individuals are notthe most talented ones and, on the other hand, the most talented individuals are not the mostsuccessful ones. In particular, the most successful individual, with Cmax = 2560, has a talentT ∗ = 0.61, only slightly greater than the mean value mT = 0.6, while the most talented one(Tmax = 0.89) has a capital/success lower than 1 unit (C = 0.625).
As we will see more in detail in the next subsection, such a result is not a special case, butit is rather the rule for this kind of system: the maximum success never coincides with themaximum talent, and vice-versa. Moreover, such a misalignment between success and talentis disproportionate and highly nonlinear. In fact, the average capital of all people with talentT > T ∗ is C ∼ 20: in other words, the capital/success of the most successful individual, whois moderately gifted, is 128 times greater than the average capital/success of people who aremore talented than him. We can conclude that, if there is not an exceptional talent behind theenormous success of some people, another factor is probably at work. Our simulation clearly
7
Figure 4: In panel (a) talent is plotted as function of capital/success (in logarithmic scale for a bettervisualization): it is evident that the most successful individuals are not the most talented ones. In panel(b), vice-versa, capital/success is plotted as function of talent: here, it can be further appreciated thefact that the most successful agent, with Cmax = 2560, has a talent only slightly greater than the meanvalue mT = 0.6, while the most talented one has a capital/success lower than C = 1 unit, much less ofthe initial capital C(0). See text for further details.
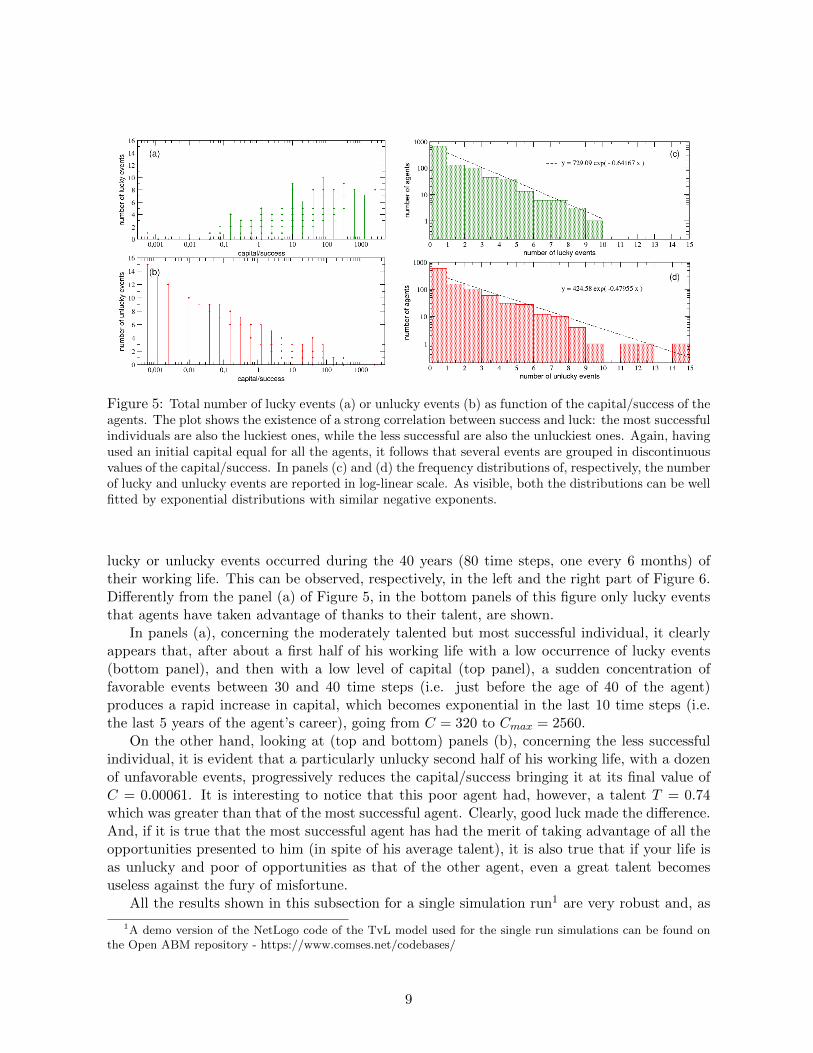
shows that such a factor is just pure luck.In Figure 5 the number of lucky and unlucky events occurred to all people during their
working lives is reported as a function of their final capital/success. Looking at panel (a), itis evident that the most successful individuals are also the luckiest ones (notice that it in thispanel are reported all the lucky events occurred to the agents and not just those that they tookadvantage of, proportionally to their talent). On the contrary, looking at panel (b), it resultsthat the less successful individuals are also the unluckiest ones. In other words, although thereis an absence of correlation between success and talent coming out of the simulations, there isalso a very strong correlation between success and luck. Analyzing the details of the frequencydistributions of the number of lucky or unlucky events occurred to individuals, we found - asshown in panels (c) and (d) - that both of them are exponential, with exponents 0.64 and 0.48,and averages 1.35 and 1.66, respectively, and that the maximum numbers of lucky or unluckyevents occurred were, respectively, 10 and 15. Moreover about 16% of people had a ”neutral” life,without lucky or unlucky events at all, while about 40% of individuals exclusively experiencedonly one type of events (lucky or unlucky).
It is also interesting to look at the time evolution of the success/capital of both the mostsuccessful individual and the less successful one, compared with the corresponding sequence of
8
Figure 5: Total number of lucky events (a) or unlucky events (b) as function of the capital/success of theagents. The plot shows the existence of a strong correlation between success and luck: the most successfulindividuals are also the luckiest ones, while the less successful are also the unluckiest ones. Again, havingused an initial capital equal for all the agents, it follows that several events are grouped in discontinuousvalues of the capital/success. In panels (c) and (d) the frequency distributions of, respectively, the numberof lucky and unlucky events are reported in log-linear scale. As visible, both the distributions can be wellfitted by exponential distributions with similar negative exponents.
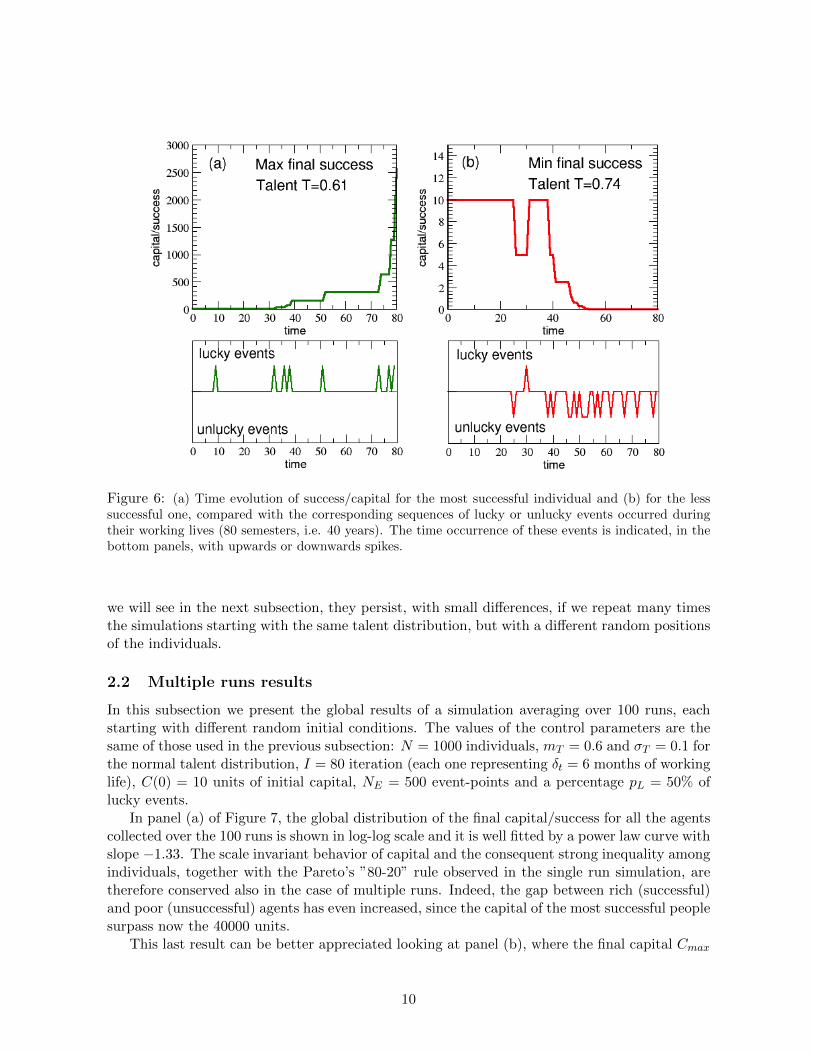
lucky or unlucky events occurred during the 40 years (80 time steps, one every 6 months) oftheir working life. This can be observed, respectively, in the left and the right part of Figure 6.Differently from the panel (a) of Figure 5, in the bottom panels of this figure only lucky eventsthat agents have taken advantage of thanks to their talent, are shown.
In panels (a), concerning the moderately talented but most successful individual, it clearlyappears that, after about a first half of his working life with a low occurrence of lucky events(bottom panel), and then with a low level of capital (top panel), a sudden concentration offavorable events between 30 and 40 time steps (i.e. just before the age of 40 of the agent)produces a rapid increase in capital, which becomes exponential in the last 10 time steps (i.e.the last 5 years of the agent’s career), going from C = 320 to Cmax = 2560.
On the other hand, looking at (top and bottom) panels (b), concerning the less successfulindividual, it is evident that a particularly unlucky second half of his working life, with a dozenof unfavorable events, progressively reduces the capital/success bringing it at its final value ofC = 0.00061. It is interesting to notice that this poor agent had, however, a talent T = 0.74which was greater than that of the most successful agent. Clearly, good luck made the difference.And, if it is true that the most successful agent has had the merit of taking advantage of all theopportunities presented to him (in spite of his average talent), it is also true that if your life isas unlucky and poor of opportunities as that of the other agent, even a great talent becomesuseless against the fury of misfortune.
All the results shown in this subsection for a single simulation run1 are very robust and, as
1A demo version of the NetLogo code of the TvL model used for the single run simulations can be found onthe Open ABM repository - https://www.comses.net/codebases/
9
Figure 6: (a) Time evolution of success/capital for the most successful individual and (b) for the lesssuccessful one, compared with the corresponding sequences of lucky or unlucky events occurred duringtheir working lives (80 semesters, i.e. 40 years). The time occurrence of these events is indicated, in thebottom panels, with upwards or downwards spikes.
we will see in the next subsection, they persist, with small differences, if we repeat many timesthe simulations starting with the same talent distribution, but with a different random positionsof the individuals.
2.2 Multiple runs results
In this subsection we present the global results of a simulation averaging over 100 runs, eachstarting with different random initial conditions. The values of the control parameters are thesame of those used in the previous subsection: N = 1000 individuals, mT = 0.6 and σT = 0.1 forthe normal talent distribution, I = 80 iteration (each one representing δt = 6 months of workinglife), C(0) = 10 units of initial capital, NE = 500 event-points and a percentage pL = 50% oflucky events.
In panel (a) of Figure 7, the global distribution of the final capital/success for all the agentscollected over the 100 runs is shown in log-log scale and it is well fitted by a power law curve withslope −1.33. The scale invariant behavior of capital and the consequent strong inequality amongindividuals, together with the Pareto’s ”80-20” rule observed in the single run simulation, aretherefore conserved also in the case of multiple runs. Indeed, the gap between rich (successful)and poor (unsuccessful) agents has even increased, since the capital of the most successful peoplesurpass now the 40000 units.
This last result can be better appreciated looking at panel (b), where the final capital Cmax
10
Figure 7: Panel (a): Distribution of the final capital/success calculated over 100 runs for a populationwith different random initial conditions. The distribution can be well fitted with a power-law curve witha slope −1.33. Panel (b): The final capital Cmax of the most successful individual in each of the 100 runsis reported as function of their talent. People with a medium-high talent result to be, on average, moresuccessful than people with low or medium-low talent, but very often the most successful individual is amoderately gifted agent and only rarely the most talented one. The mT value, together with the valuesmT ± σT , are also reported as vertical dashed and dot lines respectively.
11
Figure 8: (a) Talent distribution of the most successful individuals (best performers) in each of the 100runs. (b) Probability distribution function of talent of the most successful individuals calculated over10000 runs: it is well fitted by a normal distribution with mean 0.667 and standard deviation 0.09 (solidline). The mean mT = 0.6 of the original normal distribution of talent in the population is reported forcomparison as a vertical dashed line in both panels.
of the most successful individuals only, i.e. of the best performers for each one of the 100 runs,is reported as function of their talent. The best score was realized by an agent with a talentTbest = 0.6048, practically coinciding with the mean of the talent distribution (mT = 0.6), whoreached a peak of capital Cbest = 40960. On the other hand, the most talented among the mostsuccessful individuals, with a talent Tmax = 0.91, accumulated a capital Cmax = 2560, equal toonly 6% of Cbest.
To address this point in more detail, in Figure 8 (a) we plot the talent distribution of thebest performers calculated over 100 runs. The distribution seems to be shifted to the right of thetalent axis, with a mean value Tav = 0.66 > mT : this confirms, on one hand, that a medium-hightalent is often necessary to reach a great success; but, on the other hand, it also indicates thatit is almost never sufficient, since agents with the highest talent (e.g. with T > mT + 2σT , i.e.with T > 0.8) result to be the best performers only in 3% of cases, and their capital/successnever exceeds the 13% of Cbest.
In Figure 8 (b) the same distribution (normalized to unitary area in order to obtain a PDF)is calculated over 10000 runs, in order to appreciate its true shape: it appears to be well fittedby a Gaussian G(T ) with average Tav = 0.667 and standard deviation 0.09 (solid line). Thisdefinitely confirms that the talent distribution of the best performers is shifted to the right ofthe talent axis with respect to the original distribution of talent. More precisely, this meansthat the conditional probability P (Cmax|T ) = G(T )dT to find among the best performers anindividual with talent in the interval [T, T +dT ] increases with the talent T , reaches a maximumaround a medium-high talent Tav = 0.66, then rapidly decreases for higher values of talent. Inother words, the probability to find a moderately talented individual at the top of success ishigher than that of finding there a very talented one. Notice that, in a ideal world in whichtalent were the main cause of success, one expects P (Cmax|T ) to be an increasing function of T.Therefore, we can conclude that the observed Gaussian shape of P (Cmax|T ) is the proof that
12
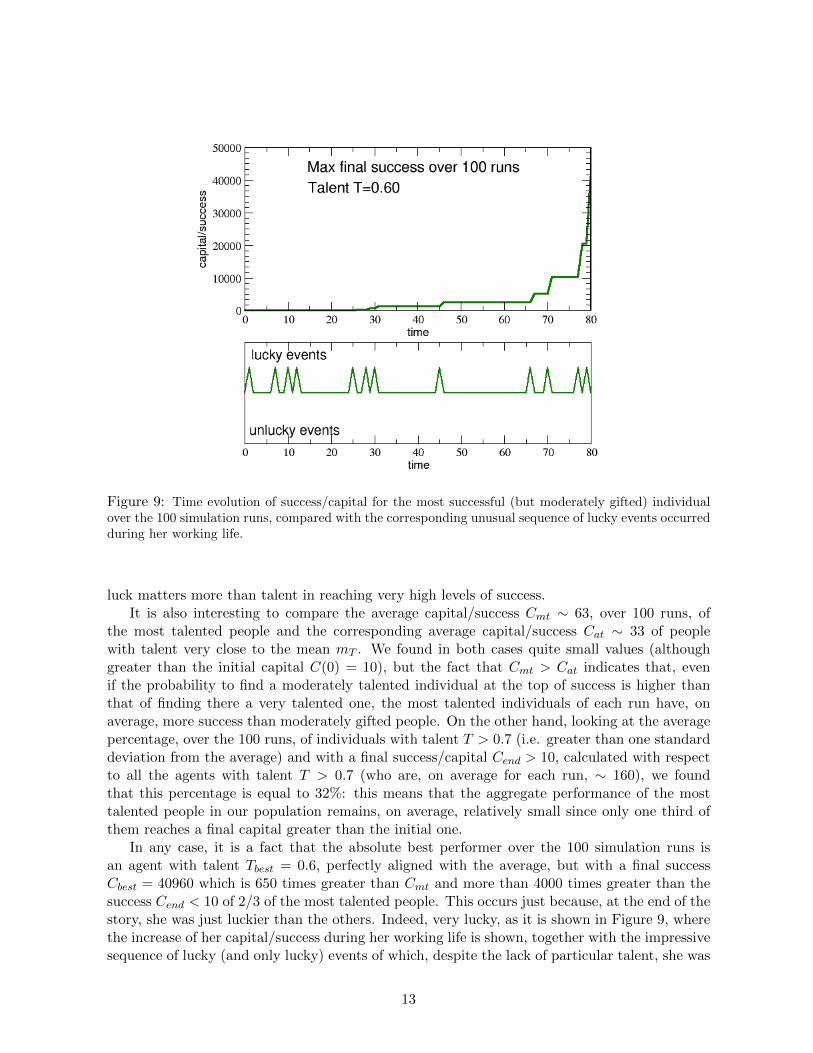
Figure 9: Time evolution of success/capital for the most successful (but moderately gifted) individualover the 100 simulation runs, compared with the corresponding unusual sequence of lucky events occurredduring her working life.
luck matters more than talent in reaching very high levels of success.It is also interesting to compare the average capital/success Cmt ∼ 63, over 100 runs, of
the most talented people and the corresponding average capital/success Cat ∼ 33 of peoplewith talent very close to the mean mT . We found in both cases quite small values (althoughgreater than the initial capital C(0) = 10), but the fact that Cmt > Cat indicates that, evenif the probability to find a moderately talented individual at the top of success is higher thanthat of finding there a very talented one, the most talented individuals of each run have, onaverage, more success than moderately gifted people. On the other hand, looking at the averagepercentage, over the 100 runs, of individuals with talent T > 0.7 (i.e. greater than one standarddeviation from the average) and with a final success/capital Cend > 10, calculated with respectto all the agents with talent T > 0.7 (who are, on average for each run, ∼ 160), we foundthat this percentage is equal to 32%: this means that the aggregate performance of the mosttalented people in our population remains, on average, relatively small since only one third ofthem reaches a final capital greater than the initial one.
In any case, it is a fact that the absolute best performer over the 100 simulation runs isan agent with talent Tbest = 0.6, perfectly aligned with the average, but with a final successCbest = 40960 which is 650 times greater than Cmt and more than 4000 times greater than thesuccess Cend < 10 of 2/3 of the most talented people. This occurs just because, at the end of thestory, she was just luckier than the others. Indeed, very lucky, as it is shown in Figure 9, wherethe increase of her capital/success during her working life is shown, together with the impressivesequence of lucky (and only lucky) events of which, despite the lack of particular talent, she was
13
able to take advantage of during her career.Summarizing, what has been found up to now is that, in spite of its simplicity, the TvL model
seems able to account for many of the features characterizing, as discussed in the introduction,the largely unequal distribution of richness and success in our society, in evident contrast withthe Gaussian distribution of talent among human beings. At the same time, the model shows, inquantitative terms, that a great talent is not sufficient to guarantee a successful career and that,instead, less talented people are very often able to reach the top of success - another ”stylisedfact” frequently observed real life [35, 36, 38].
The key point, which intuitively explains how it may happen that moderately gifted indi-viduals achieve (so often) far greater honors and success than much more talented ones, is thehidden and often underestimated role of luck, as resulting from our simulations. But to under-stand the real meaning of our findings it is important to distinguish the macro from the micropoint of view.
In fact, from the micro point of view, following the dynamical rules of the TvL model, atalented individual has a greater a priori probability to reach a high level of success than amoderately gifted one, since she has a greater ability to grasp any opportunity will come. Ofcourse, luck has to help her in yielding those opportunities. Therefore, from the point of view ofa single individual, we should therefore conclude that, being impossible (by definition) to controlthe occurrence of lucky events, the best strategy to increase the probability of success (at anytalent level) is to broaden the personal activity, the production of ideas, the communicationwith other people, seeking for diversity and mutual enrichment. In other words, to be an open-minded person, ready to be in contact with others, exposes to the highest probability of luckyevents (to be exploited by means of the personal talent).
On the other hand, from the macro point of view of the entire society, the probability to findmoderately gifted individuals at the top levels of success is greater than that of finding therevery talented ones, because moderately gifted people are much more numerous and, with thehelp of luck, have - globally - a statistical advantage to reach a great success, in spite of theirlower individual a priori probability.
In the next section we will address such a macro point of view, by exploring the possibilitiesoffered by our model to investigate in detail new and more efficient strategies and policies toimprove the average performance of the most talented people in a population, implementing moreefficient ways of distributing prizes and resources. In fact, being the most talented individualsthe engine of progress and innovation in our society, we expect that any policy able to improvetheir level of success will have a beneficial effect on the collectivity.
3 Effective strategies to counterbalance luck
The results presented in the previous section are strongly consistent with largely documentedempirical evidences, discussed in the introduction, which firmly question the naively meritocraticassumption claiming that the natural differences in talent, skill, competence, intelligence, hardwork or determination are the only causes of success. As we have shown, luck also matters and itcan play a very important role. The interpretative point is that, being individual qualities diffi-cult to be measured (in many cases hardly defined in rigorous terms), the meritocratic strategiesused to assign honors, funds or rewards are often based on individual performances, valued interms of personal wealth or success. Eventually, such strategies exert a further reinforcing action
14
and pump up the wealth/success of the luckiest individuals through a positive feedback mech-anism, which resembles the famous ”rich get richer” process (also known as ”Matthew effect”[57, 58, 59]), with an unfair final result.
Let us consider, for instance, a publicly-funded research granting council with a fixed amountof money at its disposal. In order to increase the average impact of research, is it more effectiveto give large grants to a few apparently excellent researchers, or small grants to many moreapparently ordinary researchers? A recent study [44], based on the analysis of four indicesof scientific impact involving publications, found that impact is positively, but only weakly,related to funding. In particular, impact per dollar was lower for large grant-holders and theimpact of researchers who received increases in funding did not increase in a significant way.The authors of the study conclude that scientific impact (as reflected by publications) is onlyweakly limited by funding and suggest that funding strategies targeting diversification of ideas,rather than ”excellence”, are likely to be more productive. A more recent contribution [60]showed that, both in terms of the quantity of papers produced and of their scientific impact, theconcentration of research funding generally produces diminishing marginal returns and also thatthe most funded researchers do not stand out in terms of output and scientific impact. Actually,such conclusions should not be a surprise in the light of the other recent finding [18] that impact,as measured by influential publications, is randomly distributed within a scientist’s temporalsequence of publications. In other words, if luck matters, and if it matters more than we arewilling to admit, it is not strange that meritocratic strategies reveal less effective than expected,in particular if we try to evaluate merit ex-post. In previous studies [48, 49, 50, 51, 52, 53, 54, 55],there was already a warning against this sort of ”naive meritocracy”, showing the effectiveness ofalternative strategies based on random choices in management, politics and finance. Consistentlywith such a perspective, the TvL model shows how the minimum level of success of the mosttalented people can be increased, in a world where luck is important and serendipity is oftenthe cause of important discoveries.
3.1 Serendipity, innovation and efficient funding strategies
The term ”serendipity” is commonly used in the literature to refer to the historical evidencethat very often researchers make unexpected and beneficial discoveries by chance, while theyare looking for something else [61, 62]. There is a long anecdotal list of discoveries made justby lucky opportunities: from penicillin by Alexander Fleming to radioactivity by Marie Curie,from cosmic microwave background radiation by radio astronomers Arno Penzias and RobertWoodrow Wilson to the graphene by Andre Geim and Kostya Novoselov. Just to give a veryrecent example, a network of fluid-filled channels in the human body, that may be a previously-unknown organ and that seems to help transport cancer cells around the body, was discoveredby chance, from routine endoscopies [63].Therefore, many people think that curiosity-drivenresearch should always be funded, because nobody can really know or predict where it can leadto [64].
Is it possible to quantify the role of serendipity? Which are the most efficient ways tostimulate serendipity? Serendipity can take on many forms, and it is difficult to constrain andquantify. That is why, so far, academic research has focused on serendipity in science mainly as aphilosophical idea. But things are changing. The European Research Council has recently givento the biochemist Ohid Yaqub a 1.7 million US dollars grant to quantify the role of serendipityin science [65]. Yaqub found that it is possible to classify serendipity into four basic types [66]
15
and that there may be important factors affecting its occurrence. His conclusions seem to agreewith ideas developed in earlier works [67, 68, 69, 70, 71, 72] which argues that the commonlyadopted - apparently meritocratic - strategies, which pursuit excellence and drive out variety,seem destined to be loosing and inefficient. The reason is that they cut out a priori researchesthat initially appear less promising but that, thanks also to serendipity, could be extremelyinnovative a posteriori.
From this perspective, we want to use the TvL model, which naturally incorporates luck(and therefore also serendipity) as a quantitative tool for policy, in order to explore, in thissubsection, the effectiveness of different funding scenarios. In particular, in contexts where,as above discussed, averagely-talented-but-lucky people are often more successful than more-gifted-but-unlucky individuals, it is important to evaluate the efficiency of funding strategies inpreserving a minimum level of success also for the most talented people, who are expected toproduce the most progressive and innovative ideas.
Starting from the same parameters setup used in subsection 2.2, i.e.N = 1000, mT = 0.6,σT = 0.1, I = 80, δt = 6, C(0) = 10, NE = 500, pL = 50% and 100 simulation runs, letus imagine that a given total funding capital FT is periodically distributed among individualsfollowing different criteria. For example, funds could be assigned:
1. in equal measure to all (egalitarian criterion), in order to foster research diversification;
2. only to a given percentage of the most successful (”best”) individuals (elitarian criterion),which has been previously referred to ”naively” meritocratic, for it distributes funds topeople according to their past performance;
3. by distributing a ”premium” to a given percentage of the most successful individuals andthe remaining amount in smaller equal parts to all the others (mixed criterion);
4. only to a given percentage individuals, randomly selected (selective random criterion);
We realistically assume that the total capital FT will be distributed every 5 years, during the40 years spanned by each simulation run, so that FT /8 units of capital will be allocated fromtime to time. Thanks to the periodic injection of these funds, we intend to maintain a minimumlevel of resources for the most talented agents. Therefore, a good indicator, for the effectivenessof the adopted funding strategy, could be the percentage PT , averaged over the 100 simulationruns, of individuals with talent T > mT + σT whose final success/capital is greater than theinitial one, i.e. Cend > C(0).
This percentage has already been calculated, in the multiple runs simulation presented insection 2.2. There, we have shown that, in absence of funding, the best performance was scoredby very lucky agents with a talent close to the mean, while the capital/success of the mosttalented people always remained very low. In particular, only a percentage PT0 ∼ 32% of thetotal number of agents with T > 0.7 reached, at the end of the simulation, a capital/successgreater then the initial one. Hence, in order to compare the efficiency of different fundingstrategies, the increment in the average percentage PT of talented people which, during theircareer, increase their initial capital/success should be calculated with respect to PT0. Let usdefine this increment as P ∗T = PT −PT0. The latter quantity is a very robust indicator: we havechecked that repeating the set of 100 simulations, the variation in the value of P ∗T remains under2%. Finally, if one considers the ratio between P ∗T and the total capital FT distributed among
16
Figure 10: Funding strategies Table. The outcomes of the normalized efficiency index Enorm are reported(2nd column) in decreasing order, from top to bottom, for several funding distribution strategies withdifferent targets (1st column). The corresponding values of both the percentage PT of successful talentedpeople and its net increase P ∗
T with respect to the ”no funding” case, averaged over the 100 simulationruns, are also reported in the third and fourth columns respectively. Finally, the total capital FT investedin each run, is visible in the last column.
all the agents during the 40 years, it is possible to obtain an efficiency index E, which quantifiesthe increment of sufficiently successful talented people per unit of invested capital, defined asE = P ∗T /FT .
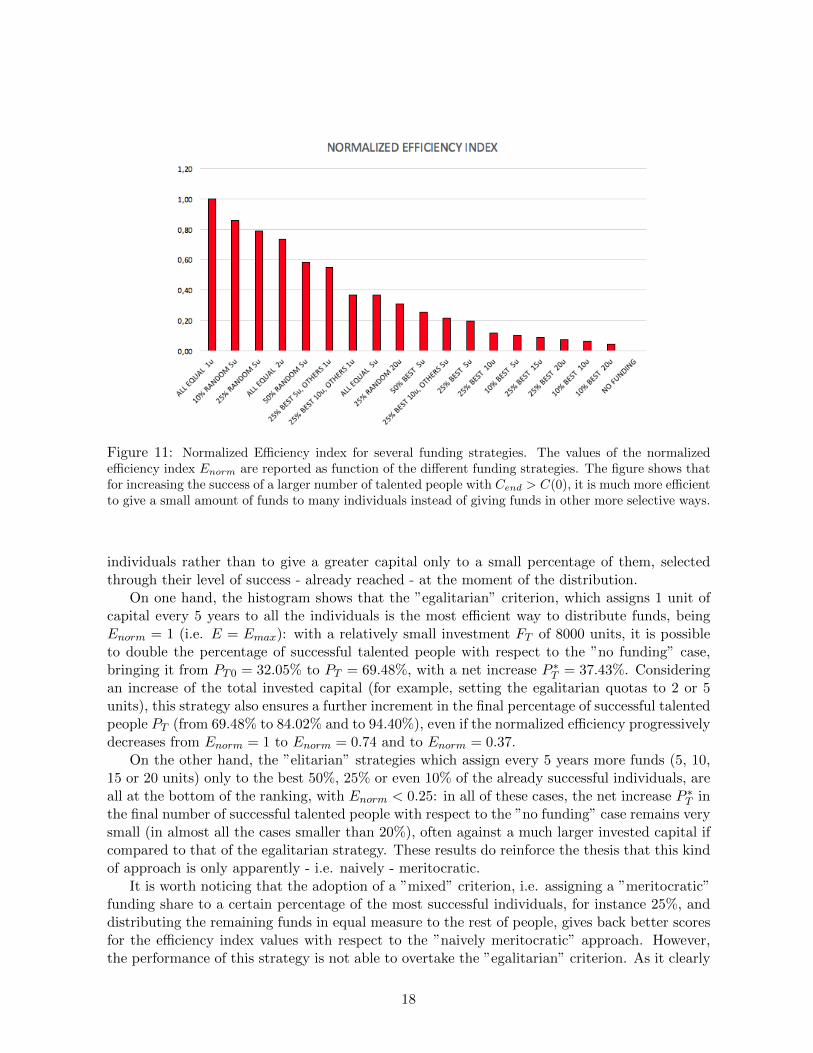
In the table shown in Figure 10, we report the efficiency index (2nd column) obtained forseveral funding distribution strategies, each one with a different funding target (1st column),together with the corresponding values of PT (3rd column) and P ∗T (4th column). The totalcapital FT invested in each run is also reported in the last column. The efficiency index Ehas been normalized to its maximum value Emax and the various records (rows) have beenordered for decreasing values of Enorm = E/Emax. For the no funding case, by definition,Enorm = 0. The same scores for Enorm are also reported in the form of a histogram in Figure11, as a function of the adopted funding strategies. Thanks to the statistical robustness of PT ,which shows fluctuations smaller than 2%, the results reported for the efficiency index Enorm
are particularly stable.Looking at the table and at the relative histogram of Figure 11, it is evident that, if the
goal is to reward the most talented persons (thus increasing their final level of success), it ismuch more convenient to distribute periodically (even small) equal amounts of capital to all
17
Figure 11: Normalized Efficiency index for several funding strategies. The values of the normalizedefficiency index Enorm are reported as function of the different funding strategies. The figure shows thatfor increasing the success of a larger number of talented people with Cend > C(0), it is much more efficientto give a small amount of funds to many individuals instead of giving funds in other more selective ways.
individuals rather than to give a greater capital only to a small percentage of them, selectedthrough their level of success - already reached - at the moment of the distribution.
On one hand, the histogram shows that the ”egalitarian” criterion, which assigns 1 unit ofcapital every 5 years to all the individuals is the most efficient way to distribute funds, beingEnorm = 1 (i.e. E = Emax): with a relatively small investment FT of 8000 units, it is possibleto double the percentage of successful talented people with respect to the ”no funding” case,bringing it from PT0 = 32.05% to PT = 69.48%, with a net increase P ∗T = 37.43%. Consideringan increase of the total invested capital (for example, setting the egalitarian quotas to 2 or 5units), this strategy also ensures a further increment in the final percentage of successful talentedpeople PT (from 69.48% to 84.02% and to 94.40%), even if the normalized efficiency progressivelydecreases from Enorm = 1 to Enorm = 0.74 and to Enorm = 0.37.
On the other hand, the ”elitarian” strategies which assign every 5 years more funds (5, 10,15 or 20 units) only to the best 50%, 25% or even 10% of the already successful individuals, areall at the bottom of the ranking, with Enorm < 0.25: in all of these cases, the net increase P ∗T inthe final number of successful talented people with respect to the ”no funding” case remains verysmall (in almost all the cases smaller than 20%), often against a much larger invested capital ifcompared to that of the egalitarian strategy. These results do reinforce the thesis that this kindof approach is only apparently - i.e. naively - meritocratic.
It is worth noticing that the adoption of a ”mixed” criterion, i.e. assigning a ”meritocratic”funding share to a certain percentage of the most successful individuals, for instance 25%, anddistributing the remaining funds in equal measure to the rest of people, gives back better scoresfor the efficiency index values with respect to the ”naively meritocratic” approach. However,the performance of this strategy is not able to overtake the ”egalitarian” criterion. As it clearly
18
Figure 12: Funding strategies Table with fixed funds. The outcomes of the normalized efficiency indexEnorm are reported again in decreasing order, from top to bottom, for several funding distributionstrategies with different targets (1st column). At variance with Fig. 10, now the total capital invested ineach run was fixed to FT = 80000. The egalitarian strategy is, again, at the top of the ranking.
appears - for example - by the comparison between the sixth and the fourth rows of the fundingtable, in spite of the same overall investment of 16000 units, the value of PT obtained withthe mixed criterion stays well below the one obtained with the egalitarian approach (70.83%against 84.02%), as also confirmed by the values of the corresponding efficiency index Enorm
(0.55 against 0.74).If one considers psychological factors (not modeled in this study), a mixed strategy could
be revalued with respect to the egalitarian one. Indeed, the premium reward - assigned tothe more successful individuals - could induce all agents towards a greater commitment, whilethe equally distributed part would play a twofold role: at the individual level, it would actin fostering variety and providing unlucky talented people with new chances to express theirpotential, while feeding serendipity at the aggregate level, thus contributing to the progress ofresearch and of the whole society.
Looking again at the funding strategy table, it is also worthwhile to stress the surprising highefficiency of the random strategies, which occupy two out of the three best scores in the generalranking. It results that, for example, a periodic reward of 5 units for only the 10% of randomlyselected individuals, with a total investment of just 4000 units, gives a net increase P ∗T = 17, 78%,which is greater than almost all those obtained with the elitarian strategies. Furthermore,increasing to 25% the percentage of randomly funded people and doubling the overall investment(bringing it to 10000 units), the net increase P ∗T = 35.95% becomes comparable to that obtainedwith the best egalitarian strategy, first in the efficiency ranking. It is striking to notice that thislatter score for P ∗T is approximately four times grater than the value (P ∗T = 9.03%) obtained withthe elitarian approach (see 12th row in the table), distributing exactly the same capital (10000units) to exactly the same number of individuals (25% of the total). The latter is a furtherconfirmation that, in complex social and economical contexts where chance plays a relevantrole, the efficiency of alternative strategies based on random choices can easily overtake thatof standard strategies based on the ”naively meritocratic” approach. Such a counterintuitivephenomenon, already observed in management, politics and finance ([48, 49, 50, 51, 52, 53, 54,55]), finds therefore new evidence also in the research funding context.
To further corroborate these findings, in Figure 12, the results of another set of simulations
19
are presented. At variance with the previous simulations, the total capital invested in each oneof the 100 runs is now fixed to FT = 80000, so that FT /8 = 10000 units are distributed every5 years among the agents following the main funding strategies already considered. Looking atthe table, the egalitarian strategy results again the most efficient in rewarding the most talentedpeople, with a percentage PT close to 100%, immediately followed by the random strategy (with50% of randomly funded individuals) and by the mixed one, with half of the capital distributed tothe 25% of the most successful individuals and the other half in equal measure to the remainingpeople. On the contrary, all the elitarian strategies are placed again at the bottom of the ranking,thus further confirming the inefficiency of the ”naively meritocratic” approach in rewarding realtalent.
The results of the TvL model simulations presented in this subsection, have focused on theimportance of external factors (as, indeed, efficient funding policies) in increasing the opportu-nities of success for the most talented individuals, too often penalized by unlucky events. In thenext subsection we investigate to what extent new opportunities can be originated by changesin the environment as for example the level of education or other stimuli received by the socialcontext where people live or come from.
3.2 The importance of the environment
First, let us estimate the role of the average level of education among the population. Within theTvL model, the latter could be obtained by changing the parameters of the normal distributionof talent. Actually, assuming that talent and skills of individuals, if stimulated, could be moreeffective in exploiting new opportunities, an increase in either the mean mT or the standarddeviation σT of the talent distribution could be interpreted as the effect of policies targeted,respectively, either at raising the average level of education or at reinforcing the training of themost gifted people.
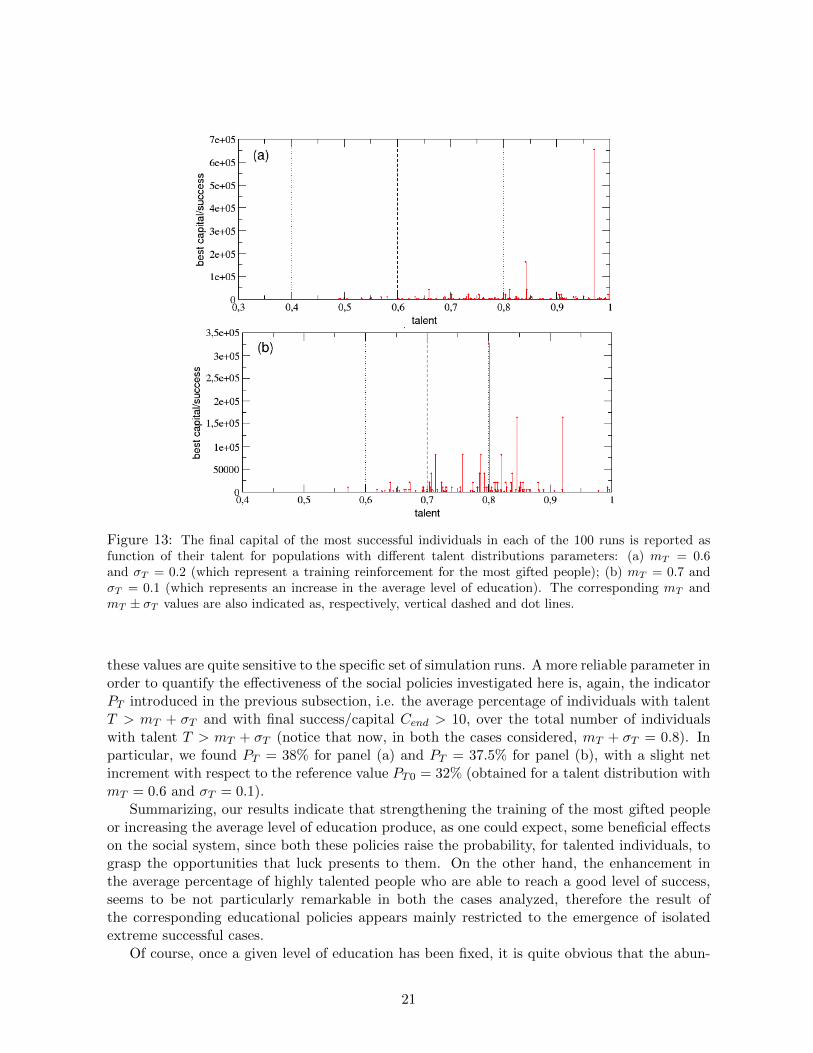
In the two panels of Figure 13 we report the final capital/success accumulated by the bestperformers in each of the 100 runs, as function of their talent. The parameters setup is the samethan in subsection 2.2 (N = 1000, I = 80, δt = 6, C(0) = 10, NE = 500 and pL = 50%) butwith different moments for the talent distributions. In particular, in panel (a) we left unchangedmT = 0.6 but increased σT = 0.2, while in panel (b) we made the opposite, leaving σT = 0.1but increasing mT = 0.7. In both cases, a shift on the right of the maximum success peaks canbe appreciated, but with different details.
Actually, it results that increasing σT without changing mT , as shown in panel (a), enhancesthe chances for more talented people to get a very high success: the best performer is, now, a verytalented agent with T = 0.97, who reaches an incredible level of capital/success Cbest = 655360.This, on one hand, could be considered positive but, on the other hand, it is an isolated caseand it has, as a counterpart, an increase in the gap between unsuccessful and successful people.
Looking now at panel (b), it results that increasing mT without changing σT produces a bestperformer, with Cbest = 327680 and a talent T = 0.8, followed by other two with C = 163840and, respectively, T = 0.85 and T = 0.92. This means that also in this case the chances for moretalented people to get a very high success are enhanced, while the gap between unsuccessful andsuccessful people is lower than before.
Finally, in both considered examples, the average value of the capital/success for the mosttalented people over the 100 runs is increased with respect to the value Cmt ∼ 63 found insubsection 2.2. In particular, we found Cmt ∼ 319 for panel (a) and Cmt ∼ 122 for panel (b), but
20
Figure 13: The final capital of the most successful individuals in each of the 100 runs is reported asfunction of their talent for populations with different talent distributions parameters: (a) mT = 0.6and σT = 0.2 (which represent a training reinforcement for the most gifted people); (b) mT = 0.7 andσT = 0.1 (which represents an increase in the average level of education). The corresponding mT andmT ± σT values are also indicated as, respectively, vertical dashed and dot lines.
these values are quite sensitive to the specific set of simulation runs. A more reliable parameter inorder to quantify the effectiveness of the social policies investigated here is, again, the indicatorPT introduced in the previous subsection, i.e. the average percentage of individuals with talentT > mT + σT and with final success/capital Cend > 10, over the total number of individualswith talent T > mT + σT (notice that now, in both the cases considered, mT + σT = 0.8). Inparticular, we found PT = 38% for panel (a) and PT = 37.5% for panel (b), with a slight netincrement with respect to the reference value PT0 = 32% (obtained for a talent distribution withmT = 0.6 and σT = 0.1).
Summarizing, our results indicate that strengthening the training of the most gifted peopleor increasing the average level of education produce, as one could expect, some beneficial effectson the social system, since both these policies raise the probability, for talented individuals, tograsp the opportunities that luck presents to them. On the other hand, the enhancement inthe average percentage of highly talented people who are able to reach a good level of success,seems to be not particularly remarkable in both the cases analyzed, therefore the result ofthe corresponding educational policies appears mainly restricted to the emergence of isolatedextreme successful cases.
Of course, once a given level of education has been fixed, it is quite obvious that the abun-
21
Figure 14: The final capital of the most successful individuals in each of the 100 runs is reported asfunction of their talent, for populations living in environments with a different percentage pL of luckyevents: (a) pL = 80%; (b) pL = 20%. The values of mT = 0.6 and mT ± σT , with σT = 0.1 are alsoindicated as, respectively, vertical dashed and dot lines.
dance of opportunities offered by the social environment, i.e. by the country where someoneaccidentally is born or where someone choose to live, it is another key ingredient able to influencethe global performance of the system.
In Figure 14 we show results analogous to those shown in the previous figure, but for anotherset of simulations, with 100 runs each, with the same parameters setup as in subsection 2.2(N = 1000, mT = 0.6, σT = 0.1, I = 80, C(0) = 10, NE = 500) and with different percentagespL of lucky events (we remind that, in subsection 2.2., this percentage was set to pL = 50%).In panels (a) we set pL = 80%, in order to simulate a very stimulating environment, richof opportunities, like that of rich and industrialized countries such as the U.S. [26]. On theother hand, in panels (b), the value pL = 20% reproduces the case of a much less stimulatingenvironment, with very few opportunities, like for instance that of Third World countries.
As visible in both panels, the final success/capital of the most successful individuals asfunction of their talent strongly depend on pL.
When pL = 80%, as in panel (a), several agents with medium-high talent are able to reachhigher levels of success compared to the case pL = 50%, with a peak of Cbest = 163840. On theother hand, the average value of the capital/success for the most talented individuals, Cmt ∼ 149,is quite high and, what is more important, the same holds for the indicator PT = 62.18% (abouttwice with respect to the reference value PT0 = 32%), meaning that, as expected, talented people
22
benefits of the higher percentage of lucky events.Completely different outcomes are obtained with pL = 20%. Indeed, as visible in panel (b),
the overall level of success is now very low, if compared to that found in the simulations ofsubsection 2.2, with a peak value Cbest of only 5120 units: it is a footprint of a reduction in thesocial inequalities, which is an expected consequence of the flattening of success opportunities.According with these results, also the PT indicator reaches a minimal value, with an averagepercentage of only 8.75% of talented individuals able to increase their initial level of success.
In conclusion, in this section we have shown that a stimulating environment, rich of op-portunities, associated to an appropriate strategy for the distribution of funds and resources,are important factors in exploiting the potential of the most talented people, giving them morechances of success with respect to the moderately gifted, but luckier, ones. At the macro level,any policy able to influence those factors and to sustain talented individuals, will have the resultof ensuring collective progress and innovation.
4 Conclusive remarks
In this paper, starting from few very simple and reasonable assumptions, we have presented anagent-based model which is able to quantify the role of talent and luck in the success of people’scareers. The simulations show that although talent has a Gaussian distribution among agents,the resulting distribution of success/capital after a working life of 40 years, follows a power lawwhich respects the ”80-20” Pareto law for the distribution of wealth found in the real world.An important result of the simulations is that the most successful agents are almost never themost talented ones, but those around the average of the Gaussian talent distribution - anotherstylised fact often reported in the literature. The model shows the importance, very frequentlyunderestimated, of lucky events in determining the final level of individual success. Since rewardsand resources are usually given to those that have already reached a high level of success,mistakenly considered as a measure of competence/talent, this result is even a more harmfuldisincentive, causing a lack of opportunities for the most talented ones. Our results highlight therisks of the paradigm that we call ”naive meritocracy”, which fails to give honors and rewardsto the most competent people, because it underestimates the role of randomness among thedeterminants of success. In this respect, several different scenarios have been investigated inorder to discuss more efficient strategies, which are able to counterbalance the unpredictablerole of luck and give more opportunities and resources to the most talented ones - a purposethat should be the main aim of a truly meritocratic approach. Such strategies have also beenshown to be the most beneficial for the entire society, since they tend to increase the diversityof ideas and perspectives in research, thus fostering also innovation.
Acknowlegments
We would like to thank Robert H. Frank, Pawel Sobkowicz and Constantino Tsallis for fruitfuldiscussions and comments.
23
References
[1] Bak, P., Tang, C. and Wiesenfeld, K., Self-organized criticality. Phys. Rev. A, 38:364–374(1988).
[2] Barabasi, A.-L., Albert, R., Emergence of Scaling in Random Networks, Science, Vol. 286,Issue 5439, pp. 509–512 (1999).
[3] Newman, M. E. J., Power laws, Pareto distributions and Zipf ’s law, Contemporary Physics,46 (5): 323–351 (2005).
[4] Tsallis, C., Introduction to Nonextensive Statistical Mechanics. Approaching a ComplexWorld, Springer (2009).
[5] Pareto, V., Cours d’Economique Politique, vol. 2 (1897).
[6] Steindl, J., Random Processes and the Growth of Firms - A Study of the Pareto Law,Charles Griffin and Company, London (1965).
[7] Atkinson, A. B., Harrison, A. J., Distribution of Total Wealth in Britain, Cambridge Uni-versity Press, Cambridge (1978).
[9] Klass, O. S., Biham, O., Levy, M., Malcai, O., Solomon, S., The Forbes 400 and the Paretowealth distribution, Economics Letters 90, 290–295 (2006).
[10] Hardoon, D., An economy for the 99%, Oxfam GB, Oxfam House, John Smith Drive,Cowley, Oxford, OX4 2JY, UK (January 2017).
[11] Bouchaud, J.-P., Mezard, M., Wealth condensation in a simple model of economy, PhysicaA 282, 536–54 (2000).
[12] Dragulescu, A. and Yakovenko, V. M., Statistical mechanics of money, Eur. Phys. J. B 17,723–729 (2000).
[13] Chakraborti, A. and Chakrabarti, B. K., Statistical mechanics of money: how savingpropensity affects its distribution, Eur. Phys. J. B 17, 167–170 (2000).
[14] Patriarca, M., Chakraborti, A., Germano, G., Influence of saving propensity on the powerlaw tail of wealth distribution, Physica A 369(2), 723–736 (2006).
[15] Scalas, E., Random exchange models and the distribution of wealth. European PhysicalJournal - Special Topics, 225. pp. 3293-3298. ISSN 1951–6355 (2016).
[16] During, B., Georgiou, N. and Scalas, E., A stylised model for wealth distribution. In Akura,Yuji and Kirman, Alan (eds.) Economic Foundations of Social Complexity Science. SpringerSingapore, Singapore, pp. 95–117. ISBN 9789811057045 (2017).
[17] During, Bertram, Georgiou, Nicos and Scalas, Enrico (2017) A stylised model for wealthdistribution. In: Akura, Yuji and Kirman, Alan (eds.) Economic Foundations of SocialComplexity Science. Springer Singapore, Singapore, pp. 95-117. ISBN 9789811057045
24
[18] Sinatra, R., Wang, D., Deville, P., Song, C. and Barabasi, A.-L., Quantifying the evolutionof individual scientific impact, Science 354, 6312 (2016).
[19] Einav, L. and Yariv, L., What’s in a Surname? The Effects of Surname Initials on AcademicSuccess, Journal of Economic Perspective, Vol. 20, n. 1, p.175–188 (2006).
[20] Ruocco, G., Daraio, C., Folli, V. and Leonetti, M., Bibliometric indicators: the origin oftheir log-normal distribution and why they are not a reliable proxy for an individual scholar’stalent, Palgrave Communications 3:17064 doi: 10.1057/palcomms.2017.64 (2017).
[21] Jurajda, S., Munich, D., Admission to Selective Schools, Alphabetically, Economics of Ed-ucation Review, Vol. 29, n. 6, p.1100–1109 (2010).
[22] Van Tilburg, W. A. P., Igou, E. R., The impact of middle names: Middle name initialsenhance evaluations of intellectual performance, European Journal of Social Psychology,Vol. 44, Issue 4, p.400–411 (2014).
[23] Laham, S. M., Koval, P., Alter, A. L., The name-pronunciation effect: Why people like Mr.Smith more than Mr. Colquhoun, Journal of Experimental Social Psychology 48, p.752–756(2012).
[24] Silberzahn, R., Uhlmann, E. L., It Pays to be Herr Kaiser: Germans with Noble-SoundingLast Names More Often Work as Managers, Psychological Science 24(12): 2437–44 (2013).
[25] Coffey, B. and McLaughlin, P., From Lawyer to Judge: Advancement, Sex, and Name-Calling. SSRN Electronic Journal, DOI10.2139/ssrn.1348280 (2009).
[26] Milanovic, B., Global Inequality of Opportunity: How Much of Our Income Is Determinedby Where We Live?, Review of Economics and Statistics, 97.2 (2015): 452–60.
[27] Du, Q., Gao, H., Levi, M. D., The relative-age effect and career success: Evidence fromcorporate CEOs, Economics Letters 117(3):660–662 (2012).
[28] Deaner, R. O., Lowen, A., Cobley, S., Born at the Wrong Time: Selection Bias in the NHLDraft. PLoS ONE 8(2): e57753 (2013).
[29] Brooks, D., The Social Animal. The Hidden Sources of Love, Character, and Achievement,Random House, 424 pp. (2011).
[30] Iacopini, I., Milojevic, S. and Latora, V., Network Dynamics of Innovation Processes, Phys-ical Review Letters 120, 048301 (2018).
[31] Tomasetti, C., Li, L., Vogelstein, B., Stem cell divisions, somatic mutations, cancer etiology,and cancer prevention, Science 355, 1330–1334 (2017).
[32] Newgreen, D. F. et al., Differential Clonal Expansion in an Invading Cell Population: ClonalAdvantage or Dumb Luck?, Cells Tissues Organs 203:105–113 (2017).
[33] Snyder, R. E. and Ellner, S. P., We Happy Few: Using Structured Population Models toIdentify the Decisive Events in the Lives of Exceptional Individuals, The American Natu-ralist 188, no. 2 (2016): E28–E45.
25
[34] Snyder, R. E. and Ellner, S. P., Pluck or Luck: Does Trait Variation or Chance DriveVariation in Lifetime Reproductive Success?, The American Naturalist 191, no. 4 (2018):E90–E107.
[35] Taleb, N. N., Fooled by Randomness: The Hidden Role of Chance in Life and in the Markets,London, TEXERE (2001).
[36] Taleb, N. N., The Black Swan: The Impact of the Highly Improbable, Random House (2007).
[37] Mauboussin, M. J., The Success Equation: Untangling Skill and Luck in Business, Sports,and Investing, Harvard Business Review Press (2012).
[38] Frank, R. H., Success and Luck: Good Fortune and the Myth of Meritocracy, PrincetonUniversity Press, Princeton, New Jersey (2016).
[39] Watts, D. J., Everything Is Obvious: Once You Know the Answer, Crown Business (2011).
[40] Salganik, M. J., Dodds P. S., Watts D. J., Experimental Study of Inequality and Unpre-dictability in an Artificial Cultural Market, Science Vol.311 (2006)
[41] Travis, M., Hofman, J. M., Sharma, A., Anderson,. A., Watts, D. J., Exploring limits toprediction in complex social systems, Proceedings of the 25th ACM International WorldWide Web Conference (2016) arXiv:1602.01013 [cs.SI]
[42] Stewart, J. , The Distribution of Talent, Marilyn Zurmuehlin Working Papers in Art Edu-cation 2: 21-22 (1983).
[43] Sinha, S. and Pan, R. K., How a ”Hit” is Born: The Emergence of Popularity from theDynamics of Collective Choice, In Econophysics and Sociophysics: Trends and Perspectives(eds B. K. Chakrabarti, A. Chakraborti and A. Chatterjee), Wiley-VCH Verlag GmbH &Co. KGaA, Weinheim, Germany. doi: 10.1002/9783527610006.ch15 (2006).
[44] Fortin, J.-M., Curr, D. J., Big Science vs. Little Science: How Scientific Impact Scales withFunding, PLoS ONE 8(6): e65263 (2013).
[45] Jacob, B. A., Lefgren, L., The impact of research grant funding on scientific productivity,Journal of Public Economics 95 (2011) 1168–1177.
[46] O’Boyle, JR. E. and Aguinis, H., The Best and the Rest: revisiting the norm of nor-mality of individual performance, Personnel Psychology, 65: 79-119. doi:10.1111/j.1744-6570.2011.01239.x (2012).
[47] Denrell, J. and Liu, C., Top performers are not the most impressive when extreme perfor-mance indicates unreliability, Proceedings of the National Academy of Sciences, 109(24):9331–9336 (2012).
[48] Pluchino, A., Rapisarda, A., and Garofalo, C., The Peter principle revisited: A computa-tional study, Physica A 389(3):467–472 (2010).
[49] Pluchino, A., Garofalo, C., Rapisarda, A., Spagano, S. and Caserta, M., Accidental politi-cians: How randomly selected legislators can improve parliament efficiency, Physica A390(21):3944–3954 (2011).
[50] Pluchino, A., Rapisarda, A. and Garofalo, C., Efficient promotion strategies in hierarchicalorganizations, Physica A 390(20):3496–3511 (2011).
[51] Biondo, A. E., Pluchino, A., Rapisarda, A., Helbing, D., Reducing financial avalanches byrandom investments, Phys. Rev. E 88(6):062814 (2013).
[52] Biondo, A. E., Pluchino, A., Rapisarda, A., Helbing, D., Are random trading strategiesmore successful than technical ones, PLoS One 8(7):e68344 (2013)
[53] Biondo, A. E., Pluchino, A., Rapisarda, A., The beneficial role of random strategies in socialand financial systems, J. Stat. Phys. 151(3-4):607–622 (2013).
[54] Biondo, A. E., Pluchino, A., Rapisarda, A., Micro and macro benefits of random investmentsin financial markets, Cont. Phys. 55(4):318–334 (2014).
[55] Biondo, A. E., Pluchino, A., Rapisarda, A., Modeling financial markets by self-organizedcriticality, Phys. Rev. E 92(4):042814 (2015).
[56] Wilensky, U., NetLogo. http://ccl.northwestern.edu/netlogo/. Center for Connected Learn-ing and Computer-Based Modeling, Northwestern University, Evanston, IL (1999).
[57] Merton, R. K., The Matthew effect in science, Science 159, 56-63 (1968).
[58] Merton, R. K.,The Matthew effect in science, II: Cumulative advantage and the symbolismof intellectual property, Isis: A Journal of the History of Science 79, 606–623 (1988).
[59] Bol, T., de Vaan, M. and van de Rijt, A., The Matthew effect in science funding, Proceedingsof the National Academy of Sciences, DOI: 10.1073/pnas.1719557115 (2018).
[60] Mongeon, P., Brodeur, C., Beaudry, C. et al., Concentration of research funding leads todecreasing marginal returns, Research Evaluation 25, 396–404 (2016).
[61] Merton, R. K., Barber, E., The Travels and Adventures of Serendipity, Princeton UniversityPress, Princeton (2004).
[62] Murayama, K. et al., Management of science, serendipity, and research performance, Re-search Policy 44 (4), 862–873 (2015).
[63] Benias, P. C. et al., Structure and Distribution of an Unrecognized Interstitium in HumanTissues, Scientific Reports, vol. 8, 4947 (2018).
[64] Flexner, A, The Usefulness of Useless Knowledge, Princeton University Press, Princeton(2017).
[65] Lucky science. Scientists often herald the role of serendipity in research. A project in Britainaims to test the popular idea with evidence., Nature Editorial, Vol.554, 1 February 2018.
[66] Yaqub, O., Serendipity: Towards a taxonomy and a theory, Research Policy 47, 169–179(2018).
[67] Page, S. E., The Diversity Bonus. How Great Teams Pay Off in the Knowledge Economy,Princeton University Press (2017).
[68] Cimini, G., Gabrielli, A., Sylos Labini, F., The Scientific Competitiveness of Nations, PLoSONE 9(12): e113470. https://doi.org/10.1371/journal.pone.0113470 (2014).
[69] Curry, S., Let’s move beyond the rhetoric: it’s time to change how we judge research, Nature554, 147 (2018).
[70] Nicholson, J. M. and Ioannidis, J. P. A., Research grants: Conform and be funded, Nature492, 34–36 (2012).
[71] Bollen, J., Crandall, D., Junk, D. et al., An efficient system to fund science: from proposalreview to peer-to-peer distributions, Scientometrics 110, 521–528 (2017).
[72] Garner, H. R., McIver, L. J. and Waitzkin, M. B., Research funding: Same work, twice themoney?, Nature 493,599–601 (2013).


![(Pseudo) Randomness [2ex]](https://static.documents.pub/doc/80x56/61570689a097e25c765040f3/pseudo-randomness-2ex.jpg)