58
dendextend: an R package for easier manipulation and visualization of dendrograms Tal. Galili@gmail.com useR!2014

dendextend: an R package for
easier manipulation and
visualization of dendrograms
useR!2014

Talk outline:
• hclust => dendrogram
• Using dendextend for
• Manipulation
• Visualization
• Comparison
• Speed (dendextendRcpp)

Toy data: the precip dataset
The average amount of rainfall (precipitation) in inches,
for many US cities (in 1975).

Let’s quickly visualize it:
Toy data: the precip dataset

Let’s quickly visualize it.
Toy data: the precip dataset

Let’s quickly visualize it. And again, but with
hierarchical clustering
Toy data: the precip dataset

Let’s quickly visualize it. And again, but with
hierarchical clustering
The code for it:
Toy data: the precip dataset
(+…)

Lessons (so far):
• hclust - Good for creating hierarchical
clustering, but limited for plotting

Goal 1: more colors

Goal 1: more colors
1. From hclust to dendrogram

Goal 1: more colors
We first coerce hclust into a dendrogram

Goal 1: more colors
Notice the structure of hclust

Goal 1: more colors
Notice the structure of a dendrogram object

Goal 1: more colors
Notice the structure of a dendrogram object

Lessons:
• hclust - Good for creating hierarchical
clustering, but limited for plotting
• dendrogram object are
• a nested list of lists
• with attributes!

Back to Goal 1: more colors
Let’s modify the dendrogram
object we got to have colors!

Goal 1: more colors
And here is how it looks.

Before
After
Notice the change in the object’s attributes:

An example for nice
looking dendrograms

Visually diagnosing clusters with given labels

Examples of more
things we could do
(code comes a bit later)

Goal 2: tweaking the tree

Goal 2: tweaking the tree

Goal 2: tweaking the tree

Goal 2: tweaking the tree

Goal 2: tweaking the tree

Goal 2: tweaking the tree

Lessons:
• hclust - Good for creating hierarchical
clustering, but limited for plotting
• dendrogram object
• a nested list of lists
• with attributes!
• should be modified step by step before
plotting

Let’s create another tree
this time with a different
method.
And then – let’s try to
compare our two tree to
one another….

Goal 3: comparing trees

But we can do better
using tanglegrams!

Goal 3: comparing trees

We notice that the lines
are not aligned. We can
try to rotate the trees to
better align them…

Goal 3: comparing trees
Available functions :
• untangle_random_search
• untangle_step_rotate_1side
• untangle_step_rotate_2side

Goal 3: comparing trees

We can also calculate a
statistic that will measure
the level of “correlation”
between the two trees
(from -1 to 1)

Goal 3: comparing trees (statistically)

Some examples of
comparing two trees

Visually comparing two clustering methods

A plot from a recent HBP meeting in Lausanne
Tanglegram of
the two models
Dendrogram
Using 2
variables
Dendrogram
Using all
variables

Visually comparing two phylogenic trees

Lessons:
• hclust - Good for creating hierarchical
clustering, but limited for plotting
• dendrogram object
• a nested list of lists
• with attributes!
• should be modified step by step before
plotting
• Dendrograms can be compared

By using C++, we can gain
a lot of speed gains on
in some bottleneck
functions
Here is how…

Goal 4: speed!
1. Use dendextendRcppi.e: install.packages(“dendextendRcpp”)

Examples for how much
faster we can get…

Goal 4: speed!
labels
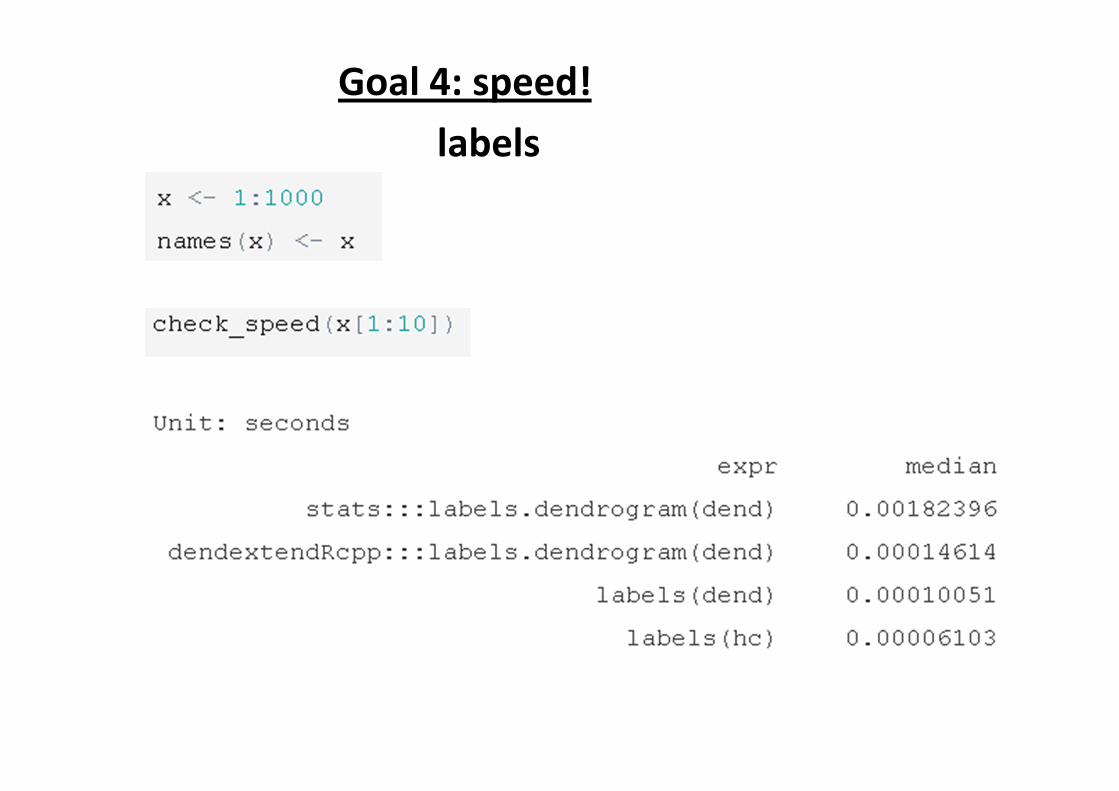
Goal 4: speed!
labels

Goal 4: speed!
labels

Goal 4: speed!
cutree

Goal 4: speed!
cutree

Goal 4: speed!
cutree
Rcpp version

Goal 4: speed!
cutree
Rcpp version

Lessons:
• hclust - Good for creating hierarchical
clustering, but limited for plotting
• dendrogram object
• a nested list of lists
• with attributes!
• should be modified step by step before
plotting
• Dendrograms can be compared
• Use dendextendRcpp for (“free”) speed

You can easily get
dendextend:


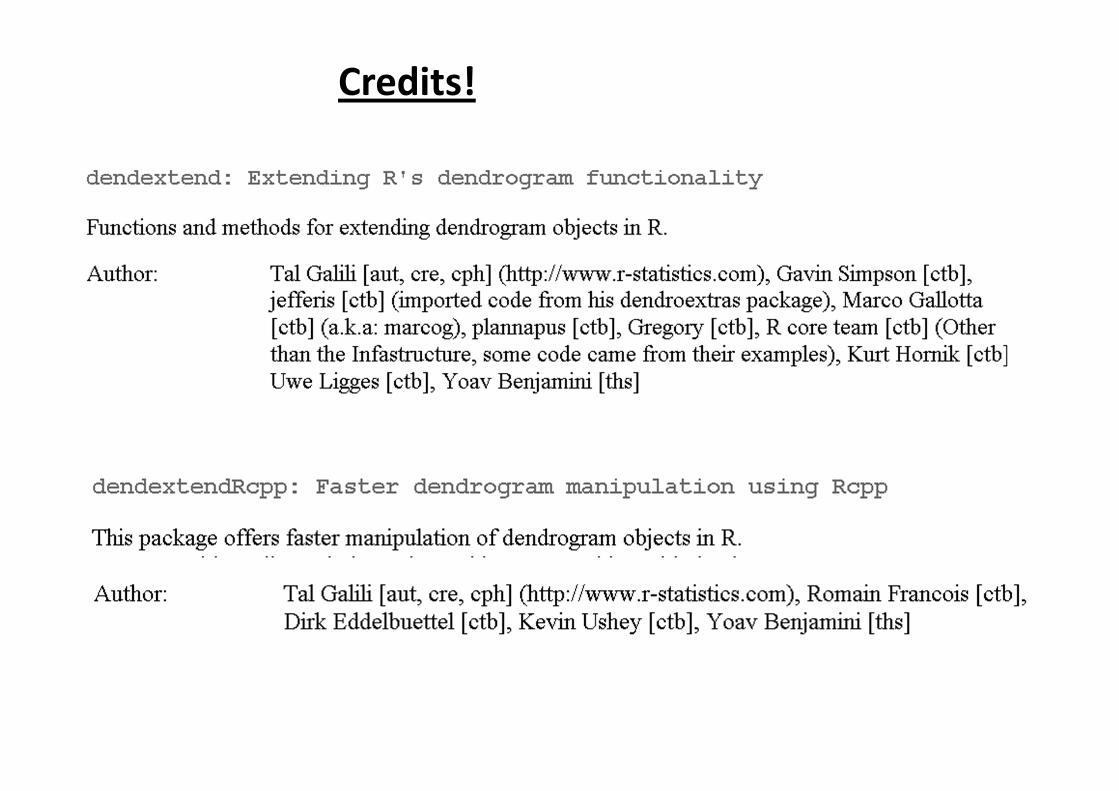
Credits!

dendextend: an R package for
easier manipulation and
visualization of dendrograms
useR!2014
Thank [email protected]
R-statistics.com
R-bloggers.com

![CMMI GRUPO 5 Juan Marcelo Ferreira Aranda [jmferreira1978@gmail.com]jmferreira1978@gmail.com Silvano Christian Gómez [cgomezpy@gmail.com]cgomezpy@gmail.com.](https://static.documents.pub/doc/80x56/54cfe5f649795990548b4f16/cmmi-grupo-5-juan-marcelo-ferreira-aranda-jmferreira1978gmailcomjmferreira1978gmailcom-silvano-christian-gomez-cgomezpygmailcomcgomezpygmailcom.jpg)


