21
Tampa Bay Nitrogen Management Consortium Update Holly Greening Tampa Bay Estuary Program March 2014
| Date post: | 03-Jan-2016 |
| Category: |
Documents |
| Upload: | emil-mathews |
| View: | 220 times |
| Download: | 3 times |
Tampa Bay Nitrogen Management Consortium Update
Holly Greening Tampa Bay Estuary Program
March 2014
2
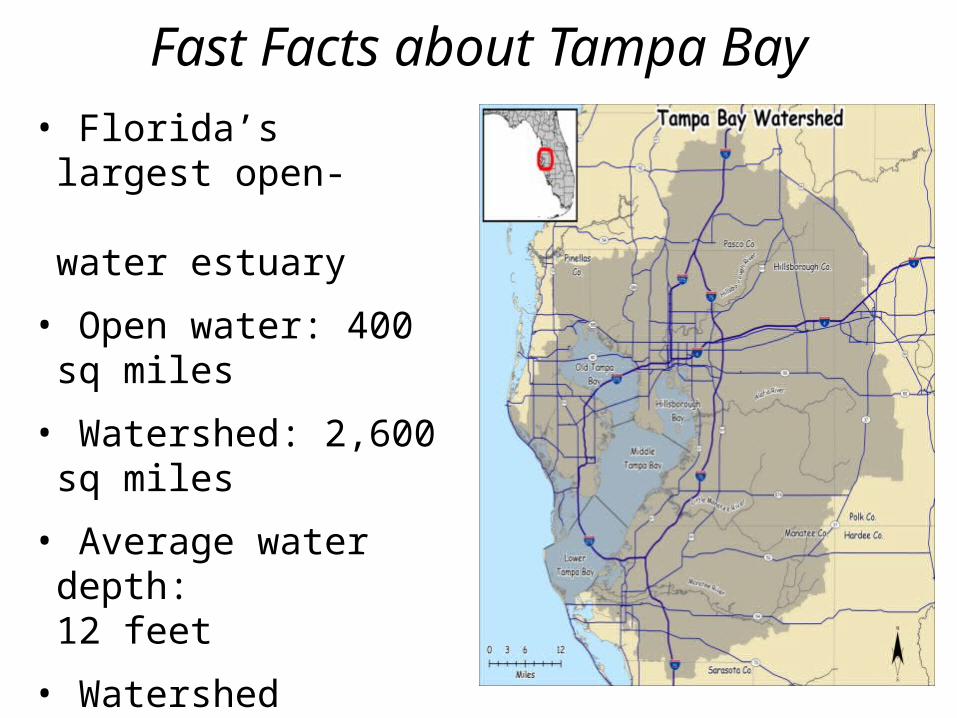
• Florida’s largest open- water estuary
• Open water: 400 sq miles
• Watershed: 2,600 sq miles
• Average water depth: 12 feet
• Watershed population: 2.3 million
• Port of Tampa in top 10 in U.S.
Fast Facts about Tampa Bay
3
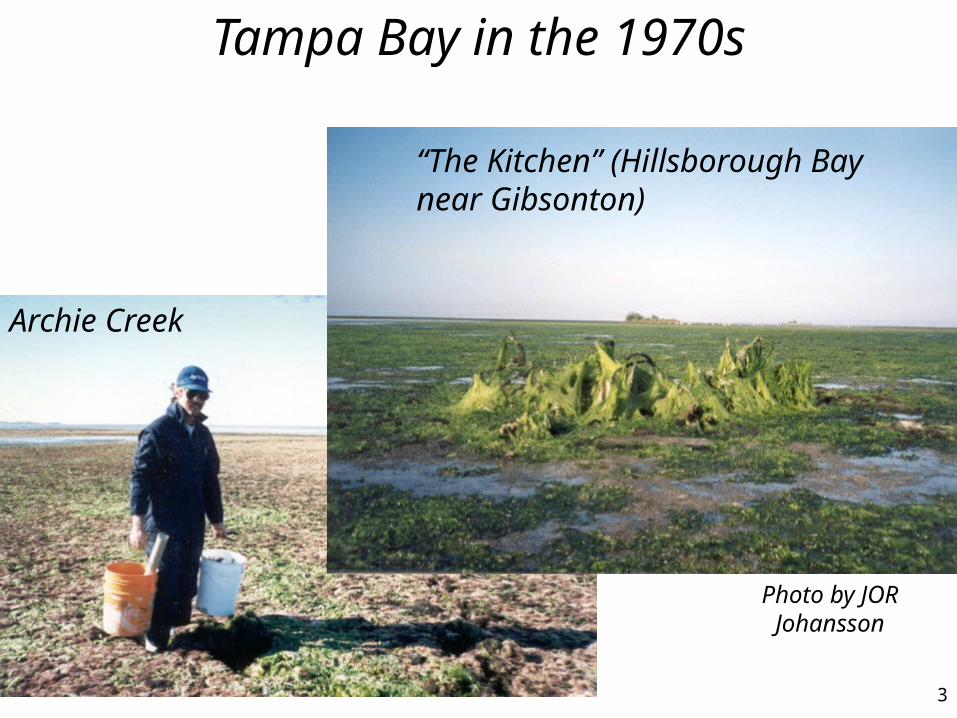
Photo by JOR Johansson
Tampa Bay in the 1970s
“The Kitchen” (Hillsborough Bay near Gibsonton)
Archie Creek
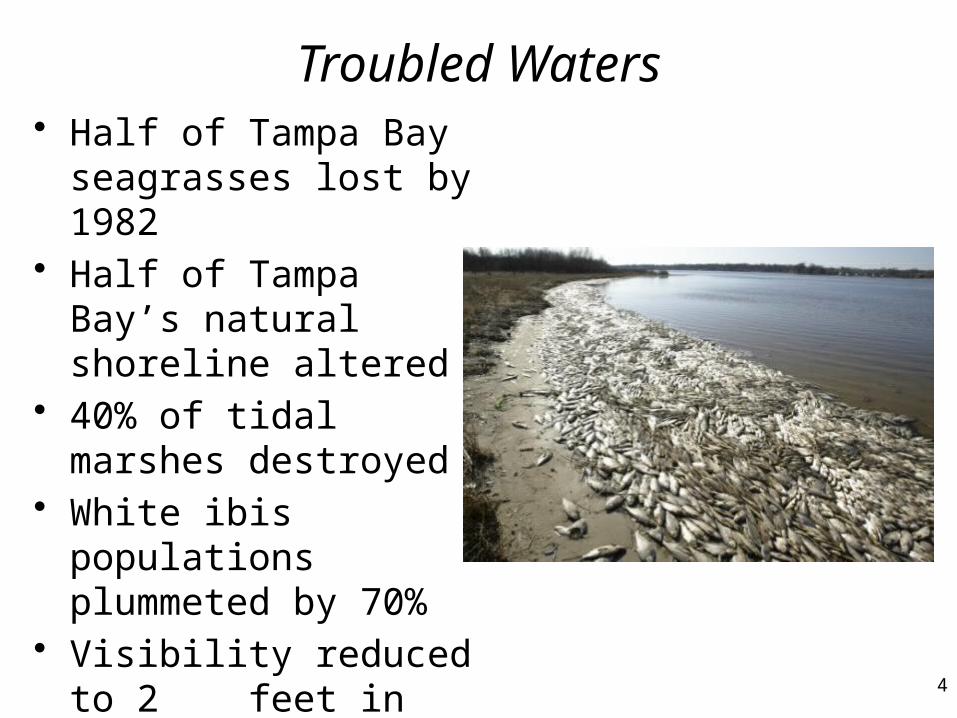
Troubled Waters• Half of Tampa Bay
seagrasses lost by 1982• Half of Tampa Bay’s
natural shoreline altered• 40% of tidal marshes
destroyed• White ibis populations
plummeted by 70%• Visibility reduced to 2
feet in Hillsborough Bay• Fish kills common
4
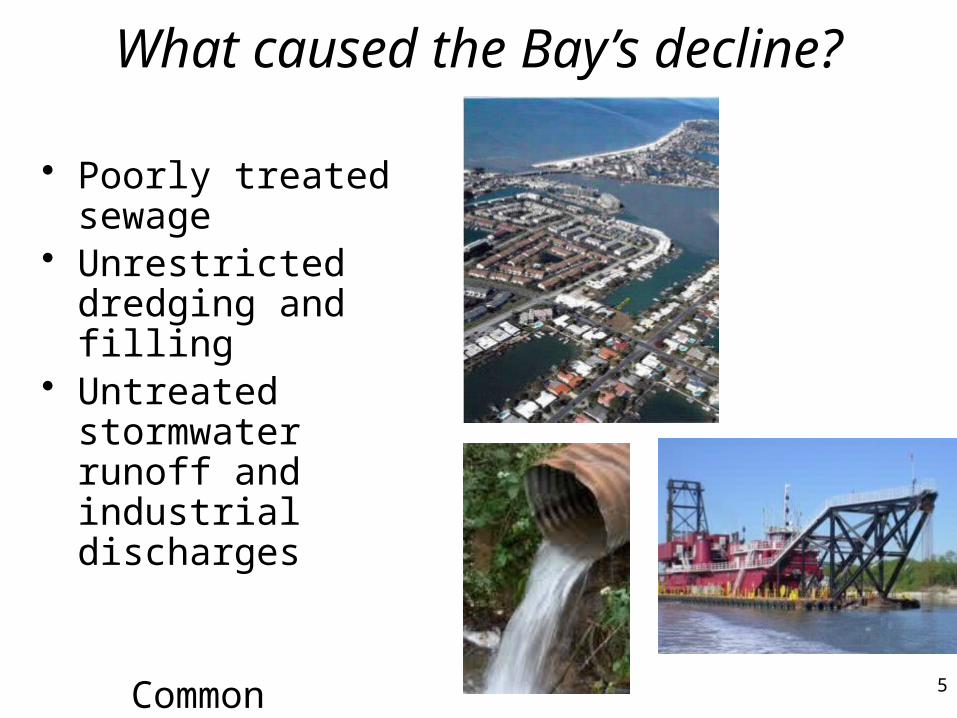
What caused the Bay’s decline?
5
• Poorly treated sewage• Unrestricted dredging
and filling• Untreated stormwater
runoff and industrial discharges
Common pollutant: NITROGEN

Restoring Tampa Bay
• Citizen action• EPCHC Monitoring • Agency on Bay
Management
early 1980s• SWFWMD SWIM
late 1980s• TBEP
1990
7
Partners vital to the Bay’s recovery
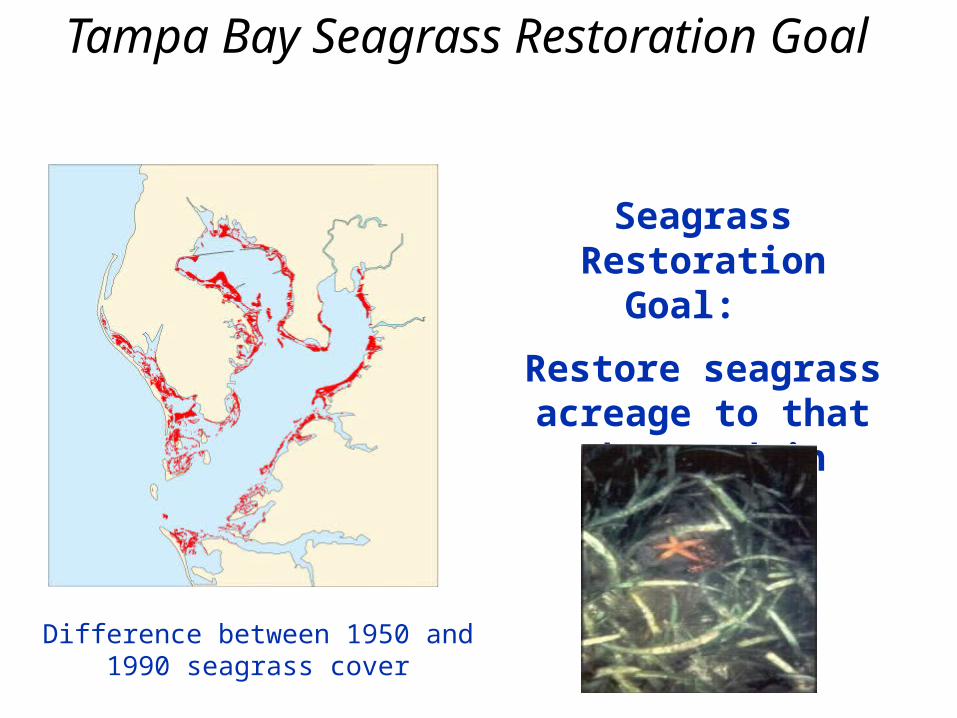
Difference between 1950 and 1990 seagrass cover
Tampa Bay Seagrass Restoration Goal
Seagrass Restoration Goal:
Restore seagrass acreage to that
observed in ~1950.
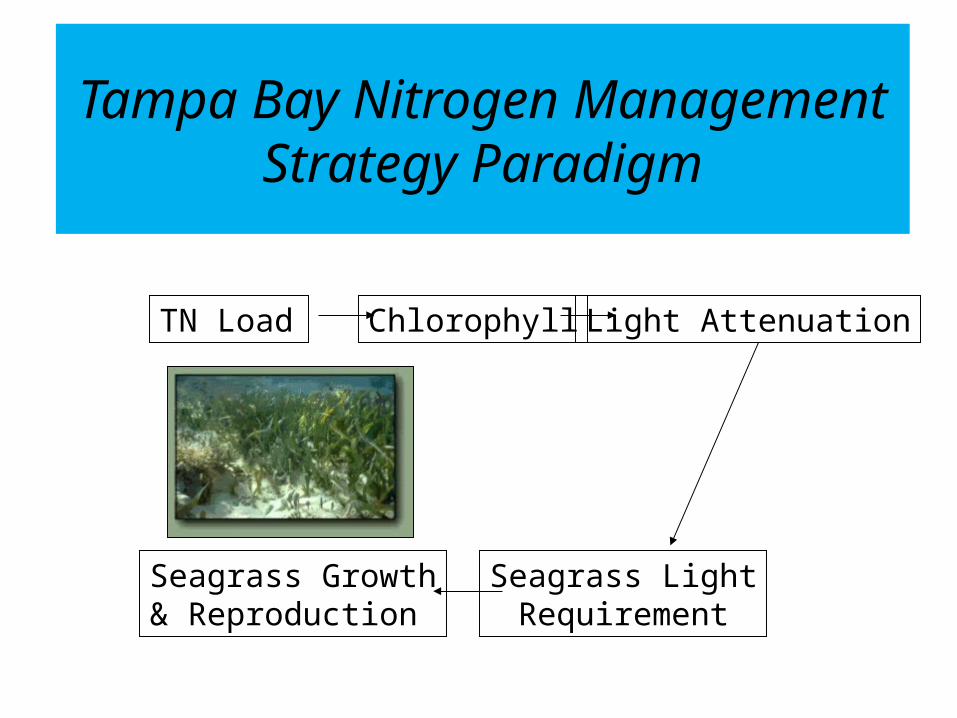
TN Load Chlorophyll Light Attenuation
Seagrass Growth& Reproduction
Seagrass LightRequirement
Tampa Bay Nitrogen Management Strategy Paradigm

1996: The beginning of Tampa Bay’s Collaborative Approach
• Public sector realized that nitrogen management goals were unattainable without private sector help.
• Private sector invited to participate with the public sector in the voluntary Nitrogen Management Consortium.
• Each partner contributed to nitrogen management goal as they were able- no requirements or allocations
11
Formed in 1996
Partnership of: • local governments, • regulatory agency
participants,• local phosphate companies,• agricultural interests and• electric utilities
Tampa Bay Public/Private Partnership
Tampa Bay Nitrogen Management Consortium
45+ NMC participants agreed to help meet nitrogen load reduction goal of 17 tons/year to offset/preclude anticipated
TN increases
12
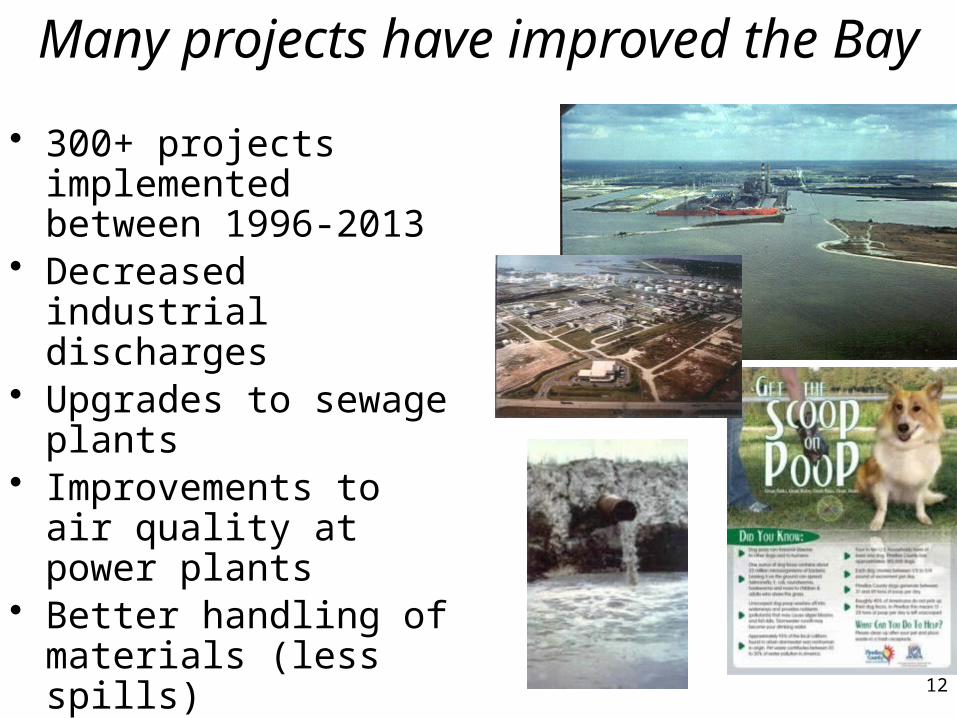
Many projects have improved the Bay
• 300+ projects implemented between 1996-2013
• Decreased industrial discharges
• Upgrades to sewage plants• Improvements to air quality
at power plants• Better handling of materials
(less spills)• Stormwater treatment• Residential fertilizer
restrictions
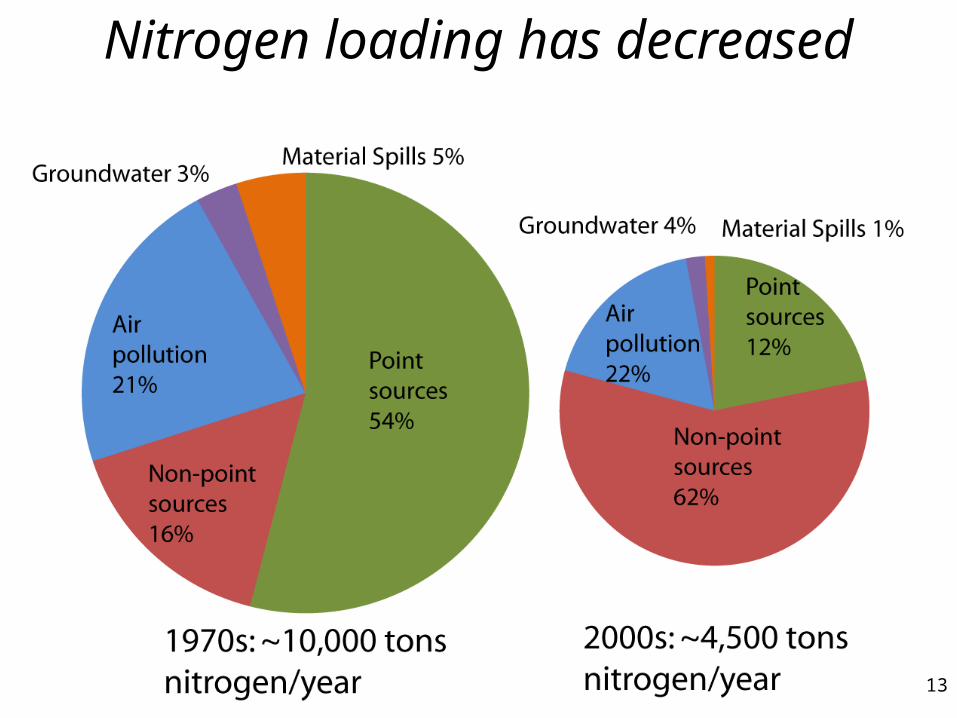
Nitrogen loading has decreased
13
14
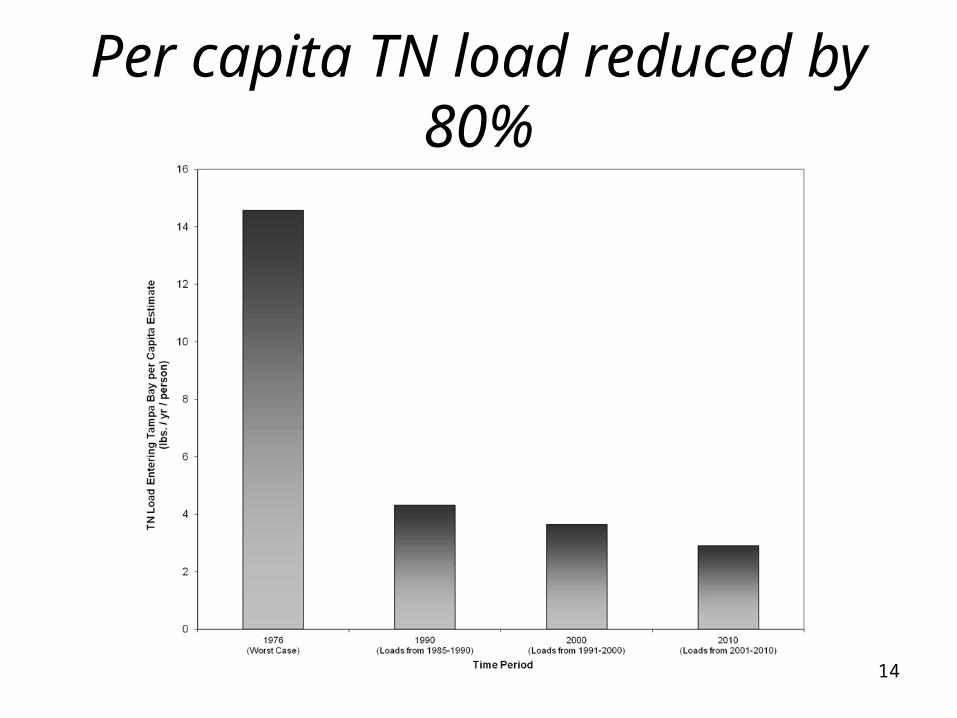
Per capita TN load reduced by 80%
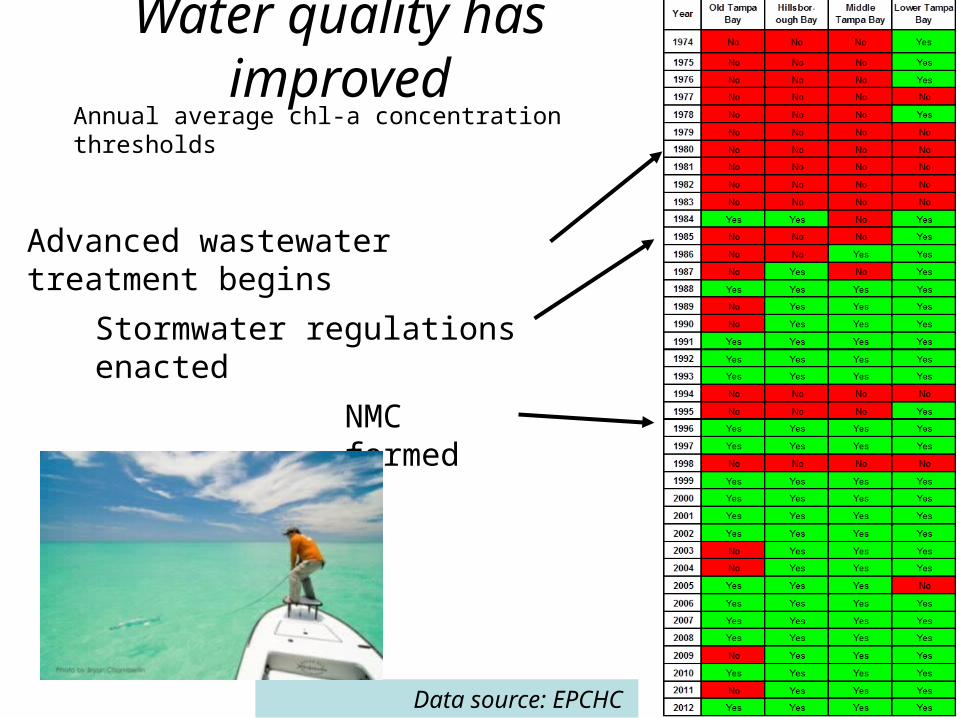
Water quality has improved
Advanced wastewater treatment begins
Stormwater regulations enacted
Data source: EPCHC
NMC formed
Annual average chl-a concentration thresholds
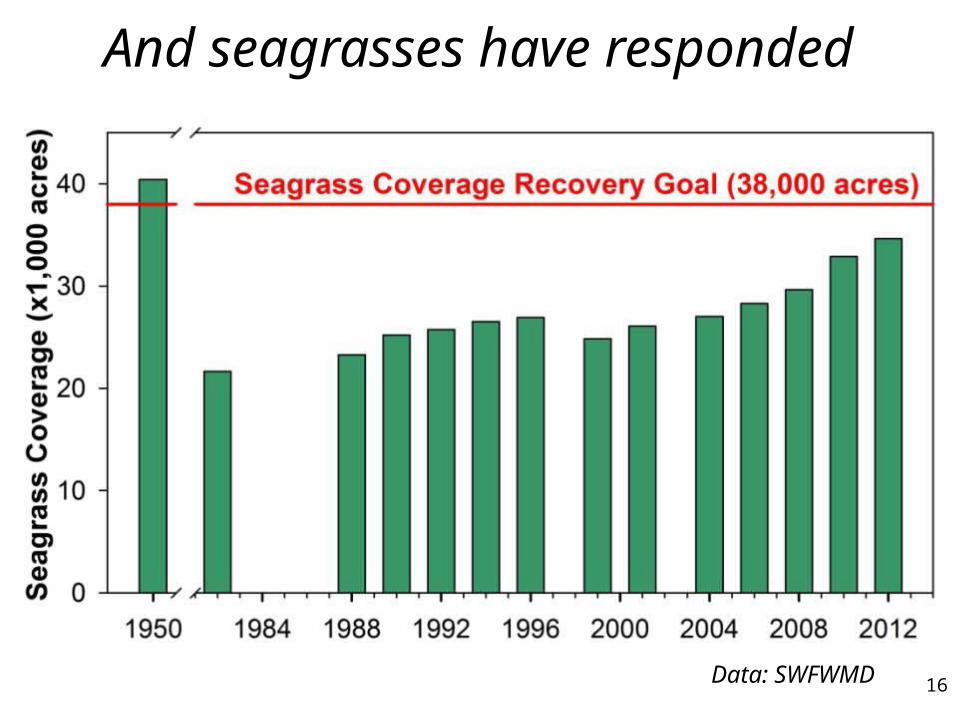
And seagrasses have responded
16 Data: SWFWMD
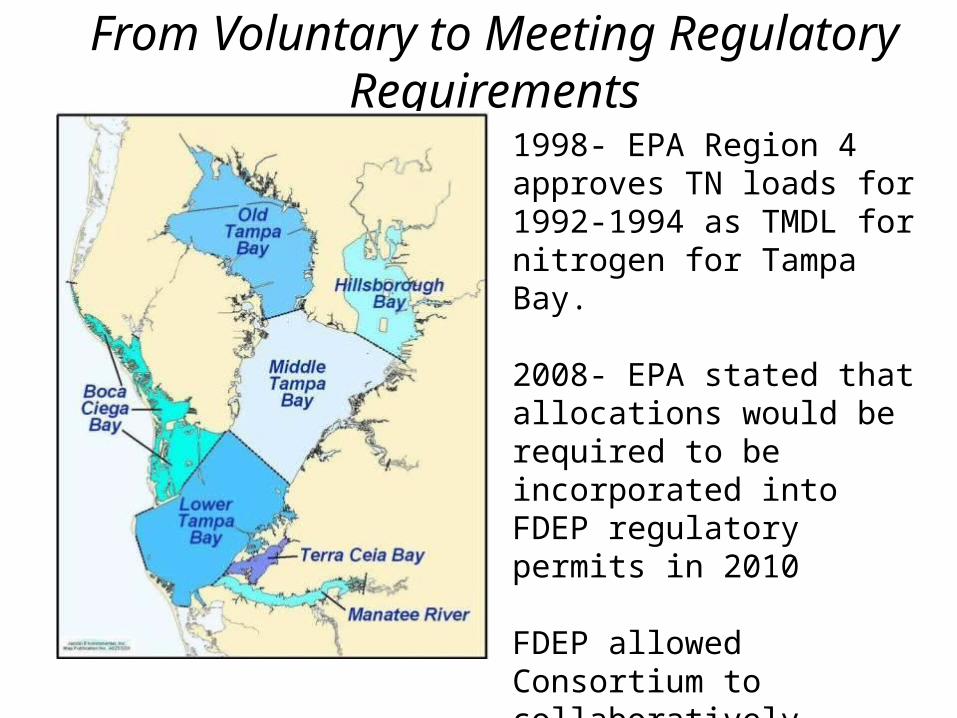
From Voluntary to Meeting Regulatory Requirements
1998- EPA Region 4 approves TN loads for 1992-1994 as TMDL for nitrogen for Tampa Bay.
2008- EPA stated that allocations would be required to be incorporated into FDEP regulatory permits in 2010
FDEP allowed Consortium to collaboratively develop recommended allocations to all sources within the watershed.
Key Decision: Collaborative Management Strategy
Consortium participants willing to work together to develop voluntary allocations (caps) for nitrogen loads from each entity, for agencies’ consideration.
Decided they wanted to ‘drive the bus’
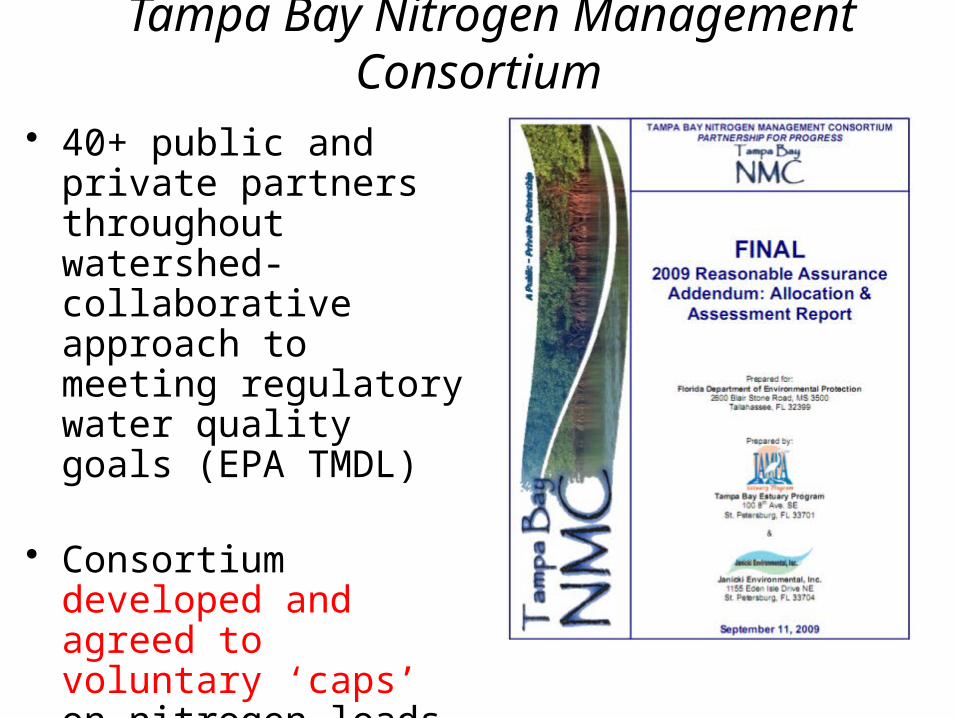
Tampa Bay Nitrogen Management Consortium
• 40+ public and private partners throughout watershed- collaborative approach to meeting regulatory water quality goals (EPA TMDL)
• Consortium developed and agreed to voluntary ‘caps’ on nitrogen loads at 2003-2007 levels for all sources. Caps now incorporated into permits.
NMC Accomplishments • FDEP approves Consortium’s Reasonable
Assurance and WQBEL (using NMC recommended allocations)- December 2010.
• Consortium develops Tampa Bay Reasonable Assurance 2012 Update; FDEP approves in January 2013.
• TN and TP NNCs consistent with RA and TMDL approved in 2013.
• Sarasota County and Progress Energy join the Consortium in 2013.
Getting Ready for 2017:Contact Information
Please update contact information for your entity– sheets being circulated.
- Primary contact name, title, email address, phone number
- Other contacts and emails from your entity (optional).


