29
Zhenghong Tang, Ph.D University of Nebraska- Lincoln North Central Climate Science Center Fort Collins, Colorado 04-05-2013 Planning for Climate Change: A Planner’s Perspective
| Date post: | 05-Dec-2014 |
| Category: |
Technology |
| Upload: | nccsc |
| View: | 359 times |
| Download: | 2 times |

Zhenghong Tang, Ph.D University of Nebraska-Lincoln
North Central Climate Science Center Fort Collins, Colorado
04-05-2013
Planning for Climate Change:
A Planner’s Perspective

Outlines
• Research Questions • Geographic Scope• Methods • Policy Implications
Research Questions
1. Climate Impacts for Playa Wetlands: How to prioritize playa wetland conversation programs under climate change scenarios?
2. Planning for Uncertainty: How well did U.S. state and local plans prepare for climate change and extreme events (drought)?
3. Citizen Science: How to promote citizen engagement for climate change through Volunteered Geographic Information (VGI)?

Research Question 1 Climate Impacts for Playa Wetlands: How to prioritize playa wetland conversation programs under climate change scenarios?(Where is a good place to install the pumping stations for wetlands?)
• Geographic Scope: Nebraska 21 Counties (Rainwater Basin Area)
• Methods: LiDAR technology & Geospatial simulation model
Tang, Z., X. Li, Zhao, N., Li, R., Harvey, F.E., 2012, Developing A Restorable Wetland Index for the Rainwater Basin Wetlands in South-Central Nebraska: A Multi-Criteria Spatial Analysis, Wetlands, 32:975–984.
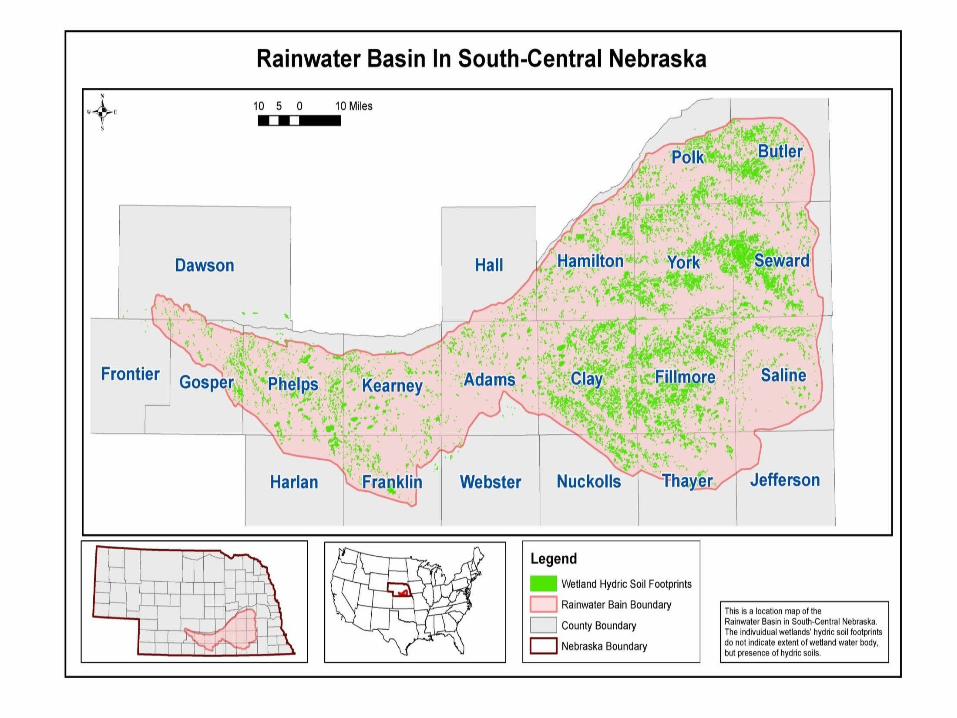

Rainwater Basin Wetlands
Playa wetlands in the Rainwater Basin provide critical habitats for 12 million migratory waterfowls to rest and feed.

Playas are very vulnerable to climate change.

How to prioritize conservation programs under climate change?

LiDAR Technology
LightDetection
AndRanging
Vertical Accuracy - LiDAR : 15 cm - USGS 10*10m NED : 1-3 m Horizontal Accuracy - LiDAR : 1 m - USGS 10*10m NED : 7-15 m

Footprint No: 10015 in Butler County
Functional…. but changing….


Multi-criteria Restorable Wetland IndexVegetation Types
Soil Types
Potential water releasing
Depression Status
Habitat Condition
Data Source: RWB vegetation layer; Score Scale: 0.5-1.0;Measurement: Hydric vegetation in each footprint;Justification: Restoration priorities should be given to the footprint with higher percentages of hydro vegetation.
Data Source: SSURGO soil data layer; Score Scale: 0.5-1.0;Measurement: Hydro soil types in each footprint;Justification: Restoration priorities should be given to the footprint with relatively wetter soil types.
Data Source: Pits volume final 2010; Score Scale: 0.5-1.0;Measurement: Pit’s water volume in each footprint;Justification: Restoration priorities should be given to the footprint with larger water volumes from modified pits.
Data Source: Depression layer; Score Scale: 0.5-1.0;Measurement: Depressional land in each footprintJustification: Restoration priorities should be given to the footprint with lower topographical depression land areas.
Data Source: AHS data layer; Score Scale: 0.5-1.0;Measurement: by frequency, percentage of functional area in a footprint, and absolute areas, by HAS in any year of 2004-2009 period;Justification: Restoration priorities should be given to the footprint with relatively functioning habitat conditions in terms of the frequency, areas, and percentages.

8,875
(75.5%)
1,792
(15.2%)
901(7.7%)
192(1.6%)
Restorable Wetland Index (RWI) By number of footprints (and percentage)
RWI: 2.5-3.0 (Low restoration potential)
RWI: 3.1-3.5 (Medium-low restora-tion potential)
RWI: 3.6-4.0 (Medium-high restora-tion potential)
RWI: 4.1-5.0 (High restoration potential)

8,208
(69.8%)
2,891
(24.6%)
322(2.7%)
339(2.9%)
Rainwater Basin Wetland Function Conditions in the Annual Habitat Survey
Non-functional acres (0% )
Medium-low func-tional acres (0-50% )
Medium-high func-tional acres (51-75% )
High functional acres (>75%)

It provides a scientific ranking system for federal/state/local wetland managers (USFWS, USDA-NRCS, USGS, NGPC, NDEQ) to implement the future wetland conservation programs.
It provides measurable evidence for Nebraska’s Wetland Program Plan in implementing full hydrologic restorations for wetlands.
Policy Implications

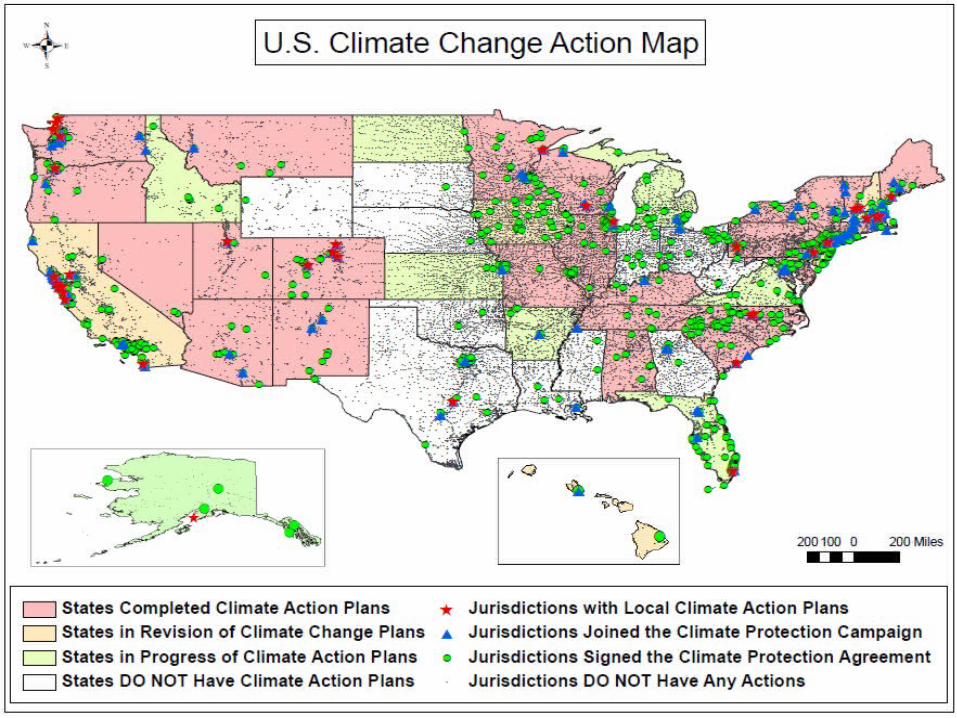
Research Question 2: 1. Planning for Uncertainty: How well did U.S. state and local
plans prepare for climate change and extreme events (drought)?
Tang, Z., Brody, S.D., Quinn, C., Chang, L., Wei, T., 2010, Moving from Agenda to Action: Evaluating Local Climate Change Action Plans, Journal of Environmental Planning and Management 53(1): 43-62.
Fu, X, Tang, Z., 2013, Planning for Drought-Resilient Communities: An Evaluation of Local Comprehensive Plans in the Fastest Growing Counties in the U.S., Cities (10.1016/j.cities.2013.03.001)
• Geographic Scope: National Study (including the north central region)
• Methods: Content Analysis & Plan Evaluation Protocol
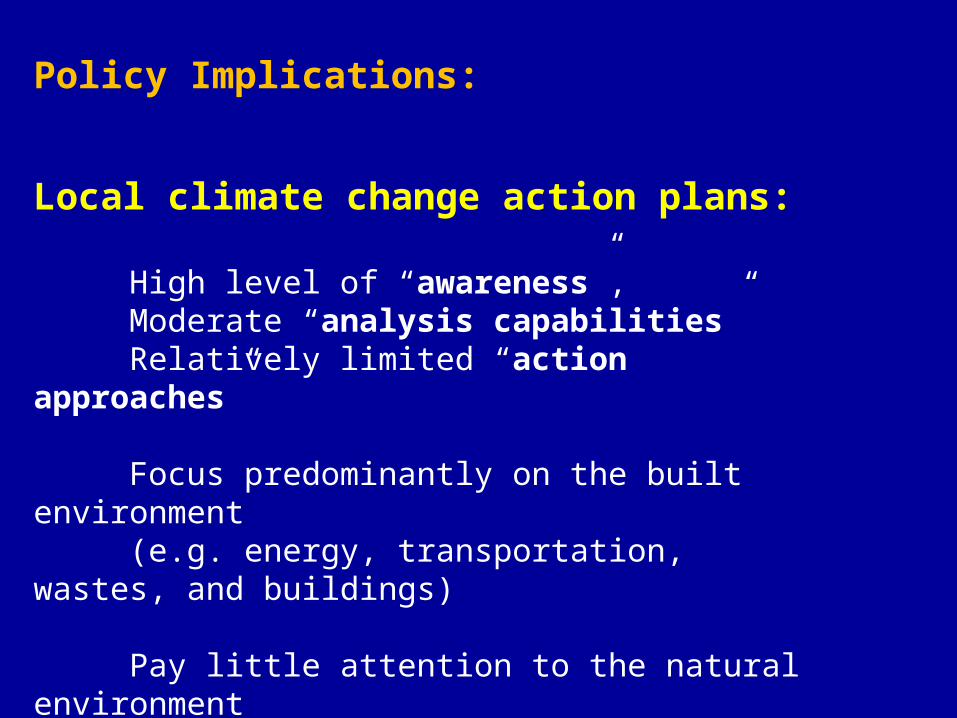
Policy Implications:
Local climate change action plans:
High level of “awareness”, Moderate “analysis capabilities” Relatively limited “action approaches”
Focus predominantly on the built environment (e.g. energy, transportation, wastes, and buildings) Pay little attention to the natural environment (e.g. ecosystem, agriculture, rural lands)
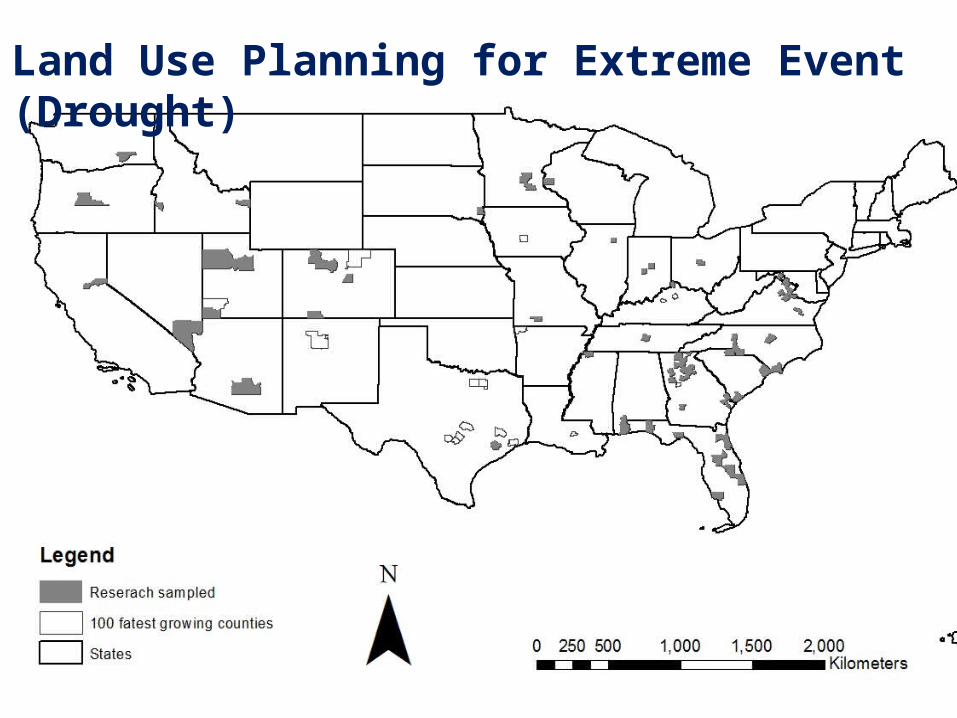
Land Use Planning for Extreme Event (Drought)

Land Use Planning for Extreme Event (Drought)

State Planning for Extreme Event (Drought)
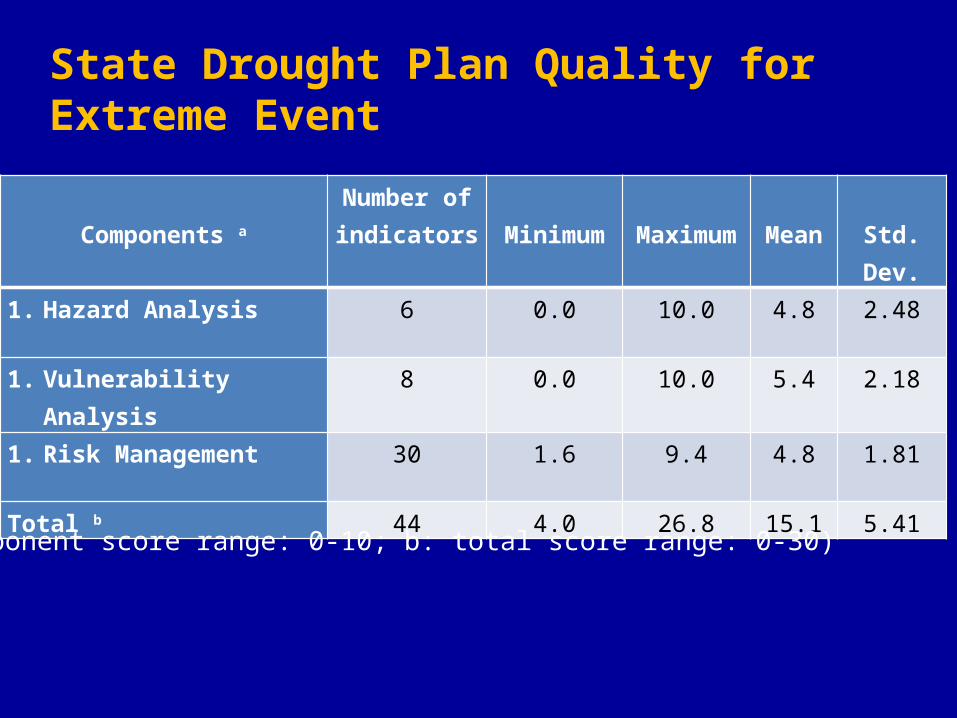
Components a
Number of indicators
Minimum
Maximum
Mean
Std. Dev.
1. Hazard Analysis 6 0.0 10.0 4.8 2.48
1. Vulnerability Analysis 8 0.0 10.0 5.4 2.18
1. Risk Management 30 1.6 9.4 4.8 1.81
Total b 44 4.0 26.8 15.1 5.41
(a: component score range: 0-10; b: total score range: 0-30)
State Drought Plan Quality for Extreme Event

Policy Implications:
Local/State Drought Planning:
Limited awareness and preparedness for water shortages and drought Fail to integrate drought mitigation/adaptation strategies into their long-term development plans
Typically address emergency responses well
Generally weak in adaptation, involvement, implementation

Research Question 3: Citizen Science: How to promote citizen engagement for climate change through Volunteered Geographic Information (VGI)?
• Geographic Scope: Nebraska & National
• Methods: VGI (Similar idea like “COCORAHS”, but in mobile platform)

Green Infrastructure My Rain Barrels My Rain Gardens
Planning in a Geospatially Mobile-Enabled Society

Low Impact Development Atlas (Web-Mapping)
http://web.uri.edu/riss/lid/lid-map/

VGI empowered by GPS-enabled electronic mobile devices and location-aware social media/networks is an important approach to monitor/report climate vulnerability and adaptation practices.
It is still a challenge to link the technologies and citizen interests.
Policy Implications

(1) A Baseline-Tracking-Evaluation Database:
Evaluate existing governmental plans/documents
in this region to build a baseline database to
track/compare future efforts in climate change
(2) A Crowdsourcing Climate Adaptation Atlas
Use mobile-based VGI platform to build an atlas for
citizens/stakeholders in climate change vulnerability
assessment and adaptation implementation
Potential Collaborations


