1 TANZANIA HIV IMPACT SURVEY (THIS) 2016-2017 KEY FINDINGS HIV Indicator Female 95% CI Male 95% CI Total 95% CI Annual incidence (%) 15–49 years 0.40 0.22-0.58 0.14 0.02-0.26 0.27 0.16-0.38 15-64 years 0.40 0.23-0.57 0.17 0.05-0.29 0.29 0.18-0.39 Prevalence Total (%) 15-49 years 6.2 5.7-6.7 3.1 2.7-3.5 4.7 4.3-5.0 15-64 years 6.5 6.0-7.0 3.5 3.1-3.9 5.0 4.7-5.4 0-14 years 0.5 0.2-0.8 0.3 0.1-0.5 0.4 0.2-0.6 Prevalence, Mainland (%) 15-49 years 6.4 5.8-6.9 3.1 2.7-3.6 4.8 4.4-5.1 15-64 years 6.7 6.1-7.2 3.6 3.2-4.0 5.1 4.8-5.5 0-14 years 0.5 0.2-0.8 0.3 0.1-0.5 0.4 0.2-0.6 Prevalence, Zanzibar (%) 15-49 years * * * * 0.4 0.1-0.8 15-64 years * * * * 0.5 0.1-0.8 0-14 years * * * * 0.0 0.0-0.0 Viral Load Suppression (%) 15-64 years 57.5 54.0-61.1 41.2 35.7-46.7 52.0 48.6-55.4 0-14 years 11.7 0.0-23.8 * * 18.4 4.6-32.3 Viral load suppression is defined as HIV RNA <1,000 copies per ml of plasma among HIV-positive individuals; incidence measurement based on mean duration of recent infection (MDRI) of 130 days; * Male and female specific prevalence estimates for Zanzibar, and male 0-14 year old VLS not shown due to insufficient sample size to obtain a meaningful estimate for subcategory. The Tanzania HIV Impact Survey (THIS), a household- based national survey, was conducted between October 2016 and August 2017 to measure the status of Tanzania’s national HIV response. THIS offered HIV counseling and testing with return of results, and collected information about household and individual characteristics, and uptake of HIV care and treatment services. The THIS was the first survey in Tanzania to measure national HIV incidence and viral load suppression. The results provide information on national and regional progress toward control of the HIV epidemic. THIS was led by the Government of Tanzania under the Ministry of Health, Community Development, Gender, Elderly and Children (MoHCDGEC) and the Ministry of Health (MoH) Zanzibar through the National Bureau of Statistics (NBS) and the Office of Chief Government Statistician (OCGS). The THIS was conducted with funding from the U.S. President’s Emergency Plan for AIDS Relief (PEPFAR) and technical assistance through the U.S. Centers for Disease Control and Prevention (CDC) and ICAP at Columbia University. The survey was implemented by NBS, OCGS, and ICAP in collaboration with local partners, including the Tanzania Commission for AIDS (TACAIDS), the Zanzibar AIDS Commission (ZAC), the National Health Laboratory - Quality Assurance and Training Center (NHL-QATC), the National AIDS Control Programme (NACP), and the Zanzibar Integrated HIV, Tuberculosis and Leprosy Program (ZIHTLP). SUMMARY SHEET: PRELIMINARY FINDINGS DECEMBER 2017
Transcript
1
TANZANIA HIV IMPACT SURVEY(THIS) 2016-2017
kEY fINdINgS
HIV Indicator female 95% CI Male 95% CI Total 95% CI
Annual incidence (%) 15–49 years 0.40 0.22-0.58 0.14 0.02-0.26 0.27 0.16-0.38 15-64 years 0.40 0.23-0.57 0.17 0.05-0.29 0.29 0.18-0.39
Prevalence Total (%) 15-49 years 6.2 5.7-6.7 3.1 2.7-3.5 4.7 4.3-5.0 15-64 years 6.5 6.0-7.0 3.5 3.1-3.9 5.0 4.7-5.4 0-14 years 0.5 0.2-0.8 0.3 0.1-0.5 0.4 0.2-0.6
Prevalence, Mainland (%) 15-49 years 6.4 5.8-6.9 3.1 2.7-3.6 4.8 4.4-5.1 15-64 years 6.7 6.1-7.2 3.6 3.2-4.0 5.1 4.8-5.5 0-14 years 0.5 0.2-0.8 0.3 0.1-0.5 0.4 0.2-0.6
Prevalence, Zanzibar (%) 15-49 years * * * * 0.4 0.1-0.8 15-64 years * * * * 0.5 0.1-0.8 0-14 years * * * * 0.0 0.0-0.0
Viral Load Suppression (%) 15-64 years 57.5 54.0-61.1 41.2 35.7-46.7 52.0 48.6-55.4 0-14 years 11.7 0.0-23.8 * * 18.4 4.6-32.3
Viral load suppression is defined as HIV RNA <1,000 copies per ml of plasma among HIV-positive individuals; incidence measurement based on mean duration of recent infection (MDRI) of 130 days; * Male and female specific prevalence estimates for Zanzibar, and male 0-14 year old VLS not shown due to insufficient sample size to obtain a meaningful estimate for subcategory.
The Tanzania HIV Impact Survey (THIS), a household-
based national survey, was conducted between
October 2016 and August 2017 to measure the status
of Tanzania’s national HIV response. THIS offered
HIV counseling and testing with return of results, and collected information about household and individual
characteristics, and uptake of HIV care and treatment services. The THIS was the first survey in Tanzania to
measure national HIV incidence and viral load suppression. The results provide information on national and
regional progress toward control of the HIV epidemic.
THIS was led by the Government of Tanzania under the Ministry of Health, Community Development, Gender,
Elderly and Children (MoHCDGEC) and the Ministry of Health (MoH) Zanzibar through the National Bureau of
Statistics (NBS) and the Office of Chief Government Statistician (OCGS). The THIS was conducted with funding
from the U.S. President’s Emergency Plan for AIDS Relief (PEPFAR) and technical assistance through the U.S.
Centers for Disease Control and Prevention (CDC) and ICAP at Columbia University.
The survey was implemented by NBS, OCGS, and ICAP in collaboration with local partners, including the Tanzania
Commission for AIDS (TACAIDS), the Zanzibar AIDS Commission (ZAC), the National Health Laboratory - Quality
Assurance and Training Center (NHL-QATC), the National AIDS Control Programme (NACP), and the Zanzibar
Integrated HIV, Tuberculosis and Leprosy Program (ZIHTLP).
SUMMARY SHEET: PRElIMINARY fINdINgS dECEMBER 2017
2
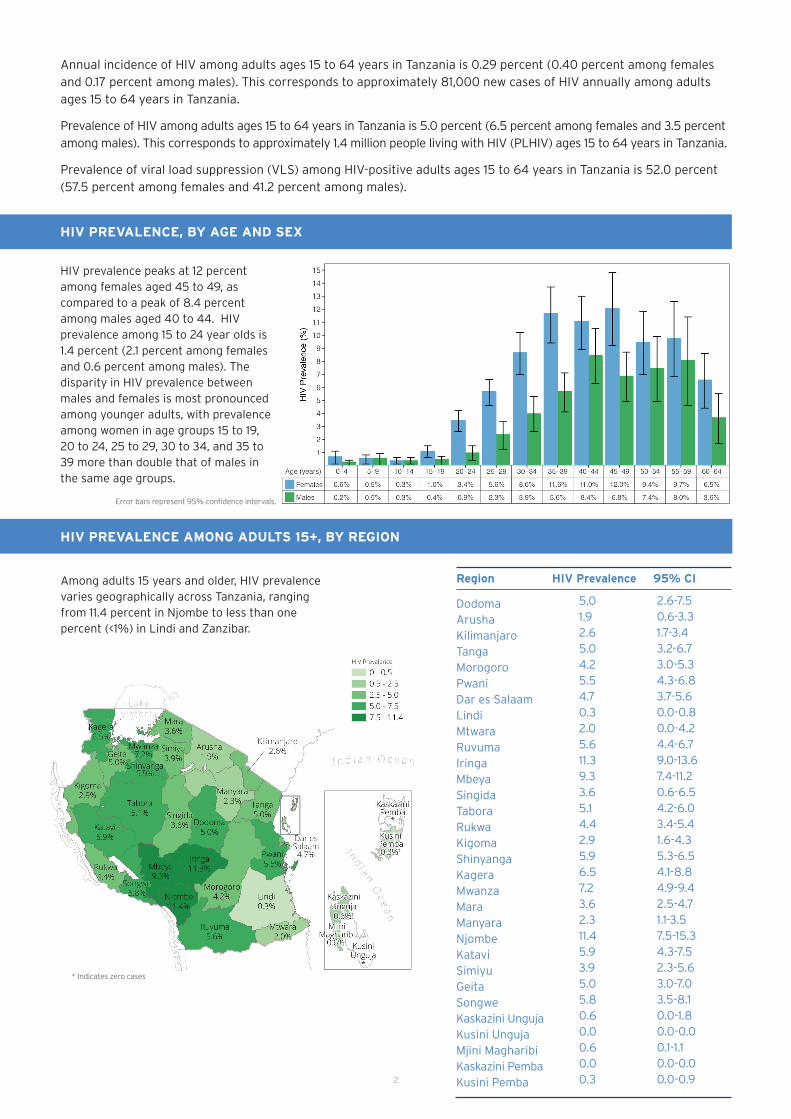
Among adults 15 years and older, HIV prevalence varies geographically across Tanzania, ranging from 11.4 percent in Njombe to less than one percent (<1%) in Lindi and Zanzibar.
HIV prevalence peaks at 12 percent among females aged 45 to 49, as compared to a peak of 8.4 percent among males aged 40 to 44. HIV prevalence among 15 to 24 year olds is 1.4 percent (2.1 percent among females and 0.6 percent among males). The disparity in HIV prevalence between males and females is most pronounced among younger adults, with prevalence among women in age groups 15 to 19, 20 to 24, 25 to 29, 30 to 34, and 35 to 39 more than double that of males in the same age groups.
HIV PREVAlENCE, BY AgE ANd SEx
HIV PREVAlENCE AMONg AdUlTS 15+, BY REgION
Error bars represent 95% confidence intervals.
Annual incidence of HIV among adults ages 15 to 64 years in Tanzania is 0.29 percent (0.40 percent among females and 0.17 percent among males). This corresponds to approximately 81,000 new cases of HIV annually among adults ages 15 to 64 years in Tanzania.
Prevalence of HIV among adults ages 15 to 64 years in Tanzania is 5.0 percent (6.5 percent among females and 3.5 percent among males). This corresponds to approximately 1.4 million people living with HIV (PLHIV) ages 15 to 64 years in Tanzania.
Prevalence of viral load suppression (VLS) among HIV-positive adults ages 15 to 64 years in Tanzania is 52.0 percent (57.5 percent among females and 41.2 percent among males).
* Indicates zero cases
Region HIV Prevalence 95% CI
Dodoma Arusha Kilimanjaro Tanga Morogoro Pwani Dar es Salaam Lindi Mtwara Ruvuma Iringa Mbeya Singida Tabora Rukwa Kigoma Shinyanga Kagera Mwanza Mara Manyara Njombe Katavi Simiyu Geita Songwe Kaskazini Unguja Kusini Unguja Mjini Magharibi Kaskazini Pemba Kusini Pemba
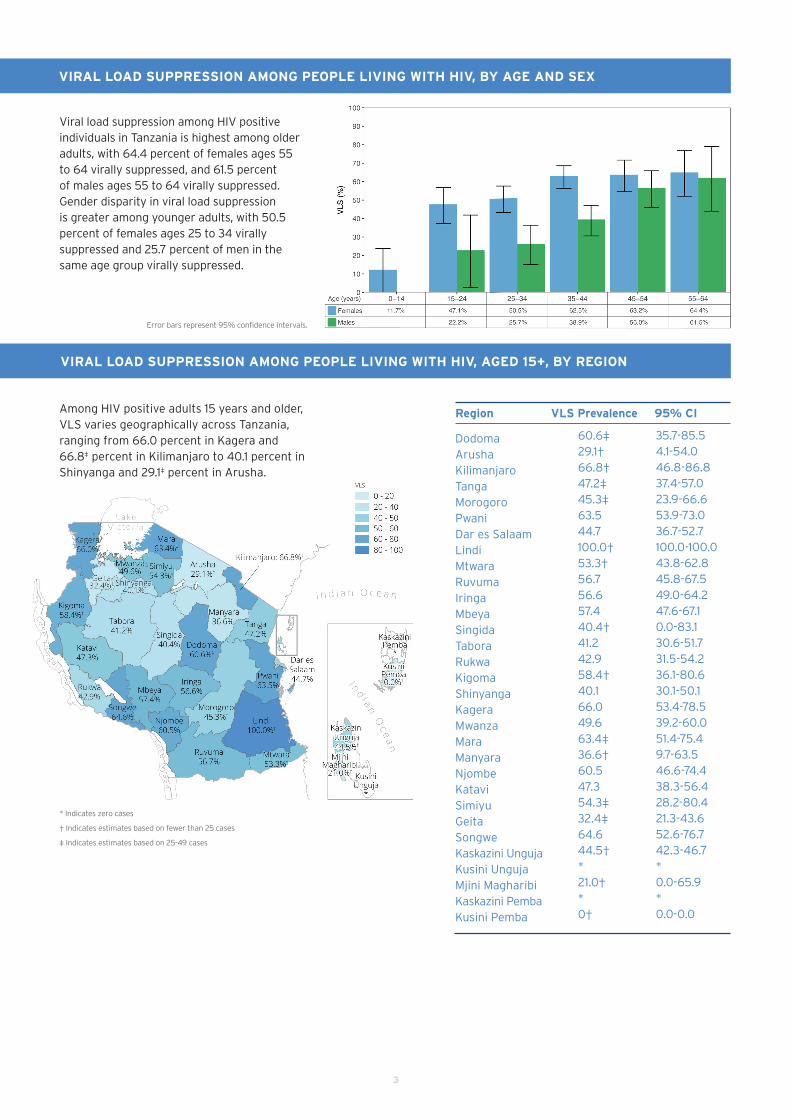
Among HIV positive adults 15 years and older, VLS varies geographically across Tanzania, ranging from 66.0 percent in Kagera and 66.8‡ percent in Kilimanjaro to 40.1 percent in Shinyanga and 29.1‡ percent in Arusha.
VIRAl lOAd SUPPRESSION AMONg PEOPlE lIVINg wITH HIV, AgEd 15+, BY REgION
Viral load suppression among HIV positive individuals in Tanzania is highest among older adults, with 64.4 percent of females ages 55 to 64 virally suppressed, and 61.5 percent of males ages 55 to 64 virally suppressed. Gender disparity in viral load suppression is greater among younger adults, with 50.5 percent of females ages 25 to 34 virally suppressed and 25.7 percent of men in the same age group virally suppressed.
VIRAl lOAd SUPPRESSION AMONg PEOPlE lIVINg wITH HIV, BY AgE ANd SEx
Error bars represent 95% confidence intervals.
* Indicates zero cases
† Indicates estimates based on fewer than 25 cases
‡ Indicates estimates based on 25-49 cases
Region VlS Prevalence 95% CI
Dodoma Arusha Kilimanjaro Tanga Morogoro Pwani Dar es Salaam Lindi Mtwara Ruvuma Iringa Mbeya Singida Tabora Rukwa Kigoma Shinyanga Kagera Mwanza Mara Manyara Njombe Katavi Simiyu Geita Songwe Kaskazini Unguja Kusini Unguja Mjini Magharibi Kaskazini Pemba Kusini Pemba
ACHIEVEMENT Of THE 90-90-90 gOAlS AMONg PEOPlE lIVINg wITH HIV
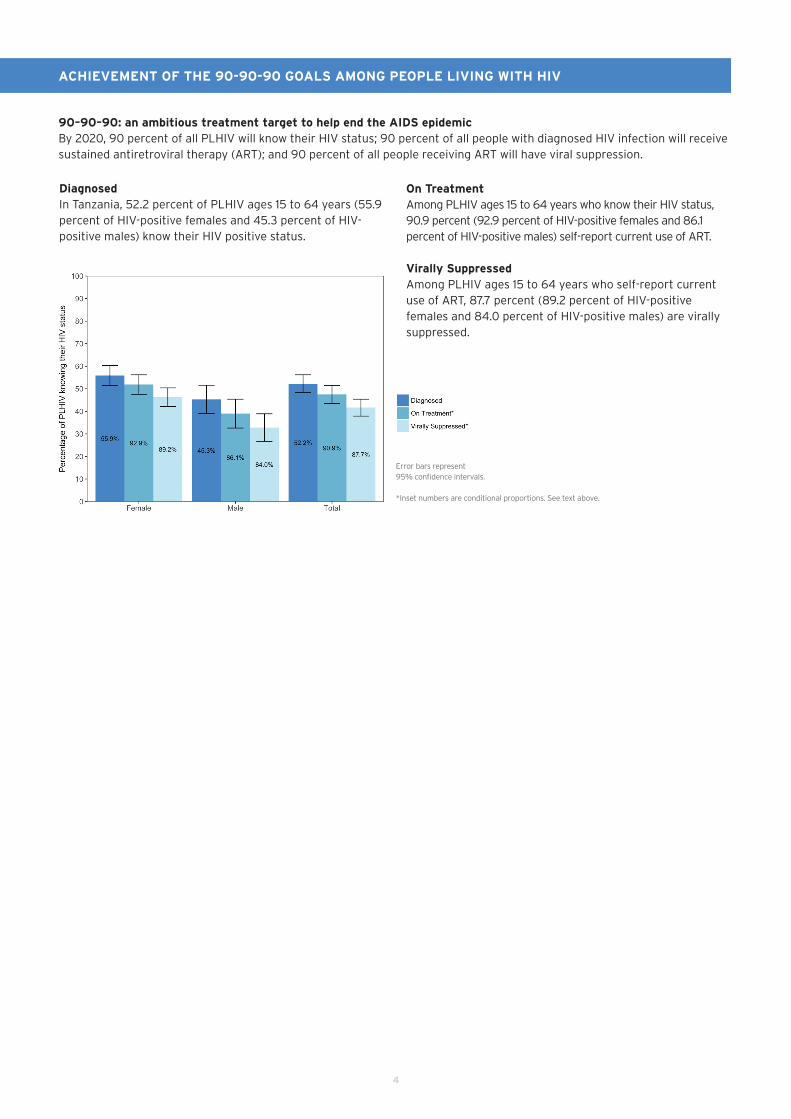
90–90–90: an ambitious treatment target to help end the AIdS epidemic By 2020, 90 percent of all PLHIV will know their HIV status; 90 percent of all people with diagnosed HIV infection will receive sustained antiretroviral therapy (ART); and 90 percent of all people receiving ART will have viral suppression.
diagnosedIn Tanzania, 52.2 percent of PLHIV ages 15 to 64 years (55.9 percent of HIV-positive females and 45.3 percent of HIV-positive males) know their HIV positive status.
On TreatmentAmong PLHIV ages 15 to 64 years who know their HIV status, 90.9 percent (92.9 percent of HIV-positive females and 86.1 percent of HIV-positive males) self-report current use of ART.
Virally SuppressedAmong PLHIV ages 15 to 64 years who self-report current use of ART, 87.7 percent (89.2 percent of HIV-positive females and 84.0 percent of HIV-positive males) are virally suppressed.
Error bars represent 95% confidence intervals.
*Inset numbers are conditional proportions. See text above.
5
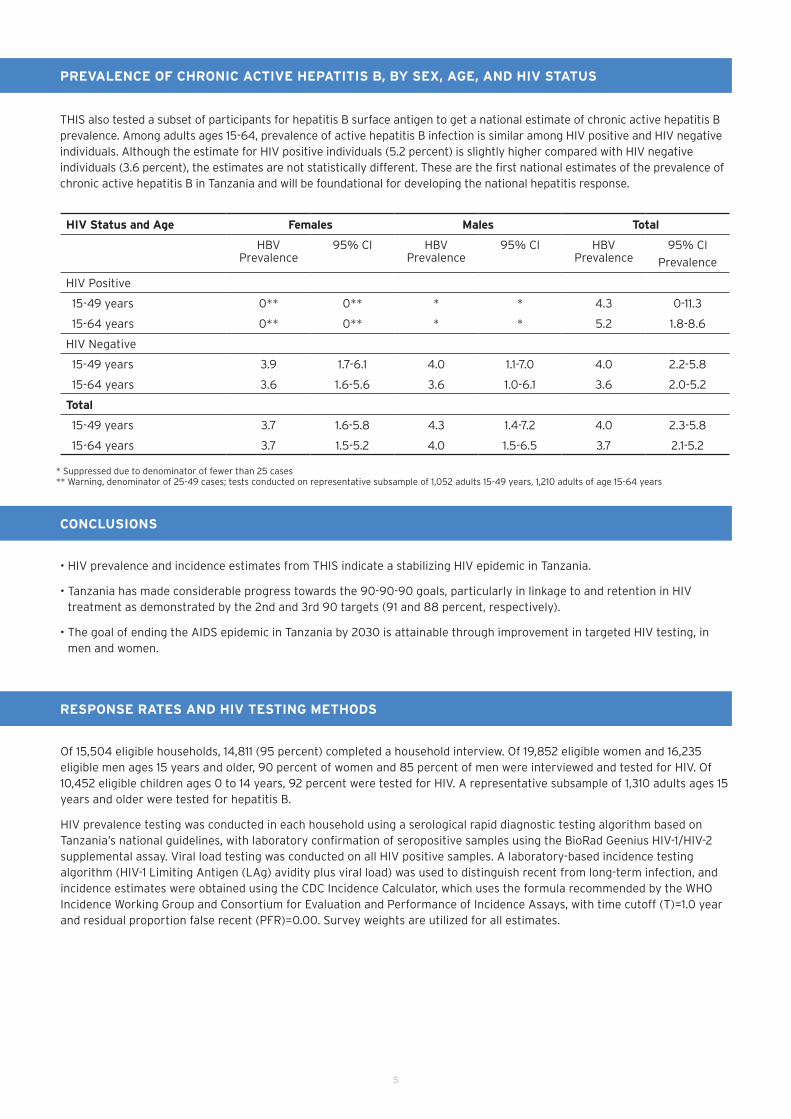
PREVAlENCE Of CHRONIC ACTIVE HEPATITIS B, BY SEx, AgE, ANd HIV STATUS
CONClUSIONS
Of 15,504 eligible households, 14,811 (95 percent) completed a household interview. Of 19,852 eligible women and 16,235 eligible men ages 15 years and older, 90 percent of women and 85 percent of men were interviewed and tested for HIV. Of 10,452 eligible children ages 0 to 14 years, 92 percent were tested for HIV. A representative subsample of 1,310 adults ages 15 years and older were tested for hepatitis B.
HIV prevalence testing was conducted in each household using a serological rapid diagnostic testing algorithm based on Tanzania’s national guidelines, with laboratory confirmation of seropositive samples using the BioRad Geenius HIV-1/HIV-2 supplemental assay. Viral load testing was conducted on all HIV positive samples. A laboratory-based incidence testing algorithm (HIV-1 Limiting Antigen (LAg) avidity plus viral load) was used to distinguish recent from long-term infection, and incidence estimates were obtained using the CDC Incidence Calculator, which uses the formula recommended by the WHO Incidence Working Group and Consortium for Evaluation and Performance of Incidence Assays, with time cutoff (T)=1.0 year and residual proportion false recent (PFR)=0.00. Survey weights are utilized for all estimates.
RESPONSE RATES ANd HIV TESTINg METHOdS
THIS also tested a subset of participants for hepatitis B surface antigen to get a national estimate of chronic active hepatitis B prevalence. Among adults ages 15-64, prevalence of active hepatitis B infection is similar among HIV positive and HIV negative individuals. Although the estimate for HIV positive individuals (5.2 percent) is slightly higher compared with HIV negative individuals (3.6 percent), the estimates are not statistically different. These are the first national estimates of the prevalence of chronic active hepatitis B in Tanzania and will be foundational for developing the national hepatitis response.
• HIV prevalence and incidence estimates from THIS indicate a stabilizing HIV epidemic in Tanzania.
• Tanzania has made considerable progress towards the 90-90-90 goals, particularly in linkage to and retention in HIV treatment as demonstrated by the 2nd and 3rd 90 targets (91 and 88 percent, respectively).
• The goal of ending the AIDS epidemic in Tanzania by 2030 is attainable through improvement in targeted HIV testing, in men and women.
HIV Status and Age females Males Total
HBVPrevalence
95% Cl HBVPrevalence
95% Cl HBVPrevalence
95% Cl
Prevalence
HIV Positive
15-49 years 0** 0** * * 4.3 0-11.3
15-64 years 0** 0** * * 5.2 1.8-8.6
HIV Negative
15-49 years 3.9 1.7-6.1 4.0 1.1-7.0 4.0 2.2-5.8
15-64 years 3.6 1.6-5.6 3.6 1.0-6.1 3.6 2.0-5.2
Total
15-49 years 3.7 1.6-5.8 4.3 1.4-7.2 4.0 2.3-5.8
15-64 years 3.7 1.5-5.2 4.0 1.5-6.5 3.7 2.1-5.2
* Suppressed due to denominator of fewer than 25 cases** Warning, denominator of 25-49 cases; tests conducted on representative subsample of 1,052 adults 15-49 years, 1,210 adults of age 15-64 years
6
Tanzania HIV Impact Survey (THIS) is part of the
Population Based HIV Impact Assessment (PHIA) Project
which is a multi-country project funded by PEPfAR to
conduct national HIV-focused surveys that describe the
status of the HIV epidemic. Results will measure important
national and regional HIV-related parameters, including
progress toward 90-90-90 goals, and will guide policy
and funding priorities. ICAP at Columbia University is
implementing the PHIA Project in close collaboration with
CdC and other partners.
See phia.icap.columbia.edu for more details.
This project is supported by the U.S. President’s Emergency Plan for AIDS Relief (PEPFAR) through CDC under the terms of cooperative agreement #U2GGH001226. The findings and conclusions in this report are those of the authors and do not necessarily represent the official position of the funding agencies. The results presented should be considered preliminary and they are subject to change.
The mark “CDC” is owned by the US Dept. of Health and Human Services and is used with permission. Use of this logo is not an endorsement by HHS or CDC of any particular product, service, or enterprise.