125
TAPAS KUMAR SEN

TAPAS KUMAR SEN

The inrpw! af inflation on variorrr economk en ti tic^ L mot dray8 f a y apprrctrtd. Thb book, bg dmating
prodt8 .sd tbr t.x8&m d tb. mIn* attemp& to qmmtify oacr innpack The W k coa€eilar r ndew of the literature on ttta b m r from the view
f u well u a study of the Eorpoata . mt. both aggresated rsd d-ew- M. The results are Imparturt, bets-
. Xhsry show thrt the corpmte rector in bar is taxtd too heavily as r reault of
' IllrJrrr combination of h@tSon and a tag -we which docs not crrplidtly
this phenommoo.
- b.-
-trial Cradit and Investment Cor

INFLATION ACCOUNTING
AND CORPORATE TAXATION
Inflation Accounting
and Corporate Taxation
TAPAS KUMAR SEN
NATIONAL INSTITUTE OF PUBLIC
FINANCE AND POLICY
18/2 Satsang Vihar Marg, Special Institutional Area
New Delhi 110067

RESEARCH TEAM
Tapas Kumar Sen
Anita Lalchandani
Sheila Gajwani
Jitender Kaur
© 1987 National Institute of Public Finance and Policy,New Delhi
Published by National Institute of Public Finance and Policy,
18/2 Satsang Vihar Marg, Special Institutional Area, New Delhi110 067. Printed by Dialogue Editorial Service, New Delhi
110 060, at Typographers (India) A-49/1 Mayapuri Industrial
Area-I, New Delhi 110 064

FOREWORD
The National Institute of Public Finance and Policy is an
autonomous, non-profit organisation whose major functions
are to carry out research, do consultancy work and undertake
training in the area of public finance and policy. In addition
to carrying out on its own studies on subjects that are consi
dered to be important from the national point of view in terms
of policy formulation, the Institute also undertakes research
projects on subjects of public interest sponsored by member
governments and other institutions.
The present study was sponsored by the Industrial Credit
and Investment Corporation of India. The subject of the study
—analysis and quantification of the impact of inflation on the
taxation of capital income in the corporate sector in India—is
of special significance in the context of the inflationary trends
prevailing in the economy over more than a decade now and
the need for enabling the private sector to be in a position to
generate adequate funds internally to meet their investment
needs. The study was undertaken at a time when the inflation
ary pressures were particularly acute. While the pressures have
now abated somewhat, the trend persists. As per the terms of
reference, the study covers only manufacturing companies, both
government-owned and privately-owned, and is limited to the
period 1970-71 to 1978-79.
The study was done by Dr. Tapas K. Sen, Senior Econo
mist, and was completed in August, 1984.
The Governing Body of the Institute does not take respon
sibility for any of the views expressed in the Report. The res
ponsibility for the conclusions arrived at and the views expres
sed belongs to the Director and the staff of the Institute, and
more particularly, to the author.
March 1987 A. BAGCHI
Director

ACKNOWLEDGEMENTS
The present study involved collection of data on a largescale, and in this endeavour Ms. Anita Lalchandani, Ms. Sheila
Gajwani and Ms. Jitender Kaur very ably assisted me. Thedata were processed at the NIPFP computer centre, and Sri
K.K. Atri, Sri A.K. Halen and Ms. Geeta Bhatnagar carriedout their share of the work efficiently.
Drs. R.J. Chelliah, Amaresh Bagchi, V.D. Lall and Sri-
nivasa Madhur contributed substantially to the formulation of
the methodology of the study.
While the study owes a great deal to the abovenamed per
sons for which f express my gratitude here, f would like to
stake my claim on any errors that might have escaped un
detected.
New Delhi TAPAS KUMAR SEN

CONTENTS
Page No.
Preface v
Acknowledgements vi
1. Introduction 1
2. Inflation and Corporate Accounts 3
3. Inflation Accounting 10
4. Methodology and Data 30
5. The Inventory Adjustment 37
6. Adjustment of Depreciation for Inflation 54
7. The Total Impact and Internal Generation of
Capital 70
8. The Extent of Overtaxation: Final Results 96
9. Policy Implications 104
Annexure I. A Note on the Adjustment of Monetary
Assets/Liabilities for Inflation 108
Annexure //. Tables A-II.l, A-II.2 HI
References 113

1. INTRODUCTION
The Industrial Credit and Investment Corporation of India
entrusted the National Institute of Public Finance and Policy
(NIPFP) with a study on the analysis and quantification of the
impact of inflation on the taxation of capital income in the
corporate sector.
The terms of reference were :
(/) To identify the ways in which inflation reduced the use
fulness of the present method of accounting and quantify
its effect on the accounts;
(//■) To analyse the ways in which inflation affected the tax
liability of the corporate sector and measure the effect
in terms of corporate income tax liabilities;
(///) To indicate other effects that inflation has exerted onthe corporate sector through the changes in corporate
income tax liability, particularly on their finances; and
(fv) The analyses and estimation mentioned above were to
be carried out with reference to only manufacturing
companies, both government owned and privately own
ed The differences in the impact of inflation, if any,
between companies of different sizes, ages, and industries
were also to be brought out.
To carry out the empirical work enjoined in the terms of
reference actual accounts data were prerequisites. A sample of90 manufacturing companies were selected by us using stratified
random sampling under the probability proportional to size
method and the required data were collected for these com
panies. Along with the data on prices, these form the basis of
the present study.We wish to thank the Director of the Research and Statistics
Division, Department of Company Affairs and their librarystaff who made the task of collecting a large mass of finan-

2. INFLATION AND CORPORATE
ACCOUNTS
1. Introduction
A persistent rise in the general price level, implying a conti
nuously falling value of money, is generally termed as inflation.
Inflation has been a widespread phenomenon during the last
decade and still continues to trouble many economies. It affects
the entire monetised sector of any economy in one way or an
other, and since the monetised sector is predominant in most
economies, the causes of inflation and the possible methods of
controlling and curing it are important issues that have been
discussed extensively.
The effects of inflation have also been discussed at length.
It has been shown that it has economy-wide repercussions, and,though it is not a phenomenon which directly affects the real
magnitudes, it certainly affects them indirectly. The major eco
nomic effects of inflation are, in brief, as follows:
(i) It redistributes real income between the fixed income
groups and others. When income is fixed in terms of
money, higher prices imply lower real income;
(//) It normally causes a redistribution of real resources bet
ween the private and public sectors. This is because
taxes generally rise more than proportionally with
prices; if the prices of public goods do not rise faster
than the rate of inflation, as is likely, the real resources
available to the public sector would increase. However,
the reverse seems to be happening in India;
077) Since rising prices give rise to a tendency to convert
cash into commodities, especially the more durable ones,
inter-temporal and inter-industry allocation of resources
is distorted;
0'v) Relative fixity of interest rates causes savings to fall and
borrowings to rise, which, in the presence of administer
ed rates of interest, causes imbalances in the capital

4 Inflation Accounting and Corporate Taxation
market with consequent spurt in speculative activities;and
(v) It changes the relative prices of imports and domestic
goods, causing exports to fall and imports to rise, with
consequent balance of payment difficulties and exchange
rate problems. In the presence of fiscal or physical
controls on imports, it gives a boost to smuggling.
Inflation has a number of other direct and indirect effectswhich can be either short-term or long-term or both. This studyconcentrates on the second major effect listed above. More
specifically, one of the ways in which inflation causes a tax
burden higher than that legislated for the taxpayers forms thesubject of this study.
2. Inflation and Taxes
Inflation leads to a higher tax burden on certain taxpayerseven when the real tax base remains the same. This happens
when the base is defined wholly or partially in nominal terms
and the tax happens to be progressive. In the case of specific
duties, the government actually loses real revenue due to inflation and the real burden of the tax is reduced. The two distinctways in which inflation imposes additional tax burden on tax
payers are explained below in brief. It should be emphasised
that these effects are not inherent to inflation, but arise due to
a combination of certain tax rules and inflation. A change in
the tax rules can neutralise the effect in so far as these twospecific effects are concerned.
First, a progressive rate structure operates on the nominalvalue of the tax base. With inflation, the base increases innominal terms and may cross over into a higher tax-rate slab
even when it remains the same in real terms. Then the effectivetax rate could rise with the real tax base remaining the same
This may happen in respect of a tax like, say, the personal
income tax. By defining the tax base in real terms, say, indexing it to inflation, this effect can be neutralised.
The other way in which the tax base swells only in nominalterms is as follows: the taxable base is normally arrived at after
certain deductions from a gross base like gross profits or grossreceipts. Durine inflation \he m-ncc Kac^ ™,o,, ,- :_

Inflation and Corporate Accounts 5
nominal terms, but some of the deductions, e.g., depreciation
allowances in the case of corporate income tax, do not increase
because they are denned in a way which is invariant to inflation.
As a result the taxable base in nominal terms increases faster
than that in real terms during inflation.
Thus, it is the method of computation of the tax base and
the tax structure that determine the impact of inflation as far
as taxpayers are concerned. Since corporate capital income is
subject to corporate income tax, a brief outline of the corporate
accounting methods and the tax structure would be relevant.
3. Corporate Accounting
All companies prepare their annual accounts to enable
themselves as well as others interested to assess their financial
position and performance during the year. The annual accounts
are divided into two parts: the balance sheet and the profit and
loss account. The former is a snapshot of the finances of a
company on a particular day—the day the accounts are closed
for the year—by listing its assets and liabilities. Sometimes the
balance sheet is substituted by a sources and uses of funds
account, but it is not significantly different from the balance
sheet because the liabilities are normally the sources and the
assets are normally the uses of funds. In practice, the only
difference between the two is that under sources and uses of
funds account, net current assets (current assets minus current
liabilities) are taken as uses of funds. In a conventional balance
sheet current assets and current liabilities are separately enume
rated as parts of assets and liabilities, respectively.
The profit and loss account, also called the income and
appropriation account or income and expenditure account,
details the financial inflows and outflows of a company during
the course of its accounting year. It states the income of the
company from all heads, the various expenses incurred, profits
(or loss, as the case may be) and their allocation. In case of
loss, the account gives information on how the extra expenses
have been financed.
The link between the corporate income tax and corporate
accounting should now be obvious. The accounts form the
basis of the assessment of taxable profit by the income tax
authorities. This is not to say that the profits arrived at in the

6 Inflation Accounting and Corporate Taxation
corporate accounts form the tax base. In fact, the tax base is
calculated as accounting profits plus disallowed expenses minus
deductible allowances not deducted in the accounting profits.
But it can be said that accounting profits broadly form the tax
base.
The profit and loss account contains a head called tax pro
vision which, by convention, means provision for the corporate
income tax. This denotes the amount set apart to meet income
tax demands. Tax provisions are not necessarily the same as
actual tax liabilities, but over the years they generally even out.
Corporate accounts are generally prepared under certain
accounting rules and conventions. These have evolved over
the years with a view to presenting a true and fair picture of
the financial operations of a company during the accounting
year and of its financial position at the end of that accounting
year. The persons making use of these accounts are many: the
company itself, financial analysts, actual and prospective share
holders, economists, and various government agencies, among
others. All these groups are now seized of the problems of the
impact of inflation on corporate finances and more specifically
corporate accounting. It is argued that with persistent inflation
corporate accounts presented in the traditional way do not give
a true and fair picture of the finances of the companies any
more. Therefore, it is argued, the accounts must adjust for
inflation in some way, and the government must also take
cognisance of this fact.
4. Inflation and Corporate Accounting
Corporate accounting is always done in money terms and
one of the underlying assumptions is that the value of a unit of
money does not change over time. Thus, the accounts contain
entries in money terms, the real values of which are supposed
to remain unchanged for as many as fifteen years or more.
Keeping nominal values unchanged under inflationary condi
tions is obviously incorrect. Suppose, for example, that the
nominal value of the fixed assets of a company grows at a rate
of 5 per cent per annum and the rate of inflation is, say, 7 per
cent per annum. Thus, the growth in the nominal value of
fixed assets camouflages the fact that real fixed assets are actu
ally declining. This situation is eminently probable if one only

Inflation and Corporate Accounts 7
looks at the values given in the balance sheet of a company,
because fixed assets are reported at nominal historical cost.But more serious than this is the way values expressed in
terms of money units relating to different years are usedtogether in certain calculations, the results of such calculations
becoming erroneous in the process. Specific examples are depre
ciation calculations, and the calculation of increase/decrease in
stocks.1 These calculations, in turn, affect the calculation of
profit. Since nominal values of assets, profits and other items
from corporate accounts form the basis of many other decisions
having important effects, like tax liabilities calculations, action
under MRTP Act, actions regarding various controls imposedby the government, and so on, the distortion in corporate
accounts introduced by inflation may have a much wider effect
than a mere misrepresentation of accounts.
5. The Corporate Income Tax Structure
The corporate income tax is in general levied on business
organisations registered as companies with the Registrar ofCompanies under the Companies Act, 1956. The profits of the
company, as determined by the existing tax laws, form the tax
base. The rates applicable are notified by the government from
time to time. The latest rate schedule is given on page 8.The rates, as can be seen, differ according to the type of
company. The two major classifications adopted for tax pur
poses are:
(/) Domestic and foreign; and
(//) Closely-held and widely-held.
Foreign and closely-held (a company in which the public
are not substantially interested) companies have to bear a
higher rate of tax. An element of progressivity was introducedinto the corporate income tax rate structure by taxing small
public limited companies at a lower rate than others. But since
the overwhelming bulk of capital was, and continues to be, in
the larger companies, the actual impact of such progressivity
'The major distortions are discussed in detail later.

8 Inflation Accounting and Corporate Taxation
was not much; it was done away with in 1984 by abolishing
tax-rate differentiations on the basis of income.
Rates of Income Tax on Companies
(Assessment Year 1986-87)
1. Domestic Companies per cent
a. Companies in which public are substantially interested 50(widely-held)
b. Companies in which public are not substantially interested (closely-held)
(i) Trading or investment companies 60
(ii) All others 55
2. Foreign Companies
a. On royalties and technical fees on agreements made
with the government or with private parties withgovernment approval 50
b. On rest of the income 65
From the total income of the company, the expenses deemed reasonable for earning that income, including depreciationon assets employed, are deducted and profits pre-arrived at in
this fashion. Certain allowances—which are normally incentives for various purposes—are further deducted from the profits and the resultant amount forms the tax base. These deductions and allowances may vary across companies resulting invarying effective tax rates.
6. Objectives of the Study
The primary aim of this study is to assess the impact infla
tion has had on the taxation of capital income originating inthe corporate sector. To this end, first an attempt is made" toadjust the corporate accounts for inflation. Taxable profits ofcompanies are then re-estimated after the adjustment, keeping
other things the same. The difference between the actual effec
tive tax rate and the estimated effective tax rate provides a
measure of the extent of over/under-taxation of the corporate
sector under the corporate income tax. Also, assuming the tax
provision to be the same, retained profits are re-estimated after

Inflation and Corporate Accounts 9
adjustment for inflation to ascertain if there is any truth in the
charge that the corporate income tax, coupled with inflation, is
hampering ploughback of profits and actually causing a drain
on the reserves in real terms.
There is no unique method of inflation accounting, i.e.,
adjusting the accounts for inflation, and the term is not un
ambiguous. Therefore, we start with a discussion of inflation
accounting and indicate the method that will be employed by
us.

3. INFLATION ACCOUNTING
The present study is an attempt to measure the impact of in
flation on the taxation of capital income in the corporate
sector. Broadly, the method adopted to achieve this is to neu
tralise the effect of inflation on the corporate sector by adjust
ing their accounts for inflation through inflation accounting,
and then keeping everything else the same, to estimate the dif
ferential in the tax burden on corporate capital income. Thus,
inflation accounting is the key element in our estimations and
hence deserves more than a passing mention.
1. Need for Inflation Accounting
Inflation, especially when it is prolonged and high, reduces
considerably the meaningfulness and use of the corporate
accounts because the various amounts in current rupee values
may not signify proportionate real amounts, as the real worth
of the rupee varies in different years. Moreover, arithmetical
operations involving different amounts in rupees having different
real worth become quite misleading. To make the accounts
more meaningful, all items should be expressed in values rela
ting to a common year. This is attempted through inflation
accounting, the following reasons usually being advanced in
its favour :
(a) It helps to correct the usually distorted picture of the
financial operations and condition of a company presented by
the conventional system of accounts ;
(b) It facilitates inter-company comparisons since inflation
hits different firms in different degrees;
(c) It also facilitates inter-period comparisons of the per
formance of a firm;
(</) Correct measurement of income is possible only with
inflation accounting; and
(e) When some nominal value in the accounts forms the
basis of government action, e.g., taxation based on profits,

Inflation Accounting 11
MRTP Act measures based on a nominal value acting as a
proxy for relevant variables, determination of controlled price
on the basis of nominal profits and so on, inflation may cause
unfair decisions by the government, unless the relevant nominal
value is adjusted for inflation.
2. Brief History
Inflation accounting and the principles underlying it have
been discussed in some form or the other for the last 50 years
or so, although the discussions remained more or less academic
and confined to accountants. During the runaway inflation in
the 'forties in Germany, it was discussed quite a greate deal
but no concrete proposal or action emerged, and the discussion
subsided once the economy resumed functioning on a more or
less even keel. The issue was revived, this time in the UK and
the USA, about 25 years ago. Other countries where it be
came a live issue very early were Latin American countries
like Chile, Argentina and Brazil, and the Netherlands in
Europe.
In the USA, it was seriously advocated for the first time
by the American Institute of Certified Public Accountants
(AICPA) in 1963 in a study entitled Reporting the'Financial
Effects of Price Level Changes. About six years later, the
Accounting Principles Board (APB) brought out a similar pro
posal as Statement 3. The Financial Accounting Standards
Board (FASB) was formed in 1973. It prepard a few exposure
drafts, the most notable of which was FAS 33, issued in 1979.
Meanwhile, the Securities and Exchanges Commission (SEC)also contributed to the discussion by issuing Accounting Series
Release (ASR) 190. However, despite these expository papers
and the tremendous amount of discussion that they have pro
voked, there is no consensus on the exact method of inflation
accounting to be adopted.
In the UK, the first full-scale discussion is found in a re
port on inflation accounting by the Inflation Accounting Com
mittee (1975) appointed by government and chaired by F.E.P.
Sandilands. There were, of course, several expository papers
issued by accounting bodies already existing. Hard on the heels
of the Sandilands Committee Report (1975) came Exposure
Draft (ED) 18 by the Inflation Accounting Steering Group,

12 Inflation Accounting and Corporate Taxation
also known as the Morpeth Group. Unlike most other propo
sals, where inflation-adjusted accounts were to be added as sup
plementary information to the conventional accounts, ED 18
required companies to give inflation-adjusted accounts in the
primary financial statements. This sparked off a revolt among
the U.K. accountants and led to an unprecedented formal vote
by the Institute of Chartered Accountants in 1977 against this
kind of imposition. As a result, ED 18 was shelved and fresh
discussions started with the Hyde Guidelines issued in 1978. In
1979 it was proposed that disclosures under Hyde Guidelines
should be mandatory. In 1980, Statement of Standard Accoun
ting Practice (SSAP) 16 was issued, by the Accounting Stan
dards Committee (ASC), requiring most large companies to
give inflation-adjusted accounts, in both the balance sheet and
the profit-and-loss account. SSAP 16 was slated to be reviewed
in 1983. A working group under the chairmanship of Tom
Neville pointed out the limited usefulness of SSAP 16 after
consulting various users, preparers and auditors of SSAP
16 accounts. Meanwhile, the urgency of the issue has declined
due to a fall in the rate of inflation. As a result, no successor
to SSAP 16 has yet emerged. However, it is almost certain
that the new standard would be simpler, less rigorous and will
require fewer adjustments.
The Netherlands allows inflation accounting for companies;
and Philips, a big multinational based in that country, has been
giving such accounts for a number of years now.
At least two Latin American countries practise inflation
accounting—Brazil and Chile. Inflation has been rampant in
these countries and naturally, they were the first to practise in
flation accounting. Argentina also has been facing a very high
rate of inflation and has been on the verge of accepting infla
tion accounting for a number of years now, but somehow has
not taken the plunge yet.
Canada, Australia and India seem to be simply following
the U.K. in this matter. In Canada, some exposure drafts have
been issued which do not propose anything new and India and
Australia have so far made only one serious attempt each to
discuss the issue by instituting a committee. The Australian
Committee was chaired by R.L. Mathews and the Indian one
was chaired by R.M. Honaver. Again, there is nothing original

Inflation Accounting 13
with respect to the principles of inflation accounting in the
reports of these committees.
Some companies have been giving inflation-adjusted
accounts in India on their own. Examples from the public
sector are Bharat Heavy Electricals Limited (BHEL) and
Hindustan Machine Tools Limited (HMT). The inflation-ad-
adjusted accounts, of course, are supplied in addition to the
conventional accounts.
The Institute of Cost and Works Accountants of India
sponsored two publications in 1975 to familiarise Indians with
this issue. Later, in December, 1979, the Federation of Indian
Chambers of Commerce and Industry (FICCI) organised a
workshop in Bombay to discuss the issue and published a
Report on the Workshop (1979).
Thus, the present position is that though there are very few
countries which have officially adopted inflation accounting,
either as a superior substitute for traditional historical cost
accounting or as supplementary to it, there are many other
countries which are at least engaged in discussing the issue
seriously and in detail. In the near future a number of countries
may actually decide to adopt inflation accounting officially, if
inflationary conditions should continue.
3. Methods of Inflation Accounting
So far, we have used the term 'inflation accounting' as if it
was unambiguous. As a matter of fact, it is not. One of the
reasons why many countries in principle agree that inflation
accounting is desirable but are still unable to implement it, is
that the exact method of adjusting the accounts for inflation is
fiercely debated. There are many issues within the ambit of
inflation accounting on which a general agreement is necessary
before it can actually be implemented. In this section we
summarise the important issues.
As mentioned earlier, historical cost accounts become un
satisfactory during inflation because they contain values based
on both current as well as past values of the unit of money and
calculations are done without paying any attention to this fact.
For example, suppose a firm bought a machine worth Rs 100 in
the year 1975 and again bought another at the same price in the
14 Inflation Accounting and Corporate Taxation
gross fixed assets upto 1978; with another Rs 100 added to it in
1979, gross fixed assets are shown at a value of Rs 200. This is
clearly improper because Rs 100 in 1975 is not the same as
Rs 100 in 1979.
Thus, inflation accounting essentially involves identifying
any value in the accounts which is expressed in terms of past
rupees and updating them in line with the rest. This is con
ceptually simple, as all one has to do is to convert the values
in past rupees to values in current rupees using a suitable index.
However, it is the choice of a "suitable" index that gives rise
to a major controversy.
There are two extreme views. One would suggest the use of
a general price index like the GNP deflator or the consumer
price index irrespective of the item in the accounts to which it
is being applied. The other would require a large number of
specific price indices to be applied, one for each item needing
adjustment. The first is called current purchasing power (CPP)
method and the other is called current cost accounting (CCA)
method. Between these extremes there lie various suggested
combinations. The rationale for CPP is that it is the general
value of money that is needed to be corrected for because the
money value of any commodity in the accounts should reflect
the general purchasing power embodied in that commodity. The
rationale for CCA is that since it is a question of updating the
money value of specific items in the accounts, the indices re
lating to the price of each item should be used. This, in essence,
is the major controversy. While the Sandilands Committee as
well as the Morpeth group advocated CCA, the American
accountants seem to be in favour of CPP, as is expressed in the
following statement by George Terborgh: "In principle, the in
flation adjustment should reflect what has happened, not to the
specific prices, but to the dollar itself, in terms of its general
purchasing power over finished goods and service. In practice,
moreover, this is almost a necessity. The adjustment of cor
porate accounts for inflation is complicated enough, in all con
science, without the use of a multiplicity of specific price
indices." (Terborgh, 1976, pp. 90-91). Further arguments are
provided by William Fletcher of Indiana Telephone Corpn.,
U.S.A.: "Why, then, did we use the GNP Implicit Price
Deflator ? We used it because it is broadlv based, calculated bv

Inflation Accounting 15
someone else, and published to the world over a long period.
Further, changes in design of the index are likely to be widely
known ... It would be interesting to know what our capital
will do in the telephone business (construction price indexing);
but before we entertain ideas about reinvestment, we want to
know what has happened to our purchasing power (capital)."
(Fletcher, 1976, p. 224). However, CPP would totally ignore
inter-firm differences in the impact of inflation. If the major
assets of a company consist of computers whose prices have
been falling, use of CPP would give them a very large windfall
since the assets will be upvalued improperly and depreciation
calculated accordingly.
There are others who tread a middle path. For example,
W.T. Baxter says, "Full analysis (i.e., splitting up of total gain
into its nominal and real parts) demands use of both specific
index and general index." (Baxter, 1976, p. 169). An example
can illustrate the thrust of this statement.
Suppose a bond was bought by a company in 1975 for
Rs 100. In 1982, its market value is, say, Rs 130. According to
CCA, Rs 30 should be shown as holding gain, and the assets
should reflect Rs 130 in place of Rs 100. But, suppose the in
flation in the meantime has been 20 per cent. What Baxter (and
others like him) means is that holding gain should be recorded
as Rs (13O-12O) = Rs 10. The rest of the gain, i.e., Rs 20
should be recorded under a separate head.
Among the countries practising inflation accounting, Latin
American countries have all opted for CPP, whereas Nether
lands uses CCA.
As for a comparison of relative merits and demerits, almost
all experts are of the opinion that these two approaches should
not be compared. To quote a representative view on the claim
that CCA is supeiior to CPP, "This is akin to asserting that
a cow is superior to a horse. Each is superior for the very
different purpose for which it is intended. Because the two
'approaches' deal with entirely different objectives, their con
ceptual merits simply cannot be compared" (Sprouse, 1976,
p. 120, footnote). Be as it may, the problem of choice still
remains because for actual application only one can be used.
The essence of correct choice is clarity of objective.

16 Inflation Accounting and Corporate Taxation
CCA and CPP (or a middle path). There are other issues to besettled with respect to the various items included in the
accounts We briefly outline some major problems and the
suggested methods of dealing with them. The three problemsthat we discuss below relate to cost of sales, physical assets,
and financial assets.
4. Cost of SalesThe amount shown against sales for a particular accounting
year adds up the sales revenues earned throughout the year, at
the prices prevailing when the sales actually took place. Thus,the recorded sales reflect an average price index for that year,
weighted by the quantities sold in various periods.The costs of sales, however, are not recorded at a similar
average price for that year. This is because many items included in costs were bought in earlier years. A company normallyhas at the beginning of the year an inventory of finishedaoods, semifinished goods, raw materials and stores and spares
During the year, it simultaneously uses up this inventory andadds to it* Depending on whether the former or the latteris higher, the year-end inventory is smaller or greater than thestarting inventory. However, the fact remains that at leastsome of the products sold by a company during a year are
either themselves carried over from earlier years or are pro
duced using materials carried over from earlier years. Theway the costs of the materials used are recorded depends
uoon the accounting convention. The convention normallyadopted in India is called First-In, First-Out (FIFO) basis.This assumes that for the output sold in a particular year
the beginning of the year inventory is used up first, and
onlvthen the purchases of materials during that year are
utilised. Under historical cost accounting, therefore, the costs
of sales would reflect costs of material in earlier years to theextent current sales use the beginning of the year inventory.
During inflation, this would give rise to an overestimate otprofits part of which are actually inventory gains. Suppose a
firm simply holds on to its inventory for a year and sells it off-It will realise more than the historical cost since prices willhave moved up. But the difference cannot properly be called
- ,1 __.i-_i~ «r *Ua fooiic^ri dmnunt will be neces~

Inflation Accounting 17
sary to buy materials afresh and bring the inventory to the same
level as earlier. Thus, it is argued that this amount, included in
profits as arrived at by the traditional accounts, is an illusory
inventory profit, and should be corrected for.
One of the ways to eliminate overestimation of profits in this
manner is to reject FIFO and adopt LIFO (Last-In, First-Out)
basis of inventory valuation. This, contrary to FIFO, assumes
that the latest purchases of materials and additions to inven
tory are used up first for the sales during a year. This ensures
that as long as the closing inventory is higher than the begin
ning inventory, the whole of the material cost of sales reflects
the prices of that year. Only when there is a dip in the inven
tory, the material cost reflects prices of earlier years. This is an
optional way of accounting available to U.S. companies, even
for tax purposes.
Given the opening and closing inventories and the purchases
made during the year, the materials used can be identified as:
materials used=opening inventory+purchases—closing inven
tory. An alternative method of eliminating illusory inventory
profits suggests that by dividing the opening and closing inven
tories by appropriate price indices they can be expressed in real
terms and then by applying some average price index for the
year, the difference can be made to reflect the same price level
as sales. Purchases can then be added to this figure (which
will be negative whenever inventories are rising) to yield the
cost of materials used. This estimate will eliminate the illusory
inventory profits.
Of the two, the latter seems preferable for two reasons.
First, whether prices are falling or rising, it works equally well,
whereas LIFO will really hurt the companies when prices fall
just as FIFO hurts them when prices are rising. Second, when
prices rise very fast, LIFO causes an overstimation of the cost
of materials used just as FIFO causes an understimation This
will be true particularly if most of the sales take place in the
earlier part of the year and most of the materials are purchased
in the latter part of the year, prices rising considerably in the
meanwhile. However, FIFO is easier for the accountants.
5. Physical Assets and Depreciation

18 Inflation Accounting and Corporate Taxation
shown in the accounts at the prices at which they were purchas
ed and depreciation is calculated thereon, whether by straight-
line (SL) method or by written-down-value (WDV) method.
With these rules under stable prices, at the time the asset-life is
over, the firm will have enough funds to replace an asset with
an exactly similar one. However, when prices are rising, the
accumulated depreciation at the end of the asset-life will not be
enough for this purpose. Looked at in another way, the ex
penses in terms of wear and tear of the physical assets are not
adequately provided for in units of money. This results in
overestimation of profits. Moreover, when assets are sold, the
loss (gain) on the sale may be less (greater) than what it would
have been under stable prices, as the resale price would defini
tely be linked to the prices of new assets. Since the loss (gain)
on the sale of assets is included in the profit and loss account,
these would also tend to overstate profits solely due to infla
tion. This, however, does not rule out altogether the possibility
of a real loss (gain) due to resale of assets.
But even if one concedes the inappropriateness of historical
costs, it is very difficult to choose an alternative to it. There
are various alternatives suggested.
(a) A simple alternative suggested is sale price, or 'exit
value', or 'net realizable value'. However, this concept fails in
the case of assets specific to a firm. Also, it does not allow for
the difference between a 'going' and a 'dying' concern.
(b) Another suggestion is that asset valuation should be
done on the basis of future net receipts, or the discounted
future cash flow. This method is very much prevalent in capital
budgeting, but has problems of its own. Apart from the sub
jectivity involved in forecasting the future income stream, it is
useful only for valuing additions to the physical assets, but not
for all physical assets. When a company starts with a number
of various physical assets, even if it can estimate the future
cash flow, it is impossible to allocate it among the different
assets.
(c) A very popular alternative is replacement cost or 'entry'
price. This is reasonable conceptually, but there may be a
number of practical problems. The foremost among them is
that more often than not an asset is not replaced in the true
Inflation Accounting 19
nological progress brings about improvements in the efficiency
of a machine performing a given service, so that the improved
version cannot be said to just replace the earlier model. More
over, if the asset is not subject to frequent market tradings, in
formation on replacement cost becomes scanty. It has been
suggested that if the information on replacement cost cannot be
collected from the market, it can be estimated by blowing up
the historical cost of the asset with a suitable price index. But
then the problem of choosing the 'suitable' price index again
crops up. However, this issue is tied to the choice between
CCA and CPP or any combination thereof and does not involve
a fresh choice.
Allowance for depreciation creates some further problems.
Under stable prices the usual depreciation formulae allow a
firm to replace the asset with an identical one with the accumu
lated depreciation allowed. But if prices are not stable, none
of them do, and the divergence between replacement cost and
accumulated depreciation becomes larger the less accelerated
the depreciation formula is.
There are some who assert that even when depreciation is
based on the historical cost, it would suffice to cover the re
placement cost, if the return (interest) on the cash flow generat
ed by depreciation is taken into account. However, it can easily
be shown that even when the rate of return on depreciation is
the same as the rate of inflation, this will not be true. For this
to be true, the rate of return has to be much higher than the
rate of inflation.
If the rate of return on depreciation is not considered, irres
pective of whether it is provided on the basis of current or re
placement cost, the accumulated depreciation will not be enough
to cover replacement cost. This is known as the backlog
problem, discussed at length in the Sandilands Committee
Report. However, if depreciation based on replacement cost
earns a rate of return exactly the same as the rate of inflation,
then the accumulated depreciation plus the rate of return
thereon would exactly be enough for replacement of the asset.
If no rate of return on allowed depreciation is assumed, the
backlog problem has to be taken into account. Lief Johansen
(1965, pp. 242-244) has devised a formula to take into account
backlog depreciation.

20 Inflation Accounting and Corporate Taxation
6. Financial Assets and Interest
Besides having physical assets, a company has financial
assets and liabilities too. The assets can be cash in hand, money
in the bank and interest-bearing bonds. Liabilities, on the
other hand, include share-holders' capital, loans, etc. Some of
the financial assets and liabilities are short-term in nature,
whereas the others are long-term.
With inflation, a company loses on financial assets as the
same assets command a smaller amount of real resources, but
gains on financial liabilities as the cancellation of these liabili
ties requires a smaller sacrifice in real terms. If differences in
the price movements of specific items are ignored, it follows
that a net borrower is a gainer and a net lender is a loser during
an inflationary period. So far as monetary assets and liabilities
are concerned, the relevant price movements are more or less
in line. Hence, adjusting all the items with a single index may
not be very much off the mark.
If some of items on the financial assets of liabilities side are
traded in the market they will have market prices. These market
prices may not equal the figures adjusted on the basis of the re
levant price index. In that case, another choice crops up for the
items that are traded in the market, i.e., whether to account for
gains (losses) on the basis of the market price or on the basis
of the adjusted historical price. A third a'ternative to record
the gains (losses) is to use both, as described earlier (p. 15)while discussing the method suggested by Baxter. The change
in the market price has two components, real and nominal.
The nominal part can be deducted by using the price index and
the rest, which can be called real gain or loss, can be accounted as income or expenditure.
Another problem about financial assets and liabilities is
with regard to the timing of the inclusion of such gains or
losses in the accounts. The problem is exactly the same as the
one that arises in the case of capital gains - whether to include
them in their income during accrual or at realisation. Sometake the view that realisation basis is proper because even afteraccrual, if gains are not realised, they are only notional.1 But
to the extent that future income pays for present consumption,
, for example, Schultz (1976), pp. 14-15.

Inflation Accounting 21
this argument becomes invalid.
One of the adjustments in the profit and loss account which
is sometimes advocated is that interest payments should also be
adjusted for inflation and the difference between adjusted
interest payments and actual interest payments should be taken
as income. This adjustment may have some point, but to the
extent that interest rates have an inflationry element built into
them (i.e., the rate of interest is higher by the extent of expected
inflation than the rate that would have prevailed in the absence
of any expected inflation), it loses its bite. The gain in interest
payments due to unforeseen inflation only can then be regarded
as income.
7. Review of Selected Studies
In this section, we briefly review some previous studies in
this field. Since our ultimate concern is the impact of inflation
on the taxation of capital income in the corporate sector, we
concentrate on studies that have attempted to estimate such
impact.
First, we show for illustration purposes, the impact of in
flation accounting in respect of two Indian companies, both of
the public sector. These two government companies are
Hindustan Machine Tools (HMT) and Bharat Heavy Electricals
(BHEL). The accounts relate to the financial year 1978-79 for
HMT and 1976-77 for BHEL.
Table 3.1
Adjustments for Inflation for Deriving Profits of Two
Indian Companies
(Rs. million)
Depreciation adjustment
Cost of sales adjustment
Total inflation adjustment
Profits before tax
Adjusted profits before tax
HMT
23.8
50.3
74.1
144.8
70.7
BHEL
128.9
16.9
145.8
629.5
483.7
Source: Respective Annual Reports.
The percentage reduction in profits before tax for HMT

22 Inflation Accounting and Corporate Taxation
and BHEL is 51.2 per cent and 23.2 per cent respectively. The
adjustments, strictly speaking, are incomplete because the
adjustments for financial liabilities and assets are not included
in the above calculations. Since the companies are likely to
have positive net financial liabilities their profits would increase
to some extent and may even cancel the adjustments reproduc
ed above.
The above adjustments were carried out by the companies
themselves. An Institute of Cost and Works Accountants of
India (ICWAI) study (1975) attempted inflation adjustments
using the CPP approach, employing three alternative price
indices—the GNP deflator, the wholesale price index (WPI) (all
commodities) and the consumer price index (CPI). The exercise
included adjustments for financial assets and liabilities but
excluded those for the inventory of stores and spares. Tax
provision was assumed constant. Reproduced below are their
results for the company Coromandel Fertilizers Limited.
Table 3.2
Inflation Adjustments for Coromandel Fertilizers Limited
(Rs. lakh)
Unadjusted profits after tax
Adjusted profits (using GNP
deflator)
Adjusted profit (using WPI)
Adjusted profit (using CPI)
1957-68
—387.37
—415.96
-422.78
—424.79
1968-69
—62.38
—138.38
— 141.50
—128.41
1969-70
55 50
—25.20
—39.52
-26.47
It is evident that at least for this company, the inclusion of
net financial liabilities adjustment did not make the extent of
inflation adjustment negligible.
As regards such exercises for groups of companies, there
have been many in the USA, but very few in India.
Taking the USA studies, we briefly discuss the results
obtained by Tideman and Tucker (1976), Davidson and Weil
(1976), Hart (1980), Shoven and Bulow (1975, 1976) and Feld-
stein and Summers (1979). We also discuss the results of the
calculations bv Jenkins (1977) for Canada. For TnHia wp (,im.

Inflation Accounting 23
marise the adjustments reported in a FICCI report (1979), and
the report of the Study Group on Inflation Accounting (1978).
Shoven and Bulow (1975, 1976) started with the definition
of corporate net income or profit. They discussed both realisa
tion and accrual basis and brought out the fact that the cur
rent accounting procedure combines both. Either way, they
argued, inflation accounting was a must if the accounts were to
depict the position and working of a company in a fair manner.
They used the CPP method for their calculations, but agreed
that CCA is conceptually supeiior. They first estimated the im
pact of the CPP method of inflation accounting (using the do
mestic spending deflator) on depreciation calculations for thirty
firms in the Dow Jones industrial index and for non-financial
corporations in the aggregate. The calculations showed that
with inflation accounting, book depreciation would have gone
up by 38.2 per cent. The effect on the tax bill (for 27 out of 30
companies) would have been to reduce it by S 633 million and
on after-tax profits to reduce them by about 20 per cent. For
non-financial corporations as a whole, the adoption of inflation
accounting would have raised depreciation by about 14 per cent
in 1974. Under the assumption of FIFO accounting for in
ventory, inflation adjustment for the thirty Dow Jones com
panies would have resulted in upward or downward adjust
ments in their profits, depending on whether they were actually
using LIFO or FIFO. For the non-financial companies as a
whole, the before-tax profits would have been less by % 16.2
billion in 1974.
So far as net financial liabilities are concerned, Shoven and
Bulow estimated the gain for the same thirty Dow Jones com
panies as well as for the non-financial companies. For the
former group, the adjustments amounted to $ 5.3 billion com
pared to the total reported net income of $ 16 billion. For the
non-financial companies the adjustments amounted to $ 26.2
billion, or about 40 per cent of their total net earnings.
The overall adjustment for the Dow Jones companies
amounted to an upward revision of their profits by S 7.4 billion.
For the individual companies, however, the directions of adjust
ments differed. Similarly, the adjustment would have been
S 39.4 billion for all non-financial companies, and positive.
The reader must be cautioned, however, about the above

24 Inflation Accounting and Corporate Taxation
estimates. The adjustments that Shoven and Bulow made were
on the historical cost accounts revised on the basis of the Haig-
Simon definition of income, which is based on accruals rather
than realisations. It is the latter which is adopted in the con
ventional accounts. The estimates, it follows, contained two sets
of adjustments, one for shifting to their own accounting methods
and the other for inflation. Their results do not allow us to
separate out these two adjustments and hence one cannot say
how much of the adjustments is due to inflation by itself and
even in what direction it would have been.
Two studies on inflation accounting and its implications for
corporate income tax revenue were presented at a Brookings
conference in 1975. These were published subsequently in the
conference volume [Aaron (ed.), 1976]. We deal with two of
the papers in the volume.
Davidson and Weil (1976) applied the inflation accounting
technique (the CPP method) to the accounts of General Electric
Company and twenty-nine other Dow Jones industrial com
panies. Two things were clearly brought out. One, almost
invariably inflation adjustment (without monetary item adjust
ments) caused profits to fall substantially (or losses to be
higher). Two, adjustments for monetary items, however,
improved the position considerably and for the exceptionally
highly leveraged companies, adjusted profits were higher than
unadjusted profits.
When twenty-four utilities were separately considered, this
point was affirmed. Every company had much higher adjusted
profits (when adjustments for monetary items were included)
than unadjusted profits. Before the monetary item adjustment,
the inflation-adjusted profits were around 65 per cent, on the
average, of the unadjusted profits. These companies had much
more debt than equity, confirming the fact that companies with
high debt-equity ratios are more favourably placed during
inflation.
As regards taxation, Davidson and Weil found that General
Electric Company's taxable income remained almost the same
after inflation accounting for the year 1974. For the twenty-
nine Dow Jones industrials as a group, the taxable income fell
by about 13.5 per cent. But the extent of adjustments (both
positive and negative) in profits for individual companies hav-

Inflation Accounting 25
ing different effective rates of tax worked out to be such that
the adjustments did not affect tax revenues substantially. How
ever, they concluded that since taxpayers as a group would be
net monetary asset holders and since net monetary asset hold
ing reduced income, the adoption of inflation accounting was
likely to cause a fall in income tax revenue.
Another paper in the same volume by Tideman and Tucker
(1976) dealt with inflation accounting results by groups of
industries. Their methodology was different from that of David
son and Weil because they did not use actual price indices like
the latter, but assumed a once-for-all 10 per cent inflation
and a steady 10 per cent inflation, alternatively. Also, taking
actual accounts data for the year 1972, they calculated the
effect of inflation on the corporate income tax payments for the
subsequent years. Their results suggest that all the groups
actually paid less tax than they would have under inflation
accounting in the first year after a once-for-all inflation. But in
the long run they gained significantly with the adoption of
inflation accounting. With a steady inflation they gained even
more significantly.
Among the three major corrections foi inflation, the correc
tions for net monetary assets dominated in the beginning but
in the long run it was depreciation correction which was more
important.
They discussed also other effects of inflation on a corpora
tion. Among other things, they showed that inflation would
have biased investment financing towards debt, causing greater
risks of bankruptcy. Required rates of return rise and more so
for short-lived assets than for long-lived ones. Inflation also
encourages mergers, they pointed out.
The study by Jenkins (1977) relates to Canadian corpora
tions. He used replacement cost figures for depreciation adjust
ments. For inventory valuation adjustments, suitable indices
were prepared from the commodity-wise indices keeping an eye
on the composition of the inventory of various groups. The
third adjustment, that for net monetary assets, was undertaken
on the basis of a general price index. The reference period was
1965 to 1974.
The results of the empirical exercise indicated that deprecia
tion expenses uniformly went up after adjustment. As was to

26 Inflation Accounting and Corporate Taxation
be expected, it was much more important for non-financial
companies than for financial ones. Out of all adjustments, this
was also the most important in terms of magnitude, except in
the year 1974 when inventory valuation adjustment assumed
the highest importance for non-financial companies. Adjust
ments for net monetary assets normally raised the income and
hence tax liability. However, the net effect was to reduce the
income by around 15 per cent for non-manufacturing non-
financial corporations. For financial corporations, the effect of
inflation accounting would have been to raise the income.
Jenkins also brought out the fact that the immediate effect was
greater than the long-term effect of inflation accounting, be
cause the gains through having net monetary liabilities can
celled to some extent the reduction in income due to the other
two adjustments with the passage of time. Jenkins did not cal
culate the impact of inflation on tax payments.
Feldstein and Summers (1979) focussed on the impact of
inflation on the taxation of corporate source income in the
USA. They went beyond inflation accounting and the three
major adjustments in the company accounts, and took into
consideration the change in the tax revenue from the lenders to
the corporate sector as well as from dividend recipients. They
gave an empirical estimate of the net overtaxation of corporate
source income for the year 1977, considering all these adjust
ments. They also calculated the overestimation of income and
the extent of overtaxation due to inflation through depreciation
and inventory valuation only for the years 1954-77. Their results
clearly showed that between 1954 and 1969, the rate of inflation
was not very high, nor were the distortions. But from 1969
onwards the high rate of inflation led to correspondingly large
distortions. The peak was in 1974 when profits were oversta
ted by 61.8 per cent due to these two distortions. The tax
burden would have been 69.5 per cent lower if adjusted profits
formed the tax base instead of the nominal profits.
The authors' comprehensive calculations for 1977 showed
that inflation caused an overstatement of profits by a little
more than S 32 billion. The total effective tax rate on corporate
sector capital income was 66 per cent; without inflation, this
rate would have been only 41 per cent.
The authors gave estimates by industry groups, besides the
Inflation Accounting 27
aggregate estimate. Among the manufacturing industries,
Lumber Products, Paper & Paper Products, Rubber & Miscel
laneous Plastics, and Primary Metals suffered greater overtaxa
tion due to inflation than other industries. Their tax liability
would have been almost zero had inflation not occurred. The
least-affected group was Non-Electrical Machinery, which
would have paid only 17.8 per cent less than its actual tax lia
bility without the inflation.
Peter Hart's paper (Hart, 1980) is based on the inflation-
adjusted accounts prepared by 120 industrial corporations in
the USA, as required by FAS 33. He tabulated the effect of
CPP accounting and CCA on certain items in the accounts for
the year 1979. He showed that the recalculated income from
continuing operations came down to 60 per cent and 61.4 per
cent of traditionally calculated income when CPP and CCA
respectively were used. The return on net asset came down to
7.9 per cent instead of 16.3 per cent. The effective income tax
rate went up to 59.4 per cent and 54.6 per cent from 41.1 per
cent with the use of CPP and CCA, respectively.
He also provided analysis of the inflation-adjusted accounts
of 215 companies divided into five groups. For industrial com
panies the historical-cost return on net assets was 17 per cent,
which fell to 8 per cent when either CPP or CCA was employ
ed. The effective tax rate rose from 39 per cent to 53 per cent.
For financial companies the rate of return fell only slightly,
from 14 to 13 per cent, when historical cost accounting was
substituted by CPP accounting. The effective tax rate did not
change. For retailing trade, the fall in the rate of return was
from 16 per cent to only 5 per cent and the rise in the effective
tax rate was from 42 per cent to 68 per cent when CPP method
was employed. In transportation also similar results were ob
served. For utilities, the rate of return fell from 10 per cent to
4 per cent with the CPP method, and further to 2 per cent with
CCA. The effective tax rates went up from 34 to 62 per cent
and 78 per cent, respectively. The nominal growth of sales for
the five groups turned out to be, on average, about twice the
real growth.
Now to briefly recapitulate the findings of two Indian
studies on the subject.

28 Inflation Accounting and Corporate Taxation
The FICCI study (1979)1 showed that for companies like
India Cements, Hindustan Motors, Tata Iron & Steel Co.
(TISCO), Hindustan Aluminium and Tata Engineering & Locomotive Co. (TELCO) the nominal profits disappeared with
inflation accounting and that the first four actually were incur
ring losses. Some companies, on the other hand, would have
reported higher profits before tax, but by not more than 48 per
cent. A group-wise study showed that inflation accounting
would have reduced profits before tax of companies in the basic
metals group the most (by about 72 per cent) and those of
companies in the utilities group the least (by only about 5 per
cent). The average fall in profits before tax over the various
groups due to inflation accounting is around 33 per cent.
The Study Group on Inflation Accounting (1978) dealt with
the advisability, methods and implications of inflation account
ing in India. It was more in the nature of a survey of the issues
than a set of recommendations on steps to be taken. They did
recommend, however, partial introduction of inflation account
ing (for public sector companies and large private sector
companies), though they did not think it advisable to base the
corporate income tax on inflation-adjusted profits. Some rough
calculations on depreciation adjustment for inflation were also
reported. In 1975-76, the calculations show, the upward re
vision in depreciation would have been about 73 per cent of the
historical cost depreciation for large and medium public limited
companies. For Central government public enterprises, this
figure would have been higher at around 77 percent in 1976-77.
In sum, though the need for inflation accounting is general
ly agreed upon and though the debate on the method to beemployed has come to centre on one of the two-CCA and
CPP—, tnere still remain some areas of disagreement. However,the choice between CCA and CPP is the most important and
most elusive. As for the impact of inflation accounting, the
results of empirical exercises seem to indicate that the gearing
ratio is the key variable. Companies with high leverage would
not gain much (and may actually lose due to the introduction of
FICCI publication actually referred to a study by Ramesh Gupta
and L.C. Bhandari. More details of the study are now available in Gupta(1983), pp. 59-83.

Inflation Accounting 29
rnflation accounting, but companies with low leverage would
certainly gain. In terms of taxation, there are other factors to
be considered, the most important being the extent and type of
inflation accounting allowed and whether its coverage is total.
Complete inflation adjustment with wide coverage (both at cor
porate and personal levels) may not alter the tax revenues very
much. At the disaggregated level, the impact of inflation adjust
ment is, however, quite important.

4. METHODOLOGY AND DATA
In this chapter, we first outline the methodology adopted in
our subsequent empirical estimation of inflation-adjusted profits
and tax, enumerating the assumptions made in the process. We
then discuss the data that have been used for the empirical
estimation. Finally, the method of choosing the sample of
companies is described.
1. Methodology
Some methodological issues have already been discussed in
the preceding chapter in general terms. What is discussed here
is their application to this study.
First, our exetcises are based alternatively on CCA and
CPP, yielding two sets of estimates. Since the debate on the
issue of CCA vs. CPP is still raging, it was thought proper not
to ignore either of the two methods.
Second, among the three major adjustments inflation
accounting requires, we estimate two: depreciation adjustment
and cost of sales adjustment. The third, related to net financial
liabilities/assets, is not undertaken. This is because of the fact
that the method of carrying out this adjustment and the timing
of it are still being debated and, more importantly, the required
information is not available.1
To adjust the depreciation charged, information on the age
distribution of physical assets is required. Since this infor
mation was not available, an assumption had to be made of
necessity. We assume that in the year 1979 (for which we do
the calculations) none of the physical assets were more than
nine years old. In other words, all the physical assets in the
books in 1979 are assumed to have been purchased after 1970.
But even this assumption does not suffice because all the infor
mation we have is on historical costs of gross fixed assets and
JSee Annexure I for more details on ihe method of adjusting net finan
cial liabilities.

Methodology and Data 31
accumulated depreciation on them for a few broad categories of
fixed assets. Taking the change in fixed assets (AGFA) as eq
uivalent to acquisitions of new fixed assets will underestimate
the total GFA in 1979 as can be seen below:
1979
GFA1979 = GFA 1970 + V A GFAr . . . (4.1)/=1971
1979
or "V AGFA, = GFA1979 - GFA1970 . . . (4.2)r=1971
In other words, according to our assumption, all the fixed
assets in the year 1970 are disposed of by the end of 1979, and
A GFA< gives us only net acquisitions, i.e., acquisitions minus
value of fixed assets disposed of in a particular year. Thus, to
estimate the acquisitions of fixed assets from the year 1970
onwards, we have to make another assumption about the
writing off of fixed assets in the books in 1970. We assume that
equal values of these are disposed of every year, so that from
1971 to 1979, the value of assets being disposed of is equal to
GFA1970/9. By adding this amount to the net acquisitions every
year, we estimate gross acquisitions (PUR/) for each year start
ing with 1971 as A GFAr + (GFA1970/9). This also ensures
that the earlier assumption of gross acquisitions for the years
1971 to 1979 total GFA1979 holds true.
Armed with these estimates of age-distribution of the assets
in the books in 1979, we proceed to calculate the inflation-
adjusted values of depreciation on these assets in 1979. Since
the income tax rules allow the use of written-down value
method as the basis of depreciation, we adopt the same method.
This method consists of charging a constant rate of deprecia
tion on the written-down value of the asset (also known as net
fixed asset). Denoting annual depreciation charge by DEP, and
accumulated depreciation on a particular type of asset as ADt'
DEP, = (GFA, - AD,)R, . . . (4.3)
where R is the rate of depreciation. This rate is actually a
constant for a particular asset, though for different assets,
different rates have been prescribed. Since we are working with

32 Inflation Accounting and Corporate Taxation
groups of assets, the composition of these groups would affect
the rate of depreciation each year. Moreover, the rates are also
subject to change depending on the intensity of use of the
asset. Since it was impossible to take into account all these
details, we decided to use the 'effective rate of depreciation',
defined as DEP,/NFA,. Hereafter, R would denote this effective
rate of depreciation.
Now, leaving aside the question of the appropriate price
index and assuming that we know which one is to be used, the
adjusted depreciation charges can be estimated in the following
manner.
Since in 1979 only assets bought after 1970 are in the books,
we observe the progressive position of depreciation allowed on
these assets through the nine years under inflation accounting.
DEP"l971 = PURl971 Rl971
DEPal972 = [(PUR]971 — DEP°197i) Pl972'Pl971 + PURl972] Rl972DEP"l973 = [(PUR1971 - DEPa]97l) Pl973,'Pl971 +
(PUR 1972 — DEP'7i972) Pl973/Pl972+
PUR1973] Rl973"
In the same manner, finally in 1979,
1978
DEP^1979 = |"V \ (PUR, - DEPa() P1979/P/ \ +f = 1971
PUR1979] R1979 • • • (4.4)
This is the formula we use to estimate the adjusted deprecia
tion charge for the year 1979 for different groups of assets.
Pi represents the chosen price index and the superscribed 'a'
denotes 'adjusted for inflation', However, the assumptions in
volved hardly hold for roads, buildings and other construction
work. Normally, these would be fixed assets with quite long
lives, necessitating a different set of assumptions. We calculate
adjusted depreciation for these fixed assets in a different way.
First, we assume that these assets were, on average, n years
old. The value of n can be specified by taking into account the
average age of the sample companies because, in most cases,
these assets will have continued upto 1979 from the inception
-r*U~ ^^-^^^,,-n^r Co^nn^ \\jr> Qccnrnp th'jt npt it1VP«tTnPnt<! in

Methodology and Data 33
this category of fixed assets are not very different from gross
investments, or in other words, A GFA< £r PUR*.
To ascertain what value n should take, we note below the
frequency distribution of the sample companies by age in 1979.
Table 4.1
Age Distribution of Sample Companies
Age Group Number of companies
Upto 10 years 20
Between 11 and 20 years 24
Between 21 and 40 years 26
Between 41 and 60 vears 16
More than 60 years 4
TOTAL 90
It can be seen that 70 out of 90 companies are not more
than 40 years old. Of these, most are between 21 years and 40
years old. Armed with this information, we decided that the
value of n should be 25.2
This would imply that, in 1970, the abovementioned fixed
assets were 15 years old on an average and hence were acquired
in 1955. Then, in 1970, the adjusted NFA would be
NFAa,970 = (GFA1970 - ADl97o) P1970/P1955 _ . , (4.5)
Adjusted depreciation is simply,
DEPai970 = NFAai97o. R1970 . . . (4.6)
For the subsequent years, adjusted depreciation can then be
estimated as:
/-I
DEPa, = FnFA^o. -j-^- + ^T (GFA/ - DEP3,)/=1972
-£- + £ GFA, j R, ... (4.7)
This formula can yield the estimates of adjusted deprecia-
*This decision is also based on the actual age of individual companies
falling in the second and third groups.

34 Inflation Accounting and Corporate Taxation
tion for particular types of long-lived assets for the year 1979.
Adding together adjusted depreciation figures for all types of
assets, we have the total inflation-adjusted depreciation estimate
for the year 1979.
The cost of sales adjustment to eliminate illusory inventory
profits is the one suggested by the Hyde Guidelines which has
been explained in Section 4 of the preceding chapter. Without
repeating the method we give below only the formula:
COSA, = (C, - O,) - ( C /' - O =p—) . . . (4.8)V iC, t To, t I
where COSA refers to cost of sales adjustment, C and O are
closing and opening inventories, respectively, Pt is average
price index for the year t, and Pc and Po are price indices at the
close and beginning of the year, respectively. This estimation
can be done for two groups of inventory which we consider
separately. Adding the adjustments together, we get the total
of the cost of sales adjustment.
Once the magnitudes of these adjustments are calculated,
profits before tax are adjusted accordingly. Taking the same
amount of tax provision as given in the books (based on the
historical cost figures), we recompute the effective tax rate.
The difference between the actual and adjusted effective tax
rates measures the over/undertaxation under the corporate
income tax. From the adjusted profits before tax. tax provision
and dividends (the same amounts as shown in the original
accounts) are deducted to arrive at the figure for retained pro
fits, after allowance for inflation is made. We then examine
this figure to draw conclusions about self-generation of capital
funds in the corporate sector in India.
The sample estimates are blown up for the populations as a
whole for each age-group separately, because that was the
characteristic on the basis of which the sample was selected
separately for each group, using the PPS (probability propor
tional to size) method. For other groupings (based on industry
affiliation or size), the blowing up is not undertaken as that
would have been statistically incorrect. The size groups and
industry groups have been constructed from among the sample
companies which were selected on the basis of age. Hence,
except groupings based on age, other groupings do not consti-

Methodology and Data 35
tute representative samples.
2. Nature and Availability of Data
The primary source of data for this analysis has been the
annual reports of the individual sample companies, which
contain the accounts for the current year and the previous
year. Wherever necessary, the Directors' Report was also
used. This source provided all the financial data for the sample
companies.3
The price data were collected mainly from Chandhok
(1974). which brings together the official data at one place. For
the later years, figures from official publications were used.
Since figures under the different items in the various
accounts are not always calculated and presented with the same
underlying definition in the various annual reports, care was
taken to recalculate them to conform to a single definition of
each item, as far as possible.
The industry affiliation of each company was decided on
the basis of its major sales item. When no particular industry
affiliation could be decided upon, the company was put in the
'miscellaneous' category.
The major raw materials consumed were decided upon
from the information given in the annual reports about funds
spent on each item of raw materials.
3. The Sample
The sampling was done with the help of the Factsheets
(1980) which gives some details of all large and medium non
government public limited companies. The population was
further narrowed down to only non-financial and non-service
companies. For the government companies, the population
consisted of the non-financial, non-service companies owned by
the Central government. The information on these companies
was obtained from the Report of the Bureau of Public Enter
prises (1981). The total sample size was 90, with 72 private
companies and 18 government companies. The 72 private com
panies were selected in three groups of unequal size, after the
"Despite our best efiTorts, some gaps remained in the data which had to
be estimated by us. But such gaps were only few.

36 Inflation Accounting and Corporate Taxation
population was separated out into three groups on the basis of
their date of registration as a public limited company—those
registered before 1960, those registered in or after 1960 but
before 1970, and those registered in or after 1970. The sample
for government companies, however, was selected as a wholewithout any classification.
The sampling was done using the PPS (probability propor
tional to size) method, where size was determined on the basis
of paid-up capital. This ensured maximum coverage in terms
of paid-up capital without damaging the advantages of random
samDling, given the size of the sample. The sample coverage
for government companies is approximately 26 per cent. Those
for the three age-groups of privately-owned non-financial public
limited companies are: about five per cent for companies regis
tered before 1960, about eight per cent for companies registered
between 1960 and 1970, and about five per cent again for the
relatively new ones, registered after 1970.

5. THE INVENTORY ADJUSTMENT
1. Details of Calculations
The method of calculating the cost of sales adjustment
(COSA) has been explained earlier. In this chapter, we present
the results of applying the method to the sample as a whole as
well as to the various groups within the sample. Since the
sample was selected for government and non-government com
panies separately, we have two groups. The non-government
companies were further sub-divided into three age-groups from
which samples were drawn. This gives us three sub-groups.
Moreover, after the total sample for the non-governmental
companies was drawn, we subdivided the sample using two
additional criteria: the size of the company (as denoted by sub
scribed share capital) and the industry affiliation. The classi
fication based on industry affiliation was deliberately done in
a way to correspond with the disaggregated price indices and a
particular company was assigned to a particular industry if
more than half of its sales were of a commodity (or commodi
ties) included in that industry as per the standard classification
used in the wholesale price index (WPI). Some of them could
not be so allocated, and were clubbed together in the 'miscel
laneous' category. Thus, in all, we had twenty groups of com
panies as given below:
Group 1
Group 2
Group 3
Group 4
Group 5
Group 6
Group 7
all selected companies;
all government companies;
all non-government companies;
companies with a subscribed share capital of
Rs 50 lakh to Rs 1 crore;
companies with a subscribed share capital of
I crore to Rs 5 crore;
companies with a subscribed share capital of
Rs 5 crore and above;
companies registered as public limited before

38 Inflation Accounting and Corporate Taxation
Group 8 : companies registered as public limited after
1960 but before 1970;
Group 9 : companies registered as public limited after
1970;
Group 10 : other food articles and iron ore (1);
Group 1 1 : fuel, power, light and lubricants (2);
Group 12 : dairy products, grain mill products sugar and
beer (3);
Group 13 : textiles (4);
Group 14 : chemicals and chemical products (5);
Group 15 : ceramic tiles, glass and glass products, cement
and asbestos brake lining (6);
Group 16 : basic metals and alloys (7);
Group 17 : non-electrical machinery (8);
Group 18 : electrical machinery, apparatus and appliances
(9);
Group 19 : transport equipment (10);
Group 20 : not elsewhere classified (II).
As is obvious, groups 2 and 3 are with reference to owner
ship, groups 4 to 6 are with reference to size, groups 7 to 9 are
with reference to age and groups 10 to 20 are with reference to
industry affiliation. While blowing up the adjustments, how
ever, only the age classification can be used since the sampling
was done after stratifying the population on this basis. The
other classifications have been undertaken only to indicate the
varying impact of inflation adjustments. Since size, age, and
industry classification are with reference to non-government
companies only, the blowing up of the calculated COSA for
group 2 has to be done separately.
For all groupings except industry classifications only the
CPP (constant purchasing power) method would be applied,
since we have not undertaken the massive task of using CCA
(current cost accounting) for each individual company. The
industry classifications were primarily intended to show the
impact of CCA, though if it were actually adopted and each
individual company adjusted its accounts accordingly, the
industry group totals might have been different from those cal
culated by us, since within each group, individual companies

The Inventory Adjustment 39
are affected by inflation in varying degrees. Anyway, our use
of CCA is limited to industry groups in this exercise. We also
use CPP for the industry groups.
The adjustments were done separately for the stock of fini
shed goods and raw materials, work-in-progress being consider
ed as raw materials for this purpose These adjustments were
later added up to arrive at the final figure for COSA.
Choosing the exact price index for the use of CPP method
is difficult. We decided upon using three alternative indices—
the consumer price index (CPI), the wholesale price index
(WPT) and the implicit GNP deflator (TGD).
2. Estimates of COSA
Tables 5-1.1 through 5-1.9 give the calculated COSA forthe first nine groups (i.e., those excljding the industry groups)
based on CPI, WPT and fGD. Tables 5-2.1 through 5-2.II give
the same for the eleven industry groups, plus COSA based on
specific price indices (CCA). For the last industry group (mis
cellaneous), no specific price index can be used, hence no additional column for this. The other ten pairs of specific price
indices were chosen (or prepared) after noting the major sales
item(s) of and major raw material(s) used by the companies
falling in each group. When a composite price index was pre
pared by us from individual indices given in the Wholesale Price
Statistics, they were weighted using the same weights which are
used in calculating the general wholesale price index (base =
1970-71). Obviously, there are too many approximations in
volved in these calculations to be called CCA, but these calculations are. in any case, only indicative of direction and broadmagnitudes. Our ultimate conclusions are based on only Tables
5-L2 and Tables 5-1.7 to 5-1.9 because the blowing up of the
adjustments for the population can be done only using the
same route used while selecting the sample (which was by stra
tifying the population on the basis of ownership and age of the
companies). The details of the indices used for the adjustments
are given in the Annexures.
From the results of our calculations, it is seen that so far as
the direction of the adjustments is concerned, it is predominant
ly positive, implying that historical cost accounting profits are
generally overstated on this particular account (inventory valua-

40 Inflation Accounting and Corporate Taxation
Table 5-1.1
COSA for All Companies
Year Using CPI Using WP1
(Rs. '000)
Using IGD
1970-71
1971-72
1972-73
1973-74
1974-75
1975-76
1976-77
1977-78
1978-79
11U935.05
177008.56
528364.13
670994.44
21798.94
164372.74
-56176.27
112526.62
92034.00
45119.03
225728.12
465068.45
511594.59
—256615.17
380681.53
233299.93
41930.34
1887770.40
57503.27
134040.25
286193.02
802649.86
410980.01
— 387063.22
6 32515.02
45290.98
296206.60
Table 5-1.2
COSA for All Government Companies
(Rs. '000)
Year
1970-71
1971-72
1972-73
1973-74
1974-75
1975-76
1976-77
1977-78
1978-79
Using CPI
69953.64
111461.45
333599.40
442248.28
19472.37
123292.50
—47330.66
86824.27
83537.95
Using WPl
29363.98
141999.60
293702.97
333400.30
—191965.27
286172.47
175107.33
32582.84
1407207.51
Using IGD
36708.50
83959.74
181669.26
538033.45
306714.54
—287823.94
483777.60
44328.33
219911.17

The Inventory Adjustment 41
Table 5-1.3
COSA for Non-Government Companies
(Rs. '000)
Year
1970-71
1971-72
1972-73
1973-74
1974-75
1975-76
1976-77
1977-78
1978-79
Using CPI
40981.42
65547.14
194764.78
228746.21
2326.57
41140.25
-8845.57
25702.34
8496.04
Using WPl
15755.05
83728.56
171365.54
178194.32
666699.93
94509.08
58192.61
9347.49
400563.00
Using IGD
20795.77
50080.63
104703.80
264606.48
104265.44
-95169.29
148737.36
1062.69
71215.45
Table 5-1.4
COSA for Companies with Subscribed Share Capital
ofRs. 50 lakh—Rs. 1 crore
(Rs. '000)
Year
1970-71
1971-72
1972-73
1973-74
1974-75
1975-76
1976-77
1977-78
1978-79
Using CPI
12403.14
19674.75
60521.30
71912.95
-272.88
9355.74
—1815.10
5835.26
846.21
Using WPl
5035.52
25100.54
53235.24
56106.20
—17511.99
23754.58
13647.98
2083.82
96866.28
Using IGD
6424.86
9932.18
32359.59
82982.61
28449.92
—27201.95
34429.94
—1347.35
17409.75

42 Inflation Accounting and Corporate Taxation
Table 5-1.5
COSA for Companies with Subscribed Share Capital
of Rs 1 crore—Rs 5 crore
(Rs '000)
Year
1970-71
1971-72
1972-73
1 973-74
1974-75
1975-76
1976-77
1977-78
1978-79
Using CPI
22099.52
35899.78
103174.96
116838.36
1567.32
21683.15
-9375.80
15164.35
6774.85
Using WPl
8091.12
45880.97
90822.58
91093.47
—33807.57
49694.74
30701.02
5551.70
238779.64
Using IGD
11015.81
27502.81
55973.02
134974.32
54443.4O
-49910.33
86702.89
2065.07
43912.10
Table 5-1.6
COSA for Companies with Subscribed Share Capital
of above Rs 5 crore
(Rs '000)
Year
1970-71
1971-72
1972-73
1973-74
1974-75
1975-76
1 976-77
1977-78
1978-79
Using CPI
6478.77
9972.60
31068.51
39994.91
1032.13
10101.36
2345.33
4702.73
874.98
Using WPj
2628.41
12747.02
27307.80
30994.67
—13330.35
21059.77
13843.61
1711.99
74937.06
Using IGD
3355.10
7645.53
16371.17
46649.56
21372.17
—18127.00
27604.53
244.96
14893.59

The Inventory Adjustment 43
Table 5-1.7
COSA for Companies Incorporated before I960
(Rs '000)
Year
1970-71
1971-72
1972-73
1973-74
1974-75
1975-76
1976-77
1977-78
1978-79
Using CPI
32409.96
50980.82
150816.43
177049.06
698.69
28543.35
—8658.09
18797.06
6118.88
Using WPl
12863.48
65123.05
132707.29
137784.21
—47542.70
67680.44
40790.49
6835.62
293048.13
Using IGD
16644.08
38955.14
81196.50
205132.98
76907.56
—71246.88
108555.13
681.83
55844.53
Table 5-1.8
COSA for Companies Incorporated between
1960 and 1970
(Rs '000)
Year
1970-71
1971-72
1972-73
1973-74
1974-75
1975-76
1976-77
1977-78
1 978-79
Using CPI
6511.59
11000.84
32147.72
36756.19
1419.20
10096.46
1062.09
4988.23
2732.85
Using WPl
2119.64
14069.39
28284.18
28818.59
—12616.94
20548.98
13758.84
1784.58
70718.07
Using IGD
3116.20
8459.40
17267.27
37077.01
20116.88
—16891.56
29653.81
—1009.31
12359.35

44 Inflation Accounting and Corporate Taxation
Table 5-1.9
COSA for Companies Incorporated after 1970
(Rs '000)
Year
1970-71
1971-72
1972-73
1973-74
1974-75
1975-76
1976-77
1977-78
1978-79
Using CPI
2059.87
3565.49
11800.64
14940.98
208.68
2500.44
—1249.56
1917.05
—355.69
Using WPl
771.93
4536.11
10374.08
11591.53
—4490.29
6279.66
3643.29
727.29
36796.78
Using IGD
1035.48
2665.93
6230.02
17396.50
7231.00
—7100.86
10528.42
1300.16
8011.57
Table 5-2.1
COSA for Companies under Industry Group 1
(Rs '000)
Year Using CPI Using WPI Using IGD Using CCA
1970-7J
1971-72
1972-73
1973-74
1974-75
1975-76
1976-77
1977-78
1978-79
62.23
109.18
297.75
217.20
1.03
35.85
—110.63
52.53
69.38
26.38
138.27
263.18
174.44
—45.01
71.68
49.88
18.29
581.02
32.70
79.67
173.33
238.76
62.67
-56.82
307.63
—30.85
70.05
—54.02
—125.94
85.78
386.63
29.13
92.73
-597.20
—466.98
675.39

The Inventory Adjustment 45
Table 5-2.2
COSA for Companies under Industry Group 2
(Rs '000)
Year
1970-71
1971-72
1972-73
1973-74
1974-75
1975-76
1976-77
1977-78
1978-79
Using CPI
134.75
179.61
505.98
525.09
6.19
75.69
—15.51
55.93
64.26
Using WPl
65.44
230.03
445.29
419.06
—125.14
180.22
108.22
23.27
1257.96
Using IGD
75.06
139.13
273.17
583.53
201.43
—190.78
275.14
121.48
205.94
Using CCA
254.43
160.02
871.02
100.70
405.89
—11.78
39.32
78.31
3825.40
Table 5-2.3
COSA for Companies under Industry Group 3
(Rs '000)
Year
1970-71
1971-72
1972-73
1973-74
1974-75
1975-76
1976-77
1977-78
1978-79
Using CPI
2791.33
4745.79
11499.89
9821.95
386.96
1279.19
—742.08
1096.98
954.98
Using WPl
872.69
6074.18
10154.08
7727.51
—3323.67
4250.57
2056.09
417.20
18871.21
Using IGD
1315.16
3660.70
6603.65
11180.37
5299.01
—6176.28
6006.22
781.86
3097.42
Using CCA
8843.36
8317.03
1492.03
8774.32
—2998.23
2024.95
—1351.72
—4699.54
20571.84

46 Inflation Accounting and Corporate Taxation
Table 5-2.4
COSA for Companies under Industry Group 4
(Rs '000)
Year
1970-71
1971-72
1972-73
1973-74
1974-75
1975-76
1976-77
1977-78
1978-79
Using CPI
11872.31
18545.64
54450.69
66692.15
—8.24
10153.95
—1595.42
6296.18
1832.87
Using WPl
4509.85
23734.45
47893.47
51729.67
—17645.18
24648.54
14599.72
2305.97
101269.65
Using IGD
5997.88
14321.05
29090.09
76680.39
28605.12
—26704.01
36225.58
895.50
19548.81
Using CCA
—23820.21
15044.18
63730.14
—12657.31
—44587.15
94574.13
-21756.05
—28860.94
16081.18
Table 5-2.5
COSA for Companies under Industry Group 5
(Rs '000)
Year
1970-71
1971-72
1972-73
1973-74
1974-75
1975-76
1976-77
1977-78
1978-79
Using CPI
8591.90
13092.38
42977.28
52465.14
1242.33
13479.23
—3614.67
8463.87
6767.63
Using WPl
3179.98
17993.83
37300.42
40742.52
—16984.91
27321.15
18403.28
3104.42
118197.00
Using IGD
4299.57
10743.37
22945.00
60995.01
27248.03
—22274.87
48466.64
1388.80
20692.37
Using CCA
—721.89
6331.98
23242.06
92755.22
-7720.22
—3638.54
—1724.17
18188.68
100104.17

The Inventory Adjustment 41
Table 5-2.6
COSA for Companies under Industry Group
(Rs '000)
Year
1970-71
1971-72
1972-73
1973-74
1974-^5
1975-76
1976-77
1977-78
1978-79
Using CPI
996.38
1600.90
4951.31
6237.02
59.89
1293.82
36.16
663.50
—147.49
Using WPl
366.86
2047.08
4352.06
4854.42
-1764.41
2722.61
1780.68
232.49
9638.19
Using IGD
497.67
1329.88
2610.01
7224.90
2846.40
-2383.54
4014.93
—334.88
1646.78
Using CCA
783.69
411.40
5996.08
8409.93
—216.56
—1691.76
1362.00
3538.94
4029.80
Table 5-2.7
COSA for Companies under Industry Group
Year
1970-71
1971-72
1972-73
1973-74
1974-75
1975-76
1976-77
1977-78
1978-79
Using CPI
2883.94
4772.25
16531.52
20130.53
—3.00
2964.40
200.86
1473.06
—734.83
Using WPl
1146.24
6076.90
14518.40
15967.22
—4426.10
6535.46
4133.38
504.87
20372.00
Using IGD
1481.82
3585.76
8569.34
22606.61
7175.48
—6189.91
9115.12
—704.31
4913.77
(Rs '000)
Using CCA
2763.53
3845.13
25417.29
9155.58
8536.18
794.05
831.36
10788.93
17509.47

48 Inflation Accounting and Corporate Taxation
Table 5-2.8
COSA for Companies under Industry Group
(Rs '000)
Year
1970-71
1971-72
1972-73
1973-74
1974-75
1975-76
1976-77
1977-78
1978-79
Using CPI
4428.71
6989.00
21238.00
24841.29
374.34
4215.75
—325.52
2493.70
—164.11
Using WPl
1770.36
8923.85
18681.00
19449.97
—7084.44
10153.20
6043.04
911.59
41622.27
Using IGD
2280.54
5327.96
11353.25
28401.09
11398.20
—10907.78
14408.91
284.20
8850.40
Using CCA
4011.36
5976.20
25537.65
15583.08
11717.44
892.48
2723.14
14603.10
34887.23
Table 5-2.9
COSA for Companies under Industry Group 9
(Rs '000)
Year
1970-71
1971-72
1972-73
1973-74
1974-75
1975-76
1976-77
1977-78
1978-79
Using CPI
2620.25
3948.04
10607.08
12808.57
—41.40
2044.12
—900.14
1445.29
191.26
Using WPl
1075.13
5051.28
9346.21
9717.92
—3838.46
3503.52
520.13
1085.88
22105.12
Using IGD
1362.85
3042.25
5860.91
15435.73
6231.74
—5987.25
8423.11
-194.56
4452.79
Using CCA
1227.13
2058.42
8686.47
16692.93
991.69
-1013.76
543.45
6219.53
17165.43

The Inventory Adjustment 49
Table 5-2.10
COSA for Companies under Industry Group 10
(Rs WO)
Year
1970-71
1971-72
1972-73
1973-74
1974-75
1975-76
1976-77
1977-78
1978-79
Using CPI
3271.60
5446.47
15804.30
16251.44
226.90
2843.22
—203.76
1625.17
— 189.47
Using WPl
1223.84
6945.73
13918.41
12851.27
—4265.22
6371.37
3987.74
588.24
26335.90
Using IGD
1643.54
4124.96
6647.62
18343.56
6861.99
—6188.48
9488.98
—53.23
6666.09
Using CCA
3769.29
4785.93
17139.46
11093.73
6236.85
29.56
1259.97
10766.85
24139.53
Table 5-2.11
COSA for Companies under Industry Group 11
{Rs '000)
Year
1970-71
1971-72
1972-73
1973-74
1974-75
1975-76
1976-77
1977-78
1978-79
Using CPI
3462.75
5297.48
16406.84
19280.93
87.74
2830.72
-1590.34
2092.10
—84.15
Using WPI
1583.73
6743.99
14438.29
14979.41
—5272.52
7225.49
4148.06
744.96
31569.52
Using IGD
1880.90
3974.93
8850.53
22400.08
8526.75
—8326.40
12280.22
—569.91
6626.96

50 Inflation Accounting and Corporate Taxation
tion). In a few cases, it is negative but the maximum overstate
ment is far higher than the maximum understatement within
each group. It would probably be desirable to note the over or
understatements as percentages of the profits before tax, but
that is postponed until we come to the blowing up of the
sample estimates for the population as a whole. It will suffice
here to note that most of the adjustments are substantial rela
tive to the profits before tax and therefore quite important.
The adoption of the general wholesale price index for the
CPP method reveals a fixed pattern in the adjustments across
groups, indicating that profits were overstated every year except
in 1974-75. In general, the overstatement in the last year under
observation (i.e., 1978-79) is far higher than in the other years.
If we use the consumer price index instead, the year when
most of the groups exhibit understatement of profits due to
inflation is 1976-77. This is true of some groups, due to the
changing prices, also in 1974-75 and/or 1978-79. Thus, the
results of our calculations to find out COSA using the CPI are
not as consistent across various groups of companies as those
of the calculations using the WPI.
If the implicit GNP deflator is used, the COSA turns out to
be negative (i.e.. traditional accounting understates profits) for
the year 1975-76 in the case of all the groups. Additionally, the
results indicate negative COSA for the year 1977-78 for a few
groups.
What all this implies is that even when one says that the
CPP method should be adopted, it is not an unambiguous state
ment. Depending on which index of purchasing power one
chooses, the resultant COSA will be greater or smaller than the
others.
Use of the CCA does clearly show the varying impact of
inflation on various industry groups. For example, while for
industry group 4 (Textiles) we find underestimation of profits
on this count using traditional accounting in five out of the
nine years under observation, industry groups 7 (Basic metals
and alloys), 8 (Non-electrical machinery) and 10 (Transport
equipment) are seen to have reported overestimated profits in
all those nine years. Taking the last year, 1978-79, however, all
the industry groups exhibit positive COSA, implying overesti-
mation of profits due to inflation, which are, generally speaking,

The Inventory Adjustment 51
on the high side relative to the COSA calculated for the earlieryears.
3. Relative Impact of COSA
We shall now examine how inflation affects different
companies which differ with respect to age, ownership, size and
industry affiliations, as far as inventory profits are concerned
To make a proper comparison, we now have to calculate the
COSA as a percentage of profits before tax for the various
groups. To save calculation and space, we consider only the
latest year under observation, i.e., 1978-79. Table 5.3 gives the
results of the calculations.
Table 5.3
COSA as Percentage of Profits before Tax for
the Year 1978-79
L
2.
3.
4.
5.
6.
7.
8.
9.
10.(1)
11.(2)
12. (3)
13. (4)
14. (5)
15.(6)
16. (7)
17. (8)
18.(9)
19. (10)
20. (11)
9
19
2
4
2
1
2
2
—1
*
1
*
2
3
Neg (—)
—2
Neg (-)
1
Neg (-)
Neg (—)
Using WPl
181
324
72
464
62
46
82
46
67
*
27
87
58
20
418
75
84
65
49
Using IGD
30
52
13
83
11
9
16
8
15
*
4
•
17
10
3
101
16
17
17
10
Using CCA
*
82
*
14
49
8
360
62
65
60
— —^ r~..v^ .v ...uuon; giuup i ana so on, which
is indicated by the number within parentheses beside thegroup number.
Neg: negligible (sign within parentheses indicates direction).* negative profits before tax.

52 Inflation Accounting and Corporate Taxation
Comparison of the results for groups 2 and 3 clearly shows
that the impact is far more on government companies than non
government companies. This implies that the illusory inventory
profits are far higher relative to the profits before tax, in govern
ment companies than in non-government companies.
A similar comparison between groups 7, 8 and 9 reveals
that both the old and new companies require less adjustment
for inflation in their accounts than the medium-age group of
companies.
Among the industry groups, the impact of inflation on
profits through inventory valuation is the most in the case of
group 16, unless CPI is adopted for COSA calculations. In
fact, the use of CPI would lead to the result that there is very
little distortion due to inflation in the calculation of profits, at
least in the year 1978-79. COSA is generally highest when the
general WPI is used.
The difference between CCA and CPP is clearly brought
out in the table (5.3), particularly in the results for group 11,
where CPP does not indicate very high COSA (relative to other
industry groups), but CCA does.
Since these results are only for the year 1978-79, they can
not be generalised. However, without giving further tables
along the lines of Table 5.3 for the other years, we make the
observation that the differential impact of inflation through
illusory inventory profits on different groups does, in general,
follow the same pattern as noted above, on the basis of similar
calculations (not reported) for the other years of the reference
period.
Before concluding this chapter, we estimate the cost of sales
adjustment of profits for the population, which consists of
manufacturing public limited companies with paid-up capital of
Rs 50 lakh and above, on the basis of the sample estimates.
Since the sample was selected after classifying the population
into three groups, the blowing up has to be done for these three
age-groups separately and the results added up to arrive at the
population estimate. The blowing up factors are the ratios of
the population group totals to the respective sample-group
totals of paid-up capital which are 20.02, 13.11 and 20.51 for
age-group 1 (registered before 1960), 2 (registered during
1960-1970) and 3 (registered after 1970), respectively. The

The Inventory Adjustment 53
blown up COSA figures would then be Rs 151033 (122500 +
35828-7295) thousand, Rs 7548639 (5866823 +927114+
754702) thousand, and Rs 1444355 (1118007+162031 +
164317) thousand, with the use of the CPf, the general WPI
and the IGD, respectively. The corresponding figures for thegovernment companies are Rs 318280 thousand, Rs 5361461
thousand, and Rs 837862 thousand. The population in this
case, it must be pointed out, consists of only manufacturing
public limited companies owned by the Central government.
The blow-up factor is 3.81, implying a sample coverage ofabout 26 per cent.

6. ADJUSTMENT OF DEPRECIATION
FOR INFLATION
1. Details of Estimation
In Chapter 4 (methodology), we have already discussed the
methods that we adopt to adjust depreciation; they need not
be repeated here. With the availability of data restricted to ten
years, the method used yields adjusted depreciation figures for
only the last year under observation, that is, 1979. As mention
ed in the chapter referred to above, we carry out the adjustment
calculations for five types of fixed assets, the major being 'basic
plant and machinery' which in our classification are denoted as
type 3 assets. The others include buildings and other construc
tion (type I), other plant and machinery (type 2), motor vehi
cles (type 4) and furniture and fixtures (type 5). For roads,
buildings and other construction (type 1 assets) having definite
ly longer lives than other types of assets, a different kind of
adjustment procedure is adopted, as already explained.
These adjustments are done for the twenty groups of com
panies separately, exactly as in the case of inventory adjust
ment. These groups are listed at the beginning of the preceding
chapter.
For all the twenty groups, the adjusted depreciation figures
are arrived at using four sets of price indices, alternatively—the
consumer price index, the wholesale price index for all commo
dities, the implicit GNP deflator and the specific price indices.
In the last case, the price indices used for the five groups of
fixed assets were: a cost of construction index (in Delhi, assum
ing that elsewhere the trend would be more or less the same)
for roads, buildings and other construction; wholesale price
index for manufactured products to adjust depreciation on other
plant and machinery; a simple average of the wholesale price
indices for electrical and non-electrical machinery to adjust
depreciation on basic plant and machinery; the wholesale price
index for transport equipment to adjust depreciation on motor
vehicles, and the wholesale price index for manufactured pro-

Adjustment of Depreciation for Inflation 55
ducts to adjust depreciation on furniture and fixtures.
Since our sample consists of only manufacturing companies,
plant and machinery constitute the bulk of the fixed assets.
Naturally, the depreciation—-adjusted or unadjusted—on this
category of assets dominates total depreciation.
The calculation of adjusted depreciation for the first cate
gory of assets is based on the assumption made earlier that they
were on an average, 25 years old in 1979. That was reasonable
for the sample as a whole (group 1), and for the non-govern
ment companies selected. For all the industry groups and size-
groups also this may be a reasonable approximation. However,
for groups 7, 8 and 9, this was not so by definition and hence
we assume them to be on an average 30, 15 and 5 years old,
respectively. For the government companies also, this assump
tion was modified as they turned out to be 20 years old on an
average.
As in the case of inventory adjustments, the blowing-up of
our estimates is undertaken with respect to the government
companies and the three age-groups of non-government
companies. The blown-up figures for these four groups together
yield the estimate for the population of manufacturing
companies.
2. Results
Tables 6.1 through 6.20 report the result of our calcu
lations. Each table refers to one group of companies, classified
as earlier. The figures refer to the year 1979, the last year
under observation. This is so because the method of adjustment
employed requires data for previous nine years to adjust the
depreciation in the tenth year.
Tt should be noted that due to the approximations made in
the estimation method1 the bias of these estimated values would
be downwards, i.e., these estimates are conservative. Also, the
backlog problem—a controversial issue in the inflation account
ing methods—is ignored here, and no provision for backlog
*Due to insufficient details we had to treat all the estimated purchases
(acquisitions) of assets (and also depreciation on them), which had nega
tive values, as zero, as boih are impossible events. Obviously, such an
estimation would have been unnecessary if we had the actual figures.

56 Inflation Accounting and Corporate Taxation
Table 6.1
Adjusted Depreciationfor all Companies
(Rs WOO)
Type 1 Type 2 Type 3 Type 4 Type 5
assets assets assets assets assets
Using specific 61939.40 71584.78 2047747.25 44428.00 35163.23index
Using consumer 62974.31 70227.76 1920318.63 39818.26 33826.22
price index
Using wholesale 69212.32 71400.95 1990241.43 41184.37 35125.25
price index
Using implicit 57102.17 63339.81 1898077.61 39540.61 33403.06
GNP deflator
Unadjusted 25060.00 77181.87 1320282.00 25614.81 23467.61
Table 6.2
Adjusted Depreciationfor Government Companies
(Rs WOO)
Type 1 Type 2 Type 3 Type 4 Type 5
assets assets assets assets assets
Using specific 12303.85 63355.51 1634313.99 32706.80 24720.09
index
Using consumer 12275.73 62093.96 1535362.71 29294.33 23740.53
price index
Using wholesale 13159.81 63119.15 1588426.54 30274.77 24621.93
price index
Using implicit 11621.84 60465.98 1516220.44 29116.68 23390.78
GNP deflator
Unadjusted 6214.37 66167.94 1074698.50 19482.30 17469.50

Adjustment of Depreciationfor Inflation 57
Table 6.3
Adjusted Depreciationfor Non-Government Companies
(Rs WOO)
Type 1 Type 2 Type 3 Type 4 Type 5
assets assets assets assets assets
Using specific 41073.15 6988.03 413804.48 6717.40 10220.29
index
Using consumer 41529.56 6693.50 385163.17 6266.40 9865.15
price index
Using wholesale 45506.30 6880.93 402027.18 6368.59 10269.14price index
Using implicit 37922.63 6526.46 382122.63 6146.92 9783.63GNP deflator
Unadjusted 13845.70 11013.90 245582.50 6132.50 5998.10
Table 6.4
Adjusted Depreciation for Companies with Share Capital
ofRs 50 lakh—Rs 1 crore
(Rs '000)
Type 1 Type 2 Type 3 Type 4 Type 5
assets assets assets assets assets
Using specific 10978.81 1182.19 77416.06 956.94 2008.57
index
Using consumer 11175.83 1125.93 72270.88 851.84 1942.74price index
Using wholesale 12257.46 1160.63 74968.57 882.65 2020.62
price index
Using implicit 10143.54 1094.34 71533.31 843.95 1915.21
GNP deflator
Unadjusted 4528.20 1089.00 39824.81 550.80 1190.60

58 Inflation Accounting and Corporate Taxation
Table 6.5
Adjusted Depreciation for Companies with Share Capital
of Rs I crore—Rs 5 crore
(Rs '000)
Type 1 Type 2 Type 3 Type 4 Type 5
assets assets assets assets assets
Using specific 19712.83 2962.86 170528.73 4687.37 5227.35
index
Using consumer 19916.49 2859.86 159242.01 4413.77 5040.09
price index
Using wholesale 21821.80 2925.41 165599.46 4468.12 5255.95
price index
Using implicit 18200.13 2801.45 157391.76 4347.77 5007.42
GNP deflator
Unadjusted 9339.90 5466.20 103100.00 4359.20 3050.50
Table 6.6
Adjusted Depreciation for Companies with Share Capital
of above Rs 5 crore
(Rs '000)
Type 1 Type 2 Type 3 Type 4 Type :>
assets assets assets assets assets
Using specific 10784.73 8525.49 158390.53 2104.94 2926.63
index
Using consumer 10774.00 8184.99 146683.94 1865.68 2827.29
price index
Using wholesale 11746.85 8532.08 154480.08 1935.51 2933.61
price index
Using implicit 9915.61 8111.83 146434.82 1851.66 2805.84
GNP deflator
Unadjusted 4977.60 4458.70 102657.91 1222.50 1757.00

Adjustment ofDepreciation for Inflation 59
Table 6.7
Adjusted Depreciation for Companies Incorporated
before I960
(Rs '000)
Type 1 Type 2 Type 3 Type 4 Type 5
assets assets assets assets assets
Using specific 39021.53 6625.27 242380.87 4464.07 6346.32
index
Using consumer 30607.98 6336.98 226206.50 4169.98 6180.91
price index
Using wholesale 31930.06 6520.44 234418.25 4231.87 6392.45
price index
Using implicit 26354.78 6173.47 224820.97 4097.84 6084.28
GNP deflator
Unadjusted 12832.61 8625.80 129641.37 3496.70 3372.40
Table 6.8
Adjusted Depreciation for Companies Incorporated
between 1960 and 1970
(Rs WO)
Type 1 Type 2 Type 3 Type 4 Type 5
assets assets assets assets assets
2457.01
2369.67
2461.95
2354.24
1694.60
Using specific 7468.38 266.10 155289.91 3724.44
index
Using consumer 6805.51 257.58 144583.04 3330.96
price index
Using wholesale 7339.01 263.00 152651.14 3465.92
price index
Using implicit 6788.10 252.75 143110.99 3296.26
GNP deflator
Unadjusted 4466.90 1329.40 106903.09 2355.30

60 Inflation Accounting and Corporate Taxation
Table 6.9
Adjusted Depreciation for Companies Incorporated
after 1970
(Rs WOO)
Using specific
index
Using consumer
price index
Using wholesale
price index
Using implicit
GNP deflator
Unadjusted
Type 1
assets
2153.43
2058.79
2161.97
1977.72
1546.20
Type 2
assets
1256.86
1204.36
1239.64
1192.30
1058.70
Type 3
assets
11876.49
11043.02
11509.97
10809.35
9038.20
Type 4
assets
409.47
366.93
379.36
363.25
280.50
Type 5
assets
1225.74
1177.53
1215.56
1159.30
931.10
Table 6.10
Adjusted Depreciation for Companies under Industry
Group J
(Rs '000)
Using specific
index
Using consumer
price index
Using wholesale
price index
Using implicit
GNP deflator
Unadjusted
Type 1
assets
319.24
324.32
355.67
293.00
125.20
Type 2
assets
0.00
0.00
0.00
0.00
0.00
Type 3
assets
416.33
399.09
405.35
391.77
234.50
Type 4
assets
83.70
73.67
76.43
72.45
36.00
Type 5
assets
111.17
105.77
110.90
104.39
64.20

Adjustment ofDepreciation for Inflation 61
Table 6.11
Adjusted Depreciationfor Companies under Industry
Group 2
(Rs WO)
Type 1 Type 2 Type 3
assets assets assets
Type 4 Type 5
assets assets
Using specific
index
Using consumer
price index
Using wholesale
price index
Using implicit
GNP deflator
Unadjusted
155.80 449.10 483.37 5.62 29.25
159.89 421.79 447.02 5.10 27.71
175.88 439.06 466.76 5.30 28.96
143.82 406.34 441.81 4.93 27.01
72.30 473.80 288.70 7.50 24.10
Table 6.12
Adjusted Depreciation for Companies under Industry
Group 3
(Rs WO)
Type 1 Type 2 Type 3 Type 4 Type 5
assets assets assets assets assets
Using specific 1836.43 450.67 10926.01 155.80
index
Using consumer 1895.53 438.45 10127.94 143.56
price index
Using wholesale 2107.52 446.53 10512.80 146.26
price index
Using implicit 1685.23 428.28 10065.70 140.00
GNP deflator
Unadjusted 586.00 271.40 6102.80 159.70
44.81
43.49
44.33
42.74
50.90

62 Inflation Accounting and Corporate Taxation
Table 6.13
Adjusted Depreciation for Companies under Industry
Group 4
{Rs '000)
Type 1 Type 2 Type 3 Type 4 Type 5
assets assets assets assets assets
Using specific 4397.79 1767.67 91399.28 891.28 —692.23
index
Using consumer 4429.24 1715.29 84967.58 791.07 —665.69price index
Using wholesale 4848.68 1748.63 88049.94 824.36 —695 28
price index
Using implicii 4081.39 1685.59 84938.21 784.51 -664.13
GNP deflator
Unadjusted 3462.50 2668.60 52488.00 474.80 -449.20
Table 6.14
Adjusted Depreciation for Companies under Industry
Group 5
(Rs WOO)
Type 1 Type 2 Type 3 Type 4 Type 5
assets assets assets assets assets
Using specific 12895.33 8906.44 170546.77 2185.32 4984.08
index
Using consumer 12704.50 8549.02 158902.84 2073.02 4816.08
price index
Using wholesale 13767.12 8896.04 167403.37 2093.05 4981.38
price index
Using implicit 11766.45 8454.80 157181.68 2053.45 4770.01
GNP deflator
Unadjusted 6409.90 4868.40 114622.94 2385.50 3119.60

Adjustment ofDepreciationfor Inflation 63
Table 6.15
Adjusted Depreciation for Companies under Industry
Group 6
(Rs '000)
Type 1 Type 2 Type 3 Type 4 Type 5
assets assets assets assets assets
Using specific 4084.81 1184.49 27184.91 2103.72 490.17
index
Using consumer 4208.61 1150.45 25377.00 1905.40 476.70
price index
Using wholesale 4658.43 1200.59 26427.00 1981.29 497.17
price index
Using implicit 3786.49 1138.48 25099.45 1879.43 471.51
GNP deflator
Unadjusted 1450.60 714.40 15036.80 1381.50 317.00
Table 6.16
Adjusted Depreciationfor Companies under Industry
Group 7
(Rs WOO)
Type 1 Type 2 Type 3 Type 4 Type 5
assets assets assets assets assets
Using specific 1282.74 78.03 11463.50
index
Using consumer 1224.24 75.09 10643.57
price index
Using wholesale 1314.61 78.30 11085.76
price index
Using implicit 1161.25 75.58 10528.37
GNP deflator
Unadjusted 725.90 55.20 6610.30
60.27 483.45
53.13 467.93
55.24 488.17
52.73 465.35
32.80 268.60

64 Inflation Accounting and Corporate Taxation
Table 6.17
Adjusted Depreciationfor Companies under Industry
Group 8
(Rs '000)
Type 1 Type 2 Type 3 Type 4 Type 5
assets assets assets assets assets
Using specific
index
Using consumer
price index
Using wholesale 4032.42
price index
Using implicit 3358.19
GNP deflator
3528.70 —199.68 25214.68 476.40 561.94
3683.61 —199.68 23857.47 424.70 537.42
-199.68 24532.52 440.77 553.02
-199.68 23526.70 421.22 523.52
Unadjusted 1523.80 —264.90 13866.10 213.80 788.70
Table 6.18
Adjusted Depreciation for Companies under Industry
Group 9
(Rs '000)
Type 1 Type 2 Type 3 Type 4 Type J
assets assets assets assets assets
Using specific
index
Using consumer
price index
Using wholesale
price index
Using implicit
GNP deflator
Unadjusted
3518.32 1175.30 21007.92 369.63 714.41
3654.83 1135.06 19392.59 334.05 691.36
4073.71 1187.12 20193.56 345.77 719.36
3273.46 1151.26 19306.68 331.01 686.21
1102.80 584.20 9783.80 184.60 331.70

Adjustment of Depreciationfor Inflation 65
Table 6.19
Adjusted Depreciation for Companies under Industry
Group 10
(Rs '000)
Type 1 Type 2 Type 3 Type 4 Type 5
assets assets assets assets assets
Using specific
index
Using consumer
price index
Using wnolesale
price index
Using implicit
GNP deflator
Unadjusted
983.52 3009.10 19611.75 436.25 734.83
954.54 2911.47 18280.29 376.02 708.14
999.25 3010.95 18988.22 393.33 738.01
928.24 2879.53 17980.44 373.38 700.10
944.90 1611.50 12395.60 244.30 451.90
Table 6.20
Adjusted Depreciation for Companies under Industry
Group 11
(Rs WO)
Type 1 Type 2 Type 3 Type 4 Type 5
assets assets assets assets assets
Using specific 7504.13 21.21 18928.15 2129.20 2044.17
index
Using consumer 7805.69 20.38 18102.92 1941.23 1980.41
price index
Using wholesale 8629.59 20.87 18582.57 1990.55 2065.39
price index
Using implicit 6986.69 19.93 17783.48 1912.26 1952.26
GNP deflator
Unadjusted 2441.80 31.30 14153.20 1012.00 1030.60

66 Inflation Accounting and Corporate Taxation
depreciation is made. The estimates would be higher if one
wanted to include them too.
Even these conservative estimates turn out to be substan
tially higher than the depreciation calculated on the basis of
historical costs. The use of specific price indices yields the
highest estimates, generally speaking, implying that the specific
price indices relevant to fixed assets in manufacturing companies
have risen faster than any general price index.
A peculiar feature of the calculations done, as is depicted
in the tables, is the fall in depreciation on some categories of
assets after adjustment, even when prices have shown a rising
tendency. In the case of assets of type 2, this feature can be
observed in many of the tables. The reason can only be the un
satisfactory handling of disposals by us due to the lack of suffi
cient data on those disposed assets. A reassuring fact is that
this problem has not arisen in the case of the most important
category of assets—basic plant and machinery. As a result,
aggregate adjusted depreciation does not show this peculiarity
when seen against aggregate unadjusted depreciation. All the
same, it is a limitation of our study, which can be easily remov
ed if sufficient data on annual disposals and accumulated dep
reciation thereon are available. In any case, as we have already
remarked, this shortcoming only understates the inflation
adjustment figure. If one concludes from these calculations that
inflation accounting would raise allowable depreciation sub
stantially, the removal of the shortcoming would only streng
then that conclusion.
3. Relative Impact of Depreciation Adjustment
To facilitate inter-group comparisons of the impact of
inflation accounting on depreciation provision, Table 6.21 was
prepared using the figures in Tables 6.1 through 6.20.
Taking the first row of Table 6.21, the minimum underesti
mation of depreciation in real terms caused by inflation turns
out to be a little higher than 42 per cent and the maximum
about 54 per cent. This implies that the manufacturing
companies, on an average, are allowed to charge as depreciation
only two-thirds of what they would have with inflation adjust
ment.
Rows 2 and 3 show the impact on government and non-

Adjustment of Depreciationfor Inflation 67
government companies respectively. It is evident that so far as
depreciation is concerned, private companies are hit harder than
government companies by inflation. It may be recalled that
fictitious inventory gains were found to be higher for govern
ment companies than non-government companies.
Similarly, a look at rows 4 through 6, which relate to the
three size-groups, reveals that the impact of inflation has been
the highest on the first size-group (with share capital of Rs 50
lakh to Rs 1 crore) and the lowest on the third size-group (with
share capital of Rs 5 crore and above). Apparently, the larger
the size, the less is the impact of inflation.
Table 6.21
Impact of Inflation Accounting on Depreciation in 1979
—20 Groups
Adjusted total/Unadjusted total (Per cent)
Group Specific Using CPI Using WPI Using IGNPD
1.
2.
3.
4.
5.
6.
7.
8.
9.
10.
11.
12.
13.
14.
15.
16.
17.
18.
19.
20.
0)
(2)
(3)
(4)
(5)
(6)
0)
(8)
(9)
(10)
(11)
153.63
149.27
166.26
196.13
162.09
158.80
189.18
144.93
131.63
202.31
129.63
187.06
166.71
151.83
185.44
173.77
183.43
223.45
158.33
164.05
144.55
140.43
159.08
185.17
152.79
148.02
173.14
134.77
123.31
196.31
122.52
1 76.40
155.58
142.34
175.23
162.02
175.50
210.29
148.45
159.89
149.98
145.23
166.70
193.48
159.65
156.10
179.46
142.34
128.41
206.21
128.80
184.88
161.61
150.02
183.94
169.28
182.04
221.23
154.20
167.60
142.12
138.58
156.60
181.27
149.82
146.97
169.36
133.45
120.59
187.35
118.18
172.39
154.87
140.20
171.30
159.67
171.32
206.46
146.10
153.40
Mote: The numbers within parentheses refer to industry groups.

68 Inflation Accounting and Corporate Taxation
As for the three age-groups, it seems that the older the
company, the larger is the gain due to inflation accounting.
This is what intuition would also suggest, since there probably
would be some cumulative effect of inflation over the years.
Among the industry groups, the highest impact of inflation
appears to be on industry group 8 (Electrical Machinery,
Apparatus, and Appliances), irrespective of the price index
used. The least affected group is industry group 2 (Fuel, Power,
Light and Lubricants), again with any of the four indices.
There is enough \ariation in the impact of inflation on various
industry groups to support the contention that inflation affects
different companies in different degrees.
One feature that needs mention is that so far as COSA is
concerned, inflation accounting using consumer price index
would not have affected profits much, whereas the use of any
of the other three indices would have done so to a substantial
extent. In the case of depreciation the use of any of the indices
would mean a substantial change in the calculated profits. We
postpone the discussion of the relative importance of these two
adjustments to the next chapter.
As in the case of COSA, the blowing up of the depreciation
adjustments are to be undertaken using the estimates for groups
2, 7, 8 and 9 separately and then adding the blown-up figures
of these groups together. In the case of COSA, specific price
indices could not be used for its calculation for these groups as
the inventory of the companies included in these groups consist
ed of heterogeneous items. This is not so in the case of fixed
assets and therefore the blown up adjustment figure for the
population using specific price indices can also be arrived at.
The additional depreciation that the government companies
would have got. using specific, consumer, and general wholesale
price indices and the implicit GNP deflator are, respectively,
Rs 2222554 thousand. Rs 1823979 thousand, Rs 2040520
thousand, and Rs 1740343 thousand. For the non-government
companies as a whole the corresponding figures would have
been Rs 3590914 (2820201+687313 + 83400) thousand, Rs
2906266 (2312980-531840+61446) thousand. Rs 3235549
(2512994+647657+74898) thousand, and Rs 2759327 (2193440
+ 511593+54294) thousand, respectively. Comparing these

Adjustment of Depreciation for Inflation 69
with the respective COSA estimates, we see that these are far
higher and would have reduced taxable profits to a far greater
extent than COSA, with the use of either the consumer price
index or the implicit GNP deflator, but the situation is the
other way round using the general wholesale price index.

7 THE TOTAL IMPACT AND INTERNAL
GENERATION OF CAPITAL
We have now calculated the estimated change in taxable
profits (which we are approximating by using profits before tax
as accounted by the respective companies) due to the two major
adjustments for inflation—COSA and additional depreciation.
The third major adjustment, for gains on net financial liabilities
(short-term and long-term), has not been made due to reasons
mentioned earlier.
1. Alternative Ways of viewing the Total Impact
With the estimates in hand, we can proceed to observe the
tax implications and also the implications regarding retained
profits. To make the implications clear, we adopt two different
methods.
First, we assume that the tax liabilities (approximated by
tax provisions) remain the same. Then, we can calculate two
effective tax rates, one on the basis of historical cost profits and
the other based on adjusted profits. Juxtaposition of these two
rates allows us to measure the extent of overtaxation due to
inflation.
Alternatively, we assume the same effective tax rate (tax
provision divided by historical cost accounts profits) to be
applied to inflation-adjusted profits. This yields an estimate of
adjusted tax liability on the basis of adjusted profits before tax.
A comparison of this with the actual tax provision also yields a
measure of over-taxation due to inflation. This comparison
implies a comparison of the situation where all the tax rules are
based on real values with the present situation.
Under these alternative assumptions about tax liability, we
arrive at alternative estimates of profits after tax. From these
figures we deduct dividends paid—actuals and, alternatively,
those estimated on the basis of a constant pay-out ratio (divi
dends/profits after tax), to arrive at two alternative estimates

The Total Impact and Internal Generation of Capital 71
investment allowance/development rebate). Assuming the
incentive-induced savings to be the same, the amounts of
ploughback are estimated.
Tables 7-1.1 to 7-3.4 sum up the results of this exercise.
Tables 7-1.1 to 7-1.4 show the adjustments to correct for infla
tion and also the relative importance of the two adjustments
we have undertaken. Tables 7.2.1 to 7.2.4 list the tax provision,
adjusted profits after tax, dividends paid, incentive-induced
savings and adjusted ploughback under the twin assumptions
of constant tax provision and constant dividends for the four
price indices. Tables 7.3.1 to 7.3.4 list the same items under the
twin assumptions of constant effective tax rate and constant
pay-out ratio for the same price indices. The next chapter gives
the blown up figures for the whole corporate manufacturing
sector indicating the extent of overtaxation of corporate profits.
2. The Total Impact
Table 7.1.1. gives results (complete) for only ten industry
groups as COSA was not calculated for groups 1-9 and 20 for
reasons given earlier. For the ten industry groups considered,
COSA seems to be generally higher than depreciation adjust
ment in 1979. Tn the cases of groups 13 and 15 (industry groups
4 and 6, i.e.. Textiles, and Ceramic Tiles, Glass and Glass
Products, Cement and Asbestos Brake Lining industries), how
ever, it is the other way round.
Losses for two groups (groups 10 and 12) increase after
inflation adjustment. For two groups (groups 16 and 18) profits
turn into losses. There is no group whose profits go up. The
latter two groups, obviously, are most affected by inflation (in
terms of percentage reduction in profits). The least affected
group is group 15 (Ceramic Tiles, Glass and Glass Products,
Cement, and Asbestos Brake Lining). Among the loss-making
groups, group 12 (Dairy Products, Grain Mill Products, Sugar
and Beer) also pays a heavy toll to inflation, the percentage re
duction in profits (increase in losses) being a shade less than
that in the case of group 16, which is worst-hit among the
profit-making groups. By the same token, however, industry
group 1 (group 10, i.e., primary sector companies) is the worst
hit of all. The percentage increase in losses is an astronomical

Table
7-1.1
Adjustmentfor
Injiationusing
SpecificPriceIndices
(Rs'000)
Group
1. 2. 3. 4. 5. 6. 7. 8. 9.
10.(1)
11.(2)
12.
(3)
13.
(4)
14.
(5)
Unadjusted
profits
beforetax
0)
975206.81
419740.00
555466.81
20873.80
371087.91
163505.11
347870.59
153207.70
54388.50
-30.60
4652.50
-5696.80
115356.70
202445.00
Total
COSA
(2)
— — —
— — — — —
675.39
3825.40
20571.84
16081.18
100104.17
Total
depreciation
adjustments
(3)
— — — —
— —
— —
470.54
256.74
6242.92
39119.04
68111.65
Columns
(3/2)
percentage
(4) ,
— — — — —.
— — —
— 82.22
— 13.94
49.45
Columns
(3+
2)/l
percentage
(5)
—.
— — — — — — —
—
5.52
—
33.91
33.64
Adjusted
profits
beforetax
(6)
— — —.
— — — — —
—1176.53
570.36
—32511.56
60156.49
34229.18

Table
7-1.1
(Contd.)
15.(6)
16.(7)
17.
(8)
18.(9)
19.(10)
20.01)
47895.00
4868.20
55727.00
26180.00
40321.00
63748.80
4029.80
17509.47
34887.23
17165.43
24139.53
—
16147.80
5625.19
13554.54
14798.48
9127.25
—
8.41
359.67
62.60
65.57
59.87
—
33.72
115.54
24.32
56.53
22.64
—
27717.40
—18266.46
7285.24
—5783.91
7054.22
—
Note:
(i)Numbers
withinparenthesesrepresenttheindustrygroup.
(//)
Forgroups
1to
9and
20,COSA
was
notcalculatedusingspecific
price
indices,
and
hence
calculations
comparable
toothergroupscannotbeundertaken.

Table
7-1.2
Adjustmentfor
InflationusingtheConsumerPriceIndex
(RsWO)
Group
1. 2. 3. 4. 5. 6. 7. 8. 9.
10.(1)
11.(2)
12.(3)
13.(4)
14.
(5)
Unadjusted
profits
beforetax
(1)
975206.81
419740.00
555466.81
29873.80
371087.91
163505.11
347870.59
153207.70
54388.50
—30.60
4652.50
-5696.96
115356.70
202445.00
Total
COSA
(2)
92034.00
83537.95
8496.04
846.21
6774.85
874.98
6118.88
2732.85
—355.69
69.3*
64.26
954.98
1832.87
6767.63
Total
depreciation
adjustment
(3)
655558.87
478734.66
222245.08
40813.81
66156.43
55262.14
115483.48
40597.46
2995.98
442.95
195.11
5478.22
32592.79
55639.12
Columns
(3/2)
percentage
(4)
9.44
19.90
1.53
4.05
1.83
0.54
1.76
1.78
—0.65
1.38
1.59
3.34
Columns
(3+2)/l
percentage
(5)
67.22
114.06
40.01
195.53
17.83
33.80
33.20
26.50
5.51
4.19
28.25
27.48
Adjusted
profits
beforetax
(6)
227613.94
—142532.61
324725.69
—20156.22
298156.62
107367.99
226268.23
109877.39
51748.21
—542.93
4393.13
—12130.00
80931.05
140038.25

Table
7-1.2(Contd.)
15.
(6)
16.(7)
17.(8)
18.(9)
19.(10)
20.(11)
47895.00
4868.20
55727.00
26180.00
40321.00
63748.80
—147.49
—734.83
—164.11
191.76
—189.47
—84.15
14217.86
4771.17
12176.02
13230.79
7582.26
11181.73
-0.31
—15.09
—0.29
0.73
—0.47
—0.21
29.69
98.01
21.85
50.54
18.80
17.54
33824.63
831.86
43715.10
12757.46
32928.21
52651.21
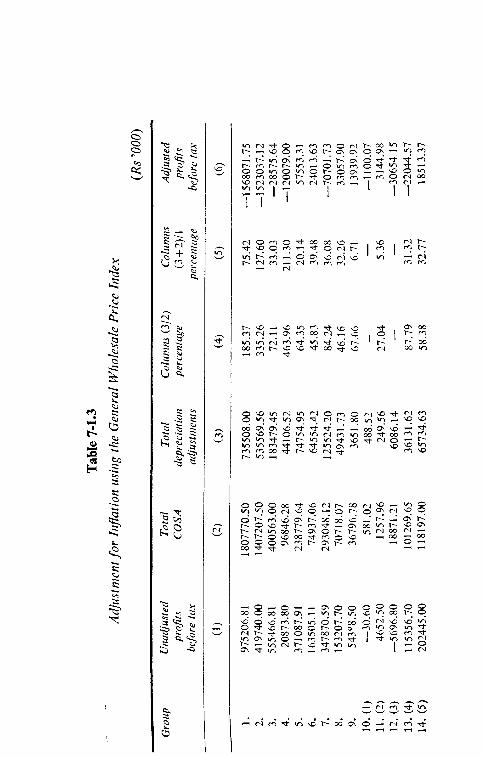
Table7-1.3
Adjustmentfor
InflationusingtheGeneralWholesalePriceIndex
(Rs'000)
Group
1. 2.
3. 4.
5.
6. 7. 8.
9.
10.(1)
11.
(2)
12.
(3)
13.(4)
14.
(5)
Unadjusted
profits
beforetax
(1)
975206.81
419740.00
555466.81
20873.80
371087.91
163505.11
347870.59
153207.70
543e8.50
—30.60
4652.50
—5696.80
115356.70
202445.00
Total
COSA
(2)
1807770.50
1407207.50
400563.00
96846.28
238779.64
74937.06
293048.12
70718.07
36796.78
581.02
1257.96
18871.21
101269.65
118197.00
Total
depreciation
adjustments
(3)
735508.00
535569.56
183479.45
44106.52
74754.95
64554.42
125524.20
49431.73
3651.80
488.52
249.56
6086.14
36131.62
65734.63
Columns
(3/2)
percentage
(4)
185.37
335.26
72.11
463.96
64.35
45.83
84.24
46.16
67.66
27.04
—
87.79
58.38
Columns
(3+
2)/l
percentage
(5)
75.42
127.60
33.03
211.30
20.14
39.48
36.08
32.26
6.71
—
5.36
—
31.32
32.77
Adjusted
profits
beforetax
(6)
—1568071.75
—1523037.12
—28575.64
—120079.00
57553.31
24013.63
—70701.73
33057.90
13939.92
—1100.07
3144.98
—30654.15
—22044.57
18513.37

Table
7-1.3(Contd.)
15.(6)
16.
(7)
17.
(8)
18.(9)
19.
(10)
20.(11)
47895.00
4868.20
55727.00
26180.00
40321.00
63748.80
9638.19
20372.00
41622.27
22105.12
26335.90
31569.52
15864.18
5329.2*
13231.55
14532.41
8481.56
12620.08
20.12
418.47
74.69
84.44
65.32
49.52
33.12
109.47
23.74
55.51
21.04
19.80
22392.63
—20833.08
873.18
—10457.53
5503.54
19559.21

Table
7-1.4
Adjustmentfor
Infl
atio
nusing
theImplicitGNP
Deflator
(RsWOO)
Group
1. 2. 3. 4. 5. 6. 7. 8. 9.
10.(1)
11.(2)
12.(3)
13.(4)
14.(5)
Unadjusted
profits
beforetax
(1)
975206.81
419740.00
555466.81
20873.80
371087.91
163505.11
347870.70
153207.70
54388.50
—30.60
4652.50
—5696.S0
115356.70
202445.00
Tota1
COSA
(2)
296206.59
219911.17
71215.45
17409.75
43912.10
14893.59
55844.53
12359.35
8011.57
70.05
205.94
3097.42
19548.81
20692.35
Total
depreciation
adjustments
(3)
619856.94
456783.00
154929.62
38346.94
62432.74
54046.05
109562.41
39053.05
2647.22
401.71
157.51
5190.88
32180.87
52820.05
Columns
(3/2
)
percentage
(4)
30.37
52.39
12.82
83.40
11.83
9.11
16.05
8.07
14.73
— 4.43
— 16.95
10.22
Columns
(3+
2)/l
percentage
(5)
63.56
108.82
27.89
183.71
16.82
33.05
31.50
25.49
4.87
3.39
—i
27.90
26.09
Adjusted
profits
beforetax
(6)
59143.28
—256954.17
329321.72
—34882.89
264743.06
9-r565.46
182463.66
101795.30
43729.72
—502.35
4289.05
—13985.10
63627.02
128932.60

Table
7-1.4(Contd.)
15.(6)
16.(7)
17.(8)
18.(9)
19.
(10)
20.(11)
47895.00
4868.20
55727.00
26180.00
40321.00
63748.80
1646.78
1529.70
8350.40
4452.79
5666.09
6626.96
13475.06
4590.49
11502.45
12761.52
7213.48
9985.72
3.44
31.42
14.98
17.01
14.05
10.40
28.13
94.30
20.64
48.75
17.89
15.66
32773.16
—12.51.99
35874.15
8965.69
25441.43
47136.12

80 Inflation Accounting and Corporate Taxation
Now let us examine the results given in Table 7-1.2. When
the consumer price index is used, only government companies
are affected by inflation through COSA more than through
depreciation adjustment. After adjustment for inflation, their
profits turn into losses. This is not so for non-government com
panies as a whole. Among them, however, the smallest sized
companies seem to be worst affected by inflation, their profits
turning into losses after adjustment. Among the other two size-
groups, the impact of inflation seems to be greater on the
largest companies. As for the three age-groups, the oldest
companies are the most affected and the new companies are the
least affected, with negative COSA, and very little depreciationadjustment.
Among the industry groups, the least affected is group 11
(industry group 2, i.e.. Fuel, Power, Light and Lubricants).
COSA is negative for many of the industry groups. The worst
affected is group 10, with its losses going up by an astounding1674 percent. It may be noted that we arrived at a similar
result using specific price indices. Group 16 loses about 83 per
cent of its profits after adjustment, which is the highest impact
of inflation among the profit-making industry groups.
Table 7-1.3 paints quite a different picture. The corporate
manufacturing sector as a whole, and both government and
non-government companies in the aggregate, are shown to be
incurring losses when adjustment for inflation is undertaken.
Government companies are comparatively hard-hit with un
adjusted profits going down by about 463 per cent. Among
the size-groups within non-government companies, the smallest
companies are the worst affected with profits going down by
675 per cent. The other two size-groups are affected to a margi
nally smaller extent. Among the age-groups, the oldest com
panies become loss-making companies after adjustment, where
as the other two groups lose about 75 per cent of their profits.
As for the industry groups, group 10 again loses most in the
adjustment of profits and the least adjustment is for group 11.
Three of the nine profit-making groups go into the red after
adjustment. Among the profit-making groups, 16 is again themost affected.
The relative effect of inflation on various groups, as reveal
ed by Table 7-1.4, is quite similar to that revealed by

The Total Impact and Internal Generation of Capital 81
Table 7-1.2, although the COSA is higher in all cases. The
government companies and the smallest companies in the
private sector show losses instead of profits after adjustment for
inflation. Among the three size-groups, the middle size-group
is least affected by inflation as the adjustment for inflation is the
least in terms of percentage reduction in profits. The impact of
inflation on profits is again inversely related to size, as revealed
by the results for the three age-groups. As far as the industry
groups are concerned, the pattern is once again the same,
except that the use of the implicit GNP deflator results in lower
adjusted profits in all the cases; in one case (group 16) profits
turn into losses, which does not happen when the CPI is used.
3. Constant Tax Liability
Tables 7-2.1 to 7-2.4 paint a very gloomy picture of
inflation-adjusted profits and ploughback. Taking Table 7-2.1
first, we see that only two industry groups have positive profits
after tax. Ploughback, either net of tax-induced savings or
gross of them, is negative for all the industry groups, implying
continuous erosion of capital. Since profits after tax are nega
tive in most cases, it is obvious that the adjusted effective tax
rate (actual tax provision/adjusted profits before tax) is general
ly greater than one hundred per cent. Tn the two cases that it
is not, the adjusted effective tax rate is nevertheless very high.
Four of the ten industry groups analysed have negative profits
before tax, and so their negative post-tax profitability is not due
to the tax. With two industry groups having small but positive
post-tax profits, in the cases of four industry groups taxes are
responsible for turning profits into losses.
The picture presented in Table 7-2.2 is not all that gloomy.
For the corporate manufacturing sector as a whole, adjusted
post-tax profits are negative, but though the government
companies show huge losses, the non-government ones show a
small profit. Among the broad sub-groups of non-government
companies, only group 4 (the smallest-sized companies within
the sample) shows post-tax losses. Their losses are not caused
by taxes, however, as their pre-tax profits are also negative.
Among the industry groups, only one (group 16) goes into the
red due to taxes.
Ploughback, net of tax incentive induced savings, is positive

82 Inflation Accounting and Corporate Taxation
Table 7-2.1
Post-Tax Profits under the Assumption of Constant Tax
Provision and Dividends using Specific Price Indices
(Rs '000)
Croup
1.
2.
3.
4.
5.
6.
7.
8.
9.
10.(1)
11-(2)
12. (3)
13.(4)
14. (5)
15. (6)
16. (7)
17. (8)
18. (9)
19.(10)
20. (11)
Tax
provision
0)
—
—
—
0.00
2540.00
16.80
58885.00
74238.50
22282.80
4885.70
37189.10
10600.70
25960.00
—
Adjusted
profits
after tax
(2)
—
—
—
—1176.50
—1969.64
—32528.37
1270.59
—40009.32
5434.60
—23152.16
—29903.87
-16384.61
—18905.78
—
Dividends
(3)
—
—
—
459.00
1074.20
1596.20
22941.40
21684.10
11364.40
3423.00
10211.10
6064.90
5290.60
—
Tax
induced
savings
(4)
—
—
—
30.60
222.00
1621.90
19310.20
23962.50
4809.40
2082.50
3447.40
1395.50
4219.00
—
Net
plough-
back
(5)
—
—
—
—1666.1
—3265.8
—35746.5
—40981.0
-85655.9
—10739.2
—28657.7
—43562.4
- 23845.0
—28415.4
—
Note: COSA calculations could not be carried
20 using specific price indices; hence
these groups were precluded.
out for groups 1-9 and
further calculations for

The Total Impact and Internal Generation of Capital 83
Table 7-2.2
Post-Tax Profits under the Assumption of Constant TaxProvision and Dividends using the Consumer Price Index
(Rs '000)
Group
1.
2
3.
4.
5.
6.
7.
8.
9.
10. (1)
11.(2)
12.(3)
13.(4)
14. (5)
15. (6)
16.(7)
17. (8)
18. (9)
19. (10)
20.(11)
Tax
provision
(1)
726339.89
460215.20
266124.69
36960.30
163464.40
65700.00
171938.50
54028.10
40158.10
0.00
2540.00
16.80
58885.90
74238.50
22282.80
4885.70
37189.10
10600.70
25960.00
29525.20
Adjusted
profits
after tax
(2)
—498725.97
—602747.81
58600.99
—57116.52
134692.22
41667.99
54329.74
55849.29
11590.12
—542.93
1853.13
—12146.80
22045.15
55799.76
11541.83
—4053.84
6526.00
2156.75
6968.21
23126.02
Dividends
(3)
238423.00
137114.80
101308.20
15433.60
58879.10
26995.50
79288.90
11058.20
10961.10
459.00
1074.20
1596.20
22941.40
21684.10
11364.40
3423.00
10211.10
6064.90
5290.60
17199.30
Tax
induced
savings
(4)
331965.00
262559.00
69406.00
12413.20
50749.70
6243.10
48320.10
7510.10
13575.80
30.60
222.00
1621.90
19310.20
23962.50
4809.40
2082.50
3447.40
1395.50
4219.00
8305.00
Net
plough-
back
(5)
—1069113.9
—1002421.6
—139113.2
-84963.3
25063.4
8429.4
—73279.3
37281.0
—12946.8
—1032.5
556.9
—15364.9
—20206.5
10153.2
-4632.0
—9559.3
—7132.5
—5303.7
—2541.4
—2378.3

84 Inflation Accounting and Corporate Taxation
Table 7-2.3
Post-Tax Profits under the Assumption of Constant Tax
Provisions and Dividends using the General Wholesale
Price Index
(Rs '000)
Group
1.
~>
3.
4.
5.
6.
7.
8.
9.
10.
11.
12.
13.
14.
15.
16.
17.
18.
19,
20.
(1)
(2)
(3)
(4)
(5)
(6)
(7)
(8)
(9)
, (10)
(11)
Tax
provision
(n
726339.89
460215.20
266124.69
36960.30
163464.40
65700.00
171938.50
54028.10
40158.10
0.00
2540.00
16.80
58885.90
74238.50
22282.80
4885.70
37189.10
10600.70
25960.00
29525.20
Adjusted
profits
after tax
(2)
—2294411.50
—1983252.25
—294700.34
—157039.30
—105911.09
—41686.37
—242640.22
—20970.20
—26218.18
—1100.07
604.98
—30670.96
—80930.47
—55725.13
109.83
—25718.78
—36315.92
—21058.23
—20456.46
—9966.00
Dividends
(3)
238423.00
137114.80
101308.20
15433.60
58879.10
26995.50
79288.90
11058.20
10961.10
459.00
1074.20
1596.20
22941.40
21684.10
11364.40
3423.00
10211.10
6064.90
5290.60
17199.30
Tax
induced
savings
(4)
331965.00
262559.00
69406.00
12413.20
50749.70
6243.10
4'320.10
7510.10
13575.80
30.60
222.00
1621.90
19310.20
23962.50
4809.40
2082.50
3447.40
1395.50
4219.00
8305.00
Net
plough-
back
(.5)
—2864799.5
- 2382926.1
-465414.5
—184886.1
- 215539.9
—74925.0
—370249.2
—39538.5
—50755.1
-1589.7
—691.2
—33889.7
—123182.1
— 101371.7
—16064.0
—31224.3
_49974.4
- 28518.6
—29966.1
—35470.3

The Total Impact and Internal Generation of Capital 8 5
Table 7-2.4
Post-Tax Profits under the Assumption of Constant Tax
Provision and Dividends using the Implicit GNP Deflator
(Rs '000)
Group
1.
2.
3.
4.
5.
6.
7.
8.
9.
10.(1)
11. U)
12. (3)
13.(4)
14. (5)
15. (6)
16.(7)
17.(8)
18.k9)
19. (10)
20. fin
Tax
provision
0)
726339.89
460215.20
266124.69
36960.30
163464.40
65700.00
171938.50
54028.10
4O158.1n
0.00
2540.00
16.80
58885.90
74238.50
22282.80
4885.70
37189.10
10600.70
25960.00
29525.20
Adjusted
profits
after tax
(2)
-667196.62
—717169.37
63197.04
—71843.20
101278.66
28865.46
10525.15
47767.20
3571.62
-502.35
1749.05
—14001.90
4741.12
54694.11
10490.36
-6137.69
—1314.95
—1635.01
481.43
17610.92
Dividends
(3)
238423.00
137114.80
101308.20
15433.60
58879.10
26995.50
79288.90
11058.20
10961.10
459.00
1074.20
1596.20
22941.40
21684.10
11364.40
3423.00
10211.10
6064.90
5290.60
17199.30
Tax
induced
savings
(4)
331965.00
262559.00
69406.00
12413.20
50749.70
6243.10
48320.10
7510.10
13575.80
30.60
222.00
1621.90
19310.20
23962.50
4809.40
2082.50
3447.40
1395.50
4219.00
8305.00
Net
plough-
back
(5)
—1237584.6
—1116843.1
—107517.2
- 99690.0
8350.1
—4373.1
—117083.9
29198.9
—20965.3
—992.0
452.9
—17220.0
—37510.5
9047.5
—5683.4
—11643.2
-14973.5
—9095.4
—9028.2
—7893.4

86 Inflation Accounting and Corporate Taxation
for five groups out of the twenty. The most notable fact in this
result is that the two larger size-groups manage to divert part
of their adjusted profits into the company, but not the smallest
ones within the sample. Considering ploughback gross of tax
incentive induced savings, four additional groups come into the
positive ploughback group. Government companies as well as
non-government companies, each group as a whole, have
negative ploughback either way. But the two groups of com
paratively large companies, and the two groups of comparative
ly new companies are shown to have positive gross ploughback.
Thus, in the non-government corporate manufacturing sector,
the smallest and the oldest companies are shown to have done
badly, after the adjustment for inflation. Among the industry
groups, two (groups II and 14) exhibit positive net ploughback,
and they and three more (15. 19 and 20) exhibit positive gross
ploughback.
Use of the general wholesale price index (Table 7-2.3) leads
to a dismaying picture, with adjusted profits after tax negative
in all but two cases, both of which are industry groups. Plough-
back, gross or net of tax incentive induced savings, is negative
in all cases. Dwelling on these results group-wise is not very
useful, because it is clear that the situation is bad. Differences
are only in degree.
Use of the GNP deflator (Table 7-2.4) yields a slightly
better picture. The scenario is more or less the same as in the
case of Table 7-2.2 (results of the use of consumer price index),
except that two industry groups (groups 17 and 18) exhibit
losses after tax whereas in the other case they showed profits.
Net ploughback is negative in this case, whereas it was positive
in Table 7-2.2. for group 6, i.e., the largest size-group. Group
6. however, exhibits positive gross ploughback, along with
group 20. Three groups which showed positive gross plough-
back in Table 7-2.2 do not show a similar result in Table 7-2.4
Thus, overall, use of the consumer price index shows the
least depressing picture, whereas use of the general wholesale
price index shows the most depressing one. Results for only ten
groups are derived using the specific price indices, but they do
not show the situation to be as bad as in Table 7-2.3.
All the results, taken together, allow us to draw some broad

The Total Impact and Internal Generation of Capital 87
3.1. Implications
First, it appears that the impact of inflation has been quitesevere upon all the companies, but in varying degrees across
groups and also depending upon the price index being used. Tn
our calculations, the use of the general wholesale price index
causes the maximum reduction in profits, but that is true only
for the year 1979. It is quite possible that if similar calculationswere done for another year, the same conclusion might nothold. Thus, no systematic relation can be postulated betweenthe extent of inflation adjustment and the choice of the priceindex used, based only on our calculations. But since the relative positions of different groups do not change all that muchwith the change in the price index used, perhaps thesedifferences are more systematic. Government companies areshown to become much less profitable than non-governmentones, once adjustment for inflation is made. Among the non
government companies the smaller companies and the older
companies seem to show profits largely because no adjustment
for inflation is made. Once it is done, the profits tend to turninto losses.
It seems that with inflation accounting, a large number of
manufacturing companies will have no profits and hence no taxliability. A large part of the total tax provisions, it seems, can
be traced to lack of adjustment for inflation, which causes conventionally calculated profits to swell, without any correspon
ding increase in real profits. Also, it is obvious that very fewcompanies could actually afford the dividends that they paid;
the payment of dividends was only at the cost of erosion ofcapital base. The implication is that but for inflation and the
consequent overtaxation and overpayment of dividends,1 the
number of times the companies went to the capital market forloans or with fresh issues would have been much less. In real
terms, expansion has obviously been financed by external funds
rather than internally generated funds. But taxation is to beblamed only partially for this; as our results show, adjusted
dividends have been overpaid in the sense tnac the companies couldnot afford them in general. However, there are various other factors whichaffect dividends. These mav even force a rnmnanv t^ «.„ ,4,\,.vi~_J- ...,.-

88 Inflation Accounting and Corporate Taxation
profits before tax are negative for many groups; strictly speaking
they should not have paid dividends.
4. Constant Effective Tax Rate
Tables 7-3.1 to 7-3.4 also show the impact of inflation on
profits as Tables 7-2.1 to 7-2.4. but under the twin assumptions
that the effective tax rate and the pay-out ratio are constant. The
figures for tax provision and dividends are, thus, estimates. The
figures for tax incentive induced savings are, however, actuals.
Whenever profits before tax are negative for a group, tax pro
visions are assumed to be zero. Similarly, wherever profits after
tax are negative, dividends are assumed to be zero. In one case
(Table 7-3.2, group 16). though profits after tax are positive,
they are so small that we have treated them as zero. It is of
course possible that even when a company is making a loss, it
may pay dividends, but here we have estimated dividends entire
ly on the basis of a constant pay-out ratio and profits after tax,
to see what would have been the situation if the companies had
decided to keep dividends within the available funds (in real
terms) generated during the year. The results for each group
have to be examined separately because tax provision and divi
dends are estimated for each group separately. Though some
groups are only sub-groups of a broader group, the estimates
are not consistent for that reason. Also, estimated tax pro
vision figures do not include tax provision for the earlier years,
which, however, are deducted (unadjusted) from the profits
before tax (adjusted) along with the adjusted tax provision to
arrive at the adjusted profits after tax.
The assumptions made ensure (except in the unlikely case
of effective tax rate being higher than unity) that the groups
which have positive adjusted profits before tax also have posi
tive adjusted profits after tax. Similarly, those groups which
have positive adjusted profits after tax also have positive gross
ploughback.
Taking Table 7-3.1 first, one linds that profits after tax are
negative for four of the ten industry groups. Net ploughback,
however, is negative for all the groups except one (group 15).
This is. as can be seen, because the tax incentive induced savings
are quite small for group 15 compared to its profits, relative to

The Total Impact and Internal Generation of Capital 89
Table 7-3.1
Post-Tax Profits under the Assumption of Constant Tax
Rate and Payout Ratio using Specific Price Indices
(Rs WO)
Group
1.
2.
3.
4.
5.
6.
7.
o5.
9.
10.(1)
11.(2)
12.(3)
13.(4)
14. (5)
15. (6)
16.(7)
17. (8)
18.(9)
19.(10)
20. (11)
Adjusted
tax
provision
(1)
—
—
—
—
—
0.00
311.42
0.00
30439.18
12767.48
12583.70
0.00
5085.09
0.00
4542.92
—
Adjusted
profits
after tax
(2)
—
—
—
—
—
—
—1176.53
258.94
—32511.56
29191.40
22824.20
14604.90
—18266.46
3906.64
—5783.91
2511.30
—
Adjusted
dividends
(3)
—
—
—
—
—
—
0.00
131.54
0.00
11851.71
3857.29
6484.58
0.00
2152.56
0.00
924.16
—
Tax
induced
savings
(4)
—
—
—
—
—
30.60
222.00
1621.90
19310.20
23962.50
4809.40
2082.50
3447.40
1395.50
4219.00
—
Plough-
back
(5)
—
—
—
—
—
—1207.13
—94.60
—34133.46
—1970.51
—4995.59
3310.92
—20348.96
—1693.32
—7179.41
2631.86
*
Note: Since COSA calculations could not be carried out for groups 1-9

90 Inflation Accounting and Corporate Taxation
Table 7-3.2
Post-tax Profits under the Assumption of Constant TaxRate and Pay-out Ratio using the Consumer Price Index
(Rs '000)
Croup Adjusted
tax
provision
Adjusted
profits
after tax
Adjusted
dividends
Tax
induced
savings
Plough-
back
0) (2) (3) (4) (5)
I
2
3
4
5.
6
7.
8.
9.
10.
11.
12.
13.
14.
15.
16.
17.
18.
19.
20.
0)
(2)
(3)
(4)
(5)
(6)
(7)
(8)
(9)
(10)
01)
162288.73
0.00
156517.78
0.00
133872.33
43161.93
113134.12
38127.45
33707.67
0.00
2398.65
0.00
40951.11
52234.27
15356.38
837.69
30513.14
5370.89
21205.77
23745.70
34768.00
— 142532.61
169865.91
—20156.22
167285.70
64206.06
115077.92
70918.23
13586.45
— 542.93
1994.48
— 12130.00
39454.04
39166.48
17939.45
12.48
14908.46
7808.37
11722.44
28109.12
33307.74
0.00
59453.07
0.00
47509.14
17720.87
51900.14
7871.92
10461.57
0.00
1013.20
0.00
16018.34
15069.14
7965.12
0.00
8214.56
3037.45
4313.86
14138.89
331965.00
262559.00
69406.00
12413.20
50749.70
6243.10
48320.10
7510.10
13575.80
30.60
222.00
1621.90
19310.20
23962.50
4809.40
2082.50
3447.40
1395.50
4219.00
8305.00
—330504.74
-405091.61
41006.84
—32569.86
69026.86
40242.09
14857.68
55536.21
—10450.92
—573.53
759.28
—13751.90
4125.50
134.84
5164.93
-2070.02
3246.50
3375.42
3189.58
5665.23

The Total Impact and Internal Generation of Capital 91
Table 7-3.3
Post-Tax Profits under the Assumption of Constant Tax
Rate and Pay-out Ratio using the General Wholesale
Price Index
(Rs '000)
Group
1.
2.
3-
4.
5.
6.
7.
8.
9.
10.(1)
11. (2)
12. (3)
13. $4)
14. (5)
15.(6)
16. (7)
17. (8)
18. (9)
19. (10)
?n nn
Adjusted
tax
provision
(1)
0.00
0.00
0.00
0.00
25841.44
9653.48
0.00
11471.09
10427.06
0.00
1717.16
0.00
0.00
6905.49
10166.26
0.00
609.48
0.00
3544.28
8821.20
Adjusted
profits
after tax
(2)
—1568071.75
—1523037.12
—28575.64
—120079.00
34713.27
14360.15
—70701.73
20755.11
4058.76
—1100.07
1427.82
—30654.15
- 22044.57
12970.38
11697.58
—20833.08
1970.20
—10457.53
1959.26
9941.60
Adjusted
dividends
(3)
0.00
0.00
0.00
0.00
9858.57
3963.40
0.00
2303.82
3125.25
0.00
725.33
0.00
0.00
2191.99
5193.73
0.00
1085.58
0.00
721.01
5000.63
Tax
induced
savings
(4)
331965.00
262559.00
69406.00
12413.20
50749.70
6243.10
48320.10
7510.10
13575.80
30.60
222.00
1621.90
19310.20
23962.50
4809.40
2082.50
3447.40
1395.50
4219.00
8305.00
Plough-
back
(5)
—1900036.75
—1785596.12
—97981.64
—107666.20
—25895.00
415-3.65
—119021.83
10941.19
—12642.29
—1130.67
480.49
—32276.05
—41354.77
—13184.11
1694.45
-22915.58
—2562.78
—11853.03
—2980.75
- 3364.03

92 Inflation Accounting and Corporate Taxation
Post-
Rate
Table 7-3.4
■Tax Profits under the Assumption of Constant Tax
and Pay-out Ratio using the Implicit GNP Deflator
(Rs '000)
Group Adjusted
tax
provision
Adjusted
profits
after tax
Adjusted
dividends
Tax
induced
savings
Plough-
back
(1) (3) (4) (5)
1.
2
3.
4.
5.
6.
7.
8.
9.
10.
11.
12.
13.
14.
15.
16.
17.
18.
19.
20.
(1)
(2)
(3)
(4)
(5)
(6)
(7)
18)
(9)
(10)
(11)
42169.16
0.00
158733.08
0.00
118869.63
38015.32
91231.83
35322.97
32709.83
0.00
2341.82
0.00
32195.27
48091.86
14879.02
0.00
25040.16
3774.55
17028.28
21258.39 .
—13583.08
—256954.17
172246.66
—34882.89
148874.83
56550.15
93175.62
65640.63
11565.79
—502.36
1947.23
—13985.10
30905.85
82203.24
17365.35
— 1251.99
12540.49
5612.93
9413.15
25081.33
0.00
0.00
60286.33
0.00
42280.45
15607.84
42022.21
7286.11
Q905.66
0.00
989.19
0.00
12547.77
13982.35
7710.21
0.00
6909.81
2183.43
3464.04
12615.91
331965.00
262559.00
69406.00
12413.20
50749.70
6243.10
48320.10
7510.10
13575.80
30.60
222.00
1621.90
19310.20
23962.50
4809.40
2082.50
3447.40
1395.50
4219.00
8305.00
—345548.08
—519513.17
102840.66
—47296.09
55844.68
34699.21
2833.31
50844.42
—10915.67
—532.96
736.04
—15607.00
—952.12
44348.39
4845.74
—3334.49
2183.28
2034.00
1730.11
4160.41

The Total Impact and Internal Generation of Capital 93
tive induced savings) is much higher for, say. group 14 compar
ed to its profits, but net ploughback is not. Of course, the fact
remains that most of these tax incentive induced savings cannot
be used by the company for dividend payments until a specified
amount of time elapses, but the positive dividend payments
could have been financed by loans which were repaid (along
with interest) from the reserves created from these tax incentive
induced savings. Tn any case, forcing a company to save rather
than pay dividends implies a similar compulsion to generate
funds internally instead of externally if the impact of dividend
payments is higher than that of savings on the capacity to raise
share capital. Theoretically, such a situation is inexplicable, but
so is the fact that despite the ability to pay shareholders through
capital gains which is taxed at a lower rate in the hands of indi
viduals, the companies keep paying dividends instead of retain
ing profits.
As can be seen in Table 7-3.2, profits for the corporate
manufacturing sector as a whole are small but positive, most of
which are paid out as dividends, leaving a small amount of
gross ploughback. But tax incentive-induced savings being
much higher, net ploughback is negative. Government com
panies as a group make a loss after adjustment for inflation,
and by assumption there is no tax provision or dividends. With
a fairly high amount of tax incentive induced savings, the net
ploughback is negative and quite large. The implications are
obvious. The non-government companies as a whole fare better.
Profits after tax are positive, and even after payment of divi
dends, both gross and net ploughbacks are positive, indicating
a certain amount of internal generation of funds. The same is
true for the subgroups of the non-government companies also,
with the exception of the smallest companies and the newest
companies within the sample. The smallest companies make a
loss after adjustment for inflation, and so their gross as well as
net ploughbacks are negative. The newest companies, however,
exhibit positive gross ploughback, but negative net ploughback,
implying a forced reliance on internally generated funds.
Among the industry groups, only three exhibit negative
ploughback, out of which two make losses after adjustment
(groups 10 and 12). The third (group 16) makes a very small
profit.

94 Inflation Accounting and Corporate Taxation
The performance of most of the broad groups and subgroups concerned in Table 7-3.3 is dismal. Among the first nine
groups only four have positive profits (groups 5, 6, 8 and 9)
and hence positive gross ploughback. But net ploughback is
negative for two of them (groups 5 and 9) as well as for all the
other five groups (those having negative profits). Only the
middle size-group companies and the 11-20-year-old companiesexhibit positive ploughback. Among the industry groups six
out of eleven (groups II, 14, 15, 17, 19 and 20) have positiveprofits after tax and hence after dividends, but net ploughbackis negative for four of them (groups 14, 17, 19 and 20).
Examining Table 7-3.4 now, we find that the corporatemanufacturing sector as a whole makes losses after tax, making
both gross and net ploughback negative. But it is the govern
ment companies which cause this to happen in the aggregate as
the results for groups 2 and 3 clearly show. Considering the
sub-groups of the non-government companies, the results aresimilar to those in Table 7-3.2. For the industry groups also
the results are similar except for two differences. In the case of
group 13, the net ploughback is negative, whereas it was positive for the same group in Table 7-3.2. The small profits aftertax of group 16 turn into losses in Table 7-3.4.
4.1 Implications
The broad conclusions that can be drawn are exactly the
same as in the case of the results presented in Tables 7-2.1 to7-2.4. In section 4 above we attempted to find out what the
situation would be if the income tax rules permitted the twomajor adjustments we carried out keeping other things the
same, and if companies paid dividends at certain rates fromdisposable profits. The results broadly indicate that in such asituation, capital erosion would have taken place in some
groups. The cause, evidently, is poor real profitability and in
this respect the government companies fare very badly. Inflation accounting should, it seems, be insisted upon, if only to
shatter the myth of profitability of many companies when theyare making losses in real terms.
Having said all this, a note of caution is perhaps necessaryAs pointed out earlier, our adjustment calculations exclude theadjustments for net financial liabilities. Under conditions of

TTie Total Impact and Internal Generation of Capital 95
inflation, the adjustment in profits for positive net financial
liabilities would be upwards. And manufacturing companies
are likely to have a substantial amount of net financial liabili
ties. The adjustments for these would cancel to some extent
those for depreciation and inventory. Such adjustments would
vary directly with the size of net financial liabilities and the
proportion of old debts in them. How important they would
be is a question that is empirical in nature and can be answered
only if the necessary calculations are undertaken.

8- THE EXTENT OF OVERTAXATION:
FINAL RESULTS
1. Extent of Overtaxation by Groups
In this chapter, we present the estimated overtaxation of
profits as revealed by the actual effective rate of tax and the
adjusted effective rate of tax (actual tax provision/adjusted
profits before tax). After presenting these for all the twenty
groups, we blow up the figures for the three age-groups of
the non-government companies and for the government com
panies with the appropriate blow-up factors. Then summing up
the blown-up figures we estimate the overtaxation of corporate
manufacturing sector as a whole.
Tables 8-1.1 to 8-1.4 list the actual and the adjusted effec
tive rates of tax for the twenty groups, derived by using the
four price indices. In many cases, profits before tax (adjusted)
are negative and hence the adjusted rate of tax cannot be com
puted as to be comparable to others. These are indicated in
the tables. The difference between these two rates is taken to
be the extent of overtaxation.
Table 8-1.1 gives results for only ten industry groups for
reasons mentioned earlier. The least overtaxed group is group
15 (Ceramic Tiles, Glass and Glass Products, Cement and
Asbestos Brake Lining), where, however, the effective tax rate
(adjusted) is higher than the nominal effective tax rate by more
than 73 per cent. The other figures require no explanation.
Looking at Table 8-1.2 now, we see that the nominal effec
tive tax rate of 71 per cent for the whole corporate manufactur
ing sector soars up to 306 per cent after adjustment for inflation.
This is a fairly explicit indication of the extent of overtaxation
of corporate profits due to inflation. As for the government
companies as a whole, the adjusted tax rate cannot be calculat
ed as profits are negative; hence, overtaxation can also not be
calculated. For non-government companies, the effective tax
rate goes up from 48 per cent to 82 per cent implying an
The Extent of Overtaxation: Final Results 97
increase of about 71 per cent. Among the sub-groups, the
real burden on the smallest size-group is the heaviest after
adjustment, since they have to pay taxes even when their profits
after adjustment are negative. Among the age-groups, the one
most affected due to inflation seems to be the middle age-group
and the new companies seem to be overtaxed to a very smallextent. Among the industry groups, group 16 (Basic Metals
and Alloys) is obviously the most overtaxed. The least over
taxed is group 11 (Fuel, Power, Light and Lubricants).
In line with the other results obtained using the generalwholesale price index, Table 8-1.3 presents the worst picture.
Corporate manufacturing sector as a whole (as well as both
government companies and non-government companies as diffe
rent groups) pays taxes despite incurring losses, if adjustment
for inflation is undertaken. The smallest and the oldest compa
nies within the sample, as sub-groups, also exhibit the same
pattern. Other sub-groups make some profits in real terms,
but are shown to be bearing an adjusted tax burden far greater
than they can reasonably be expected to.
As far as the industry groups are concerned, in two cases
(groups 10 and 12) the unadjusted profits before tax are nega
tive, and so the actual effective tax rate cannot be calculated.
In three more cases (groups 13, 16 and 18) adjusted profits
before tax are negative. However, all these groups show positive
tax provision. Excluding these groups, the maximum adjusted
tax rate among those for the industry groups is that for group
17. The least affected industry group is group 11, as in the
case of Table 8-1.2 also.
We now examine Table 8-1.4. The corpo ate manufactur
ing sector as a whole had a fairly high effective rate (71 per
cent) to begin with; after adjustment for inflation, the rate
becomes an astronomically high 1176 per cent. Of course, this
high an adjusted effective tax rate is due primarily to the fact
that the government companies as a whole are bearing a heavytax burden. For the non-government companies, the effective
tax rate increases from 48 per cent to 81 per cent after adjust
ment, i.e., a rise of almost 69 percent. So far as the other
groups are concerned, the pattern is similar to that in Table
s_i o Tn the. case of srouo 16, its adjusted tax rate cannot be

98 Inflation Accounting and Corporate Taxation
Table 8-1.1
Overtaxation of Capital Income in the Corporate Sector
using Specific Price Indices
(Rs '000)
Group
1.
2.
3.
4.
5.
6.
7.
QO.
9.
10. (1)
11.(2)
12. (3)
13.(4)
14. (5)
15.(6)
16. (7)
17. (8)
18. (9)
19. (10)
20.(11)
Tax Profits
provision before
tax
0)
—
—
—
—
—
—
—
0.00
2540.00
16.80
58360.00
75601.00
21754.00
4904.00
38895.60
11022.00
25960.00
—
(2)
—
—
—
—
—
—
—
-30.60
4652.50
—5696.80
115356.70
202445.00
47895.00
4868.20
55727.00
26180.00
40321.00
—
Adjusted
profits
(3)
—
—
—
—
—
—
—
—1176.53
570.36
—32511.56
60156.49
34229.18
27717.40
—18266.46
7285.24
—5783.91
7054.22
—
Actual
effective
tax rate
( percent
age)
(4)
—
—
—
—
—
—
—
—
55
—
51
37
45
101
70
42
64
—
Adjusted
effective
tax rate
(percent
age)
(5)
—
—
—
—
—
445
—
97
221
78
—
534
—
368
—

The Extent of Overtaxation: Final Results 99
Table 8-1.2
Overtaxation of Capital Income in the Corporate Sector
using the Consumer Price Index
(Rs WOO)
Group
1.
2.
3.
4.
5.
6.
7.
8.
9.
10.(1)
11.(2)
12.(3)
13. (4)
14.(5)
15.(6)
16. (7)
17. (8)
18. (9)
19. (10)
20.(11)
Tax-
provision
(1)
695782.69
428000.00
267782.69
35616.90
166465.80
65700.00
137882.30
53196.40
40704.00
0.00
2540.00
16.80
58360.00
75601.00
21754.00
4904.00
38895.60
11022.50
25960.00
28728.80
Profits
before
tax
(2)
975206.81
419740.00
555466.81
20873.80
371087.91
163505.11
347870.59
153207.70
54388.50
—30.60
4652.50
—5696.80
115356.70
202445.00
47895.00
4868.20
55727.00
26180.00
40321.00
63748.80
Adjusted
profits
before tax
(3)
227613.94
—142532.61
324725.69
—20156.22
298156.62
107367.99
226268.23
109877.39
51748.21
—542.93
4393.13
—12130.00
80931.05
140038.25
33824.63
831.86
43715.10
12757.46
32928.21
52651.21
Actual
effective
tax rate
(percent
age)
(4)
71
102
48
171
45
40
50
35
75
—
55
—
51
37
45
101
70
42
64
45
Adjusted
effective
tax rate
(percent
age)
(5)
306
—
82
—
56
61
61
48
79
—
58
—
72
54
64
590
89
86
79
55

100 Inflation Accounting and Corporate Taxation
Table 8-1.3
Overtaxation of Capital Income in the Corporateusing the General Wholesale Price Index
Sector
(Rs WO)
Group
1.
2.
3.
4.
5.
6.
7.
S.
9.
io. u)
11.(2)
12. (3)
13. (4)
14. (5)
15. (6)
16. (7)
17.(8)
18.(9)
19. (10)
20.(11)
Tax-
pro vision
(1)
695782.69
428000.00
267782.69
35616.90
166465.80
65700.00
137882.30
53196.40
40704.00
0.00
2540.00
16.80
58360.00
75601.00
21754.00
4904.00
38895.60
11022.50
25960.00
28728.80
Profits
before
tax
(2)
975206.81
419740.00
555466.81
20873.80
371087.91
163505.11
347870.59
153207.70
54388.50
—30.60
4652.50
—5696.80
115356.70
202445.00
47895.00
4868.20
55727.00
26180.00
40321.00
63748.80
Adjusted
profits
before tax
(3)
-1568071.75
—1523037.12
-28575.64
— 120079.00
57553.31
24013.63
—70701.73
33057.90
13939.92
—1100.97
3144.98
—30654.15
—22044.57
18513.37
22392.63
—20833.08
873.18
—10457.53
5503.54
19559.21
Actual
effective
tax rate
( percent
age)
(4)
71
102
48
171
45
40
50
35
75
—
55
—
51
37
45
101
70
42
64
45
Adjusted
effective
tax rate
{percent
age)
(5)
289
274
__
161
292
_
81
408
97
4454
472
147

The Extent of Overtaxation: Final Results 101
Table 8-1.4
Overtaxation of Capital Income in the Corporate Sector
using the Implicit GNP Deflator
(Rs WO)
Group
1.
2.
3.
4.
5.
6.
7.
8.
9.
10.(1)
11.(2)
12.(3)
13.(4)
14.(5)
15.(6)
16. (7)
17. (8)
18.(9)
19. (10)
20.(11)
Tax
provision
0)
697582.69
428000.00
267782.69
35616.90
166465.00
65700.00
137882.30
53196.40
40704.00
0.00
2540.00
16.80
58360.00
75601.00
21754.00
4904.00
38895.60
11022.50
25960.00
28728.80
Profits
before
tax
(2)
975206.81
419740.00
555466.81
20873.00
371087.91
163505.11
347870.59
153207.70
54388.50
—30.60
4652.50
—5696.80
115356.70
202445.00
47895.00
4868.20
55727.00
26180.00
40321.00
63748.80
Adjusted
profits
before tax
(
0)
59143.28
—256954.17
329321.72
—34882.89
264743.06
94565.46
182463.66
101795.30
43729.72
—502.36
4289.05
—13985.10
63627.02
128932.60
32773.16
— 1251.99
35874.15
8965.69
26441.43
47136.12
Actual
effective
tax rate
' percent
age)
(4)
71
102
48
171
45
40
50
35
75
—
55
—
51
37
45
101
70
42
64
45
Adjusted
effective
tax rate
(percent
age)
(5)
1176
—
81
—
63
69
76
52
93
—
59
—
92
59
66
—
108
123
98
61

102 Inflation Accounting and Corporate Taxation
The implication of this set of tables is obvious. Inflation
has caused the corporate manufacturing sector to bear a
substantially higher real tax burden than is revealed by histori
cal cost accounting. Even when we realise that the adjusted
effective tax rates would fall once the adjustment for net finan
cial liabilities is undertaken, it is unlikely that the above
conclusion will be controverted. This is because the net financi
al liabilities are likely to be much smaller than total fixed assets
in general. Also, given the fact that depreciation adjustment
is cumulative and that many of the fixed assets have lives which
are longer than the period for which a loan is generally kept
outstanding, the adjustment for net financial liabilities is likely
to be outstripped by depreciation adjustment alone, at least in
the case of manufacturing companies. The scenario for other
types of companies (financial or service) is less clear.
The corporate manufacturing sector, it is also clear, cannot
really afford the dividends it has been paying, if it wants to
grow in real terms with internally generated funds. Tt has been
growing by using the alternative of external funds, which implies
that through taxing the corporate sector too heavily in real
terms, the government is transferring a part of the investible
surplus of the economy to itself.
Of course, taxation is not entirely to blame for the capital
erosion in real terms. As the results in Table 8-1.5 show,
profits before tax are negative for many groups. In such cases,
even if taxes were nil, capital erosion would occur in real terms;
but what should be the remedy is not clear. If inefficiency is
the cause, inflation accounting would help the investors to
recognise it as such and decide about the future of such
companies. In other cases, alternative policy measures can be
weighed and decided upon.
2. Estimates for the Population
We now present the blown-up estimates of the two major
inflation adjustments and estimate the impact in quantitative
terms for the population of the whole corporate manufacturing
sector for the year 1979. These are arrived at after the amounts
to be adjusted as well as the other figures were blown up sepa
rately for the government companies and the three age-groups
of non-government companies, and then summed.

The Extent of Overtaxation: Final Results 103
Table 8.2
Est '"mates for the Population of Manufacturing Companies
(Rs WO)
Items Using consu
mer price
index
Using general
wholesale
price index
Using implicit
GNP deflator
(1) (2)
Profits Before Tax 11687639
COSA 469314
Depreciation Adjustment 4730245
Adjusted Profits before Tax 6488689
Tax Provision 5923327
Nominal Effective Tax
Rate(%) 51
Adjusted Effective Tax
Rate(%) 91
(3)
11687639
12910100
5276069
—6498530
5923327
51
11687639
2282217
4499670
4905752
5923327
51
121
Adjustment for inflation is the least when we use the consu
mer price index and the most when we use the general wholesale
price index. The major difference, however, is due to COSA,
and since it depends on the movement of the particular price
index during the course of only one year, the same calculations
for another year may reveal a different pattern regarding adjust
ment for inflation and the price index used. Taking even the
lowest adjustment among the three, it is seen that historical cost
profits are almost 80 per cent higher than the adjusted profits.
The adjusted effective tax rate is 91 per cent. Use of the other
two indices reveals that the tax burden is far in excess of the
capacity. That inflation is causing overtaxation of corporate
capital income is evident; the minimum overtaxation, by our
calculations, is 78 per cent (using consmer price index).
This kind of heavy taxation (in real terms), coupled with
our finding that the real profitability is far lower than that
shown in the accounts, implies that the corporate sector is
being asked to pay taxes beyond its capacity. The inimical
aspects of such a situation hardly need to be stressed.

9 POLICY IMPLICATIONS
In this chapter, we intend to bring together the implications
of the results of the study running over the last four chapters.
It must be emphasised, at the risk of being repetitive, that our
calculations are not complete, as no adjustment was made for
net financial liabilities. We can make a fairly reliable guess as
to their direction (which would be to raise real profits), but our
guess about their magnitude would be, in the circumstances,
very tentative for reasons explained earlier in the text as well
as in Annexure I.
The implications that are traced below are based on the
assumption that the adjustment for financial liabilities would
not be large enough to cancel out the other two adjustments
to such an extent as to render the total inflation adjustment
altogether insignificant. Thus, our conclusions that follow are
based on the presumption that inflation does reduce the real
profits substantially under current tax laws and causes signi
ficant overtaxation of the return on corporate capital. Given the
debt-equity ratios, average length of time during which loans
are kept outstanding, and the absolute amounts of net financial
liabilities xis-a-xis gross fixed assets, we believe this presump
tion to be reasonable for the corporate manufacturing sector,
as stated earlier. If the conclusions seem too strong to be
credible, it is perhaps because they are based on published
accounts, which it is sometimes alleged, do not always reflect
the true economic position of the companies.1 For a study
like the present one, however, there is no alternative.
1. Implications for Investment
Our results show that the post-tax real profits are considera
bly reduced due to inflationary conditions through the corpora
tion income tax structure. Profitability and retained earnings
*See, for example, Mahindra (1985), "Managing the Bottom Line",Chartered Accountant, Vol. 34, pp. 202-206.

Policy Implications 105
arc important determinants of investment on the demand and
supply sides respectively, and so the adverse impact of inflation
on investment through the tax mechanism can easily be deduc
ed. Additionally, as explained earlier, the combination of
inflation and historical cost-based tax laws amount to siphoning
off resources from the private sector to the public sector. This
almost certainly affects the supply of investible capital to the
private sector from the same.
Moreover, as we have seen, the deleterious effects of
historical cost-based corporation income tax in inflationary
periods are not uniform across companies. They seem to snow
ball over the years, so that older companies are hit harder than
the new companies. Also, the impact over industries differs.
This implies that the selection of investment projects becomes
sub-optimal as the ranking of the projects according to the
social rates of return differs from that by the private rates of
return.
2. Implications for Capital Structure
Corporation income tax, as is well-known, discriminates
in favour of debt because of the interest deducibility provision
in the tax laws. Inflation probably strengthens this discrimina
tion, since, while the desired rate of return on shares rises in
nominal terms with inflation, the rate of interest on debt is
usually fixed in nominal terms because of its contractual
nature.
Quite apart from this, our results indicate that under infla
tion the corporation income tax causes capital erosion in real
terms. To keep capital intact, the companies have to get
additional capital (either debt or share issues) continually. In
the absence of inflation and its impact on real profits through
the corporation tax, these would not be necessary as retained
profits would be used for growth. To the extent that the addi
tional capital mentioned above is in the form of debt, inflation
is further contributing to the tendency towards higher debt-
equity ratios.
3. Profit Allocation
The basic effect of historical cost-based system is, of
course, on profits. However, the way companies are adjusting

106 Inflation Accounting and Corporate Taxation
themselves to the real profit crunch is of interest to us, because
those actions are likely to cause further ripples in the economy.
Of special interest is the way the nominal profits (which, in
real terms may not be profits at all, or at least much lower) are
used.
Considering operating profits, they can be allocated to four
heads: tax provision, tax-induced savings, dividends, and
retentions.
Among the four, as the figures show, dividends are paid
more or less regularly. It seems to be a puzzle that in spite of
the possibility of paying shareholders through capital gains
(higher retentions would raise the market value of the shares)
which are lightly taxed, and, more importantly, the fact that
real profits are too small to pay dividends, dividends are paid
so regularly. No firm explanation can be provided for this
phenomenon except for the possibility that the shareholders
demand a regular stream of income without having to go
through capital market operations every once in a while. As
our results show, this behaviour costs the companies valuable
investible capital which they have to raise from the capital
market. This is because of the fact that given post-tax profits,
the higher the dividends, the lower are the retained earnings.
As for the tax-induced savings (development rebate/
investment allowance), ability of the companies to take advan
tage of these are actually quite limited because of the low
real profitability. However, as it is. the high effective real tax
burden must be forcing the companies to place undue emphasis
on tax planning to save on taxes and probably forcing them to
save under these heads more than they would otherwise do.
Even after taking full advantage of these tax incentives, the
companies only have some tax-free resources at their command
with certain restrictions. Without inflation or with an infla
tion-adjusted tax base, they would have a large portion of the
same resources (again tax free, because then these would be
properly deducted from the tax base as legitimate deductions
and allowances) to use as they see fit. This means they would
use it in a way which would maximise their returns, whereas
the restrictions on tax-induced savings may force them to use
such savings sub-optimally, causing inefficient allocation of
resources. Thus, although inflation-adjusted tax base may

Policy Implications 107
result in smaller amounts saved as investment allowances,
it may achieve the ultimate goal of capital formation in a more
efficient manner. After all, indiscriminate reinvestment is not
even socially desirable.
Tax provision (and tax revenue to the government) would
certainly be smaller if inflation accounting is allowed because
of the smaller tax base, but even from the long-run revenue
point of view, it is desirable to adjust the tax base for inflation.
Otherwise, overtaxation on a continuous basis would hamper
the growth of the corporate sector, which would cause the tax
revenue to fall in the long run. The lacklustre growth of the
corporate sector vis-a-vis the non-corporate business sector is
already well-documented. With a reasonable tax policy, the
long-term prospects of a healthy corporate sector, and hence a
steady flow of tax revenue, seem both possible and desirable.
In any case, if a particular measure eliminates important in
efficiencies in the system, makes it more neutral, and encourag
es growth, revenue considerations should not come in the way
of implementing such a measure. There are examples of other
countries where the revenue authorities have themselves ad
vocated some sort of inflation adjustment (e.g., the Treasury
Department proposals in the USA). It goes without saying,
however, that such reforms cannot be made in isolation, but
the whole tax system has to be suitably revised. Otherwise,
while trying to eliminate one distortion, a number of others
will emerge.

ANNEXURE I
A NOTE ON THE ADJUSTMENT OF MONETARY
ASSETS LIABILITIES FOR INFLATION
Monetary assets or liabilities, by their very nature, should
not and cannot be adjusted with specific price indices. All
adjustments for inflation must be carried out using a general
price index which reflects movements in the general price level
for the monetary assets/liabilities.
Monetary assets include, among other things, loans and
other receivables, investments, advances, deposits and cash.
Monetary liabilities, on the other hand, include debts, deferred
payments, other current liabilities and equity capital. Out of
these, both the theory and practice of adjusting equity capital is
very unclear yet. Adjustments in monetary assets/liabilities
ultimately boil down to two parts: adjusting net current assets/
liabilities, and adjusting the long-term debt. Depending on the
information available and the inclination of the person carrying
out the adjustments, they can be done at different levels of
complexity.
The easiest method would be to apply the formula we have
used to find out COSA, net monetary liabilities (not considering
equity capital) substituting figures for inventory.
The most complicated method, requiring detailed infor
mation, will be to use that formula only on net current liabili
ties. Then, assuming that the years in which each investment
was made as well as those in which each long-term loan was
taken are known, each investment and loan will have to be
inflated using the ratio of price index in the current years and
the price index in the relevant years. To express it as a formula,
the adjustment for the long-term gain on monetary assets and
liabilities would be

Annexure I 109
f *LLl-yLp
y=l
where/and y refer to each financial liability and asset, pt-andp j refer to the price index in the year the /th liability was in
curred or they'th asset was formed, P refers to the current price
index, L refers to long-term financial liabilities and A refers to
long-term monetary assets, i.e., investments. The gain calcu
lated in the above way will have to be added to the gain on net
current liabilities and the total will yield the gain due to infla
tion on net monetary liabilities.
This, obviously, is a complex method, particularly for an
analysis like the present one where a group of companies are
being considered. However, it may not be very difficult for
individual companies themselves.
A middle way would be to do the calculations for net
current liabilities as above, while simplifying the calculations
for long-term assets and liabilities. A particular year could be
adopted as the year (on whatever basis) in which most of the
investments were made, and the current value of the invest
ments can be found out by multiplying the nominal value with
the ratio of the general price index in the current year and in
that particular year. A similar procedure would yield the
current value of the longer-term liabilities (excluding equity
capital). The adjusted net long-term liabilities minus the
nominal net long-term liabilities can be said to be the gain due
to inflation. To this the gain on net current liabilities should be
added to find out the total gain due to inflation, as far as
financial liabilities and assets are concerned.
The above discussion refers to the changing values of the
assets and liabilities themselves. Whether the gain/loss comput
ed in the way(s) mentioned above can really be included as
income/expenditure, and if so, when, is another tricky question.
Two items in the income statement also may require adjust
ments for inflation—interest received and interest paid. The
rationale for this adjustment is that the interest rate agreed
upon at the time of concluding a loan agreement is in nominal

110 Inflation Accounting and Corporate Taxation
the year in which the loan is taken. Thus, a net borrower
profits and a net lender loses. These gains/losses, as it is argued,
should be included in the income and expenditure statement.
However, in this case also there is a complication. It can be
argued (Jenkins, 1977) that during periods of continuous infla
tion, an expected rate of inflation is built into the interest rates,
and' therefore, as long as the actual inflation rate is the same asthe expected rate of inflation, any adjustment is unnecessary. If
and only if the actual differs from the expected, that any adjust
ment in the interests paid/received is called for. This seems to
be a valid argument, but an attempt to take this into account
will land one into the calculation of expected inflation rate
which is far from simple.
There is another aspect to this. Assuming that all econo
mic units within the economy adjust their accounts for inflation,
the total inflation adjustment on this cancel out because if some
body gains as a net borrower, someone else will lose as a net
lender. However, for taxation purposes, the adjustments for
inflation would probably be important, because the rates of tax
on the gainers and losers may be different, and therefore the
aggregate tax revenue may differ from a situation where no
adjustment for inflation is allowed. Taking the corporate
sector, broadly speaking, the manufacturing companies gain
during inflation because they are net borrowers and financial
companies lose because they are net lenders.

Annexure II
Table A-II.l
Specific Wholesale Price Indices used in calculating COSA
of the Industry Groups {Finished Goods)
Industry group
{present study)
4.
5.
6.
7.
8.
9.
10.
— i.
Price indices used {weights within parentheses
in case of composite index)
Other Food Articles (1.60)
Fuel, Power, Light and Lubricants
Dairy Products (0.39), Grain Mill Products(0.46), Sugar (2.19), Beer (0.05)
Textiles
Chemicals and Chemical Products
Ceramic Tiles (0.06), Glass and GlassProducts (0.2), Cement, Lime & Plaster
(0.7), Asbestos Brake Lining (0.03)
Basic Metals and Alloys
Non-electrical Machinery
Electrical Machinery
Transport Equipment

112 Inflation Accounting and Corporate Taxation
Table A-I1.2
Specific Wholesale Price Indices used in calculating COSA
of the Industry Groups (Raw Materials and Work-in-
Progress)
Industry group
(present study)
1.
2.
3.
4.
5.
6.
8.
9.
10.
. ■
Price indices used {weight within parentheses
in case of composite index)
Other Food Articles (1.60)
Iron Ore (0.16)
Petroleum Crude (0.6)
Coal (1.04)
Wheat (3 43), Milk and Milk Products (6.15),Other Food Articles (1.6), Sugarcane (1.64)
Cotton Raw (2.25)
Jute Raw (0.43)
Chemicals and Chemical Products
Other Minerals
Metallic Minerals (0.2°)
Basic Metals & Alleys (4.65)
Basic Metals & Alloys
Basic Mecals & Alloys (4.65)Chemicals & Chemical Products (5.55)
Glass & Glass Products (0.2)
Basic Metals & Alloys
REFERENCES
1. Aaron, Henry J. (Ed.) (1976). Inflation and Income Tax,
Brookings Institution, Washington D.C.
2. Baxter, W.T. et. al. (1976). Economic Calculations under
Inflation, Liberty Press, Indianapolis.
3. Baxter, W.T. (1976). "Inflation Accounting: A British
View", in Baxter et. al. (1976), pp. 157-189.
4. Committee of Inquiry into Inflation and Taxation
(Chairman: R.L. Mathews) (1975). Inflation and Taxation,
Australian Government Publishing Service, Canberra.
5. Chandhok, H.L. (1978). Wholesale Price Statistics (Vrols.
T & II), Economic and Scientific Research Foundation,
New Delhi.
6. Davidson, Sidney and Roman L. Weil (1976). "'Inflation
Accounting: Implications of the FASB Proposal", in
Aaron (Ed.) (1976), pp. 81-114.
7. Fabricant, Solomon (1976). "Economic Calculations
under Inflation: The Problem in Perspective", in Baxter
et. al. (1976), pp. 21-63.
8. FederatioiLPf Indian Chambers of Commerce and Indus-
try (I979J. 'Summary Report of the Workshop on Inflation
Accounting, New Derhi '*
9. Feldstein, Martin and Lawrence Summers (1979). "Infla
tion and the Taxation of Capital Income in the Corpo
rate Sector", National Tax Journal, Vol. 32, pp 445-470.
10. Fletcher, William H. (1976). "Economic Calculation by
Capital Intensive Industries during periods of Inflation",
Baxter et. al. (1976), pp. 217-246.
11. Gravelle, Jane G. (1980). "Inflation and Taxation of
Capital Income in the Corporate Sector: Comment",
National Tax Journal, Vol. 33, pp. 473-483.
12. Gupta, Ramesh (1983). Inflation Accounting, Tata Mc
Graw-Hill, New Delhi.
13. Hart, Peter J. H980). "Accounting for Inflation in the
United States", National Tax Journal, Vol. 33, pp. 247-
255.
14. Hasbrouck, Joel (1983). "The Impact of Inflation upon

114 Inflation Accounting at.d Corporate Taxation
Corporate Taxation", National Tax Journal, Vol. 36,
pp. 65-81.
15. Inflation Accounting Committee (Chairman: F.E.P.
Sandilands) (1977) Inflation Accounting, HMSO,
London.
16. Institute of Cost and Works Accountants of India
(1975). Inflation Accounting: Tools and Techniques,
Calcutta.
17. Jenkins, Glenn P. (1977). Inflation: Its Financial Impact
on Business in Canada, Economic Council of Canada,
Ottawa.
18. Johansen, Lief (1965). Public Economics, North Holland,
Amsterdam.
19. Mendenhall, John R (1980). 'Tax Indexation for Busi
ness". National Tax Journal, Vol. 33, pp. 257-263.
20. Murao. Bahadur (1975). Inflation Accounting as a Tool
to Fight Inflation, ICWAI, Calcutta.
21. Schultz. Helen E. (1976). -'Introduction", in Baxter
et. al. (1976), pp. 9-16.
22. Shoven. John and Jeremy Bulow (1976). "Inflation
Accounting and Non-Financial Corporate Profits: Finan
cial Assets and Liabilities", Brooking Papers on Econo
mic Activity, pp. 15-66.
23. Shoven, John and Jeremy Bulow (1975). "Inflation
Accounting and Non-Financial Corporate Profits: Physi
cal Assets", Brooking Papers on Economic Activity,
pp. 557-611.
24. Sprouse, Robert T. (1976). "Inflation, Accounting
Principles, and the Accounting Profession", in Baxter
et. al. pp. 107-133.
25. Study Group on Inflation Accounting (Chairman: R.M.
Honavar) (1978). Report, Department of Economic
Affairs, Ministry of Finance, Government of India, New
Delhi.
26. Tanzi. Vito (1981). "Inflation Accounting and the Taxa
tion of Capital Gains of Business Enterprises", in Karl
W Roskamp and Francesco Forte (eds.) (1981), Reforms
cfTax System, Wayne State University Press, Detroit,
pp. 87-101.

References 115
27. Terborgh, George (1976). "Response" in Baxter et. al.
pp. 87-91.
28. Tideman, T. Nicolaus and Donald P. Tucker (1976).
"The Tax Treatment of Business Profits under Inflation
ary Conditions", in Aaron (ed.), pp. 33-77.

2 Inflation Accounting and Corporate Taxation
cial data and other information from the annual reports of the
sample companies possible. In some cases the annual reports
were not available and these were obtained either directly from
the companies concerned or the computer section of the Indian
Institute of Public Administration (IIPA). Thanks are due to
Dr. S.K. Goyal of IIPA, and the concerned officials of various
companies for the co-operation extended by them to the study
team.

THE NATIONAL DItB'I'Im @F PUBLIC FINANCE! XND New Dabis b rn ~ u ~ ~ w , orpnhtiun whoor, &a fa-ns q p ~ . to arrl, out reward, do coluitanq work f'or guvrmmegts aad implcff trai* ing to tho ofsdah of vulou#overa* men& in publb &.ncr .ad rcLtrd fields of policy. In . d d t t i ~ m to e t a k i o s - original rsltuca work, tho astiturn '
skives to fdN tb role of a vuhicle' trurri'erring the msolts of rppliad research to policy making in th8c~wt.t-y in the reaim of public h y m . The Institute also acts .r a
which o.rC162dsls belonging to the and State governmenta, rep- of the private sector, leading institution8 and academicians 1- a- change idem md information. Wit& thb end in viaw, seminar8 and co- arc organbod by the Xnrtituts f#m UP* to time. However, its main acWSim relate to research conducted on it@ urn initiative and &at rponaorcd by 6 e mamba ~overnmeatr. (Publidu&8 of the Iartituta ut listed on tb @kt back.)

8
- , 8 . '
& I , * * - -5
". . , + , &
NIPFP PUBLICATIONS I'
hcldsncs of IndOwct Taxatha 1. Irdir f 9%7i r .
(1979) N@FP ,
T*ulimB8#bUb.F.Ynl- (1981) A W Plab-
fiiahm Tax 8-8m b (1981) %rIjya Publkatimu
Iucl&m(~ of ldfrect T 1 s l h in w i a ( H i d Vanion) (198 1) NIPFP
Meruraemcnt ef T u E f f d ef State G a m ~ d a WS'H (19112) Somaiya
. * ' '-:- F - I > 8 <+t'II X m y d oft& Pasearl h e n t o T u - 14" ...
4 (1982) NIPFP
F-1 I a t t . t i ~ a ~ ul C-te T u mriy (1982) NIPFP
T u Tnrtmtlt d private Tmta '1983) NIPFP
Central Gorerumt ExpemNtmrc Gmwth, &mch4 J I m ~ c f ( W M 1 to 1Sn-78)
(1983) NIPFP Emby Tax 8# 8n i ) ,&tr~t fW t@ m i
1 (1984) NIPFP
pI.a@e9 am4 Cetbm Tutt* PaMer (198.6) NWFP
0f tb Bhct k..ml hi mi8 , (1984) NIPFP
I W B A- d -to T.uti.a '(W7) NIPPP
NATIONAL INSTITUTE OF PUBLIC FINANCE O Nslr rnhi 1 1 m
. d

![Yet another DSL for [1ex]Financial Contracts - and …code.ouroborus.net/fp-syd/past/2016/2016-04-Berthold...Overview 1 Prelude SneakPreview TheContext 2 IntroducingtheDSL 3 DenotationalCash-FlowSemantics](https://static.documents.pub/doc/80x56/5f5a3cb41f053c6c8050df3d/yet-another-dsl-for-1exfinancial-contracts-and-code-overview-1-prelude.jpg)


