TAPPING THE POTENTIAL Best practice in assessing urban housing capacity A report by… URBED (the Urban and Economic Development Group) for… The Department of the En- vironment Transport and the Regions July 1999
Transcript
TAPPING THE POTENTIALBest practice in assessing urban housing capacity
A report by… URBED (the Urban and Economic Development Group)
for…
The Department of the En-vironment Transport and the Regions
July 1999
TAPPING THE POTENTIALBest practice in assessing urban housing capacity
A report by… David Rudlin
URBED (Urban and Economic Development Group)
for…
The Department of the Environment Transport and the Regions
July 1999
41 Old Birley StreetHulme, ManchesterM15 5RF0161 226 50780161 226 7307
Identify urban areas to be assessed Consider all sources of capacity
Section 3 - SURVEYING THE CAPACITY
Quantifying the capacity Start with what you know Use existing data Survey methodologies Comprehensive surveys Priority area studies Typical urban area studies
Section 4 - ASSESSING THE YIELD
Using land efficiently Density multipliers Design-led approaches Yardsticks
Section 5 - DISCOUNTING POTENTIAL
Moving from unconstrained capacity How to discount Discounted capacity Testing
Annexes
Annex A – Useful data sources Annex B – Summaries of main case studies examined
Planning Policy Guidance note 3: Housing (PPG3) sets out a new policy direction for the delivery of housing through the planning system based upon the 'plan, monitor and manage' approach. An essential feature of plan, monitor and manage is that new homes are provided in the right place and at the right time. PPG3 establishes that priority should be given to re-using previously-developed land within urban areas, bringing empty homes back into use and converting existing buildings, in preference to the development of greenfield sites1. The national target is that by 2008, 60% of additional housing should be provided on previously-developed land and through conversions of existing buildings.
In order to make the best use of the potential to recycle land and buildings in any one location, PPG3 has for the first time set out the expectation that all local planning authorities should undertake urban housing capacity studies2. These studies are now at the heart of the planning for housing process, and form the basis for both the sequential approach and the managed release of sites.
This short guide to better practice is based on a programme of research with local planning authorities. It draws on examples of good practice from the level of the region through to the district. As appropriate, reference is made to the studies which informed the guide so as allow readers to refer to them for further information3. It also cross refers to the National Land Use Database which local authorities are updating.
The guide is not intended to be the ‘final word’ on this subject, nor indeed does it attempt to prescribe how urban housing capacity studies should be carried out. Rather, it is designed to highlight the issues authorities will encounter in undertaking their capacity work and to act as a checklist of the various options available and decisions which have to be made at any point in the capacity assessment process.
The text describes an approach to assessing urban capacity which can be followed systematically. The approach has four main stages:
listing the capacity sources; surveying to identify the opportunities; assessing the potential housing yield; and, discounting the potential to provide a assessment of the capacity that can be realised.
These stages are summarised in Table 1, with each stage forming a separate section of the guide. To help in navigating the guide, the summary is reproduced at the start of each section with the stage reached highlighted.
1 PPG3, paragraph 2 2 PPG3, paragraph 24 3 Short descriptions of the methodologies used by the studies are provided in Annex B
5
Table 1: Assessing urban housing capacity
Principles
As explained in PPG34, all local planning authorities should undertake urban housing capacity studies. Each local authority will be responsible for evaluating the capacity of their area but regional planning bodies should co-ordinate the programme of capacity studies undertaken by constituent local authorities and maintain consistency of approach by agreeing the standards to be applied.
It is anticipated that regional planning bodies (RPBs) will draw on urban housing capacity studies in proposing, and reviewing, the recycling target for their region and in developing the spatial strategy set out in regional planning guidance. For example, in some regions or sub-regions there may be concentrations of previously-developed land within one authority and a lack of it in neighbouring authorities. In such circumstances, the spatial strategy should focus new housing development in areas where previously-developed land is available in preference to developing greenfield sites. Structure
4 PPG3, paragraphs 24 - 27
Identifying capacity sources
identify urban areas to be assessed consider all sources of capacity
Surveying the capacity
quantifying capacity start with what you know use existing data survey methodologies comprehensive surveys priority area studies typical urban area studies
Assessing yield
using land efficiently density multipliers design-led approaches yardsticks
Discounting potential
moving from unconstrained capacity how to discount discounted capacity testing
6
planning authorities will also wish to draw on urban housing capacity studies to ensure that housing requirements are apportioned between districts in a way that maximises the use of previously-developed land and buildings and minimises the use of greenfield land.
Capacity studies will underpin the process of planning for housing and should be undertaken (or reviewed) at least as frequently as plans are prepared and rolled forward. The PPG3 monitoring process5 will enable authorities to keep under review the assumptions they have used in capacity studies, for example by highlighting trends in the recycling of sites and buildings. The information from capacity studies will be a major factor in allocating sites for housing and in their managed release6. Many different parties will draw from the information in the studies, so it is crucial that all aspects of the process of assessment are readily understandable, transparent, and rigorous. Inevitably professional judgement will be brought to bear at different stages in the process. The assumptions underlying these judgements should always be clear.
In assessing the capacity of their areas, local planning authorities should seek to develop a partnership with other participants in the development process in order to pool knowledge, skills and experience. The search for sites and assessments of their capacity will benefit from the detailed knowledge this can generate. Working in partnership, whether with landowners, housing developers or their representative bodies, can also help reduce disputes about the overall outcome of the capacity process and the assumptions used. In particular, partnership working can prove beneficial in order to:
identify the location of potential sites for dwellings; and understand the likely timescale for the development or redevelopment of these sites, including
potential constraints, which will need to be overcome.
5See ‘Monitoring Provision of Housing through the Planning System. Towards Better Practice’. DETR, 2000 6 See ‘Planning to Deliver. The managed release of housing sites: towards better practice’. DETR, 2000
Data handling Geographical Information Systems: putting capacity information onto a Geographical Information System (GIS) is one way of ensuring that information is ‘trackable’ and easy to maintain for monitoring purposes. It will help to reduce the time spent in reviewing capacity in the future, by building up a baseline of data and knowledge about the built stock and sites in each authority area. It will also help to integrate work on urban housing capacity studies with other geographical datasets such as the updated National Land Use Database - Previously Developed Land (NLUD-PDL) which will include digitised site boundaries.
NLUD-PDL: should be a key starting point for the work on capacity. It provides information on previously-developed sites that are vacant or derelict, or if in use have a planning allocation, permission for redevelopment or known development potential without planning status. Information is also provided on conversions. All local authorities are encouraged to use the NLUD database tool to maintain this information. The NLUD website www.nlud.org.uk provides further details.
7
Many authorities have experience already of such joint working through activities such as the 'housing land availability' studies which were required prior to the issue of the current PPG3. The partnership approach which is adopted should build on this experience.
It will also be important not to reach premature conclusions about potential. As many sites as possible and all options should be considered initially. Information from NLUD on previously-developed land will provide a valuable start through identifying previously developed vacant and derelict sites and other land in use which may be available for redevelopment. But NLUD-PDL provides only part of the type of urban housing capacity study envisaged by PPG3. Further potential can be identified through the additional capacity sources considered by this guide. It is also important to note that some of the assumptions made by local authorities in providing their NLUD returns were constrained by the development plan policies extant at the time the estimates were made. In the update of NLUD-PDL, local authorities are asked to ensure a 'neutral' recording of the sites in each land category to which information on the current planning status can be attached.
The planned extension of NLUD to all land uses according to a consistent classification will provide a base for assessing and recording the potential capacity of the various parts of the urban area.
8
SECTION 2 IDENTIFYING CAPACITY SOURCES Identify urban areas to be covered
The first step in assessing urban housing capacity is to consider which places are to be considered in the study. In other words, where are the search area boundaries to be drawn?
There are various definitions of ‘urban’ available, and these can help to define boundaries7. But there are problems applying these, mostly statistical, definitions to capacity studies. This is because defining urban areas for the purposes of a capacity study is not a simple statistical exercise which has no reference to policy priorities. For example, an important objective of PPG3 is to promote sustainable patterns of development.
Although the magnitude of the opportunity will differ, a wide range of settlement types can contribute to sustainable development. For example, a previously-developed site in a village could provide the opportunity for essential new homes, which could in turn help to sustain local shops and services and public transport. It follows that urban housing capacity studies can be relevant to rural areas. A useful rule of thumb is to include in the capacity study all settlements that may be considered for housing development.
Therefore, in considering the areas in which to search for housing capacity local authorities could assume that 'urban' embraces all settlements that can contribute to sustainable patterns of development. Typically these would (or have scope to) contain shops and services, be accessible by public transport and be capable of having a sensible settlement 'envelope' drawn around them8. In many instances the envelope would already have been identified in a local plan.
It should be noted that ‘rural exception sites’ are in addition to identified capacity and probable windfall9 potential in that they relate to land which would not normally be released for housing. They are (by definition) sites only to be released where exceptional needs become evident, and they could be previously-developed or greenfield sites. 7 PLUS research project references 8 Settlement envelopes should be drawn to avoid including significant tracts of open countryside 9 For further information see box on page mm 'What is a windfall?'
ASSESSING URBAN HOUSING CAPACITY
Identify the capacity sources o identify urban areas to be assessed o consider all sources of capacity
Surveying the capacity Assessing yield Discounting potential
9
Consider all sources of capacity
The next step in a capacity study is to identify as many sources of capacity as possible within the area(s) of search. A simple tabulation of the sources can help frame the process and provide an easy way to collate data. Figure 1 uses the capacity sources considered in this guide, overlain by the stages envisaged in an urban housing capacity study. Figure 1: Tabulating the capacity sources
Source Survey approach Unconstrained yield
Discounted assessment
Subdivision of existing housing
Flats over shops
Empty homes
Previously-developed vacant and derelict land and buildings (non housing)
Intensification of existing areas
Redevelopment of existing housing
Redevelopment of car parks
Conversion of commercial buildings
Review of existing housing allocations in plans
Review of other existing allocations in plans
Vacant land not previously developed
It is important that appraisals should consider as many sources of capacity as possible, no matter how unlikely some sources and locations may initially appear in terms of the current housing market. Many of the capacity studies reviewed in the preparation of this guide did not consider some significant capacity sources (one ignored as much as 60% of total potential capacity). This may not have been a problem when a study was designed solely to illuminate a particular issue, such as the scope for intensification. However, when the intention is to assess an authority’s total urban housing capacity – as PPG3 requires – then it is important to ensure that all potential sources of housing capacity are considered.
In considering these sources, it is crucial that all previously-developed land10 is brought within the purview of the study. A misconception has been that only vacant and derelict land should be considered, ie the type of site commonly associated with the term ‘brownfield’. But this is only one possible source. In fact on a national level this source may make up only as little as a third of overall capacity and in parts of the country it is not a major source of capacity at all11. Studies focusing on this source alone would be grossly deficient. Three other sources of capacity commonly omitted from studies have been the scope to
10 For the definition of previously-developed land see Annex C of PPG3 11 ‘Conversion and redevelopment – Process and Potential’. DETR research, published March 2000, by Llewelyn-Davies and the University of Westminster.
10
provide dwellings through flats over shops, residential subdivision and bringing empty homes back into use. Yet in aggregate these three sources alone could make up almost 40% of potential capacity nationally12. The main sources of capacity which should be assessed by urban capacity studies are set out in Figure 1. These are now addressed in turn. The subdivision of existing housing
The subdivision of existing housing into two or more units is something that many studies found difficult to estimate, but it is a significant potential source of new homes. For example, research by Llewelyn Davies for the Joseph Rowntree Foundation13, the SRQ (Sustainable Residential Quality) study14, and the North West Regional study15 suggested that the potential from residential subdivisions may be as much as four times the capacity from vacant and derelict sites. Where subdivision has been considered authorities have differed widely in their assumptions about the extent to which residential subdivisions can occur in any given area. For example, in a South West Regional capacity study16 it was found that assumptions made by different local authorities could alter estimates by up to 300%.
Whatever the assumption used, if the best use is to be made of urban capacity, residential subdivisions should not be ignored. They could be a substantial source of capacity, as is evident from the studies in London and the North West. The key concern for capacity studies is to establish a realistic appraisal of potential from residential subdivision (the theoretical potential is enormous if it were assumed that across the country every large house could be subdivided) 17. Flats over shops
There is likely to be potential to convert the space over shops (and local offices etc) to flats whatever the size of settlement, including villages. Estimates of the potential of this source vary, but all point to its significance. For example, the Living Over the Shop (LOTS) project initially estimated that the national potential for flats over shops was around 500,000 units18. Later work in Stockton on Tees19 suggested that this might be a conservative estimate. Survey work in London20 has pointed to a capacity of as many as 100,000 dwellings over shops (60% of which are already in residential use), and work by URBED21 has postulated a theoretical national capacity of over one million dwellings. Empty homes
A significant source of capacity is the number of empty homes that can be brought back into use. The stock of empty homes in England varies around the figure of 750,000 dwellings22, which is about 3.7% of the total housing stock. 12 URBED 1998 [unpublished review of 15 capacity studies from around England] 13 ‘Providing More Homes in Urban Areas’, Llewelyn Davies, SAUS in association with JRF, 1994. 14 ‘Sustainable Residential Quality – New Approches to Urban Living’, Llewelyn Davies, LPAC, 1998. 15 ‘Exploring Urban Potential for Housing’, Lewelyn Davies, Northwest Regional Association, 1997. 16 ‘Strategic Study of Urban Housing Potential’, Baker Associates, Southwest Regional Planning Association, 1998. 17 This is considered in sections 4 and 5 18 ‘Living over the shop’, Anne Petherick, SUN Dial 5/URBED, Autumn 1997. 19 ‘Living over the shop in Stockton Upon Tees’, Anne Petherick. 20 ‘Dwellings over and in shops in London’, Civic Trust/LPAC, 1998 21 ‘Tomorrow, a peaceful path to urban reform’, David Rudlin, Friends of the Earth, 1998. 22 The figure in July 2000 was 772,000 (Source, DETR).
11
Concern has been expressed about the inclusion of empty homes in capacity studies because they are outside the direct control of the planning system. Also, as the majority are in the private sector23, they are not directly susceptible to local authority management24. Some vacancies are also necessary to allow the normal operation of the housing market (for example when houses are empty pending re-sale or re-let) and some will be under repair25. But as vacancies may make up as much as 13% of total potential additional housing capacity26 they should not be ignored by capacity studies.
It is the unnecessary vacancies that are of particular concern and it is here that capacity studies should focus their efforts. Various studies have suggested that the capacity from empty homes should be based on the extent to which local vacancy rates exceed national or local averages.
Monitoring the take up of vacancies in the private sector can prove difficult. This, together with the fact that the rate at which vacancies are filled is not readily susceptible to planning control, has meant that assumptions about reductions in vacancies have tended to be taken into account at the stage housing requirements are established through regional planning guidance, rather than treating vacancies as a potential contributor to the housing supply identified to meet housing requirements. It is of course important to avoid double counting. Previously-developed vacant and derelict land and buildings
Nationally, this is a significant source of housing capacity and includes a large variety of sites. For example, the category includes former industrial land, derelict buildings and vacant lots. Some sites in the category may have temporary uses on them such as car parking. Essentially these are the sites which fit with the normal public perception of ‘brownfield’. Many sites will have been identified through NLUD-PDL which pulls together various data sources and should be seen as a principal starting point. Some studies have sieved sites by size category, breaking sites down into large and small sites, and some have focused effort on the large sites solely. Large sites
These have been typically defined in studies as over 0.4ha although this varies. Some local flexibility on the size criterion is not inappropriate given, for example, in the centre of a large city there may be few sites over 0.4ha, whereas in former industrial areas sites over 0.4ha could be commonplace. If the capacity study is to focus only on 'large' sites, it is important that the threshold chosen does not rule out of consideration significant sources of capacity.
Large vacant and derelict sites can be a 'blind spot' for capacity studies. This has occurred when capacity studies carried forward the assumptions established in housing land availability studies: some housing land availability studies were not comprehensive in their coverage. Also, several capacity studies appear to have excluded large sites by default due to the use of 'typical urban area' techniques27. It is important that local authorities are aware of these pitfalls. Small sites
It is preferable for a full survey of site potential to be conducted, including within its scope small vacant and derelict sites. This is something that most studies have sought to do. Care should be taken in the 23 Figures vary from year to year, but typically around 80% of all empties are privately owned. 24 The Empty Property Strategy prepared by a local authority has a role to play here. 25 The minimum vacancy rate that would allow for these factors is often assumed to be about 2% 26 ‘Tomorrow, a peaceful path to urban reform’, David Rudlin, Friends of the Earth, 1998. 27 See section 3
12
identification process to avoid double counting since many smaller sites could fall into other categories such as intensification. Intensification
In broad terms, intensification is making more effective use of land in a given area; for example, by developing garage courts, large gardens and backlands. Such sites can often be poorly used, and even unsightly. Many capacity studies have considered intensification despite this making up only a relatively small part of capacity and the results have varied greatly. Some studies concluded that the capacity to intensify existing urban areas was so limited that it was not worth pursuing. Such a conclusion is debatable. But it may be sensible to narrow the area of search by identifying and excluding those areas where the development form is less susceptible to intensification, for example private housing built since 1970 at densities of more than 30 dph, and well-maintained Victorian terraced housing28. In both cases the scope for intensification is likely to be quite limited although this will vary with local circumstances. The potential from intensification becomes more important relatively in areas where capacity from other sources is limited. It is in these places where this source warrants special attention. Redevelopment of existing housing
The redevelopment29 of poor quality housing can be a source of capacity in most authorities. Generally, redevelopment presents an opportunity to increase densities and capacity. However, on occasions redevelopment can lead to a reduction in the number of dwellings on a given site, with the consequent implications for overall capacity30.
NLUD recognises the potential for redevelopment and is a useful starting point. It records sites in use with a planning allocation or permission for redevelopment or with known development potential.
Housing areas with high vacancy rates are where the potential for redevelopment may be greatest. The findings of a study by Anne Power and Katharine Mumford31 on the extent of such urban abandonment suggest these areas could be quite extensive in certain inner city districts. Development of car parks
Car parks have rarely been considered by capacity studies. However, work by WS Atkins32 has shown that even well-used car parks can yield capacity; for example, by using part of a surface car park for new development and (if necessary) replacing the lost spaces by 'decking over' the remaining car park. Car parks can take up a great deal of space in prime urban areas – often in areas which are highly accessible by public transport – yet encourage excessive car use and are only in use for a small portion of the day. It is therefore sensible for capacity studies to consider surface car parks, and in particular ‘temporary’ car parks33 which have become an established feature but are of poor quality and blight surrounding areas.
28 Based on the research undertaken for this guide. 29 ‘Redevelopment’ is knocking down what is currently there, with the aim of replacing it with a better designed, better laid out and better quality development. 30 For example Holly Street in Hackney, London, where a very high density former ‘problem housing scheme’ was replaced with slightly lower density housing , but now has fewer problems. 31 ‘The slow death of great cities – urban abandonment or urban renaissance’. Anne Power and Katherine Mumford, York Publishing Services for the JRF, May 1999. 32 ‘The potential for increasing development opportunities in Hertfordshire’, WS Atkins and Roger Tym & Partners, March 2000 33 avoiding double counting those have been considered as part of the vacant and derelict land category
13
Work by Llewelyn-Davies and JMP consultants in the South East34 pointed to “considerable over provision of parking for all land use types, except B1, and in all areas, even in town centres”. The conversion of commercial buildings
Non-residential conversions are a good example of how shifts in the market can noticably alter capacity. Vacant offices were not even considered for housing in the early 1990s but have since proven a very significant source of capacity, particularly in conurbations (such as London and Manchester).
The potential for the conversion of commercial and industrial buildings to housing has been addressed in several studies although it is a capacity source that has proved difficult to estimate. One of the problems is that individual opportunities can be very large and atypical, making them difficult to estimate through sampling techniques or the extrapolation of past trends.
Quite extensive research has been carried out on commercial to residential conversions in London, much less in provincial cities35,36 with little reported elsewhere. Several studies have identified individual buildings (including industrial premises such as mills) and used floor area assumptions to estimate their capacity. Others use vacant office data as a proxy to estimate the total potential from non-residential conversions. In such cases it may be reasonable to exclude recent completions and Grade A office floorspace. Existing housing allocations
Some capacity studies have concentrated solely on those sites which are additional to existing housing allocations in plans. In other words they have assumed that sites already allocated for housing in plans represent a fixed capacity and cannot be changed, and so should not be reconsidered as part of the capacity study. But it may well be that the density is too low, and parking or layout standards in existing plans are excessive, when considered against the backdrop of current national policy. Some plans are still applying standards which are up to 10 years out of date.
A capacity study represents a good opportunity to revisit existing housing allocations using more up to date approaches. It may be possible to develop these sites more intensively, through applying better design and sensitive layouts, with the overall result being a better mix of size and types of development. Land allocated in plans for employment uses
Some local planning authorities have allocations of land for employment and other uses which are not realistically likely to be taken up in the quantities envisaged. Equally, since planning policies may have changed since this land was designated for particular uses, it is possible that the designation is no longer compatible with policy set out in current PPGs. For example, one authority, at current take-up rates, had a supply of employment land that would have lasted the best part of 100 years37.
Over-allocation is a wasted resource, and indeed holding onto stocks of possibly derelict urban land in the hope that particular employment uses will emerge at some point can blight an area and even reinforce decline. PPG3 requires all local planning authorities to review their non-housing allocations when reviewing their development plan and consider whether some of this land might better be used for
34 ‘Parking standards in the South East’, JMP consultants and Llewelyn Davies, GOSE and DETR, 1998. 35 Possible future sources of housing in London’, Halcrow Fox/LPAC, 1998. 36 ‘Conversion and redevelopment – Process and Potential’. DETR research, published March 2000, by Llewelyn-Davies and the University of Westminster. 37 The authority concerned will remain nameless.
14
housing or mixed use developments. Mixed uses are a very flexible solution if there is a particular concern about loss of certain types of employment opportunities.
Several capacity studies have considered existing industrial allocations although a variety of assumptions have been used to determine how much land should be reallocated. A useful approach is to estimate commercial land requirements over the plan period based upon recent take-up, and taking into account the policy context. Commercial land allocations over and above this requirement should then be included in the housing capacity study. Vacant land not previously developed
The DETR’s ‘land use change statistics’ (LUCS) include a category for vacant land which has not previously been developed. There have been misunderstandings about what this comprises. It has, mistakenly, been assumed to be land in built up areas that is used for agricultural, playing fields, parks or allotments. This is not the case. In fact, it is that land often shown within built up areas on Ordnance Survey maps as a ‘white’ area without annotation.
It is a significant category accounting for 57% of all the vacant land identified in the 1990 vacant land survey38 and for 12% of all housing development in 199539. It should be recognised as a potential source, certainly in the initial stages of a capacity study. Care will be necessary to avoid double counting this source as it could form part of, for example, a wider scheme for redevelopment40.
38 ‘The national survey of vacant land in the urban areas of England’, J Shepherd & A Abakuks, HMSO, 1990. 39 ‘Land-use change in England No. 13’, DETR/ Government Statistical Service, 1998. 40 As importantly, the eventual assessment of its capacity should reflect the Government's commitment to maintaining biodiversity and green spaces in urban areas
15
SECTION 3 SURVEYING CAPACITY Quantifying the capacity
Having identified the different sources of housing capacity and where to look for them, the next step is to quantify each of these individual sources. Few studies to date have measured directly all capacity within an area, the exceptions being small studies of individual towns. This is a significant task but once done, the data will form a baseline which will help to make future capacity study updates that much quicker and easier.
Robust and up to date information about capacity will help local authorities in both applying the sequential approach effectively and managing the release of sites successfully. The ideal, therefore, is a full survey of all the relevant areas with coverage of all sources. There are, however, a number of avenues available to provide information that can act as a proxy for a full study. These are considered below but cannot be regarded as a fully adequate substitute for a comprehensive assessment. Start with what you know
Many parts of England have already been subjected to a capacity study of one kind or another. Even though the thoroughness of some of these studies may vary, it is important not to disregard them, particularly if they are recent. They can be a useful source of information. At the very least, the studies will have generated a lot of background data which will be useful for tracking the progress of sites over time, identifying trends, and informing all of the sources considered in future studies. Use existing data
Studies should consider existing data before commissioning survey work. Work by URBED41 and studies in the North East42 and London43 all demonstrate that significant and reliable data sources exist on many forms of capacity.
41 ‘Tomorrow, a peaceful path to urban reform’, David Rudlin, Friends of the Earth, 1998.
ASSESSING URBAN HOUSING CAPACITY
Identifying capacity sources Surveying the capacity
o quantifying the capacity o start with what you know o use existing data o survey methodologies o comprehensive surveys o priority area studies o typical urban area studies
Assessing yield Discounting potential
16
There are a number of sources which are particularly helpful44. NLUD-PDL provides a firm foundation for capacity studies and, with the completion of its next stage, data held on each previously-developed site will incorporate a digital site boundary to facilitate its use with a GIS45.
In addition to NLUD, relevant and reliable data is available from the Empty Property Strategies prepared by local authorities, from the Office for National Statistics, the English House Condition Survey and the Valuation Office. These data sources are considered in Annex A.
However, there can be risks in using data on past trends46 because they measure the historic performance of the market rather than future potential. There are other pitfalls in using existing data which local authorities should be alive to; for example, inconsistencies in data collection and the influence of unstated value judgements on available capacity. It is therefore important that the limitations of existing information are understood and not carried forward into future work. Survey methodologies
Up to date surveys will frequently provide the best information about potential. Capacity studies have typically used one of three approaches for this survey work:
comprehensive surveys of the whole defined area – these can provide a great deal of useful information. Because all potential local opportunities are identified and trends appraised as comprehensively as is possible, it is easier to link this information to implementation strategies; for example, by compiling a database of all potential sites and then tracking them.
priority area (PA) studies – an alternative and complementary approach is to focus survey work on
areas likely to yield a significant amount of capacity, or where housing development would be beneficial or meet policy objectives most fully. Studies at the local level have found this approach to be most useful for identifying the capacity of vacant and derelict land and buildings and for redevelopment opportunities, car parks, and the conversion of commercial buildings.
typical urban area (TUA) studies – have been the most common technique used in urban capacity
studies because they reduce the workload whilst delivering reasonable results. TUA studies are likely to be a useful approach at the regional and strategic level pending a full survey.
42 ‘Urban capacity study’ ARUP/ North of England Assembly, 1998 43 ‘London’s Housing Capacity’, LPAC/ GLA, 2000. 44 See Annex A 45 The NLUD website at www.nlud.org.uk has more details 46 For example on conversions
17
Each of these survey methods might be appropriate depending on the circumstances. But given the need for accurate and full information to deliver the sequential approach effectively, most authorities will wish to consider comprehensive surveys of their urban areas. PA studies, supplemented by TUA studies, offer an alternative method, although by definition the data provided will not be as robust as that gained from comprehensive survey. Authorities will need to make a judgement about which route they take, in the light of the expectations set out in PPG3 and the need for effective and efficient plan preparation. Comprehensive surveys
The comprehensive survey is essentially a mapping and recording exercise of the potential sources of capacity. Approaches will vary depending on the location under consideration and the availability of existing data. Surveys are likely to use a combination of aerial photographs and site visits. Plans at 1:1250 are likely to provide the best basis for recording site opportunities and mapping site data acquired through the NLUD process. The initial stages of a study could be mapped out on a 1:2500 plan base, Priority area studies.
PA studies have similarities with full surveys but are more selective about the areas covered in detail. A good example of the PA technique is that employed by Llewelyn Davies in their work Sustainable Residential Quality (SRQ)47. The initial analysis to search for priority areas was conducted from a 1:2500 plan but all priority areas were surveyed in detail (1:1250 base plans) to identify opportunities for development.
The priority areas examined are likely to vary according to local circumstances. But experience has shown that high accessibility locations and the transitional areas between major land-use zones (sometimes referred to as ‘shatter’ or ‘interface’ zones48) are worth considering in particular.
High accessibility locations will tend to be those within easy walking distance of town, and local, centres and public transport. Additional housing in these areas would help reinforce the centres, would be likely to lead to less additional traffic than would otherwise be the case and could also be built at higher
47 ‘Llewelyn-Davies - Sustainable Residential Quality: New approaches to urban living’ – LPAC, 1998 48 Ditto
What is a windfall?
Windfall sites are previously-developed sites that have not been specifically identified as available in the local plan process. They could include, for example, large sites such as might result from a factory closure or very small changes to the built environment, such as a residential subdivision or a new flat over a shop.
Although the contribution to housing supply from individual windfalls cannot be quantified in advance (by definition), it is reasonable to expect that windfalls in general will emerge over the course of a plan’s lifetime. PPG3 advises that authorities should make specific allowances for all of the different types of windfalls in their plans. Allowances should be made on the basis of examining past trends in windfalls coming forward for development and on the likely future windfall potential as assessed in a capacity study.
What this means for capacity studies is quite straightforward. If a site is identifiable and the local plan process allocates it for development, then it is not a windfall. But if a study shows potential for sites within any given capacity source to become available in the future, an informed estimate can then be made as to the rate at which these sites are likely to appear. That is a windfall allowance.
18
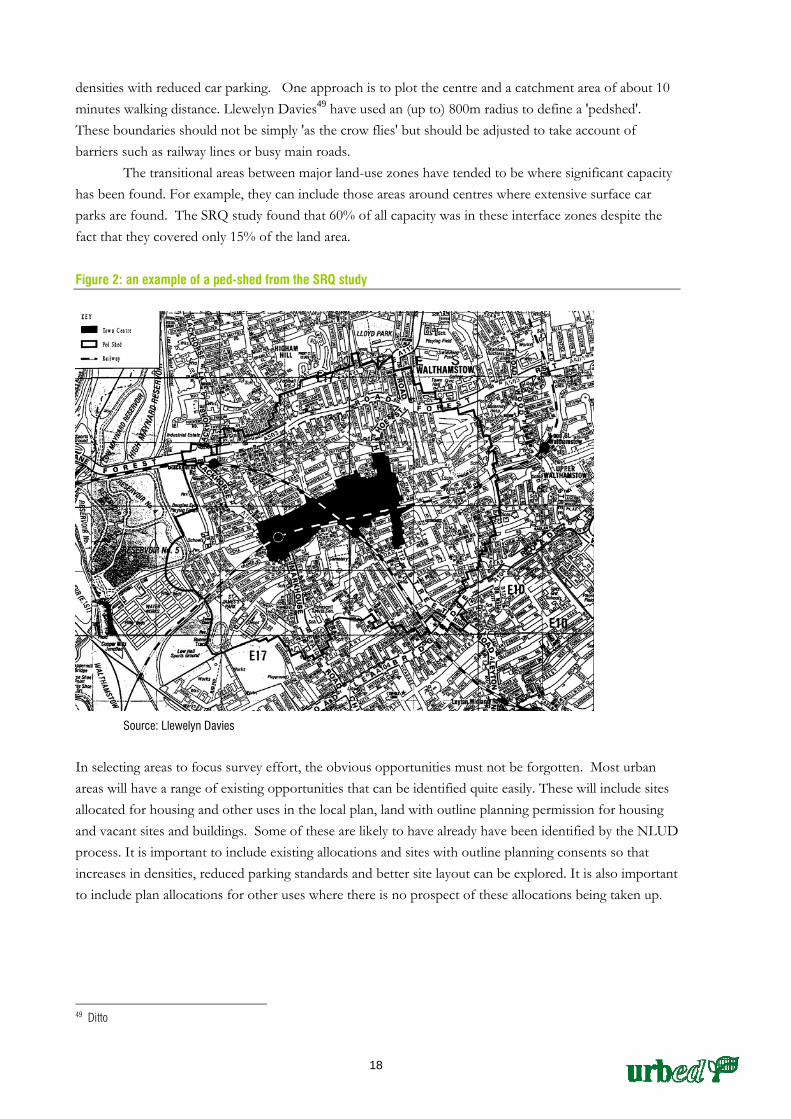
densities with reduced car parking. One approach is to plot the centre and a catchment area of about 10 minutes walking distance. Llewelyn Davies49 have used an (up to) 800m radius to define a 'pedshed'. These boundaries should not be simply 'as the crow flies' but should be adjusted to take account of barriers such as railway lines or busy main roads.
The transitional areas between major land-use zones have tended to be where significant capacity has been found. For example, they can include those areas around centres where extensive surface car parks are found. The SRQ study found that 60% of all capacity was in these interface zones despite the fact that they covered only 15% of the land area. Figure 2: an example of a ped-shed from the SRQ study
Source: Llewelyn Davies
In selecting areas to focus survey effort, the obvious opportunities must not be forgotten. Most urban areas will have a range of existing opportunities that can be identified quite easily. These will include sites allocated for housing and other uses in the local plan, land with outline planning permission for housing and vacant sites and buildings. Some of these are likely to have already have been identified by the NLUD process. It is important to include existing allocations and sites with outline planning consents so that increases in densities, reduced parking standards and better site layout can be explored. It is also important to include plan allocations for other uses where there is no prospect of these allocations being taken up. 49 Ditto
19
Typical urban area studies
TUA studies involve dividing the urban area into ‘homogeneous character’ case study areas. These have normally been determined on the basis of land use, character, housing density and age. TUA residential types are generally based on a combination of the age of the area, dwelling type, and density with separate TUAs identified for commercial and industrial areas, town centres etc.
The number of TUA types used in the different studies examined for this report varies greatly, ranging from just 10 to 35. Classifying all the land uses and buildings in a whole town into just 10 groups can be a very blunt analytical tool. Clearly, a larger number of TUA types allows greater sensitivity towards what is actually on the ground. This means that one-off opportunities such as large sites and small variations in the built form can be treated as separate TUA types. Against this extra precision must be set the additional work involved by having many TUA types, and the fact that a number of studies have found that more than half of the urban area under consideration can be ascribed to one TUA type – that broadly described as ‘estate housing’.
Once TUA types to be used in a study have been selected, a series of sample areas in each TUA type are identified and assessed to establish the scale of potential sites in that sample. This information is then multiplied up, resulting in an estimated figure for the TUA type. This can then be applied across the board to all TUAs of that type which are found in the whole study area (having regard to differences in the areal extent of the TUAs). The potential of the urban area under study is worked out simply by totalling up all the TUA estimates.
In assessing the potential of each TUA, care has to be taken in the selection of the samples, so that they are as representative as possible of the overall TUA. This is particularly important when dealing with mixed use areas such as town centres. Failure to do this will quite simply result in incorrect capacity figures.
TUA techniques are well suited to identifying the scope for intensification50. They do, however, have drawbacks with respect to other methods for surveying capacity sources, and as such have limitations for delivering the types of robust information necessary for implementing PPG3. First, they rest upon an assumption that urban areas have similar characteristics and that data derived from one area is applicable to another. Second, they generally deal with complexity by increasing the number of TUA types although this can generate an increase in the amount of work which may not be reflected in an increased accuracy of the results. Linked to this point is the problem that TUA techniques are not very good at dealing with a source of capacity which is not found in every example of the same TUA type, but may not be big enough or easily definable enough to be a TUA in its own right51.
Finally, it is also possible that TUA techniques encourage capacity to be sought in the wrong place. The London SRQ report52 has suggested that the majority of capacity can often not be found in homogeneous urban areas but in the transitional zones between TUAs.
50 See below 51 For example, a ‘shopping parade’ TUA may have flats over shops potential in one area, but not in another. 52 ‘Llewelyn-Davies - Sustainable Residential Quality: New approaches to urban living’ – LPAC, 1998
20
SECTION 4 ASSESSING YIELD Using land efficiently
Having surveyed the area and identified the opportunities for additional housing the next stage is to assess the number of units that can be accommodated on each of the sites and in each of the buildings identified.
Many studies have been quite vague about how this is done, suggesting that sites were assessed individually as part of the survey process or on the basis of recent planning consents. This is a concern because urban housing capacity studies should be about more than just a mechanical process of identifying more land and buildings for housing. They must also explore the potential to develop these opportunities more efficiently. This goes beyond a simple identification of sites, and involves an appraisal of their potential (possibly with several different options being considered). Basing capacity estimates on development standards in existing plans misses this opportunity. It is important to apply the expectations on densities, parking and layout set out in PPG3.
Those studies which have explored the potential to use sites more efficiently have used one of two methods: density multipliers or a design based approach. Density multipliers
A number of capacity studies have simply applied the crude tool of multiplying the total area of land identified through survey work, or estimating techniques, by an average housing density. These studies have generally banded densities according to pre-agreed lower and higher limits. Using density multipliers in this way has provided a practical way of dealing with a large number of sites and helped to make the assessment task more manageable because useable figures could be produced quickly.
However, as underlined in The Use of Density in Urban Planning53 there is a need for care when applying density multipliers. It is not just a case of adding up the total area of potential sites and multiplying it by a density.
This is because the density at which a site can be developed will vary depending not just on the policy context but on its size, configuration and the need for supporting facilities. For example, a small site with a street frontage could be developed entirely for housing, whereas on a larger site provision may
53 ‘The use of density in urban planning’, DETR, 1998
ASSESSING URBAN HOUSING CAPACITY
Identifying capacity sources Surveying the capacity Assessing yield
o using land efficiently o density multipliers o design-led approaches o yardsticks
Discounting potential
21
need to be made for roads, open space and possibly even facilities such as schools. A net density multiplier would be applicable to the former (reflecting the approach used in PPG3 to consider residential density) but for the latter applying a net density across the site could give a misleading yield.
The difference in yields between net densities and gross densities was explored by URBED through the Sustainable Urban Neighbourhood Initiative54. This showed that gross densities could be as little as 45% of net densities across an area which included included neighbourhood facilities, such as schools and parks.
One approach to address this complexity would be simply to vary the net density depending on the size of the site, using a banding approach. Another way would be to reflect the approach proposed in a report for Friends of the Earth55. This assumed that half of the identified vacant land would be in small sites and could be developed at net densities. The remainder would be larger sites where gross densities would apply. It was assumed that gross densities were half of expected net densities.
Yet another possible approach is to take account of different sizes of site but to group sites into broad size bands with corresponding gross to net density ratios. Smaller sites will typically make use of existing roads and facilities and yield can be readily assessed using a net density multiplier. On larger sites, the density multiplier must reflect the fact that as the demand of other uses becomes greater, the gross to net ratio decreases. The ratios in Table 3 are derived from work carried out by URBED and Llewellyn Davies and are illustrative of how such an approach might work. The ratios selected in capacity work should be drawn up in the light of the local context. Table 2: An illustration of gross to net ratios for different site sizes
Another way of using density multipliers is to categorise housing opportunities by location, such as city centre, ped-shed, suburban, or rural village. Each category would be accorded a density multiplier. These would need to be drawn up locally in the light of the guidance in PPG3. And the multiplier would also need to vary depending upon whether it applied to flats, terraces, semi-detached houses, or other forms of development. For example, a multiplier could be drawn up for terraced houses in ped-sheds. The more multipliers, the more complicated the exercise but the better and more useful the eventual data.
As well the care that is needed in drawing up and then applying multipliers they have a number of drawbacks. In particular, density multipliers are a rather blunt tool and fail to illustrate the implications of different densities for individual sites. Even for professionals involved in the planning and design process it is hard to visualise what different densities can mean on a given site without embarking on design exercises (see section below).
Also, applying the density multipliers to those elements of capacity studies drawn from estimates would mean the yield assessments would be based on two successive levels of uncertainty and assumption. For example, if a study indicated that ‘x’ number of a particular type of site with an area of 'y' could come
54 ‘Building the 21st Century Home – the sustainable urban neighbourhood’, David Rudlin and Nick Falk, The Architectural Press, 1999. 55 ‘Tomorrow, a peaceful path to urban reform’, David Rudlin, Friends of the Earth, 1998
Up to 0.4 hectares 100% gross to net ratio Up to 0.4 – 2 hectares 75-90% gross to net ratio Over 2 hectares 50-75% gross to net ratio
22
forward over the plan period (the first assumption), and then a density multiplier was applied (the second assumption), the result would be a capacity figure that was less certain than if sites had been revealed by survey and their likely yields considered through a design-led approach. Design-led approaches
The alternative to density multipliers is the design-led approach. This has several advantages and is the most effective of all the yield assessment methodologies for most capacity sources 56.
Typical sites are selected and subjected to design exercises. These can be used to explore different policy and density scenarios with regard to parking provision and layout. For example, in the SRQ study (illustrated below), one scenario applied existing local plan parking and density standards, a second reduced the parking expectation, enhanced the design, and increased densities, and a third (that assumed highly accessible locations) removed parking altogether. The study found that parking had a profound influence on potential densities to the extent that the second scenario increased densities by 50% and the third doubled them. Figure 3: Design scenarios from the London SRQ study
Source Llewelyn-Davies
The design exercises are then used to develop a ‘tool-kit’ of design templates for typical site configurations57 in an authority's area. Once a toolkit of design templates has been created they can be used time and time again. The templates could also inform the use of density multipliers.
Design-led approaches have been used to explore the potential for intensification using TUA studies. The approach involves case studies being selected in TUAs and subjected to design exercises. The estimates from these are extrapolated across the TUA to assess the number of additional units that could be expected. With this approach, care must be taken to ensure that the case studies are representative of the built form of the whole TUA, and that the extrapolation of the results of the studies to cover the whole TUA reflects the likely occurrence of such sites.
The design-led approach has a number of advantages. First it allows a much more realistic assessment to be made of a site’s development potential. In particular, it allows densities to be increased by showing how these can be accommodated while producing attractive homes in keeping with the character of the surrounding area. Indeed some studies have concluded that designs with higher densities, than would have been allowed by existing plan standards, were both a more appropriate response to site conditions and local character as well as being more attractive to the market.
It is worth noting that many of the studies that have used density multipliers as the main yield assessment tool have produced more conservative estimates for sites than the site potentials arrived at 56 Other than subdivision, conversions, flats over shops and intensification, for which yardsticks may be best 57 ie design templates can be produced to illustrate how a particular form and density of development can be accommodated on a site
23
through the SRQ studies. This is because the SRQ type approach is site specific, more accurate and can investigate site potential more thoroughly.
It is clear, therefore, that design exercises have a valuable role to play in informing judgements about the housing capacity of sites. This is particularly true of small sites near to local centres where using density multipliers could produce a sub-optimum number of units. It also tends to lead to higher housing yields than are assumed through yardsticks (see below). Set against this is additional effort that can be involved in undertaking a design-led study. Figure 4: Design scenarios for intensification from the Hertfordshire study
Source Urban Initiatives
Yardsticks
Density multipliers and design-based approaches are typically appropriate for site-based opportunities, although in theory they can both be applied to estimates of windfalls. Assessing the yield from windfalls will, however, always remain a difficult area to assess (by definition) because they have yet to be made known to the planning system. The yardstick approach makes estimates of housing yield based on data that has been collected on specific types of capacity source. Some useful yardsticks are considered below. The conversion of commercial buildings
This is a relatively new form of housing supply so it may not be appropriate to base estimates on past trends. It also tends to be made up of a small number of relatively large developments so that it is not well suited to TUA techniques.
Using a yardstick approach, the known potential is converted into a housing yield by using a gross to net ratio to determine the usable floor area (80% has been used in some studies with 60% in difficult or deep plan buildings) which is then divided by a unit floorspace. The denominator will vary according to circumstance but work by URBED has suggested that 70m2 is a useful rule of thumb. This floorspace assumes a mix of one and two bedroom flats.
24
Flats over shops
As schemes tend to be small and the potential capacity can be difficult to measure on a site by site basis, a yardstick can be useful. A yardstick used in a Hertfordshire study58 assumed that a third of the retail floor area was suitable for housing and that a third of this would be suitable for flat conversions. The same yardsticks as suggested above for commercial conversions could then be used to convert this floor area into a number of flats. Using this approach has the advantage that local authorities have retail floor area data and so can make the assessment relatively easily. It may be useful to exclude retail parks and modern shopping centres from these estimates, but as development patterns change this may no longer be the case. It is important to ensure that local shopping parades outside town centres are included.
An alternative approach is a yardstick based on work by the Civic Trust in London59. This assumed a potential capacity of roughly one residential unit for every shop less the number of existing units over shops (data derived from the English House Condition Survey). These yardsticks produced figures which were considerably higher than past estimates of potential from living over the shop, but they appear to be backed up by studies such as that undertaken in Stockton on Tees60. Subdivision of existing housing
Detailed surveys of the housing stock are the best way to provide thorough and accurate assessments of the potential from residential subdivisions. But given the extent of the source (nominally all houses in an urban area) some local authorities may prefer to use proxy information based on a yardstick approach.
As local authorities have access to data on houses size and occupancy61, yardsticks might be based on an assessment of 'under occupation'62 or more simply, on dwelling size63. Intensification
In some parts of the country intensification is likely to make up a significant proportion of housing capacity. This may be because such areas have more of the kind of capacity which lends itself to intensification (for example a preponderance of large gardens), or because the scarcity of other capacity sources makes intensification relatively more important64. In such areas, thorough surveys using design-led approaches are the best option, with the next best being TUA studies drawing from design-led sampling.
Elsewhere, where the contribution of capacity from intensification is relatively less significant or where capacity from other sources is likely to be looked at first65, a yardstick approach is likely to be the most useful tool for assessing yield. While it is an imperfect measure, from their work on capacity URBED has suggested66 the total capacity from residential intensification is roughly equivalent to a 5-10% increase in the stock of post-war council and new-town property.
58 ‘Hertfordshire: dwelling provision through planned regeneration’ Urban Initiatives and Chestertons, 1995. 59 ‘Dwellings over and in shops in London’, Civic Trust/LPAC, 1998 60 ‘Living over the shop in Stockton Upon Tees’, Anne Petherick. 61 Through census reports. 62 Dwellings assessed as being under occupied would be considered as having potential for subdivision. 63 Dwellings over a certain size would be assumed as having potential for subdivision. 64 Such as in urban areas experiencing high demand for housing where there is little in the way of a legacy of former industrial sites. 65 Where, for example, there are available vacant sites. 66 From the research that supported this guide.
25
SECTION 5 DISCOUNTING MEASURES Moving from unconstrained capacity
The techniques described in the preceding sections produce what is generally called an ‘unconstrained’ capacity figure. The unconstrained housing capacity of an area is the theoretical total number of dwellings that it could accommodate if all of the potential capacity was developed optimally.
The final part of an urban housing capacity study is to predict how much of this unconstrained capacity can be brought forward within the time horizon being considered. This is normally addressed through 'discounting' procedures. Based upon the research of capacity studies undertaken for this guide it is clear that many studies discount the unconstrained figure quite substantially, sometimes reducing it by up to 50% or 60%.
Discounting has been a problematic aspect of urban capacity assessments. It is inherently judgmental and therefore it is important that discounting takes place only once the unconstrained capacity has been identified. Authorities should resist the temptation to introduce discounting into the early stages of the process. While most capacity studies have been structured to assess unconstrained capacity first, before applying discounting assumptions, some have failed to maintain an absolute separation between constrained and unconstrained capacity. Discounting assumptions have been applied not just to unconstrained figures at the end of the study but throughout the process. If this is done it becomes difficult to keep track of the assumptions made and to explore different scenarios under which capacity sources might be tapped more effectively. How to discount
The usefulness of the discounting stage can be undermined by embedding into the discounting process pre-conceived expectations. For example, some studies appear to have started with a view in mind of the deliverable capacity that seemed ‘about right’ based on previous experience and constructed a set of discounting assumptions to produce this answer. In other cases, discounting assumptions were designed to reflect a pre-conceived view of the willingness of the market to develop the capacity source.
ASSESSING URBAN HOUSING CAPACITY
Identifying capacity sources Surveying the capacity Assessing yield Discounting potential
o moving from unconstrained capacity o how to discount o discounted capacity o testing
26
There is, therefore, a need to be explicit, transparent and forward-looking when discounting. The process should not be limited by expectations based on past performance. What is required is an informed estimate of the proportion of the unconstrained capacity that can realistically be expected to come forward and be developed over time. This should be more than a simple projection of current market conditions. Markets can and do change, partly as a result of changing fashions, the economy, or as a result of priorities expressed through national and local planning policies. Discounting should reflect the objectives in PPG3, in particular the need to maximise the re-use of previously-developed land and empty properties and the conversion of non-residential buildings for housing. The aim of the discounting process, therefore, should be to identify what is likely to be realistically achievable within the new context established by PPG3.
There will be good reasons why a proportion of the capacity identified earlier in a study will not come forward for development, or may not be capable of development immediately. For example, otherwise suitable sites or buildings identified in the earlier stages may not in practice be capable of being brought forward because of viability or ownership constraints that cannot be resolved in the foreseeable future. Involving the development industry, including housebuilders, in the discounting stage can increase both its reliability and can produce an acceptance of the assumptions made.
Discounting assumptions will vary depending on how capacity was assessed. The more thorough approaches to surveying and assessing capacity will require less discounting than those based on broad estimates. For example, the unconstrained capacity derived from design-led exercises on sites judged to be suitable for housing is likely to be discounted less (if at all) than estimates based on TUA techniques and density multipliers. While it is not sensible to lay down rigid practice for discounting, the studies considered by the research that underpins this guide suggest that there are general principles which can be applied to discounting. These are considered below. Developability
Not all of the yield from sites identified as suitable for housing, or from the estimates of particular capacity sources, is likely to be realised. Factors that will bear on whether the unconstrained yield can be realised, or on the timing of release, will include:
willingness of an owner to release the opportunity for development; infrastructure capacity, including the provision of satisfactory access; and, physical constraints on development, including site contamination or the risk of flooding.
Market viability
Market conditions appear to be taken into account in most studies. In the London SRQ67 study where the market analysis undertaken on the case study sites showed all of them to be viable. By contrast the North West methodology68 graded sites into three levels of demand – sites attractive to the market, those likely to come forward with a little help and those unlikely ever to be developed. The South East69 and
67 ‘Llewelyn-Davies - Sustainable Residential Quality: New approaches to urban living’ – LPAC, 1998 68 ‘Exploring potential for housing in the North West’, Llewelyn Davies / North West Regional Association, 1997 69 ‘Sustainable residential quality in the South East’, Government Office for South East and Llewelyn Davies, 1998.
27
Yorkshire and Humberside70 studies also used three levels of developer preference. An alternative approach was taken in Hertfordshire71 where a market analysis of case study areas was undertaken comparing the cost of development with the values of the completed units. Only those case study areas which were viable were then used in deriving estimates of capacity.
As mentioned above, market viability can be affected by a range of factors including national and local planning policies. PPG3 is likely to reconfigure the market because of the priority given to previously-developed sites. Historic performance will not therefore be a reliable guide to future prospects. Assessments of market viability should reflect the likely impact of PPG3 and take this into account in terms of land and building values.
Equally, a site's viability for housing cannot be considered independent of pressures for competing uses. For example, the London Large Sites study72 linked viability to density, used land values to assess whether problems such as contamination could be overcome and compared the viability of residential use with the alternatives. If housing was viable, but another use produced a higher value, it was assumed that the site would not come forward for housing. Such assumptions, of course, ignore the role of development plans in allocating sites for specific uses, where local authorities can set the agenda for the nature of development in their area. Local character
A number of studies have discounted explicitly to take account of local character, particularly when considering capacity sources such as conversions and intensification. For example, some identified conservation areas and excluded them from consideration while in others the capacity of conservation areas was discounted by up to 60%. It is important, however, not to fall into the trap of assuming that conservation areas and other areas of 'special character' do not contain realisable capacity for additional homes. With sensitive design, these areas can often sustain further development without any effect on their character. They should not be omitted from capacity studies.
Both PPG3 and 'By Design' (the guide to better practice published in May on urban design in the planning system73), encourage well-designed developments that respect and enhance local character. But this does not mean change should be stifled or only exact matches of style or replications of form are acceptable. Nor does it mean that in all cases, and all places, existing densities should dictate those of new development. Thinking more imaginatively about designs and layouts can make more efficient use of land without compromising the quality of the environment.
Discounting in some studies has been undertaken in the light of assumptions about public attitudes to development, and the aspects of local character that are valued most. Likely public acceptability of a capacity source is directly relevant to discounting but there is a risk of adverse public reaction to change in the absence of an informed understanding of what that change would involve. Therefore, where discounting is to be informed by considerations of public acceptability of development it is preferable for the exercise to be design-led. Local people would then be in a better position to visualise actual outcomes and are likely to be more positive about change than if presented with, say, simplistic questions about the desirability of higher densities. 70 ‘Study of settlement capacity and regional development options in Yorkshire and Humberside’, Baker Associates, 1998. 71 ‘Hertfordshire: dwelling provision through planned regeneration’ Urban Initiatives and Chestertons, 1995 72 Possible future sources of housing in London’, Halcrow Fox/LPAC, 1998 73 ‘By design: urban design in the planning system; towards better practice’, CABE & DETR, 2000
28
Planning standards
Planning 'standards' affect capacity in several ways; for example through the application of parking standards, overlooking distances and ceilings on densities. It is important to ensure that discounting is not driven by out of date planning approaches that place undue reliance on inflexible standards.
To address this concern, several studies have looked at different policy scenarios rather than discounting in the light of extant standards contained in development plans adopted some time ago. In the North West74 for example, three policy scenarios were used: the first based on existing standards, the second on a relaxation of these and the third based on a proactive approach to site development. A similar ‘standard varying’ approach was used by both the Surrey County capacity study75 and the London SRQ methodology. Similarly, studies in Yorkshire and Humberside76 and the South West77 used policy-based scenarios to increase densities. Discounted capacity
There is evidence that authorities have been conservative in their assessments of realisable capacity and are discounting more stringently than they should. Consistently high, and often unanticipated, levels of windfalls (residential subdivisions through to the redevelopment of large commercial sites) continue to feature in the planning process. This tends to suggest that authorities are both failing to establish site availability and misjudging their area's capacity to accommodate additional housing.
Proactive planning to unlock capacity, combined with favourable market conditions given impetus by PPG3, should lead to higher proportions of the unconstrained capacity being realised for development than has been the case hitherto. For example, London typically achieves recycling levels for housing of around 85% every year. Although the situation in London is not necessarily replicable across the country, it does illustrate that given the right circumstances significant capacity can be released from within urban areas and make a significant contribution to housing supply.
The background research carried out for this guide found that authorities tended to assume that a constrained figure of around 40% of unconstrained capacity was routinely possible, but that figures over 40% (and particularly over 60%) tended to require specific measures to deliver the extra housing yield. These might include acquisition of key sites (through CPOs), regeneration funding, or the targeting of infrastructure to open up certain areas.
Discounting rates for each source of capacity discussed in Section 2 are illustrated in Table 5. They are presented as ranges and drawn from the studies considered in the review that informed this guide. They provide benchmarks for local authorities and are not intended to be applied by rote to capacity studies. Some capacity sources may be easier to unlock in a particular local authority area than an other. Discounting rates for each of the capacity sources should be established by authorities based on professional judgements and knowledge of their area informed by consultation with those active in the market.
74 ‘Exploring potential for housing in the North West’, Llewelyn Davies / North West Regional Association, 1997 75 ‘Surrey County capacity study’, Surrey District Planning Authorites for SCC, 1999. 76 ‘Study of settlement capacity and regional development options in Yorkshire and Humberside’, Baker Associates, 1998. 77 ‘Strategic study of housing potential in the South West’, Baker Associates & UWE, 1998
29
Table 3: discount rates
Testing
The products of an urban housing capacity study will be:
an understanding of the potential of each source of housing capacity; housing yields derived from this potential (the unconstrained capacity); an assessment of realisable capacity gained by discounting the unconstrained yields.
The assessment of actual capacity will in part be backed up by a database of specific site opportunities and in part will comprise estimates of the contributions from capacity sources derived from existing data and sampling techniques. The exact balance will reflect the approach taken to surveying capacity.
One way to check the robustness of the final figure is by comparison with recent housing activity, in terms of both permissions granted and dwellings completed. In particular, if the assessment of capacity (when annualised) is substantially lower than historic housebuilding rates then the assumptions underlying the study are likely to have been overly cautious and will need to be revisited. The only other explanation would be that some sources of capacity are drying up. This is unlikely. Even in areas with intense, sustained, development pressures there has been no evidence of this to date.
Lower rate Upper rate Subdivision of existing housing 25% 40% Living over the shop 25% 40% Empty homes 40% 80% Vacant and derelict land and buildings 65% 85% Intensification 70% 85% Redevelopment 70% 85% Car Parks 70% 85% Non-residential conversions 70% 85% Existing housing allocations in plans 90% 100% Allocations in plans for non residential uses 70% 85% Vacant not previously developed 30% 40%
1
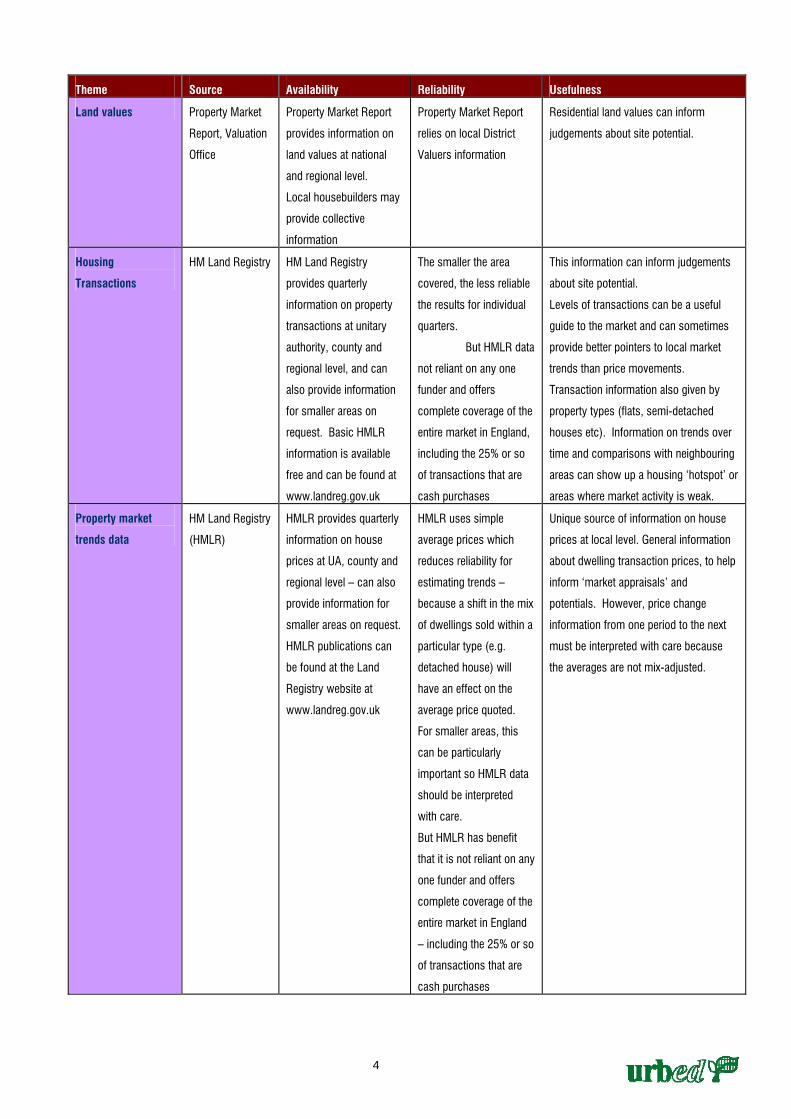
ANNEX A SOME USEFUL EXISTING DATA SETS
Theme Source Availability Reliability Usefulness
Residential stock
information and
changing trends in
the stock
DETR English
House Condition
Survey (EHCS)
Every 5 years. EHCS is a
national stock survey,
representative at
National, regional level.
latest survey in 1996.
Available from
Stationery Office, and
DETR housing website.
Survey of over 20,000
dwellings and
households.
Representative at national
and regional levels.
Reliable data
Will assist in verifying trends in
conversions (by residential stock type),
vacancies trends, and help assess
subdivision trends and potential.
Information provided on age and
condition of stock.
Relates conditions of properties to tenure
at national level.
Valuable information on trends in
conditions for larger areas but also
provides information to compare with
local picture
The EHCS also contains information
about flats over shops, dwelling sizes,
and the characteristics of vacant
dwellings.
Non-residential
stock and vacancy
information
Non-domestic
business rates
registers
Residential stock
information
Council tax
records
Individual LAs, subject to
data protection
regulations
Reliable Will help to establish subdivision potential
Stock surveys Individual LAs Depends on individual
LAs
Depends on individual
LAs
Will assist in building picture of the total
built stock and identifying what is
available.
NLUD NLUD Partnership NLUD – previously
developed land – 1998,
to be updated 2001 and
then annual
Research will seek to
extend NLUD to all land
uses
Some variation in
coverage between local
authorities, but seeking
to improve by applying
national definitions and
better integration of local
authority data source
NLUD- pdl provides a site by site record
of previously developed land which can
be use for monitoring its availability and
release.
NLUD for all land uses will provide a
basis for modelling urban capacity
Land-use change
statistics
DETR (based on
Ordnance Survey
data)
Annual Reliable Useful for establishing classifications of
uses for particular land parcels, and
establishing previous trends in, for
example, densities.
2
Theme Source Availability Reliability Usefulness
Full range of
demographic data
1991 Census
Widely available within
LAs or from ONS
1991 information is
increasingly out of date,
but 2001 census will
generate comprehensive,
up to date information.
Under-enumeration could
be a problem for some
areas such as parts of
London
Limitations because of age of data but
provides base against which to measure
trends. Also provides comprehensive
stock information, by household.
Number and tenure
of dwelling stock –
regionals and
national estimates
1991 Census and
LA in- house
updates,
including LA data
returns to DETR
Census widely available –
updates derived from
annual figures on stock
change collected ‘in
house’ on new build,
conversions and
demolitions. Size of stock
supplemented by data on
change of tenure (e.g.
large scale voluntary
transfers, right to buy)
Depends on availability of
reliable data from in-
house sources. As time
progresses since
Census, more difficult to
maintain 100% accurate
information.
Provides important baseline figure of
housing in area; must recognise where
estimates are less robust and treat
accordingly.
Number and tenure
of dwelling stock
DETR Housing
Flows
Reconciliation
(HFR) Return
To be collected with
effect from 2000/01 for
some authorities, and
from 2001/02 for all
Expected to be reliable;
guidance from DETR to
improve consistency of
data collection
Expected to be very useful
Dwelling size 1991 Census and
‘in house’
updates including
P2A and HFR
return to DETR
Census widely available.
Updates derived from
annual returns to DETR
on housing completions
Local authorities will
differ in preferred
measure of size of
dwelling for new housing
but necessary at least to
cover number of
bedrooms.
With increasing time
since Census, recognise
difficulties in estimating
changes within existing
stock; robustness of
estimates needs to be
made clear
Provides baseline information against
which to appraise subdivision potentials.
Occupancy data -
persons per room
1991Census Widely available Detailed information at
local level but data from
last Census is
increasingly out of date
Shows how ‘space’ is being used and
provides indicators of high levels of
occupancy.
3
Theme Source Availability Reliability Usefulness
Occupancy data -
persons per room
Survey of English
Housing
Stationery Office and
reference libraries.
Electronic data sets
available from Essex
Archive.
National and regional
level data
Continuous dwelling-
based survey of 20,000
per annum.
Provides more up-to-date
and reliable information
than Census
Wide range of information about property
type and occupancy
Occupancy and
population data of
70+ years and
16/17 year olds
Electoral
registration
Information collected for
compilation of electoral
register. Requires in-
house analysis within
data protection rules
Assumes all households
complete and return their
forms accurately
A check on occupancy information, and
trends in occupancy.
Occupancy data Voluntary survey
via electoral
registration
Optional LA initiative:
additional survey form
enclosed with electoral
registration form, but
completion must be on
voluntary basis
Limitations as for all
postal surveys. Can only
collect minimal
information. Must be
confident that collection
of additional information
will not affect main task
of electoral registration
Useful as a check on occupancy
information derived from other sources.
Proviso about reliability of data collected
– excludes people not entitled to vote.
Flats over shops
potential
LOTS database
Flats over shops
potential
Valuation Office
Support
Application
Database
Reliable Records the number and area of shops
and restaurants along with any residential
accommodation
Vacants/ empty
properties
Individual LA
Empty Homes
Strategies;
council tax
analysis; HIP
returns to DETR
Local authority’s own
data. For use of Council
Tax records, compliance
with Data Protection Act
is responsibility of local
authority
Council tax records –
check with department
responsible to identify
potential reliability
problems.
Necessary to
distinguish between
‘casual vacancies’ and
long-term vacant
properties
At least a very useful starting point for
assessing empties – the empty homes
strategies are extremely useful if up to
date.
Vacants – social
housing
HIP returns and
Housing
Corporation
Annually at local authority
level
Both LA and RSL
vacancy figures are from
HIP returns. However,
RSL vacancy figures
from Housing
Corporation annual RSR
are more reliable
Important source of information of
vacancy levels in social stock.
4
Theme Source Availability Reliability Usefulness
Land values Property Market
Report, Valuation
Office
Property Market Report
provides information on
land values at national
and regional level.
Local housebuilders may
provide collective
information
Property Market Report
relies on local District
Valuers information
Residential land values can inform
judgements about site potential.
Housing
Transactions
HM Land Registry
HM Land Registry
provides quarterly
information on property
transactions at unitary
authority, county and
regional level, and can
also provide information
for smaller areas on
request. Basic HMLR
information is available
free and can be found at
www.landreg.gov.uk
The smaller the area
covered, the less reliable
the results for individual
quarters.
But HMLR data
not reliant on any one
funder and offers
complete coverage of the
entire market in England,
including the 25% or so
of transactions that are
cash purchases
This information can inform judgements
about site potential.
Levels of transactions can be a useful
guide to the market and can sometimes
provide better pointers to local market
trends than price movements.
Transaction information also given by
property types (flats, semi-detached
houses etc). Information on trends over
time and comparisons with neighbouring
areas can show up a housing ‘hotspot’ or
areas where market activity is weak.
Property market
trends data
HM Land Registry
(HMLR)
HMLR provides quarterly
information on house
prices at UA, county and
regional level – can also
provide information for
smaller areas on request.
HMLR publications can
be found at the Land
Registry website at
www.landreg.gov.uk
HMLR uses simple
average prices which
reduces reliability for
estimating trends –
because a shift in the mix
of dwellings sold within a
particular type (e.g.
detached house) will
have an effect on the
average price quoted.
For smaller areas, this
can be particularly
important so HMLR data
should be interpreted
with care.
But HMLR has benefit
that it is not reliant on any
one funder and offers
complete coverage of the
entire market in England
– including the 25% or so
of transactions that are
cash purchases
Unique source of information on house
prices at local level. General information
about dwelling transaction prices, to help
inform ‘market appraisals’ and
potentials. However, price change
information from one period to the next
must be interpreted with care because
the averages are not mix-adjusted.
1
ANNEX B SUMMARIES OF MAIN CASE STUDIES EXAMINED
2
CASE STUDY 1 Environmental Capacity in West Sussex - West Sussex County Council June 1996 Methodology
The study split the urban areas of the county into 22 different ‘typologies’ or Typical Urban Areas (TUAs). Case studies were undertaken to assess the average additional housing capacity of each TUA which could then be grossed up to give an estimate for the county. As well the potential for peripheral expansion of settlements in the county, the study explored the housing potential from urban intensification, smaller brownfield sites, conversions and living over the shop. This was to assess whether the windfall assumptions made in the Consultation Draft of the Structure Plan were correct. The study did not re-examine existing local plan allocations for sites (housing or otherwise), or question existing plan standards, and several potential sources were also not included.
CASE STUDY 2 Environmental capacity: A methodology for historic cities – ARUP and BDP – February 1995 The study developed a methodology for an urban area, as a means of reconciling the complex issues facing a historic city dealing with growth pressures. Methodology The method was based upon the identification of ten sets of indicators covering the following issues: pressure on the edge, pressure on green areas, townscape, skyline, historic buildings, uses, pedestrian/vehicle conflict, pedestrian congestion, parking and commuting. For each issue one or more further indicators were selected giving a total of 16. For each of these indicators thresholds were set, and where possible these were based upon measurable data – for example the number of vehicles per hour beyond which it becomes difficult to cross a road. This framework was then used as part of a 12 stage process which mapped out the urban areas and identified ‘critical environmental capital’, which then explored areas of conflict and perceptual limits in order to determine the appropriate indicators and threshold levels. These thresholds were then used to explore different capacity scenarios as outlined below:
Actual state: the situation as it was then; Trend state: what would have happened if trends had continued; Scenario states: this allowed projections to be made for different policy options. In Chester’s
case these were a) meeting only local needs b) becoming a regional capital and C) focusing on tourism;
Capacity state: the point ‘beyond which the system should not be’;
3
Desirable state: a scenario in which policy targets were set, such as the maximum amount of new shopping allowed in the city centre.
Matrices were developed to illustrate the extent to which thresholds were breached for each scenario. An analysis revealed areas where the capacity state was already exceeded by the actual state. These represented existing environmental problems that should, where possible, be addressed and certainly should not be exacerbated. With other indicators the capacity state exceeded the trend state pointing to ‘headroom’ for expansion in these areas. This methodology provided a useful tool for determining priorities. The Chester methodology differed from all other the approaches examined for this guide in that it was mainly set up to measure and consider a far wider range of issues than purely physical capacity and a wider range of land uses than purely housing.
CASE STUDY 3 Study of settlement capacity and regional development options in Yorkshire and Humberside – Baker Associates – January 1998 This regional level study used the Typical Urban Area technique. Methodology
The study involved the following stages -
32 typical urban area types (TUAs) were identified, including 9 residential types, 7 mixed-use, 5 employment,7 other uses, 3 community and 3 vacant. All urban areas in the region were classified into one of these TUAs.
An assessment of the average capacity of each TUA was conducted. Ten TUAs were assessed
through sample areas, sixteen through assumptions, and four through a combination of the two.
53 sample areas were studied to ensure a regional coverage and a good sample of the TUAs covering the greatest area. 1:1250 base plans were used to identify potential capacity including undeveloped land (including large gardens), vacant land, car parks, non-conforming uses and underused land. These sites were sieved for 1) availability, and 2) suitability. The latter included an assessment of neighbouring uses, site conditions and constraints such as access. On this basis the sites were graded into A: Easy, B: Medium, and C: Difficult.
Density assumptions were made based on past performance, good examples and the Llewelyn-
Davies examples in the North West Study (see Case Study 12). Two scenarios were selected; a small increase in densities and a radical increase.
4
Data on conversions was so patchy and inconsistent that they were omitted from the study. Market demand was assessed by ranking sites into a hierarchy of three developer preferences.
The regional capacity was assessed by translating the sample areas into an average number of
extra housing units per hectare for each TUA. These were then converted into factors to reflect market conditions and applied to the total land area for each TUA. These were combined with yardsticks for other types of TUA to estimate a total regional housing capacity.
CASE STUDY 4 Kent Urban Capacity Assessment: Kent County Council – 1998/9 This study brought together existing land availability data with NLUD returns and an urban capacity study. Methodology
The study involved four main elements:
Site identification. The identification of urban area land and buildings with potential for reuse. This was assessed alongside the NLUD survey returns.
Character assessment. A character assessment of the main settlements was undertaken to
assess their ability to accommodate extra growth. This was carried out by individual districts on the basis of a methodology produced by consultants. It used a combination of age, development, density and site visits to define Typical Urban Character Areas (TUCAs). These were analysed and positive and negative attributes identified. This allowed each character area to be categorised into one of five categories from ‘high conservation’ to ‘in need of significant enhancement’. This was used to judge the scope for change and to the ability to accommodate growth.
Sustainability framework. A framework to assess the social, environmental and economic
sustainability of larger settlements was commissioned from consultants to determine priorities for growth. This defined environmental, physical and community infrastructure thresholds for urban areas, and assessed the effect of different levels of growth on each.
Design and Planning. The production of design guidelines and planning policies relating to the
accommodation of more housing at higher densities in urban areas.
5
CASE STUDY 5 London Housing Capacity Study – London Planning Advisory Committee and Greater London Authority (LPAC/GLA) – July 1998, and September 2000 LPAC previously undertook housing capacity studies in 1988 and 1994. Under the auspices of the GLA a third study has just been completed which covers the 25 year period (1991-2016). Methodology
On the basis of an analysis of past trends and the results from several specific ‘subject studies’ (also described in this report – see Case Studies 7, 9 and 14), a portfolio of ‘capacity benchmarks’ was established and passed to each borough by LPAC. The boroughs were able to accept or challenge these and to work with LPAC to refine the figures for their area. The benchmarks included:
Capacity benchmarks - benchmarks were set based on historic trends - London already achieves 85% of housing on previously developed land;
Large sites - capacity benchmarks for large sites based upon earlier work (also using further
Sustainable Residential Quality (SRQ) work to measure the capacity);
Windfalls - in previous studies windfall assumptions for large sites were found to have underestimated capacity by a factor of four. The portfolio therefore included windfall assumptions based upon past trends. Boroughs challenged this only if they could demonstrate a robust methodology for identifying large sites;
Small sites - benchmarks were set for small sites around local centres, based on the SRQ work
(see case study 14);
Sites of constrained frontages - formerly called backlands development, these were considered separately. While it was recognised that this is potentially a very significant source of capacity which Boroughs were urged to consider, no benchmarks were set;
Conversions - a range of benchmarks were proposed based upon historic data and research.
These covered both the subdivision of residential property and conversions from other uses;
Retail conversions and space over shops - benchmarks were set based upon work outlined in case study 9.
Empty properties - it was suggested that the difference between the vacancy rate and the
national target of 3% was a good benchmark;
Redevelopment - boroughs were asked to consider the effect of redevelopment schemes although this could include density reductions as well as increases.
6
In identifying capacity the study used four time zones up to 2016 so that more difficult sites could be included in a later phase. It also incorporated the concepts of core and non-core capacity. Boroughs were asked to respond to this portfolio by the end of 1998. They could challenge it but only if they were able produce arguments and evidence that would withstand scrutiny at UPD enquiry. The benchmarks and any challenges to them were scrutinised by LPAC with each borough and the Housebuilders Federation in selected areas. This stage also involved an exercise to apply capacity scenarios to the sites identified, based upon the SRQ research. This was a very comprehensive study, although some potential sources of capacity were not examined.
CASE STUDY 6 Stroud: Local environmental capacity study – Alison Brown – November 1998 Methodology
The methodology is similar to the Chester Study (case study 2) in that it sought to apply the concept of ‘environmental capacity’ to an urban area, albeit a much smaller town. Combined with this is a physical assessment of sites and their capacity to accommodate housing in the town. Sources such as car parks, vacant not previously developed, redevelopment, vacancies, living over the shop, subdivision and intensification were not examined in this study. The methodology involved five stages:
A socio-economic profile of the town based upon census data and a housing needs survey;
a survey of local people to determine environmental issues of concern and indicators of change. These indicators were incorporated into a matrix to assess sites and their potential for development;
the identification of potential development sites based upon existing allocations and survey work;
the analysis of these sites against the aims of sustainability, conservation of natural resources and
environmental quality. This included the matrix of locally determined environmental issues;
the capacity of each site and its likelihood of being brought forward for development was assessed with reference to three development scenarios.
7
CASE STUDY 7 Possible future sources of large housing sites in London - Halcrow Fox –July 1998 This is one of the suite of LPAC capacity assessments referred to in case study 5. It was prompted by the fact that over half of permissions in London since 1992 had been on large windfall sites, and the analysis was confined to sites larger than 1 hectare (0.5 ha in central London). Methodology
The study was undertaken in 5 stages -
analysis of housing and industrial land supply and take-up;
identification of potential sites using maps, aerial photographs, site visits, a survey of owners and interviews with local authorities, owners and developers;
case studies of 100 sites to explore: suitability for housing and competing uses, physical and policy
constraints, owner aspirations, viability and potential capacity;
the application of three policy scenarios: maximum employment growth (existing policy), minimal employment growth (job decentralisation) and a balanced approach;
the grossing-up of figures to produce capacity estimates for each scenario.
The case studies in stage 3 assessed six issues: residential value, alternative use, physical constraints, contamination, policy constraints and ownership. Each issue was scored from 1 to 5 to allow an analysis of which sites would come forward for development. For example, it was assumed that contaminated sites would be developed only if they had a residential value of more than £1 million/hectare. Central to the study was a market assessment comparing housing values to the best available use that would get planning permission. Housing values were based upon three models: market-based (the highest value), policy-based (using higher densities) and policy-based but without a 25% social housing requirement. The amount of land available on large sites was estimated from the Stage 2 survey work. The industrial and commercial sites were subject to the three scenarios in stage 4. In each case it was assumed that 75% of surplus industrial and commercial land would be developed for housing. The market and employment scenarios were then combined into three overall policy scenarios -
a market based scenario with densities gradually increasing over time; a market based scenario with policies to increase density around public transport nodes; and a sustainable development scenario with a balance of employment and high-density housing.
8
CASE STUDY 8 North of England Assembly: Urban capacity study - ARUP Economics and Planning –1998 Methodology
This study was based not on fieldwork but on existing data sources. Eight mutually exclusive sources of capacity were identified. Trends in each area were analysed and capacity measured based on existing data, local authority knowledge and yardsticks. This capacity was also adjusted to take account of policy and market considerations. The sources considered were as follows -
Increasing the density of existing housing allocations. A range of net densities were used from 10 d/ha (executive housing) to 25-35 d/ha and 50-80 d/ha in central areas. These were converted to gross densities and applied to existing housing allocations. This trebled the yield of central sites and increased yields elsewhere. Just 10% of these figures was assumed to be viable.
Windfalls. Information from local authorities suggested a numerical contribution per year from
sites less than 1 hectare or 25 dwellings in urban areas (around 15% of new homes). It was assumed that this rate would continue with no increase in densities.
Conversions. It was estimated that 8% of the housing stock had potential for conversion due to
its size and age. 45% of this was under-occupied and it was decided that half of this should be retained as single dwellings. It assumed that just 10% of the remainder would get planning permission yielding on average three flats per house.
Vacant office space. This was used as a proxy for the conversion of commercial and industrial
buildings.
Vacancies. A reduction of 0.5% in vacancy rates in areas where the rate was more than 2.5% was assumed plus a third of all vacancies on difficult-to-let estates.
Urban greenspace. This included landscaping, recreational space and brownfield land. It was
suggested that urban areas had too little greenspace so that the capacity from this area was negligible.
Town centres. This included redevelopment but excluded office conversions (counted
elsewhere) and dismissed potential from surface car parks. It assumed that 8 ha of land would become available in the two larger cities and 2 to 4 ha in smaller towns, and that half of this would be developed.
Future allocations. An estimate was made for sites over 1 ha which would become available
and are not currently allocated for housing, industry or greenspace. Assumptions were made
9
which ranged from 23ha in the large cities to 6 ha in the minor centres. A third of this was to be developed as housing and a third as mixed-use, half at high densities and half at medium densities.
Employment land. The region’s allocated employment land and take-up rate were assessed. The
study assumed that 2.5% of this land would become available for housing.
CASE STUDY 9 Dwellings over and in shops in London - Civic Trust - July 1998 Another part of the overall London capacity assessment process was provided by this Civic Trust study of ‘living over the shop’. Methodology
The initial part of the study was based upon an analysis of existing data. This included the English House Condition Survey, the LOTS database, the Valuation Office Support Application Database (which records the number and area of shops and restaurants along with any residential accommodation), the Traffic Director for London’s research on Red Routes, and LPAC’s own town centre health checks. Some of the local authorities surveyed also used the Council Tax Register to identify accommodation, and the study also drew upon the Yellow Pages which includes half of all shops in London. The LPAC ‘health checks’ of (202) town centres and the Traffic Director for London’s research on Red Routes were used to create a sampling framework to select 10 main centres and 25 neighbourhood centres for detailed work. Each of these were followed up with retailer, agent questionnaires and a survey of 2,400 premises to create a typology in terms of physical suitability, ownership and historic/previous use. This was used to classify property into high/medium and low potential to which a series of policy scenarios could be applied.
CASE STUDY 10 Hertfordshire: Dwelling provision through planned regeneration – Urban Initiatives, Chestertons – October 1995 The aim of this study was to assess the potential for the intensification of existing housing areas in Hertfordshire. This was undertaken in part because declining household sizes in Hertfordshire meant that the housing density of many residential areas could be increased without raising the overall population density. Methodology
The Hertfordshire approach was based upon Typical Urban Areas (TUAs) or what the study called ‘Character types’. These included ten residential types, two town centre types and three commercial types.
10
Case study areas were selected for each type and analysed in terms of density, plot size, built form and parking. Each area was then studied in detail to identify opportunities for subdivision, infill, redevelopment and ‘replanning’. 32 Design exercises were used to estimate the amount of new housing that could be accommodated in each area. The cost of creating this housing was compared to its value leading to conclusion that 17 of the 32 case studies were not viable. Public meetings in the case study areas were used to gauge public reaction. Each of the TUAs was given an index to represent its potential for viable intensification. Town centre and commercial areas were assessed using a series of assumptions:
Flats over shops - that a third of space over shops was vacant and that a third of this was suitable for housing;
Town Centres - that town centres could generate 1.1 additional units per acre (excluding the
redevelopment of car parks);
Industrial sites - that 50% of vacant sites were suitable for housing;
Vacant offices - that 25% of older accommodation and 10% of modern space was suitable for residential conversion.
These figures were grossed up for the whole county by dividing all urban areas into one of the 15 TUAs and applying the indices and yardsticks. This ‘unconstrained figure’ was then discounted using the following criteria, to reflect the likelihood on the capacity being realised - Local circumstances - capacity was reduced by 60% in conservation areas and by similar proportions in areas where there had been a lot of intensification in the past; Structure plan period - an estimate was made of the capacity likely to be brought forward in the structure plan period; Scenarios - two scenarios were applied which wrapped up assumptions about site assembly, market conditions and policy delays. A pessimistic scenario saw the capacity further reduced by a third while an optimistic scenario increased it by a third.
CASE STUDY 11 South West Regional Planning Conference: Strategic study of urban housing potential – Baker Associates with UWE – November 1998 This is the second of two major studies by Baker Associates. It used a similar methodology to case study 3 (on Yorkshire and Humberside).
11
Methodology
The methodology involved the following stages -
The identification of 35 typical urban area types (TUAs) including 9 residential types, 5 mixed-use, 5 employment, 7 other uses, 3 community and 3 vacant and 3 others;
the subdivision of each urban area in the region, and the allocation of each subdivision into one
of these TUAs;
47 case studies to assess capacity and to categorise sites into a) easy, b) medium and c) difficult;
the application of two density scenarios: a) 35 houses/ha (low), b) 50 house/ha (high). The implications of increasing this to 60h/ha was explored and found to add 10% to capacity;
a market analysis based upon a categorisation of the region into three levels of demand A, B and
C and two take-up scenarios - High and Low. These were combined in a matrix to adjust capacity so that in A/High areas 100% of capacity was used whereas in C/Low areas only 10% was used.
CASE STUDY 12 Exploring Urban potential for housing: North West - Llewelyn-Davies – North West Regional Association 1997 This study was developed for planning authorities in the North West to assess the capacity of their urban areas on a consistent basis. Methodology
The manual produced by the study took authorities through a series of stages -
Identification of the boundary of each urban area and the subtraction and sites (like parks) not suitable for housing.
The division of the urban area into 4 types: town or city centre, housing area, employment area
and interface zone. The latter were the most important and include transitional zones between different uses, mixed-use districts and declining areas.
The identification of one-off development opportunities in the residential and employment areas.
The definition of ‘Focus locations’ - places which were well served by public transport such as town and city centres.
12
The use of three scenarios to guide the selection of sites and the way in which they were assessed -
o Scenario 1- Including only sites currently acceptable for housing and mixed-use development
assuming current land allocation and policy standards.
o Scenario 2 - The same as Scenario 1 except that planning standards were relaxed and densities increased in focus locations.
o Scenario 3 - Including all sites in the focus locations whether or not they were allocated for housing, assumes a proactive approach to issues like site assembly along with relaxed planning standards and higher densities.
A survey of the interface zones and town centres to identify housing sites for classification
according to the three scenarios.
Estimates of the capacity of each site using a series of design exercises covering different site configurations and scenarios.
Rules of thumb for the conversion of commercial buildings.
The assessment of intensification using six TUAs and a series of design exercises to generate a yardstick for the housing capacity per hectare. This yardstick was adjusted depending on the policy scenario and local circumstances.
An assessment of conversions based on the number of properties with more than seven habitable rooms and two or less occupants. The capacity estimate was based on design exercises or previous planning applications.
An assessment of empty properties based on districts with vacancy rates higher than the regional average of 4.4%.
The stages up until this point produced an ‘unconstrained’ housing capacity.
The next stage was to qualify this capacity depending upon the policy context and market
conditions. The policy context was assessed using the policy scenarios. However rather than being used to discount capacity, these were used to illustrate to policy-makers the implications of different decisions. The difference between Scenarios 1 and 2 illustrated the impact of policies, for example on parking standards, whilst Scenario 3 showed what might be possible, for example, through compulsory purchase powers.
Sites were graded according to market conditions into; those attractive to the market; those likely
to come forward with a little help and those unlikely ever to be developed. This allowed an assessment of market conditions and the impact of different interventions.
13
CASE STUDY 13 Surrey: Urban Capacity study – Surrey County Council – February 1999 In this study the districts of Surrey worked with Surrey County Council to provide an extensive, comprehensive, and unconstrained assessment of the capacity of Surrey’s urban areas. The study did not, however, reconsider existing housing allocations nor did it include some sources such as non-residential conversions and flats over shops. The methodology comprised the following steps -
Define the urban areas. The county’s urban areas were defined on maps, excluding areas such as nature reserves.
Classify the urban areas. Urban areas were classified into five types, by dwelling density.
Conservation areas, other policy areas and large housing developments built 1971-1991 were also identified. 800m catchments were plotted around town centres and sites over 0.4ha were identified from aerial photographs and categorised by the NLUD procedure.
Calculate the 1998 dwelling stock. Existing housing, recent completions and current
commitments were used to create a 1998 baseline data set.
Assess capacity. Capacity was based on two scenarios: 1) assumed that current policies were maintained; and 2) tested the consequences of a selective relaxation of policies. Capacity was identified using large scale plans onto which all of this information was plotted. Sites less than 0.4ha were identified based upon guidelines which included looking for sites similar to those which were recently developed, had had planning applications made or refused, were in less than four ownerships, had a street frontage, or had potential for redevelopment.
All town centre catchments and policy areas were surveyed in this way. Districts were however able do a 50% sample of the remaining residential areas (excluding large housing developments since 1971). Districts were also asked to provide an estimate of how much capacity could be increased with Scenario 2 along with a commentary on the policy implications and ‘institutional and marketing constraints’. The capacity of large sites was also identified by categorising them by their prospects for development (high, low and no chance). For Scenario 1 only the ‘high chance’ sites were considered while Scenario 2 included the ‘low chance’ sites. Capacity estimates were based on densities achieved in similar schemes elsewhere which were increased for the large Scenario 2 sites to 35dph on rural sites and 50dph on urban sites.
14
CASE STUDY 14 Sustainable Residential Quality: New approaches to urban living - Llewelyn-Davies –1998
One of the LPAC suite of studies, this report sought to identify capacity within easy walking distance of local centres in London. In addition to this the study looked at existing allocations, backland development and the subdivision of existing housing. Methodology
The study used a similar methodology to the North West Study (case study 12). However while the NW Study developed a methodology for use by local authorities, this study sought to produce an estimate for London and was therefore based upon case studies. The study involved the following stages -
Four case study areas were selected - two metropolitan centres, one major centre, and one district centre;
the definition of a ‘Ped Shed’ - an 800m catchment area measured from the edge of each centre;
a detailed study of each Ped Shed using 1:2500 maps to identify development opportunities (excluding large sites, living over the shop and office conversions since they were covered in other studies. The sites were identified without reference to planning allocations, development proposals or constraints;
27 of the sites identified were selected for design exercises. These were intended to cover a range of circumstances and to provide examples of how problems could be solved;
for each site three design exercises were undertaken. The first applied existing planning policies and parking standards, the second used reduced parking requirements, and the third removed all requirements for off-street parking;
these design exercises were used to estimate the capacity of the other sites in the Ped Shed and of the Ped Shed as a whole;
the Ped Shed areas were then divided into land uses including town centres, residential, employment, institutional, and open space. Land which did not fall into any of these categories was classified as ‘interface zone’. This classification was done to enable the findings to be applied to other town centres;
these land use areas were then used to analyse and produce capacity estimates for six further case study centres;
together with the original four case study areas these were then used to provide an estimate for all centres in London based upon their size and pattern of land use.
15
Capacity was also estimated for small sites outside the Ped Sheds based upon the London
Development Monitoring System. The numbers of houses on each site was then factored up by 50% to represent the difference between options 1 and 2. Design studies were used to assess the potential for backland development and yardsticks were used to estimate the potential from conversions.
CASE STUDY 15 Housing capacity in urban areas of the East Midlands - ENTEC – November 1998
This study was principally concerned with establishing a mechanism by which urban capacity could be tapped. It did not consider all the potential sources of capacity. Methodology
The study was based upon the development of a ‘Common Framework’ for identifying opportunities for urban housing. This framework was used during the study to assess a series of case study areas and was recommended for use by local authorities to assess the capacity of their areas.
The study identified 10 types of urban areas (Typical Urban Areas or TUAs). These included four residential types based upon the age of the property (pre 1918, Inter war, 50s-60s and 70s onwards), 2 industrial areas (pre and post war), 3 commercial areas (city, town and district) and one mixed-use area.
2. The urban areas of the region were classified into these categories and 13 case study areas were selected to be studied using the Common Framework. This framework assessed -
o The historic and future role of the area; o current initiatives operating in the area; o key census information on population and housing; o the character of the area; o historic housing development and planning permissions; o the likely impact of future development on residents; o sources of housing supply in the area; o barriers to development.
From the case study areas the study indicated that housing capacity of existing residential areas
was minimal and did not justify special intervention. However industrial, commercial and mixed-use areas did have the potential to accommodate additional housing development and justified intervention by local authorities.
16
The study then went on to assess the form of this intervention. It recommended that an area-based approach should be used in commercial, industrial and mixed-use areas while a portfolio approach (concentration on specific issues such as empty property) was appropriate for housing areas. The area-based approach included the following elements -
o The Common Framework (as described above) to identify opportunities; o a programme of action, timetable and key players; o a vision for the area; o a masterplan identifying development opportunities and how they might be developed; o public consultation; o the investigation of potential development sites; o details of requirements relating to sustainable development; o a timetable for delivery; o an implementation partnership.