Vocal Tract Length Normalization for Large Vocabulary Continuous Speech Recognition Puming Zhan and Alex Waibel May 1997 CMU-CS-97-148 School of Computer Science Carnegie Mellon University Pittsburgh, PA 15213 19980106 043 This report also appears as Language Technologies Institute Technical Report: CMU- LTI-97-150. The work reported in this paper was funded in part by ARPA under grant N00014-93-1-0806, and by the German Ministry under grant VERBMOBIL-FKZ 01iv402. The views and conclusions contained in this document are those of the authors and should not be interpreted as representing the official policies, either expressed or implied, of the German Ministry, ARPA, or U.S. government. DistribatUxa Unlimited * | iOTO^ai||#agi^tÄKn^
Transcript
Vocal Tract Length Normalization for Large Vocabulary Continuous Speech Recognition
Puming Zhan and Alex Waibel
May 1997 CMU-CS-97-148
School of Computer Science Carnegie Mellon University
Pittsburgh, PA 15213
19980106 043 This report also appears as Language Technologies Institute Technical Report: CMU-
LTI-97-150. The work reported in this paper was funded in part by ARPA under grant N00014-93-1-0806, and by the German Ministry under grant VERBMOBIL-FKZ 01iv402. The views and conclusions contained in this document are those of the authors and should not be interpreted as representing the official policies, either expressed or implied, of the German Ministry, ARPA, or U.S. government.
1 Frequency warping VTLN 4 2 Piecewise warping curves 5 3 Bilinear warping curves 5 4 Speaker-specific Bark/Mel scale VTLN 6 5 Bark scale warping curves 7 6 Mel scale warping curves 7 7 Histogram of piecewise warping factors 10 8 Histogram of bilinear warping factors 10 9 Histogram of Bark scale warping factors 11 10 Histogram of Mel scale warping factors 12 11 Distribution of the warping factors in test 13
Abstract Generally speaking, the speaker-dependence of a speech recognition system stems from speaker-dependent speech feature. The variation of vocal tract length and/or shape is one of the major source of inter-speaker variations. In this paper, we address several methods of vocal tract length normalization (VTLN) for large vocabulary continuous speech recognition: (1) explore the bilinear warping VTLN in frequency domain; (2) propose a speaker-specific Bark/Mel scale VTLN in Bark/Mel domain; (3) investigate adaptation of the normalization factor. Our experimental results show that the speaker-specific Bark/Mel scale VTLN is bet- ter than the piecewise/bilinear warping VTLN in frequency domain. It can reduce up to 12% word error rate for our Spanish and English spontaneous speech scheduling task database. For adaptation of the normalization factor, our experimental results show that promising result can be obtained by using not more than three utterances from a new speaker to esti- mate his/her normalization factor, and the unsupervised adaptation mode works as well as the supervised one. Therefore, the computational complexity of VTLN can be avoided by learning the normalization factor from very few utterances of a new speaker.
1 INTRODUCTION The variations in speaker, context, and environment are the major challenges to the current state-of-the-art speech recognition systems. The performance of a speech recognition system could vary largely because of these variations in practical use. Therefore, how to make speech recognition systems as accuracy as possible, and meanwhile as robust as possible is a major issue in speech recognition. From point view of the present techniques for speech recognition, the major speaker-dependent source is from the speech signal. The reason that the speech signal is speaker-dependent is very complex. It is not only relating with the physiological differences of speakers, such as vocal tract shape and length, but also relating with the linguistic differences, such as accent, dialect and stress, etc., or even the physical and mental conditions of speakers [1, 2]. But it is generally agreed that one of the source of inter-speaker variation is the vocal tract length (VTL). Therefore, the vocal tract length normalization (VTLN) technique has been widely investigated recently for eliminating the VTL variation [1, 3, 4, 5, 6, 7, 8].
In general, two issues are involved in VTLN: (1) Given the speech data from a speaker, how to obtain the normalization factor; (2) Given a normalization factor, how to do the nor- malization; Strictly speaking, step (1) should be how to obtain the vocal tract length from the exact VTLN point of view. Since, with the present VTLN method, one generally calculates a factor which reflects the differences in vocal tract between different speakers, instead of directly measuring the VTL of each speaker, we refer step (1) as obtain the nor- malization factor. We also refer normalization factor as warping factor in this paper, since the factor is used to warp the spectrum in frequency axis for the normalization purpose. For obtaining the warping factor, there are basically two methods, that is, obtaining the fac- tor from calculating VTL or from line search. It has been shown that VTL has relationship with formant positions, and hence it could be calculated from the formant frequency based on the linear predictive model [3, 4, 7, 9]. The disadvantages of this method are: (a) formant frequency and its relationship with VTL are highly dependent on the context, and could vary largely with different context for the same speaker [9]. Thus calculation of formant frequency based on an UN-constraint context can not reflect the differences of VTL between different speakers; (b) it is necessary to separate and select the voiced speech data, since it does not make sense to calculate formant frequency based on unvoiced speech data (like consonants and noises). However, this could be a serious problem for practical use, especially for the highly co-articulated conversational speech signal; (c) the criterion of calculating the warping factor is not consistent with the criterion of estimating the other parameters of acoustic models which are usually estimated under the maximum likelihood (ML) training criterion, and hence can not guarantee that the normalization with such factor can increase the ML matching score. Because of the lack of a high accurate, context-independent, and robust VTL calculation technique, the method of obtaining warping factor based on VTL calculation seems difficult for practical use.
Given the above reason, the line search method was proposed and investigated in [5, 6, 8]. The advantage of the line search is that it does not need to consider either the relationship between VTL and the formant frequency or the separation of voiced and unvoiced speech, and it is consistent with the acoustic model training criterion. Actually, the VTLN based on the line search factor does not exactly mean it is doing vocal tract length normalization, because the warping factor is obtained in the way to increase the matching score of the acoustic model, and it does not necessarily reflect the difference in vocal tract length (the variation in vocal tract shape could also affect on the line search warping factor). The major disadvantage of the line search is that it is very expansive in computation, since one needs to carry out the decoding process for every possible factors and select the one with which the matching score is the best. Fortunately, this exact and very time consuming decoding process, could be simplified without significant loss of recognition accuracy.
For normalizing the speech feature given a warping factor, two methods have been pro-
posed, that is,_ the frequency warping, and the Bark/Mel scale warping. They warp the spectrum at different stage in the front-end, though both of them warp the spectrum in frequency axis. It has been proved that lower formant position corresponds to longer VTL and vice visa, though this kind of relationship is context-dependent and not purely linear [9]. Therefore, a intuitive method of VTLN is to warp the spectrum in frequency axis, so that the formant positions in the normalized spectrum will towards the formant positions in the standard spectrum (usually the average among many speakers). We referred this kind of VTLN as frequency warping (FWP) in [10]. The FWP was also proposed and investigated in [5,_ 7, 8], where the spectrum was warped with linear or exponential rule. The problem with this method is that there exists bandwidth mismatch, since the bandwidth of the original spectrum is fixed. On the other hand, one has to tackle the spectrum interpolation problem, since the original spectrum only has values at integer frequency points in the computer pro- gram implementation. The one-Bark-shift method was proposed in [4], where, instead of the spectrum, the filter banks were shifted one-Bark in Bark domain according to the auditory results that the spectral difference between male and female speakers is approximately one Bark. However, as mentioned in [4], such difference is dependent on frequency (less than one Bark in low frequency). Thus many constraints have been impacted on the one-Bark-shift method. Those constraints make the method complex and not easy for use. In addition, the shift was not consistent with the training criterion. Another implementation of VTLN in Mel domain was reported in [6], where the center frequency and width of each Mel scale filter bank was warped according to the warping factor. Our method for implementing VTLN in Bark/Mel domain is also warping the filter banks space. But we view the Bark/Mel scale for every warpingfactor as a speaker-specific Bark/Mel scale, and do the warping based on such speaker-specific scale, so that we can avoid the bandwidth mismatch problem.
We investigated VTLN in [10], where we implemented VTLN in the Bark scale filter bank front-end, obtained the warping factors either from formant or from line search, and used the FWP method for normalization. The experiments were carried out on the large vocabulary Spanish spontaneous speech scheduling task database. Our experiments showed that the FWP VTLN based on the line search warping factors could reduce up to 10% word errors. However, there was no improvement with the formant-based VTLN, the exponential warping rule was not better than the linear warping rule in our experiments. We found that the main reason for the inferior performance of the formant-based VTLN is because of the high context-dependence of formant frequency. Since we calculated formant frequency with an UN-constraint context, i.e, there is no guarantee of phoneme balance in the context among the speakers, the obtained formant frequency could not reflect the real difference of VTL among those speakers.
In this paper, we keep using the line search method to obtain warping factor, but tackle different normalization methods. We first explore the bilinear warping rule with the FWP method, since there is no bandwidth mismatch problem with this warping rule. Then we im- plement the VTLN in Bark/Mel domain. We refer our method as speaker-specific Bark/Mel scale VTLN, since we view the Bark/Mel curve with different warping factor as a speaker- specific curve. Though warping the spectrum in Bark/Mel domain should be equivalent to warping it in the frequency domain, our implementation can avoid the bandwidth mismatch. Moreover, there is no need to do spectrum interpolation as in the FWP VTLN, and there is no constraints on the warp as in [4]. In addition, the speaker-specific Bark/Mel scale VTLN is very simple in implementation, and there is no need to specify the warping rule. Our experiment results show that the speaker-specific Bark/Mel scale VTLN is better than the piecewise/bilinear frequency warping VTLN, and can reduce up to 12% relative word error rate for our Spanish and English spontaneous speech scheduling task database. The VTLN is usually considered as a time consuming technique for speaker normalization. In this paper we investigate the adaptation of the warping factors in the supervised/unsupervised adaptation mode. The results show that the promising result could be obtained by using not more than three utterances from a new speaker to learn his/her warping factor, and the
unsupervised adaptation mode works as well as the supervised one. Therefore, the compu- tational complexity of VTLN can be alleviated by learning the warping factor from very few utterances of a new speaker.
2 VOCAL TRACT LENGTH NORMALIZATION Since the Bark/Mel scale filter bank coefficients (spectral or cepstral coefficients) are the popular preprocessing in the current state-of-the-art speech recognition systems [11, 12, 13, 14, 15], we only address VTLN based on this kind of front-end preprocessing in rest of this paper. In this section, we describe the two different front-end implementations of VTLN, i.e, the frequency warping method in frequency domain and the speaker-specific Bark/Mel scale warping in Bark/Mel domain. We explore to use a bilinear warping rule in frequency warping method.
2.1 Preprocessing The recorded speech signal is assumed to be transmitted via some kind of channel and to be received via some kind of receiving device. In the transmitting and receiving process, the clean speech signal is disturbed by channel distortions and some additive noises. Generally, the channel distortion is assumed to be multiplicative in frequency domain, so that the received speech signal can be expressed as:
X{Lü) = H(u)S(u>) + N(u) (1)
Where X{u), S(LO), H(UJ), and N(u>) are the spectrum of the received speech signal, the clean speech signal, the channel response, and the additive noise signal. We assume that X{UJ) has been segmented with a Hamming window, so that H(u) and N(UJ) also include the effect of pre-emphasis and the Hamming window. In the Bark/Mel filter bank front-end, X{u) is integrated with the filter bank using band pass filters spaced according to the Bark/Mel scale, and usually have triangular or trapezoid shape [12, 14, 16]. The integration with the filter bank can be formulated as:
0(n) = J2 Tn(u)X(u) 0<n<N-l (2) w=ln
Where 0{n) is n-th filter bank output, N is the number of filters, ln and hn are the lower and upper bound of the n-th filter Tn{u>). The bandwidth of each Tn{u), i.e., hn — ln, depends on the Bark/Mel scale. We evaluate our VTLN methods based on two different filter bank coefficients, the Perceptual Linear Predictive (PLP) cepstral coefficients (PLPCC) is used to carry out the experiments for the piecewise/bilinear frequent warping VTLN and the speaker-specific Bark scale VTLN. The Mel frequency cepstral coefficients (MFCC) is used to carry out the experiments for the speaker-specific Mel scale VTLN.
In the PLPCC front-end, we use the same Bark scale and filter bank shape as in [14]. We calculate 21 filter bank coefficients and use them to derive 13 LPC-Driven cepstral coefficients. Then we combine the cepstral coefficients and power with their first and second derivative to generate a 42-dimensional feature vector. Finally, this vector is transformed with a linear discriminant analysis (LDA) matrix, and reduced to 28 coefficients.
In the MFCC front-end, we use the Mel scale and a triangular shape filter bank [11, 12]. We calculate 30 filter bank coefficients and derive 13 cepstral coefficients via the discrete cosine transform. We also combine the cepstral coefficients with their first and second
derivative to generate a 39-dimensional vector and reduced to 28 coefficients after the LDA transformation. The major difference between the PLPCC and MFCC is that the filter bank coefficients are processed with some perception rules in the PLPCC front-end, and the filter bank shape is not triangular. We use the Mean-subtraction in both front-ends.
2.2 VTLN based on frequency warping Figure 1 is the block diagram of the VTLN based on frequency warping method as normal- ization in the PLPCC front-end.
Warping Factor
x(t) Fourier
Transform Frequency Warping
filter Bank Integration OJn)
Figure 1: Frequency warping VTLN
Where x(t) is the input speech signal, Oa(n) is n-th filter bank output, and a is the warping factor. Note that the warping factor a is dependent on speaker. We write it as a for simplicity throughout this paper. Figure 1 can be expressed as:
tJ=h„
Oa(n) = Yl Tn(u)X(Va{Lo)) 0<n<N-l (3) U)=\n
Where <pa(a>) is the warping function. If let ipa(co) = LV, then equation (3) is equal to equation (2) which means no warping. Compared to 0(n) in equation (2), Oa(n) depends on the speaker-specific warping factor and the warping rule. We use two different warping rules in this method:
(1) piecewise rule:
<Pa{U) a 1co if to < üü0
bu) + c if Lo > u>o (4)
(2) bilinear rule [17]:
tpa(u) , . (1 — a)sin(uj) .
vl-(1-a)cos(w)" (5)
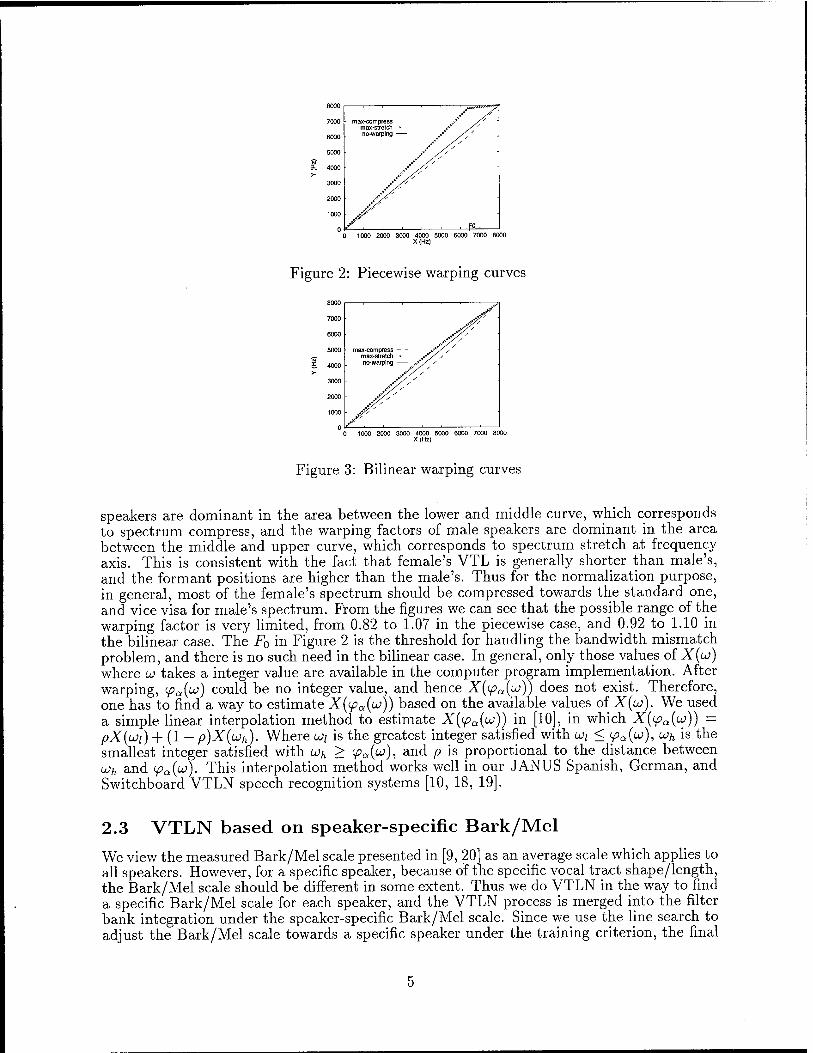
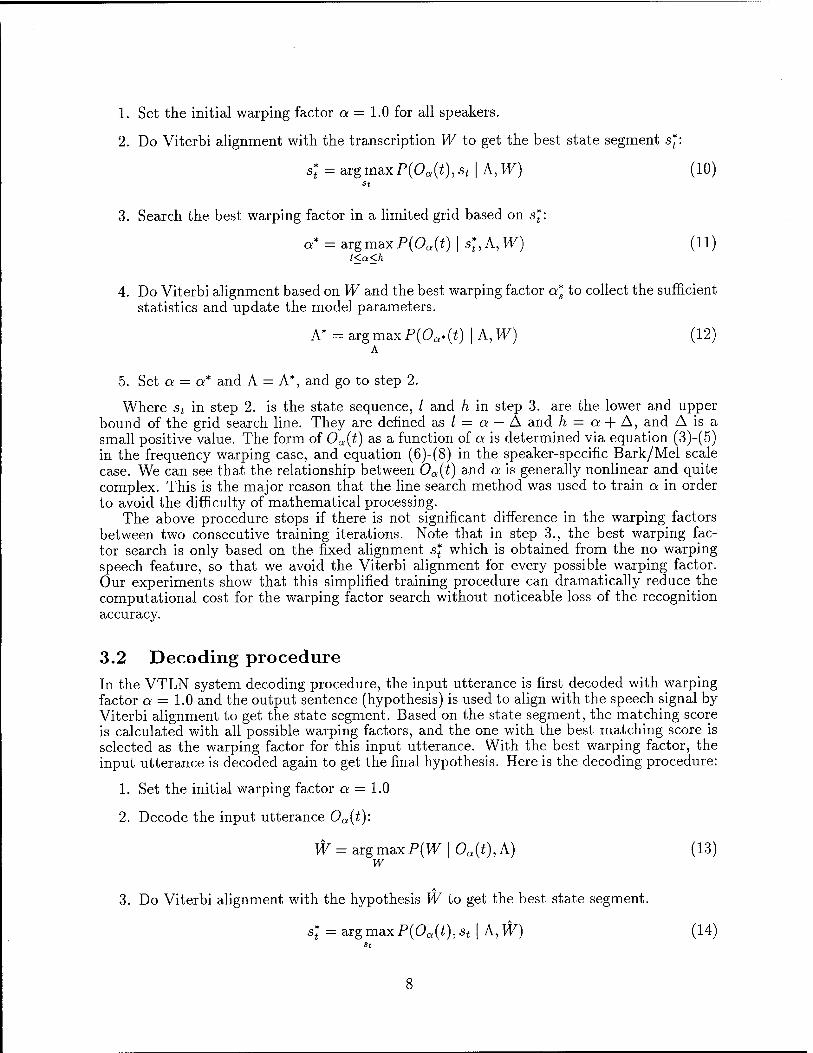
Where a is the speaker-specific warping factor, u0 in equation (4) is a fixed frequency which is set with experiment to handle the bandwidth mismatching problem,_ and b, c can be calculated with a known to0. If we set LO0 = uN, the warping rule becomes linear. Where LON is the Nequist frequency and cvN - 8000KHz in this paper. Figure 2 and 3 are the warping curves of the piecewise and bilinear rule. Note that according to equation (4) and (5), a > 1.0 corresponds to compressing the spectrum, and a < 1.0 corresponds to stretching the spectrum, and a = 1.0 corresponds to no warping case.
In figure 2 and 3, three curves are presented in each Figure, which reflect the range of the warping factors obtained in the training process. The lower and upper curves correspond to the minimum and maximum factors, and the middle one corresponds to unit warping factor (no warping). The area between the upper and lower curve is the possible range of warping factors obtained in our experiments. We observed that the warping factors of female
0 1000 2000 3000 4000 5000 6000 7000 8000 X(HZ)
Figure 2: Piecewise warping curves
0 1000 2000 3000 4000 5000 6000 7000 8000 X(HZ)
Figure 3: Bilinear warping curves
speakers are dominant in the area between the lower and middle curve, which corresponds to spectrum compress, and the warping factors of male speakers are dominant in the area between the middle and upper curve, which corresponds to spectrum stretch at frequency axis. This is consistent with the fact that female's VTL is generally shorter than male's, and the formant positions are higher than the male's. Thus for the normalization purpose, in general, most of the female's spectrum should be compressed towards the standard one, and vice visa for male's spectrum. From the figures we can see that the possible range of the warping factor is very limited, from 0.82 to 1.07 in the piecewise case, and 0.92 to 1.10 in the bilinear case. The F0 in Figure 2 is the threshold for handling the bandwidth mismatch problem, and there is no such need in the bilinear case. In general, only those values of X(u) where u takes a integer value are available in the computer program implementation. After warping, (pa(u>) could be no integer value, and hence X(ipa(uj)) does not exist. Therefore, one has to find a way to estimate X((pa(uj)) based on the available values of X(u). We used a simple linear interpolation method to estimate X((pa(u)) in [10], in which X((pa(u)) = pX(üüi) + (1 - p)X(ujh). Where u>i is the greatest integer satisfied with u>i < fa{w), vh is the smallest integer satisfied with uh > <pa(u), and p is proportional to the distance between u>h and <pa(u}). This interpolation method works well in our JANUS Spanish, German, and Switchboard VTLN speech recognition systems [10, 18, 19].
2.3 VTLN based on speaker-specific Bark/Mel We view the measured Bark/Mel scale presented in [9, 20] as an average scale which applies to all speakers. However, for a specific speaker, because of the specific vocal tract shape/length, the Bark/Mel scale should be different in some extent. Thus we do VTLN in the way to find a specific Bark/Mel scale for each speaker, and the VTLN process is merged into the filter bank integration under the speaker-specific Bark/Mel scale. Since we use the line search to adjust the Bark/Mel scale towards a specific speaker under the training criterion, the final
speaker-specific Bark/Mel scale is consistent with the training criterion, and hence guarantee to increase the acoustic matching score. We evaluate the speaker-specific Bark scale VTLN on the PLPCC front-end, and the speaker-specific Mel scale VTLN on the MFCC front-end. Figure 4 is the block diagram of the speaker-specific Bark/Mel scale front-end preprocessing.
Warping Factor
T x(t)
Fourier Transform
Filterbank Integration Oa(n)
Figure 4: Speaker-specific Bark/Mel scale VTLN
Compared to Figure 1, the frequency warping step is removed, and the VTLN is implicitly implemented by the speaker-specific Bark/Mel scale filter bank integration. Figure 4 can be expressed as:
ü/=/ia(n)
Oa(n) = £ Tn(u,)X(u>) 0<n<N-l (6) w=la(n)
Compared to equation (3), here the difference is that the filter bank space, i.e., ha(n) — la(n), is dependent on the speaker-specific warping factor a, since each speaker has a specific Bark/Mel scale. We define the speaker-specific Bark scale:
Ba(u) = 6ln{u/(aa0) + ^(w/(aa0))2 + 1)) (7)
Where a is the speaker-specific parameter, a = 1.0 represents the no warping Bark scale. We let «o = 12007T, so that the no warping Bark scale is the same as equation (3) in [14]. If we let & = io/a, which represents the warped frequency, then equation (7) becomes:
B(u) = Qln(tü/a0 + ^(cb/a0)2 + l) (8)
Equation (7) and (8) show that the filter bank integration with the speaker-specific Bark scale is equivalent to the integration in the warped frequency domain with the normal Bark scale. However, as we mentioned in section 2.2, if we first warp the spectrum, we have to estimate the spectrum values X(LO) where u> is not an integer, and have to handle the bandwidth mismatch probelm since X(LO) has a fix bandwidth (8KHz in our case). According to equation (7), for different warping factor a, we will get a different maximum number of Bark coefficients, which corresponds to the Nequist frequency LO^ (as showed in 5). Let the maximum number of Bark coefficients for warping factor a is Bmax — Ba{u^), and the number of filter banks is N, then the filter bank space is Bmax/N for a in Bark domain. The center frequencies of the filter banks in frequency domain can be found according to the Bark curve with a. Therefore, no filter bank will have center frequency which is greater than ujpj. In the same way, We define the speaker-specific Mel scale as equation (9).
Ma{u) = 25%logw{l + u/{a0a)) (9)
Where a0 = 14007T. Equation (9) is from [13, 21], which is an approximation of Zwicker's Bark scale [20]. Figure 5 and 6 are the warping curves of the speaker-specific Bark/Mel scale.
The three curves in each Figure have the same meaning as in Figure 2 and 3. We also observed that the warping factors of female speakers are dominant in the area between the lower and middle curve, which corresponds to more compress in the spectrum, and the warping factors of male speakers are dominant in the area between the middle and upper curve, which corresponds to less compress in the spectrum. The major advantage of the speaker-specific Bark/Mel scale VTLN is that it is very simple and effective. Viewing equation (7) and (9) as speaker specific curves allow us to adjust the other parameters in the formula for a specific speaker.
3 TRAINING AND DECODING PROCEDURES Compared to the training and decoding procedures in a no-VTLN speech recognition system, there is an additional step, i.e., finding the best warping factor, in the training and decoding procedures of a VTLN system. In order to avoid the expansive computation in searching the best warping factor, we use a suboptimal method in searching warping factors, with which the computational cost can be dramatically reduced without significant loss of recognition accuracy.
3.1 Training procedure Suppose Oa(t) is the speech feature vector sequence of the input utterance with warping factor a. Let W be the transcription of the input utterance, A be the parameter set of the acoustic models of a no-VTLN system, and P(Oa(t) | A) is the probability density of the speech feature. We use the Hidden Markov Model (HMM) as acoustic model, and the mixture-gaussian density as the output probability density of each HMM state. The following procedure is used to train a VTLN system:
1. Set the initial warping factor a = 1.0 for all speakers.
2. Do Viterbi alignment with the transcription W to get the best state segment s*:
s* = arg max P(Oa(t), st | A, W) (10)
-,*. 3. Search the best warping factor in a limited grid based on s*t
a* = argmaxP(Oa(i) | s*,k,W) (11) l<a<h
4. Do Viterbi alignment based on W and the best warping factor a* to collect the sufficient statistics and update the model parameters.
A* = arg max P(Oa* (t) | A, W) (12) A
5. Set a = a* and A = A*, and go to step 2.
Where st in step 2. is the state sequence, / and h in step 3. are the lower and upper bound of the grid search line. They are defined as I = a — A and h = a + A, and A is a small positive value. The form of Oa(t) as a function of a is determined via equation (3)-(5) in the frequency warping case, and equation (6)-(8) in the speaker-specific Bark/Mel scale case. We can see that the relationship between Oa(t) and a is generally nonlinear and quite complex. This is the major reason that the line search method was used to train a in order to avoid the difficulty of mathematical processing.
The above procedure stops if there is not significant difference in the warping factors between two consecutive training iterations. Note that in step 3., the best warping fac- tor search is only based on the fixed alignment s* which is obtained from the no warping speech feature, so that we avoid the Viterbi alignment for every possible warping factor. Our experiments show that this simplified training procedure can dramatically reduce the computational cost for the warping factor search without noticeable loss of the recognition accuracy.
3.2 Decoding procedure In the VTLN system decoding procedure, the input utterance is first decoded with warping factor a = 1.0 and the output sentence (hypothesis) is used to align with the speech signal by Viterbi alignment to get the state segment. Based on the state segment, the matching score is calculated with all possible warping factors, and the one with the best matching score is selected as the warping factor for this input utterance. With the best warping factor, the input utterance is decoded again to get the final hypothesis. Here is the decoding procedure:
1. Set the initial warping factor a = 1.0
2. Decode the input utterance Oa(t):
W = arg max P(W | Oa(t), A) (13) w
3. Do Viterbi alignment with the hypothesis W to get the best state segment.
5i* = argmaxP(Oa(*),5t|A,W0 (14)
8
4. Find the best warping factor based on the segment s*.
a* = argmaxP(Oa(i) | s*, A) (15) a
5. Decode again based on the best warping factor a*.
W = argmaxP(W |0„.(i),A) (16) w
Where Oa(t), st, and A have the same meaning as in the training procedure. W is the hypothesis of the first decoding pass without VTLN, W is the hypothesis with VTLN. As in the training procedure, we search the best warping factor based on the fixed state segment s*, with which we can dramatically increase the decoding speed without significant loss of the recognition accuracy.
4 EXPERIMENTS All experiments are based on our JANUS-III speech recognition system. Compared to the JANUS-II system, the new system uses context dependent polyphone (with multiple left and right phones) as speech unit for acoustic model, and the models are clustered and split based on the decision-tree. We already used the piecewise frequency warping VTLN in our JANUS-III system for Switchboard database and the spontaneous scheduling task database of English, German, and Spanish language, and observed up to 12% relative word error reduction [10, 18, 19]. In this section, we mainly report the experimental results of the bilinear frequency warping VTLN and the speaker-specific Bark/Mel scale VTLN based on our Spanish and English spontaneous scheduling task (SSST) database.
4.1 Database The SSST database consists of two different kinds of data: push-to-talk dialogs and cross-talk dialogs. Two out of three of the data are cross-talk dialogs. Although they are all human to human dialogs, these data are recorded in very different styles. In push-to-talk recording, two speakers have to interface with a computer and push the "return" key to speak, so that simultaneous speaking can be avoided. In the cross-talk recording, two speakers can interrupt each other at any time, hence the cross-talk dialogs contain a lot of simultaneous speaking. We also observed that the cross-talk data are more disfluency than the push-to-talk data. Details about the SSST database can be found in [22]. The training set consists of 10650 utterances (about 16 hours speech data). Among of them, 5785 utterances were recorded from 68 female speakers, and 4865 utterances were recorded from 72 male speakers. We use the push-to-talk and cross-talk dialogs together to train the acoustic models, but keep an individual test set for each of them. The push-to-talk test set consists of 86 utterances recorded from three male and four female speakers. The cross-talk test set consists of 117 utterances recorded from three male and three female speakers. All speech data were recorded at 16KHz sampling rate. The test vocabulary consists of 4606 unique words in the training set. For both test sets, the out of vocabulary word rate is 2.35% for push-to-talk test set, and 0.89% for cross-talk test set. The language model is the class-based trigram language model.
4.2 Distribution of piecewise and bilinear warping factors Figure 7 and 8 are the statistical distributions of the piecewise and bilinear warping factors in the frequency warping VTLN.
The distributions of warping factors for male and female speakers demonstrate that the warping trend is to compress female speaker's spectrum, and to stretch male speaker's spec- trum along frequency axis. This warping trend is consistent with the fact that female speak- ers, in general, have higher formant frequencies (shorter VTL) compared to male speakers. This also illustrates that the warping factors do reflect the VTL difference in some extent, though they are obtained by line search, instead of directly calculating the VTL or formant frequency.
4.3 Results of frequency warping VTLN Table 1 is a summary of the testing results for the frequency warping VTLN with piecewise and bilinear warping rule. The results were obtained in the push-to-talk test set. The first column in table 1 are the names of testing speaker, and the first character (M/F) in each name represents gender of the speaker. Table 1 shows that both piecewise and bilinear warping can reduce about 10% word errors. But the bilinear warping rule does not show remarkable improvement, though it can handle the bandwidth mismatch problem, and better than the exponential rule [10].
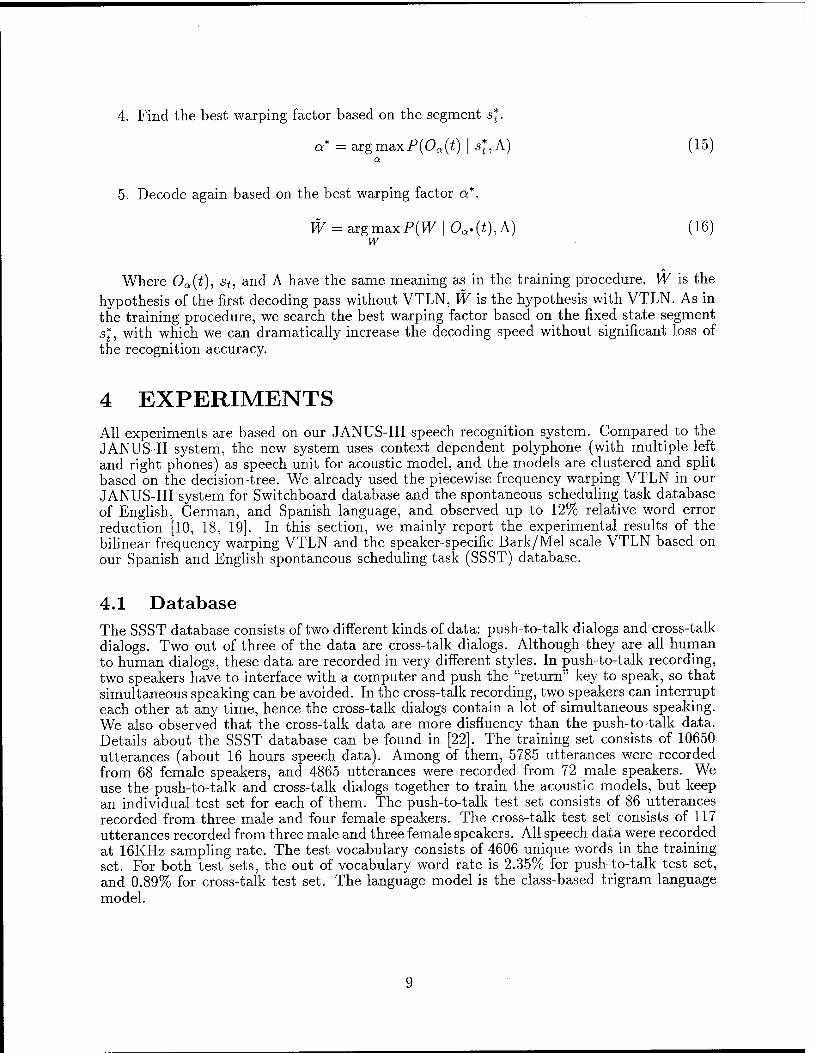
4.4 Distribution of Bark/Mel scale warping factors Figure 9 is the statistical distribution of the speaker-specific Bark scale factors, and Figure 10 is the distribution of the speaker-specific Mel scale factors in the speaker-specific Bark/Mel scale VTLN.
Figure 9 and 10 show the same warping trend for the spectrum of male and female speakers, though the speaker-specific Bark/Mel scale factors are obtained by adjusting the Bark/Mel scale, instead of warping the spectrum as in the frequency warping method. This illustrates the correctness of the speaker-specific Bark/Mel scale VTLN.
4.5 Results of Bark/Mel scale warping VTLN
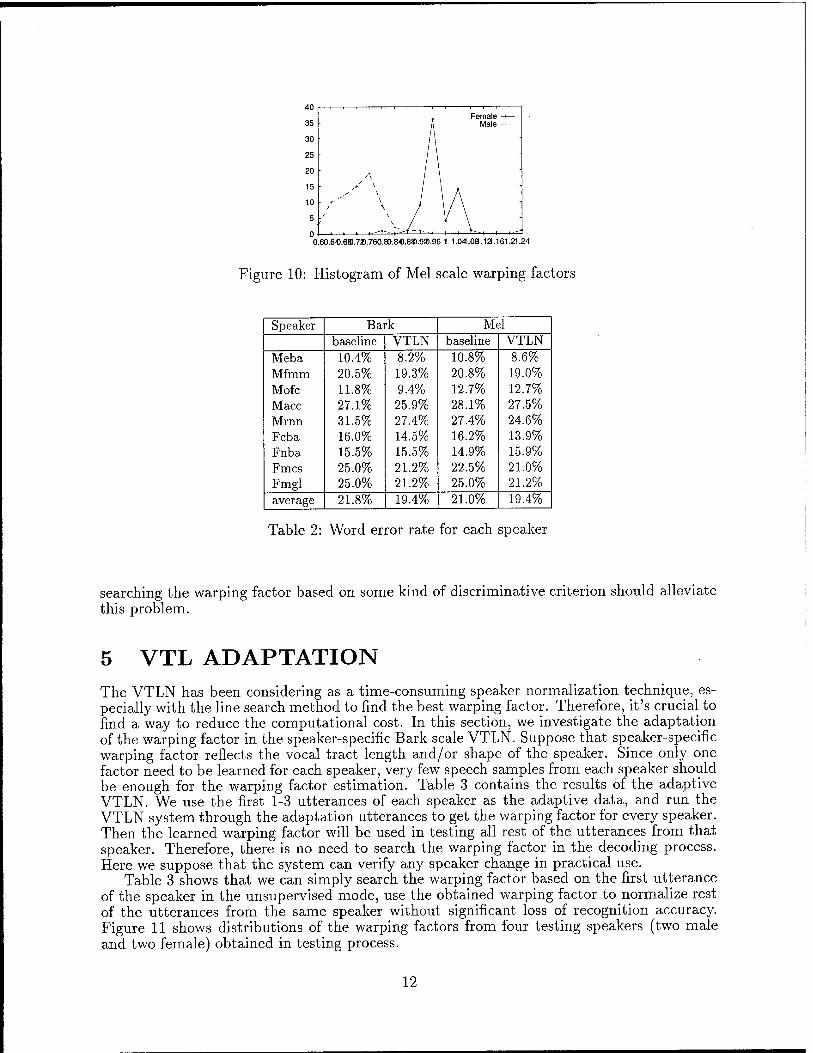
Table 2 is the summary of the testing results for the speaker-specific Bark/Mel scale VTLN. The results were obtained in the push-to-talk test set.
Table 2 shows that both speaker-specific Bark and Mel scale VTLN reach the same word error rate, though the baseline performance of the MFCC front-end system is slightly better than that of the PLPCC front-end system. The speaker-specific Bark/Mel scale VTLN is an effective approach because of the simplicity, though the performance is only slightly better than that of the frequency warping VTLN,
From Table 1 and Table 2 we can see that the improvement is quite different among the testing speakers, the word error reduction vary from 30% to - 6% from speaker to speaker, and this variation seems independent to the baseline word error rate of each speaker. We think that the reason is because the warping factors are searched based on the ML criterion. Since the ML criterion can only guarantee that the searched warping factor is the best one in the sense of increasing the matching score of the warped speech feature with the appeared acoustic models. But the warped speech feature may get much better matching score with the other acoustic models which do not appear at the transcription (equation (9) in the training procedure) or the hypothesis (equation (13) in the decoding procedure). Therefore,
searching the warping factor based on some kind of discriminative criterion should alleviate this problem.
5 VTL ADAPTATION The VTLN has been considering as a time-consuming speaker normalization technique, es- pecially with the line search method to find the best warping factor. Therefore, it's crucial to find a way to reduce the computational cost. In this section, we investigate the adaptation of the warping factor in the speaker-specific Bark scale VTLN. Suppose that speaker-specific warping factor reflects the vocal tract length and/or shape of the speaker. Since only one factor need to be learned for each speaker, very few speech samples from each speaker should be enough for the warping factor estimation. Table 3 contains the results of the adaptive VTLN. We use the first 1-3 utterances of each speaker as the adaptive data, and run the VTLN system through the adaptation utterances to get the warping factor for every speaker. Then the learned warping factor will be used in testing all rest of the utterances from that speaker. Therefore, there is no need to search the warping factor in the decoding process. Here we suppose that the system can verify any speaker change in practical use.
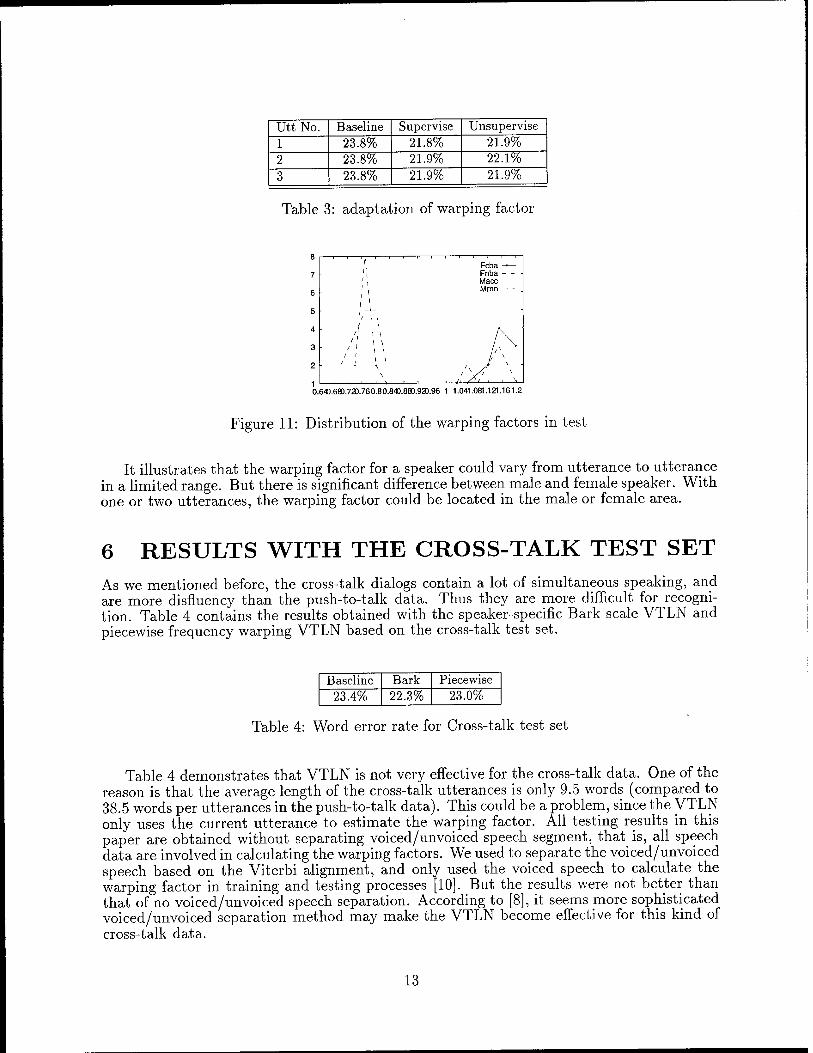
Table 3 shows that we can simply search the warping factor based on the first utterance of the speaker in the unsupervised mode, use the obtained warping factor to normalize rest of the utterances from the same speaker without significant loss of recognition accuracy. Figure 11 shows distributions of the warping factors from four testing speakers (two male and two female) obtained in testing process.
Figure 11: Distribution of the warping factors in test
It illustrates that the warping factor for a speaker could vary from utterance to utterance in a limited range. But there is significant difference between male and female speaker. With one or two utterances, the warping factor could be located in the male or female area.
6 RESULTS WITH THE CROSS-TALK TEST SET As we mentioned before, the cross-talk dialogs contain a lot of simultaneous speaking, and are more disfluency than the push-to-talk data. Thus they are more difficult for recogni- tion. Table 4 contains the results obtained with the speaker-specific Bark scale VTLN and piecewise frequency warping VTLN based on the cross-talk test set.
Baseline Bark Piecewise 23.4% 22.3% 23.0%
Table 4: Word error rate for Cross-talk test set
Table 4 demonstrates that VTLN is not very effective for the cross-talk data. One of the reason is that the average length of the cross-talk utterances is only 9.5 words (compared to 38.5 words per utterances in the push-to-talk data). This could be a problem, since the VTLN only uses the current utterance to estimate the warping factor. All testing results in this paper are obtained without separating voiced/unvoiced speech segment, thatis, all speech data are involved in calculating the warping factors. We used to separate the voiced/unvoiced speech based on the Viterbi alignment, and only used the voiced speech to calculate the warping factor in training and testing processes [10]. But the results were not better than that of no voiced/unvoiced speech separation. According to [8], it seems more sophisticated voiced/unvoiced separation method may make the VTLN become effective for this kind of cross-talk data.
13
7 VTLN AND GENDER-DEPENDENT SYSTEMS In this section, we will show that the gender-independent (GI) VTLN system is better than the gender-dependent (GD) system. The speaker-specific Bark scale VTLN is used in this experiment. The results are obtained from the push-to-talk test set.
GI GD GI-VTLN GD-VTLN 21.8% 20.8% 19.6% 19.0%
Table 5: GI and GD vs VTLN system
Note that, in the GI-VTLN test, we calculate the average male/female warping factors in the training set, and offer them to the male/female speakers in the test set, so that there is no need to search the warping factors during testing (suppose the system can detect gender). This is equivalent to the gender-dependent system, except the acoustic models are trained with the VTL normalized speech feature, instead of gender-dependent speech data. Table 5 shows that such kind of VTLN test is much better than that of the real GD system. Moreover, the real GD-VTLN system does not present significant improvement compared to the GI-VTLN system. These results illustrate that the VTLN mainly alleviate the VTL difference between male and female speaker. With the same gender speakers, since their VTL differences may be very small, the algorithm for the warping factor calculation and normalization should have high frequency resolution.
8 RESULTS BASED ON ENGLISH DATABASE In this section, we present the testing result of the speaker-specific Bark scale VTLN and its adaptation based on our English Spontaneous Scheduling Task (ESST) database. Compared to the SSST database, the ESST database is much bigger (contains about 30 hours speech data). The evaluation set contains 612 utterances recorded from 13 speakers (5 female and 8 male speakers). The vocabulary contains 3200 words, and the out of vocabulary rate is 0.68%. The language model is also the class based trigram language model.
Baseline Bark-VTLN Adaptation 23% 20.2% 20.3%
Table 6: Word error rate for ESST test set
Table 6 contains the word error rates obtained from the baseline system (the GI system), the speaker-specific Bark VTLN system, and the unsupervised VTLN adaptation (only using the first utterance of each speaker to search the warping factor during test). It shows that the VTLN is as effective as for the SSST database, and the unsupervised adaptation based on one utterance is very efficient for learning the warping factor.
9 CONCLUSION In this paper, we address the methods of vocal tract length normalization and adaptation for large vocabulary continuous speech recognition. We explored the bilinear warping VTLN
14
based on the frequency warping method, the speaker-specific Bark/Mel scale VTLN which warps the spectrum in Bark/Mel domain. The experimental results show the speaker-specific Bark/Mel scale VTLN is very simple and effective. We obtained 12% word error reduction with it. We also investigated the adaptation of the warping factor in order to reduce the computational cost in decoding process of the VTLN system. The results show that the VTLN is still very effective with only one utterance from each speaker to estimate the warping factor. We presented the results obtained from the cross-talk data and ESST database to demonstrate the effectiveness of our VTLN method, and the results obtained from VTLN system and gender-dependent system to illustrate that the VTLN system is better than the gender-dependent system, though the fixed warping factors were used for the VTLN system. Our results also show that the current VTLN basically alleviate the VTL differences between different gender speakers.
10 ACKNOWLEDGMENTS The work reported in this paper was funded in part by grants from the US Department of Defense. The author wish to thank the JANUS developers at the Interactive Systems Laboratories of University of Karlsruhe and Carnegie Mellon University for providing the JANUS system, especially Martin Westphal in University of Karlsruhe for developing the line search method for our system.
References [1] Christine Tuerk and Tony Robinson. A new frequency shift function for reducing inter-
speaker variance. EuroSpeech-93, 1:351-354, 1993.
[2] F. Nolan. The phonetic bases of speech recognition. Cambridge University Press, 1983.
[3] H. Wakita. Normalization of vowels by vocal-tract length and its application to vowel identification. IEEE Trans. ASSP,, 25:183-192, 1977.
[4] Yoshio Ono, Hisashi Wakita, and Yunxin Zhao. Speaker normalization using constrained spectra shifts in auditory filter domain. EuroSpeech-93, 1:355-358, 1993.
[5] T. Kamm, G. Andreou, and J. Cohen. Vocal tract normalization in speech recognition compensating for systematic speaker variability. Proc. of the 15th Annual speech research symposium, CLSP, Johns Hopkins University, Baltimore, MD, pages 175-178, 1995.
[6] Li Lee and Richard C. Rose. Speaker normalization using efficient frequency warping procedures. ICASSP-96, 1:353-356, 1996.
[7] Ellen Eide and Herbert Gish. A parametric approach to vocal tract length normalization. ICASSP-96, 1:346-348, 1996.
[8] Steven Wegmann, Don McAllaster, Jeremy Orloff, and Barbara Peskin. Speaker nor- malization on conversational telephone speech. ICASSP-96, 1:339-341, 1996.
[9] Fant G. Speech sounds and features. 1973.
[10] Puming Zhan and Martin Westphal. Speaker normalization based on frequency warping. ICASSP-97, Munich, Germany, 1997.
15
[11] Charles. R Jankowski Jr., Hoang-Doan H. Vo, and Richard P. Lippmann. A comparison of signal processing front ends for automatic word recognition. IEEE transactions on Speech and Audio Processing, 3:286-293, 1995.
[12] Steven B. Davis and Paul Mermelstein. Comparison of parametric representations for monosyllabic word recognition in continuously spoken sentences. IEEE transactions on Acoustics, Speech, and Signal Processing, 28:357-366, 1980.
[13] Joseph W. Picone. Signal modeling techniques in speech recognition. Proceedings of the IEEE, Vol. 81, No. 9, pages 1215-1247, 1993.
[14] Hynek Hermansky. Perceptual linear predictive (pip) analysis of speech. J. Acoust. Soc. Am. 87(4), Pages 1738-1752, 1990.
[15] Hynek Hermansky, Nelson Morgan, Aruna Bayya, and Phil Kohn. Rasta-plp speech analysis technique. ICASSP-92, pages 1-121-124, 1992.
[16] Alex Waibel and Yegnanarayana. Mel scale fiter banks. ATR TR-I-0006, 1981.
[17] Alan V. Oppenheim. Discrete representation of signals. Proceedings of the IEEE, Vol. 60, No. 6, pages 681-691, 1972.
[18] Micheal Finke, Petra Geutner, Hermann Hild, Thomas Kemp, Klaus Ries, Martin West- phal, and Alex Waibel. The karlsruhe-verbmobile speech recognition engine. ICASSP- 97, Munich, Germany, 1997.
[19] Torsten Zeppenfeld, Micheal Finke, Klaus Ries, Martin Westphal, and Alex Waibel. Recognition of conversational telephone speech using the janus speech engine. ICASSP- 97, Munich, Germany, 1997.
[20] E. Zwicker and E. Terhardt. Analytical expressions for critical-band rate and critical bandwidth as a function of frequency. J. Acoust. Soc. Am. 68(5), pages 1523-1525, 1980.
[21] D. O'Shaughnessy. Speech communication: Human and machine. 1987.
[22] Puming Zhan, Klaus Ries, Marsal Gavalda, Donna Gates, Alon Lavie, and Alex Waibe. Janus-ii: Towards spontaneous Spanish speech recognition. ICSLP-96, 1996.