REPORT DOCUMENTATION PAGE Form Approved OMB No. 0704-0188 Public reporting burden for this collection of information is estimated to average 1 hour per response, including the time for reviewing instructions, searching existing data sources, gathering and maintaining the data needed, and completing and reviewing the collection of information. Send comments regarding this burden estimate or any other aspect of this collection of information, including suggestions for reducing this burden, to Washington Headquarters Services, Directorate for Information Operations and Reports, 1215 Jefferson Davis Highway, Suite 1204, Arlington, VA 22202-4302, and to the Office of Management and Budget, Paperwork Reduction Project (0704-0188), Washington, DC 20503. 2. REPORT DATE | 3. REPORT TYPE AND DATES COVERED 1. AGENCY USE ONLY (Leave blank) 10.Jun.02 DISSERTATION 4. TITLE AND SUBTITLE THE EFFECTS OF RESISTANCE TRAINING ON GOLF PERFORMANCE AND PHYSIOLOGICAL STRESS RESPONSE DURING COMPETITION IN INTERCOLLEGIATE GOLFERS 6. AUTHOR(S) CAPT DOAN BRANDON K 5. FUNDING NUMBERS 7. PERFORMING ORGANIZATION NAME(S) AND ADDRESS(ES) BALL STATE UNIVERSITY PERFORMING ORGANIZATION REPORT NUMBER CI02-76 9. SPONSORING/MONITORING AGENCY NAME(S) AND ADDRESS(ES) THE DEPARTMENT OF THE AIR FORCE AFIT/CIA, BLDG 125 2950 P STREET WPAFB OH 45433 10. SPONSORING/MONITORING AGENCY REPORT NUMBER 11. SUPPLEMENTARY NOTES 12a. DISTRIBUTION AVAILABILITY STATEMENT Unlimited distribution In Accordance With AFI 35-205/AFIT Sup 1 12b. DISTRIBUTION CODE 13. ABSTRACT (Maximum 200 words) 20020702 030 14. SUBJECT TERMS 15. NUMBER OF PAGES 186 16. PRICE CODE 17. SECURITY CLASSIFICATION OF REPORT 18. SECURITY CLASSIFICATION OF THIS PAGE 19. SECURITY CLASSIFICATION OF ABSTRACT 20. LIMITATION OF ABSTRACT Standard Form 298 (Rev. 2-89) (EG) Prescribed by ANSI Std. 239.18 ,«t. " Designed using Perform Pro, WHS/DIO-BrGct 94 jam
Transcript
REPORT DOCUMENTATION PAGE Form Approved OMB No. 0704-0188
Public reporting burden for this collection of information is estimated to average 1 hour per response, including the time for reviewing instructions, searching existing data sources, gathering and maintaining the data needed, and completing and reviewing the collection of information. Send comments regarding this burden estimate or any other aspect of this collection of information, including suggestions for reducing this burden, to Washington Headquarters Services, Directorate for Information Operations and Reports, 1215 Jefferson Davis Highway, Suite 1204, Arlington, VA 22202-4302, and to the Office of Management and Budget, Paperwork Reduction Project (0704-0188), Washington, DC 20503.
2. REPORT DATE | 3. REPORT TYPE AND DATES COVERED 1. AGENCY USE ONLY (Leave blank)
10.Jun.02 DISSERTATION 4. TITLE AND SUBTITLE
THE EFFECTS OF RESISTANCE TRAINING ON GOLF PERFORMANCE AND PHYSIOLOGICAL STRESS RESPONSE DURING COMPETITION IN INTERCOLLEGIATE GOLFERS 6. AUTHOR(S)
CAPT DO AN BRANDON K
5. FUNDING NUMBERS
7. PERFORMING ORGANIZATION NAME(S) AND ADDRESS(ES)
BALL STATE UNIVERSITY PERFORMING ORGANIZATION REPORT NUMBER
CI02-76
9. SPONSORING/MONITORING AGENCY NAME(S) AND ADDRESS(ES)
THE DEPARTMENT OF THE AIR FORCE AFIT/CIA, BLDG 125 2950 P STREET WPAFB OH 45433
10. SPONSORING/MONITORING AGENCY REPORT NUMBER
11. SUPPLEMENTARY NOTES
12a. DISTRIBUTION AVAILABILITY STATEMENT
Unlimited distribution In Accordance With AFI 35-205/AFIT Sup 1
12b. DISTRIBUTION CODE
13. ABSTRACT (Maximum 200 words)
20020702 030 14. SUBJECT TERMS 15. NUMBER OF PAGES
186 16. PRICE CODE
17. SECURITY CLASSIFICATION OF REPORT
18. SECURITY CLASSIFICATION OF THIS PAGE
19. SECURITY CLASSIFICATION OF ABSTRACT
20. LIMITATION OF ABSTRACT
Standard Form 298 (Rev. 2-89) (EG) Prescribed by ANSI Std. 239.18 ,«t. " Designed using Perform Pro, WHS/DIO-BrGct 94
jam
EFFECTS OF RESISTANCE TRAINING ON GOLF PERFORMANCE AND PHYSIOLOGICAL STRESS
RESPONSE DURING COMPETITION IN INTERCOLLEGIATE GOLFERS
A DISSERTATION SUBMITTED TO THE GRADUATE SCHOOL IN PARTIAL FULFILLMENT OF THE REQUIREMENTS
FOR THE DEGREE
DOCTOR OF PHILOSOPHY BY
BRANDON K. DOAN
APPROVER BY:/
t^t
Committee Chairperson
Mill A \/^ Committee Member!
(Committee Member
Date
f/g/ Q.0&2,
4H te' / 7<X1-
Date
Date /
Date
Y/2, Zot>^
BALL STATE UNIVERSITY MUNCIE,IN MAY, 2002
THE EFFECTS OF RESISTANCE TRAINING ON GOLF PERFORMANCE AND
PHYSIOLOGICAL STRESS RESPONSE DURING COMPETITION IN
INTERCOLLEGIATE GOLFERS
A DISSERTATION SUBMITTED TO THE GRADUATE SCHOOL
IN PARTIAL FULFILLMENT OF THE REQUIREMENTS
FOR THE DEGREE
DOCTOR OF PHILOSOPHY
BY
BRANDON K. DO AN
ADVISOR: DR. ROBERT NEWTON
BALL STATE UNIVERSITY
MUNCTE,IN
MAY, 2002
DECLARATION
The work presented in this Dissertation is, to the best of my knowledge and belief, original, except as acknowledged in the text, and the material has not been submitted, either in whole or in part, for a degree at this or any other university.
Brandon K. Doan
The views expressed in this article are those of the author and do not reflect the official policy or position of the United States Air Force, Department of Defense, or the U. S. Government.
ABSTRACT
Two investigations were conducted with collegiate golfers for separate, but related
purposes. 1) To investigate the effects of a physical conditioning program (strength,
power and flexibility training) on clubhead speed, consistency, and putting distance
control. 2) To investigate the effects of 36 continuous holes of competitive golf on
testosterone and cortisol response and their relation to performance.
Study #1: Subjects were ten men and six women NCAA Division I golfers. Supervised
strength, power, and flexibility training was performed 3 times per week for 11 weeks.
testosterone-to-cortisol ratio difference and 36-hole score (r = 0.82), CSAI-2 somatic
anxiety and pre-round cortisol (r = 0. 81), testosterone (r = -0.80), and testosterone-to-
cortisol ratio (r = -0.72). These results indicate a significant hormonal strain during 10
hours of competitive golf, low T/C ratio relation with low golf scores, and CSAI-2
relation with endocrine measures.
Vll
TABLE OF CONTENTS
DECLARATION ii ACKNOWLEDGEMENTS iii DEDICATION iv ABSTRACT v TABLE OF CONTENTS vii LIST OF TABLES xi LIST OF FIGURES xii LIST OF ABBREVIATIONS AND NOMENCLATURE xiv LIST OF ABBREVIATIONS AND NOMENCLATURE xiv
Chapter 1 15
INTRODUCTION 15 Significance of the Study 22 Hypotheses 23
Chapter 2 25
REVIEW OF LITERATURE 25 Introduction 25 Golf and Physical Conditioning 26 Golf Swing Movement Analysis 33
Basic Biomechanical Description of the Golf Swing 33 Strength, Power, and Flexibility Definitions 34 EMG Verification of Muscles Fired in the Golf Swing 34 What are the energy sources that need to be trained for golf? 41 What type of muscle action should be used when training for golf? 42 What are the primary sites of injury for golfers? 42
Prevention of Golf-Related Injuries 45 Acute Program Variables 46 Chronic Changes 46 Anatomical Constraints 47 Flexibility Training 47 Ballistic and Plyometric Training 48
Qualitative Analysis of the Golf Swing 48
Vlll
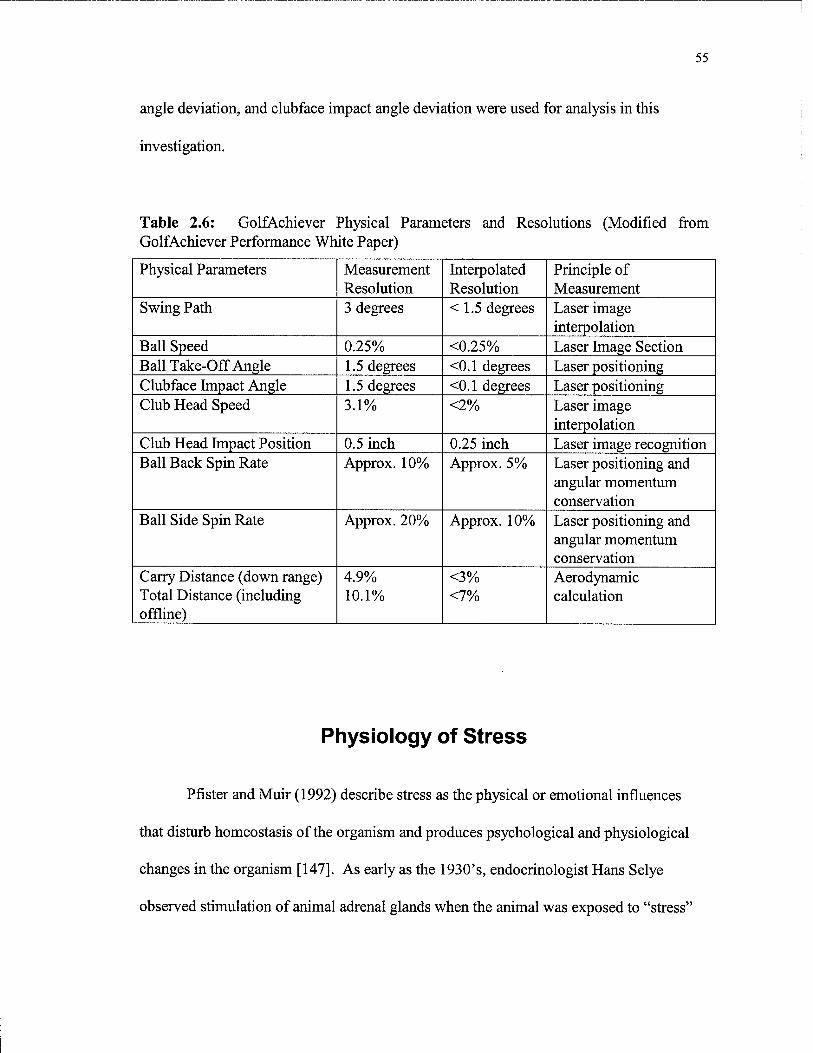
Essential Biomechanical Elements of Golf Swings 51 Measurement of Golf Ball Launch Conditions (GolfAchiever®) 54 Physiology of Stress 55
Alarm Reaction to Stressor 56 Resistance Reaction to Stressor 57 Testosterone 59
Testosterone-to-Cortisol (T/C) Ratio 61 Convenience and Reliability of Salivary Cortisol and Testosterone 62 Cortisol, Testosterone, and Athletic Competition 63
Golf and Stress Response 65 Sport Competition Anxiety 68 Conclusions and Implications from the Literature Review 71
Chapter 3 73
Study #1: The Effects of Strength, Power, and Flexibility Training on Golf Performance in Competitive Intercollegiate Men and Women Golfers 73
Abstract .75 Introduction 77 Methods 81
Subjects 81 Experimental design 82 Training Protocols 82
Medicine Ball Training 87 Testing Protocols 88
1-RM Strength Testing 88 Grip strength 89 Rotational Power 89 Qualitative Video Analyses 91 Golf Ball Launch Conditions 92 Putting distance control tests 93
Statistical Analyses 94 Results 94
Strength Testing 97 Rotational Power 97 Flexibility Testing 98 Qualitative Video Analysis 99 Golf Ball Launch Conditions 100 Putting distance control test 101 Correlations Between Measures 102
Discussion 102 Clubhead Speed 102 Consistency 107 Qualitative Video Analysis 108 Putting Distance Control 108
IX
Correlations Between Measures 109 Other possible contributions of physical conditioning to golf performance 110 Conclusion Ill
Chapter 4 112
Salivary Cortisol, Testosterone, and T/C Ratio Responses During a 36-hole Golf Competition 112
Abstract 114 Introduction 116 Methods 122
Subjects 122 Data Collection Procedures 123 Biochemical Analysis 126 Competitive State Anxiety 126 Data Analysis 127
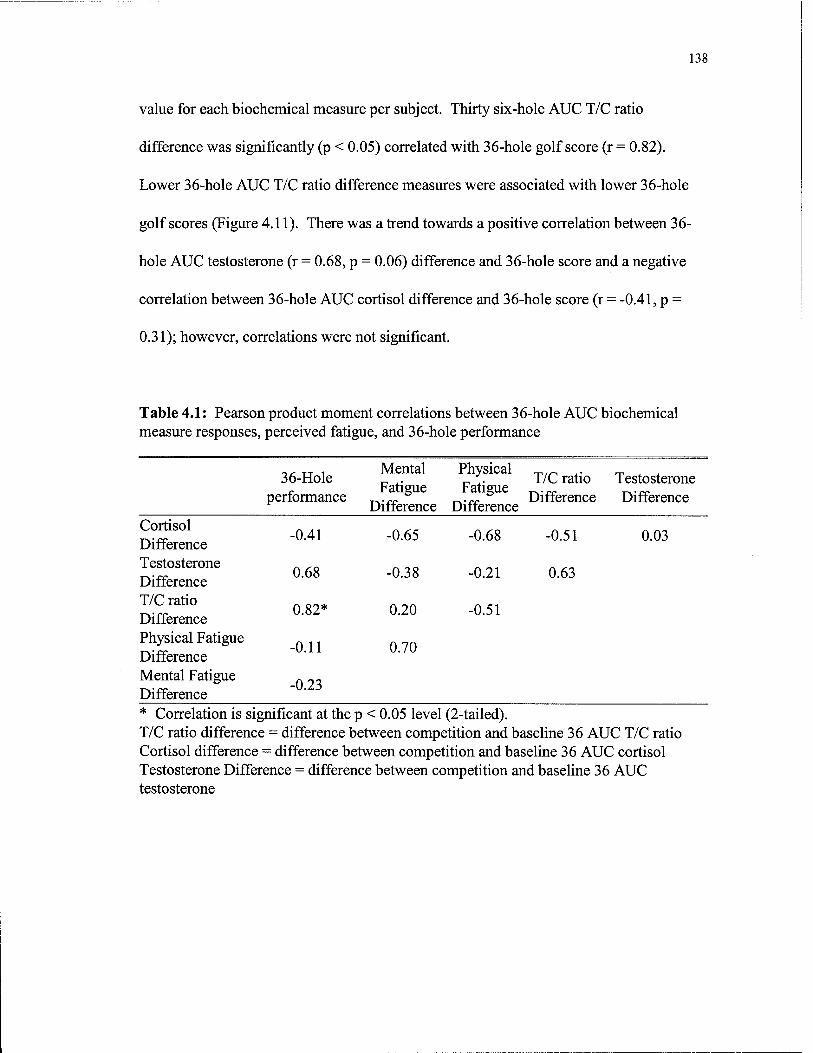
Correlations During Competition 137 Pre-round Correlations 139
Discussion 141 Salivary Cortisol and Testosterone Response During Competition 142 Pre-competition Salivary Cortisol and Testosterone Response 143 Salivary T/C Ratio 145 Mental and Physical Fatigue 146 Correlations Among Measures 147
Correlations During Competition 147 Pre-round Correlations 148
Conclusion 149
Chapter 5 150
Summary, Conclusions, and Recommendations for Future Research 150 Study #1: The Effects of Strength, Power, and Flexibility Training on Golf Performance in Competitive Intercollegiate Men and Women Golfers 151
Summary 151 Hypotheses 151 Following strength, power and flexibility training: 151
Conclusions 153 Recommendations for Future Study 153
Study #2: Salivary Cortisol, Testosterone, and T/C Ratio Responses During a
L
36-hole Golf Competition 155 Summary 155
Hypotheses 155 Conclusion 157 Recommendations for Future Study 157
References 159
Appendix A 173
INFORMED CONSENT FORM FOR STUDY #1: THE EFFECTS OF RESISTANCE TRAINING ON GOLF PERFORMANCE IN COMPETETITIVE INTERCOLLEGIATE MEN AND WOMEN GOLFERS 173
Appendix B 178
INFORMED CONSENT FORM FOR STUDY #2: PHYSIOLOGICAL STRESS RESPONSE DURING COMPETITIVE GOLF 178
AppendixC 183
COMPETITIVE STATE ANXIETY INVENTORY-2 (CSAI-2) 183
Appendix D 185
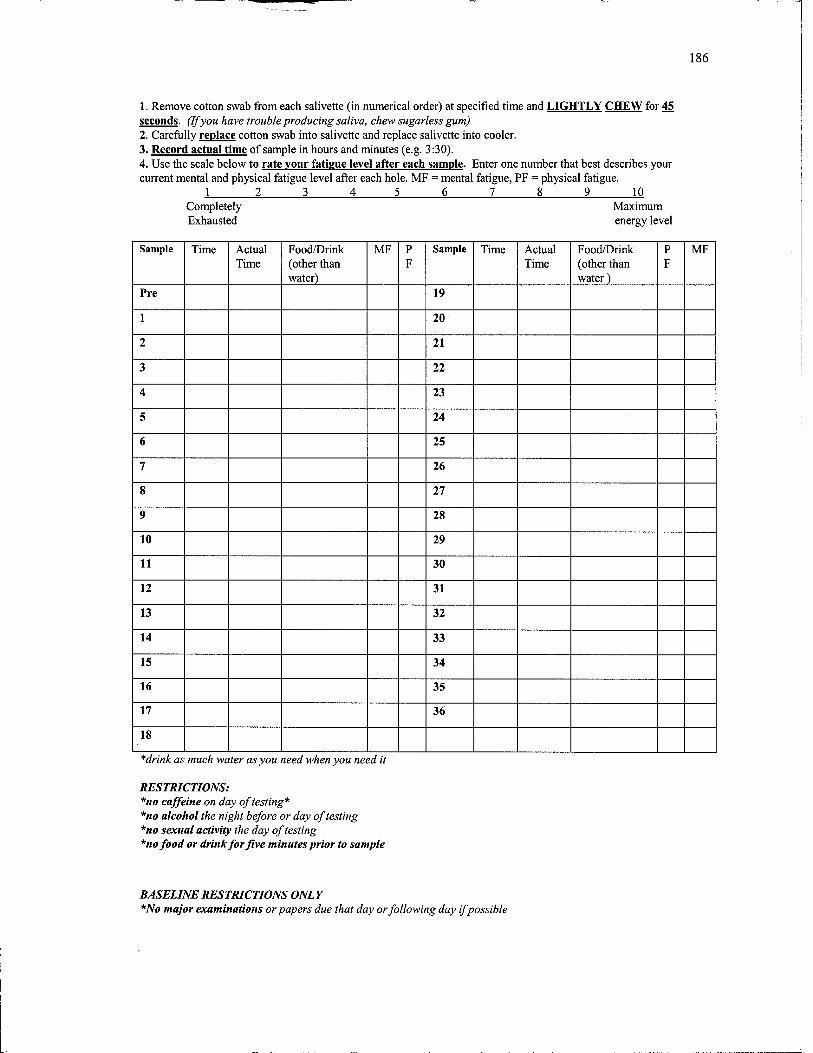
SALP/A COLLECTION, FATIGUE SURVEY, AND FOOD/BEVERAGE CONSUMPTION FORM 185
XI
LIST OF TABLES
Table 2.1: Summary of Previous Research -The Effects of Physical Conditioning on Golf Performance 32
Table 2.2: Muscles Used in the Golf Swing (Backswing) 38
Table 2.3: Muscles Used in the Golf Swing (Forward Swing) 39
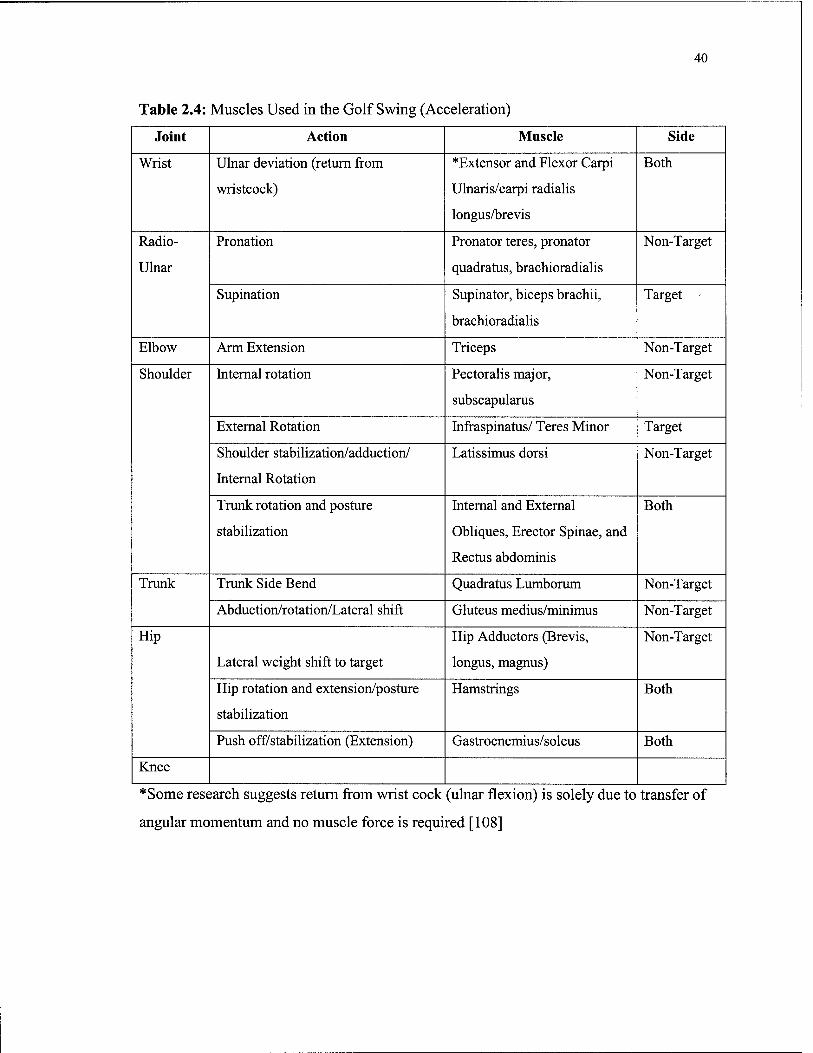
Table 2.4: Muscles Used in the Golf Swing (Acceleration) 40
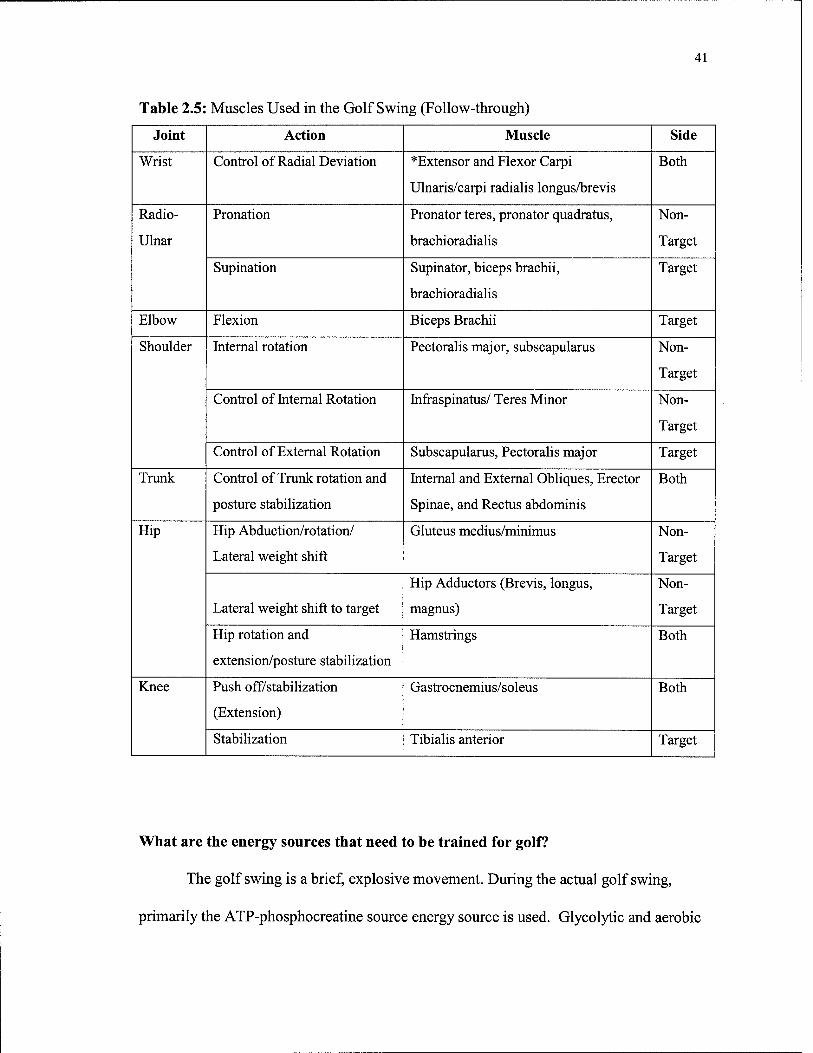
Table 2.5: Muscles Used in the Golf Swing (Follow-through) 41
Table 2.6: GolfAchiever Physical Parameters and Resolutions (Modified from GolfAchiever Performance White Paper) 55
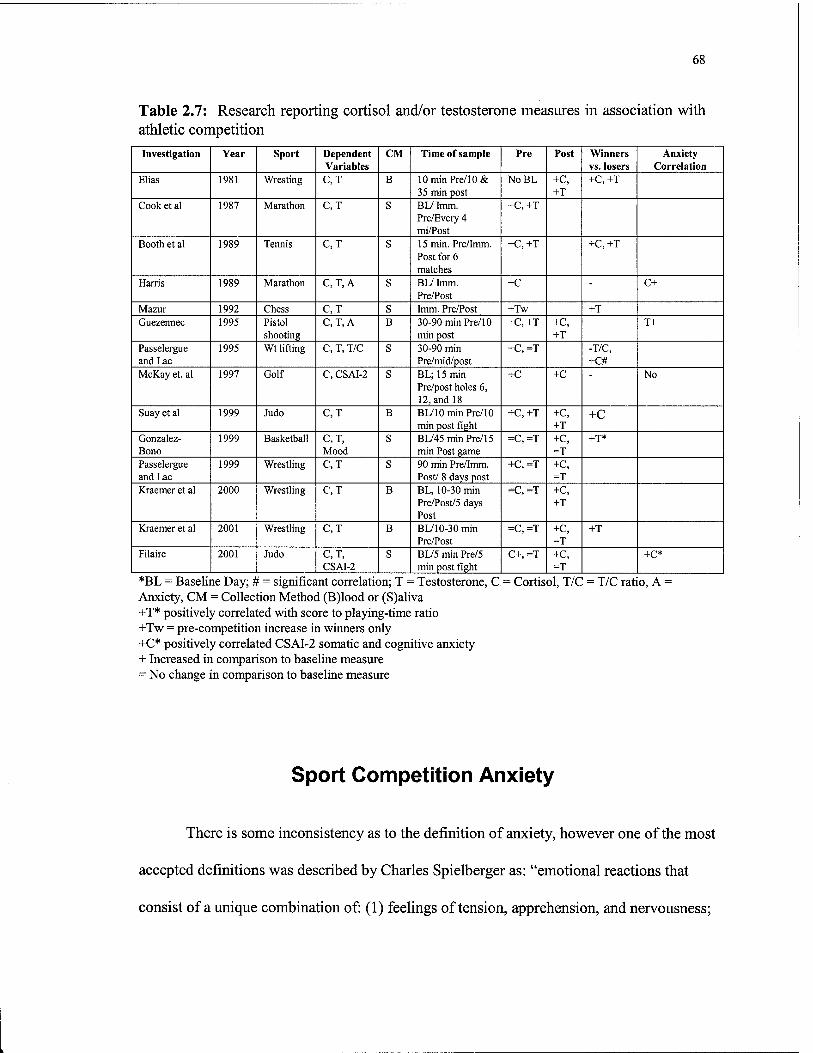
Table 2.7: Research reporting cortisol and/or testosterone measures in association with athletic competition 68
Table 3.1: Strength Study Subject Demographics (values are mean and S.D.) 81
Table 3.2: Flexibility program (adapted from Jobe et al., 1994) 83
Table 3.3: Pre-season strength and conditioning program 85
Table 3.4: Trunk Strengthening program 86
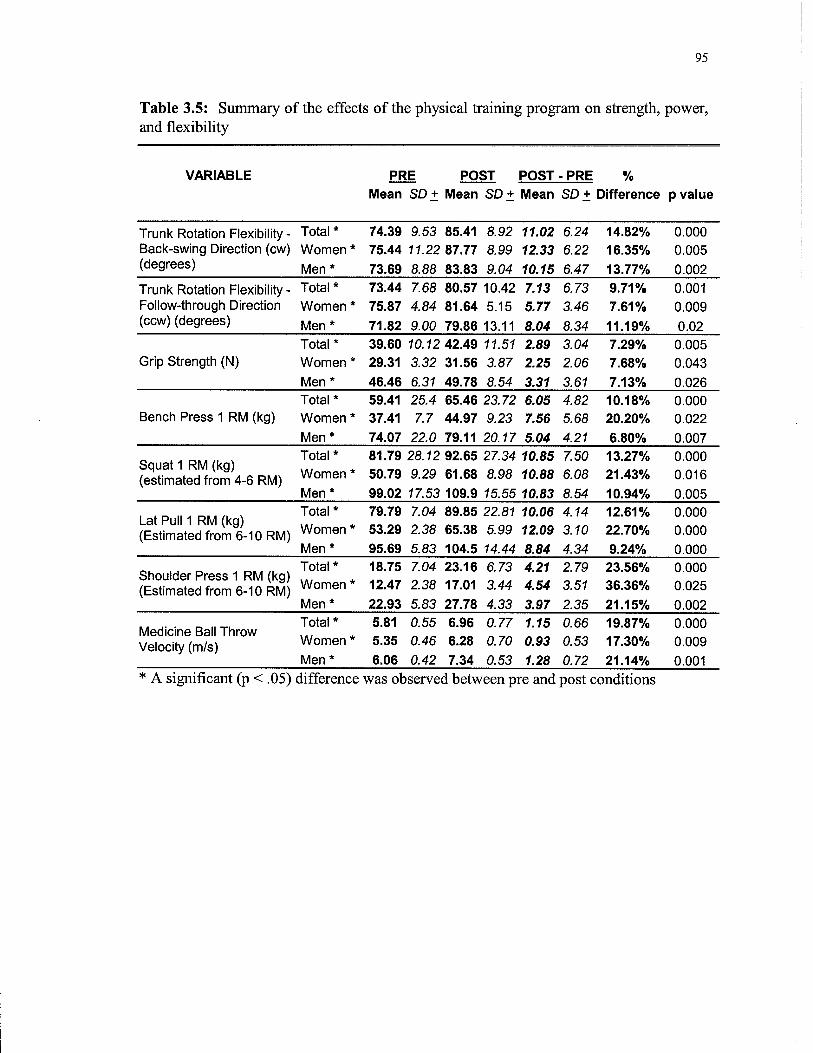
Table 3.5: Summary of the effects of the physical training program on strength, power, and flexibility 95
Table 3.6: Summary of the effects of the physical training program on golf performance 96
Xll
LIST OF FIGURES
Figure 1.1: Golf Performance Factors 17
Figure 2.1: Golf Swing Phases 37
Figure 2.2: Qualitative Analysis Model for a Golf Shot (modified from figure 11- 3[60] and figure 1[25]) 50
Figure 3.1: Medicine ball rotational put test 90
Figure 3.2: Trunk rotation flexibility test 91
Figure 3.3: GolfAchiever 93
Figure 3.4: Putting Distance Control Test 93
Figure 3.5: Strength measures for pre and post-training. Values are means (± S.E.) 97
Figure 3.6: Rotational power (medicine ball put release velocity) means (± S.E.) for pre- and post-training 98
Figure 3.7: Trunk flexibility means (± S.E.) for pre and post-training 99
Figure 3.8: Clubhead speed means (± S .E.) for pre and post-training 100
Figure 3.9: Launch and face angle deviation means (± S.E.) for pre- and post- training 101
Figure 3.10: Putting distance control means (+ S.E.) for pre and post-training 102
Figure 4.1: Saliva sampling procedure 123
Figure 4.3: Salivary cortisol area under the curve (AUC) measures for a baseline and competition. Values are means (± S.E.) 130
Figure 4.4: Salivary cortisol measures for baseline and competition. Values are means (± S.E.) 131
Figure 4.5: Salivary testosterone area under the curve (AUC) measures for baseline and competition. Values are means (± S.E.) 132
xm
Figure 4.6: Salivary testosterone measures for baseline and competition. Values are means (± S.E.) 133
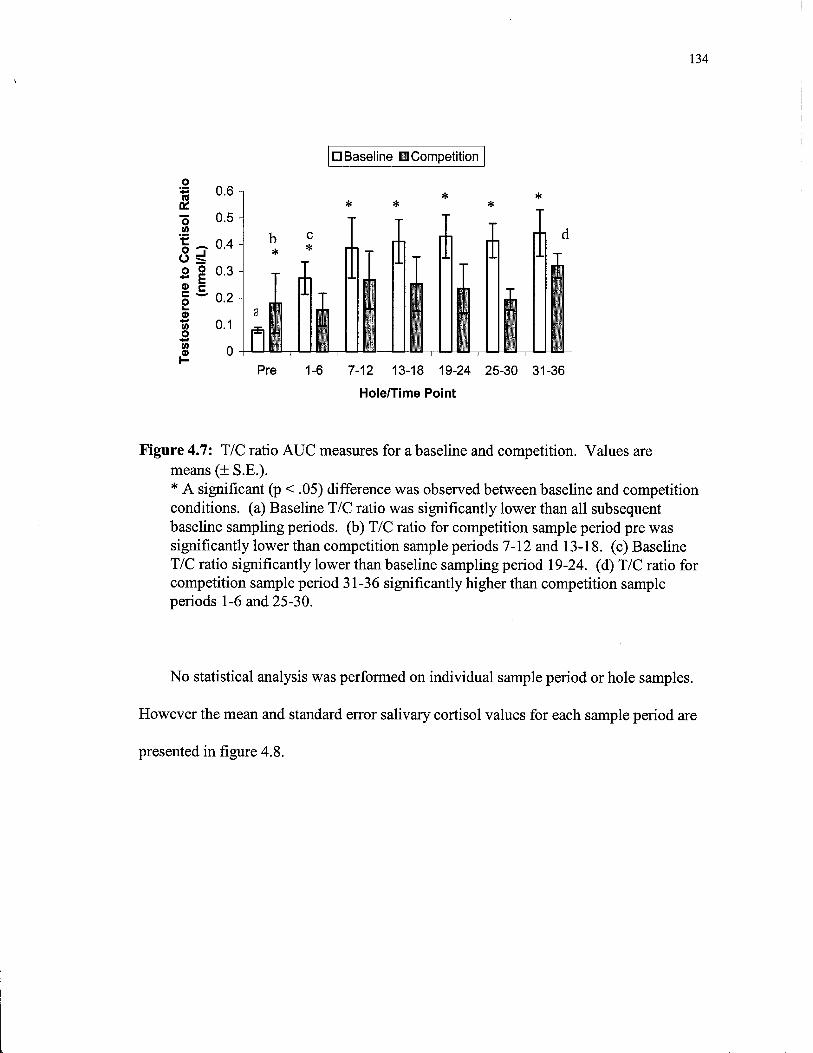
Figure 4.7: T/C ratio AUC measures for a baseline and competition. Values are means (±S.E.) 134
Figure 4.8: Salivary T/C ratio measures for baseline and competition. Values are means (±S.E.) 135
Figure 4.9: Physical fatigue AUC measures for baseline and competition 136
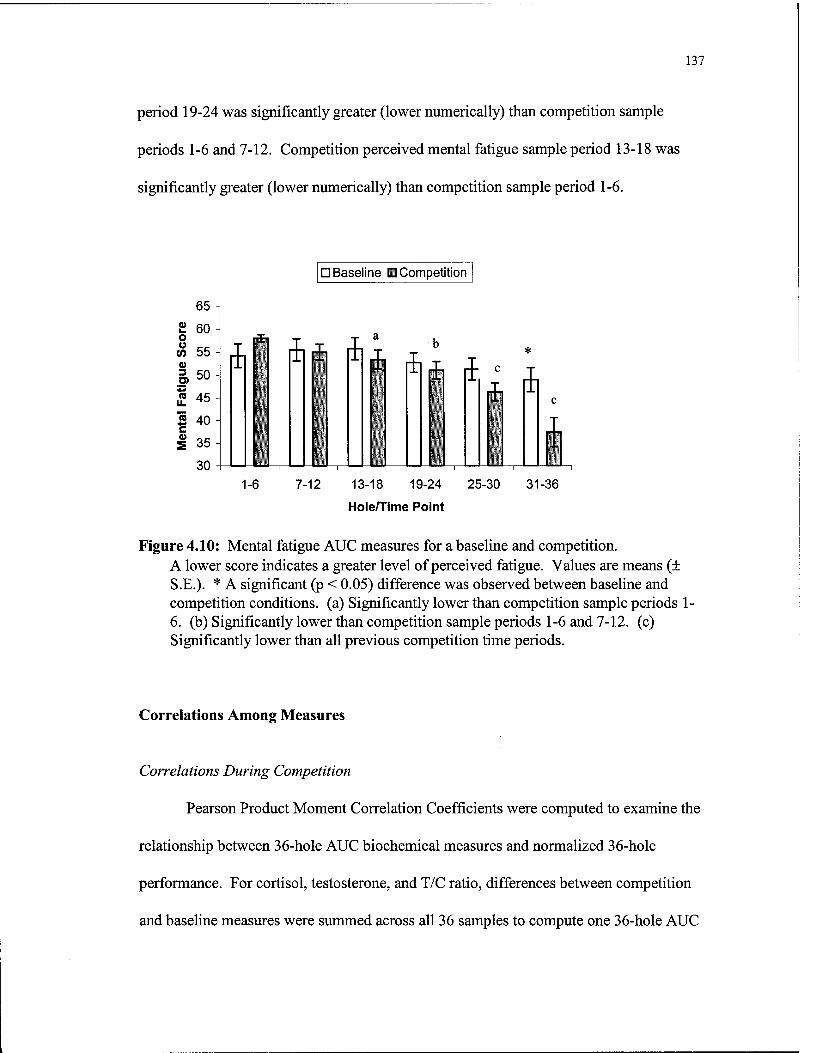
Figure 4.10: Mental fatigue AUC measures for a baseline and competition 137
Figure 4.11: Net 36-hole score plotted against 36-hole AUC T/C ratio difference (competition minus baseline) 139
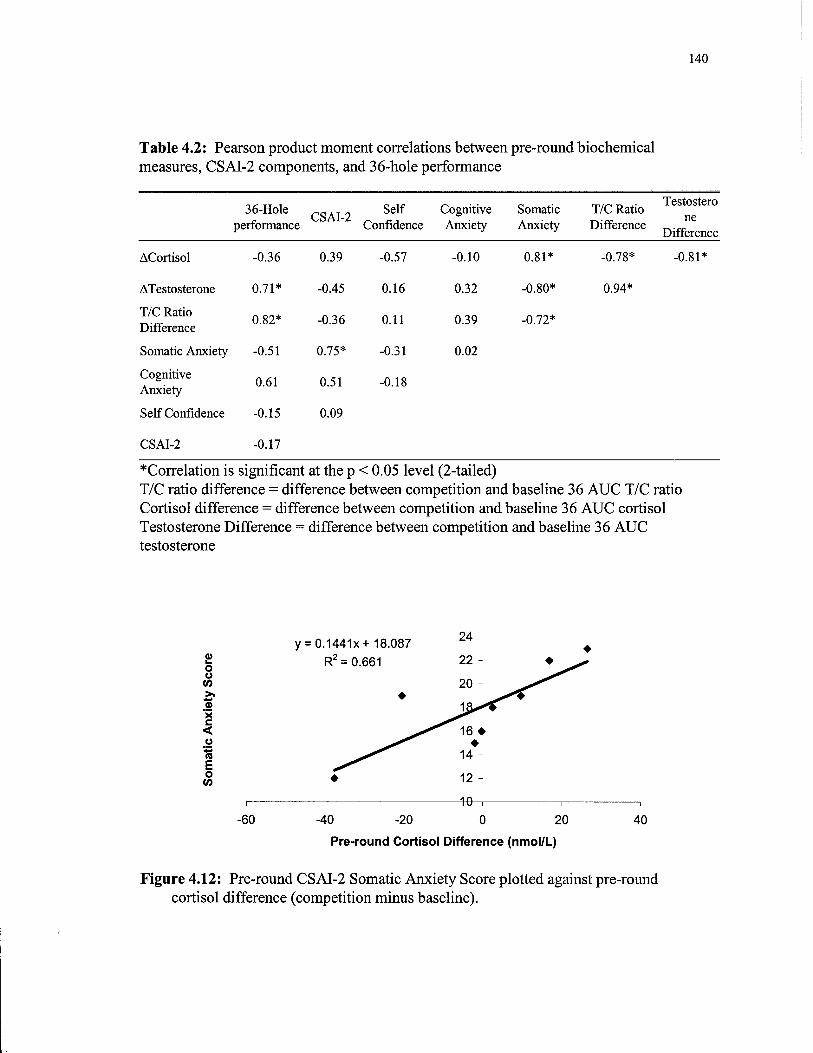
Figure 4.12: Pre-round CSAI-2 Somatic Anxiety Score plotted against pre-round cortisol difference (competition minus baseline) 140
XIV
LIST OF ABBREVIATIONS AND
NOMENCLATURE
A UC - Area Under the Curve
CRH- Corticotropin-Releasing Hormone
CSAI-2 - Competitive State Anxiety Inventory 2
EMG - Electromyography
FSH- Follicle-Stimulating Hormone
GAS - General Adaptation Syndrome
GnKH. - Gonadotropin-Releasing Hormone
HPAA - Hypothalamic-Pituitary-Adrenal Axis
LH - Luteinizing Hormone
NCAA - National Collegiate Athletic Association
RM- Repetition Maximum
SHBG - Sex-Hormone-Binding Globulin
T/C Ratio - Testosterone-to-Cortisol Ratio
Chapter 1
INTRODUCTION
Golf is a popular and rapidly growing sport. According to recent surveys, there
are approximately 26.4 million golfers in the United States and golf is ranked 10th in total
participation when compared to all other sports and recreational activities. The total
number of golfers in the United States has increased by 10% since 1995 [133].
As golf continues to grow in popularity, it remains one of the few sports that
appeal to a very broad segment of society. People of all ages, gender, and physical fitness
levels are able to enjoy the game. The golf handicap system allows even competition
between golfers of all skill levels. Additionally, golf is one of the few "individual"
sports where a team or opponent is not required for competition; therefore, a very large
population of golfers participates in competitive golf. The number of elite golf
competitions is also growing, as well as the prize money associated with those
competitions.
Similar to most other sports, there are several different ways to achieve better
16
performance in golf: improved technique, improved physiological capabilities (strength,
power, flexibility, endurance, etc), improved and individually matched equipment, and
1995 Wt lifting C, T, T/C S 30-90 min Pre/mid/post
+C,=T -T/C, +C#
McKay et. al 1997 Golf C, CSAI-2 S BL; 15 min Pre/post holes 6, 12, and 18
+C +C No
Suay et al 1999 Judo C,T B BL/10 min Pre/10 min post fight
+C,+T +C, +T
+C
Gonzalez- Bono
1999 Basketball C,T, Mood
S BI745 min Pre/15 min Post game
=C,=T +C, =T
+T*
Passelergue and Lac
1999 Wrestling C,T S 90 min Pre/Imm. Post/ 8 days post
+C,=T +c, =T
Kraemer et al 2000 Wrestling C,T B BL, 10-30 min Pre/Post/5 days Post
=C,=T +c, +T
Kraemer et al 2001 Wrestling C,T B BL/10-30 min Pre/Post
=C,=T +C, =T
+T
Filaire 2001 Judo C, T, CSAI-2
S BL/5 min Pre/5 min post fight
C+,=T +C, =T
+C*
*BL = Baseline Day; # = significant correlation; T = Testosterone, C.= Cortisol, T/C = T/C ratio, A = Anxiety, CM = Collection Method (B)lood or (S)aliva +T* positively correlated with score to playing-time ratio +Tw = pre-competition increase in winners only +C* positively correlated CSAI-2 somatic and cognitive anxiety + Increased in comparison to baseline measure = No change in comparison to baseline measure
Sport Competition Anxiety
There is some inconsistency as to the definition of anxiety, however one of the most
accepted definitions was described by Charles Spielberger as: "emotional reactions that
consist of a unique combination of: (1) feelings of tension, apprehension, and nervousness;
69
(2) unpleasant thoughts (worries); and (3) physiological changes". Spielberger goes on to
discuss anxiety as a subjective, highly individual phenomena involving three components:
Stressors, self-evaluation or perception of the Stressor, and emotional reactions to the Stressor.
A Stressor that is perceived as threatening to one individual may be benign to another [55].
Several investigators have studied the effects of anxiety on sport performance.
However, no single theory seems to explain the effects of anxiety on all types of sport
performance. Two challenges exist in relating anxiety to sport performance: accurate and
reliable measurement of anxiety and accurate and reliable measurement of actual sport
performance [153].
Early research in the assessment of anxiety identified two separate, but related types
of anxiety, trait anxiety and state anxiety [18]. Trait anxiety is a measurement of the
predisposition of an individual to perceive situations as a threat. State anxiety depends on the
intensity of the threat or Stressor perceived by the individual and changes with the
environment [153]. So, a person with a higher trait anxiety would likely respond to a Stressor
with higher state anxiety than a person with lower trait anxiety.
Most scientists investigating the relationship between anxiety and sports performance
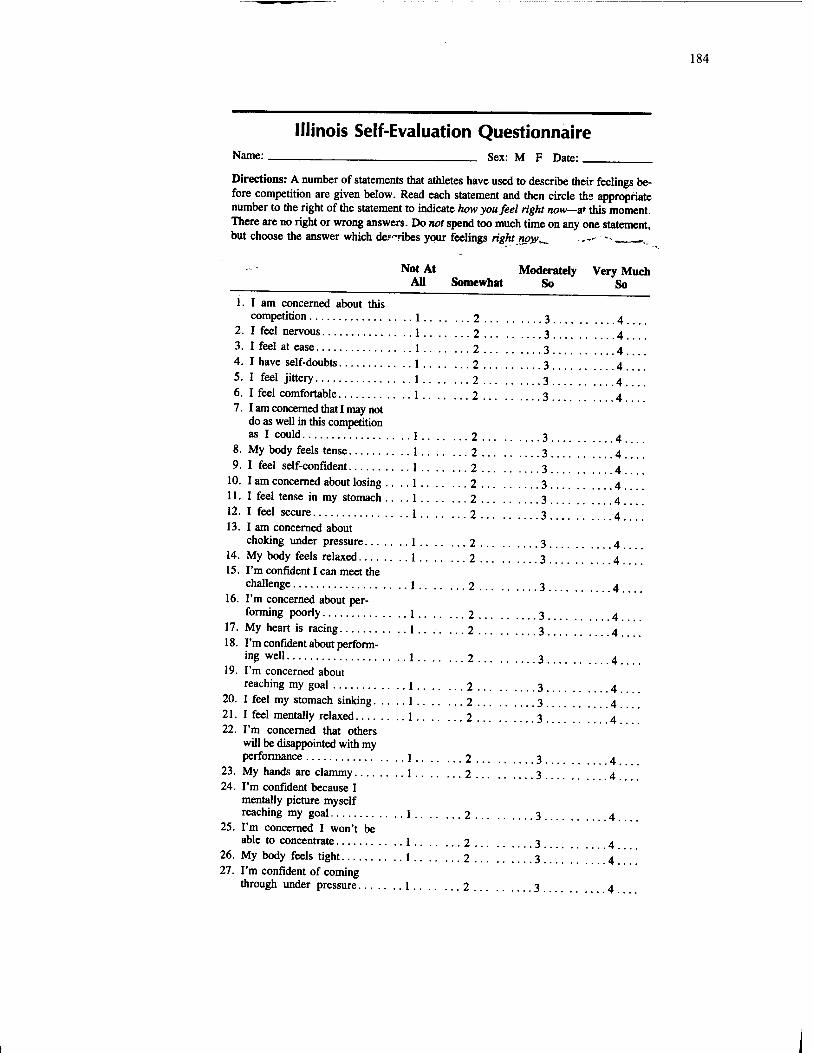
have used the Competitive State Anxiety Inventory-2 (CSAI-2) [113]. This anxiety-
assessment tool separates anxiety into somatic anxiety and cognitive anxiety based on prior
research showing the two as distinct components of anxiety [39]. The CSAI-2 also measures
self-confidence. Reliability and validity of the CSAI-2 are discussed in depth by Martens and
colleagues (1990) [113].
70
Martens and colleagues (1990) demonstrated cognitive state anxiety and state self-
confidence are stable before competition, whereas somatic state anxiety quickly rises as
competition nears. Additionally, interpersonal and situation factors influence changes in each
component. Martens and colleagues (1990) also predicted a negative relationship between
cognitive state anxiety and performance, a positive relationship between state self-confidence
and performance and an inverted-U relationship between somatic state anxiety and
performance. Better prediction of performance has been demonstrated in studies with
intraindividual performance measures [51]. Process errors relate to cognitive anxiety state
and output errors relate to somatic anxiety state. Some studies have reported no relationship
between pre-competitive anxiety state and performance because anxiety state levels tend to
drop once competition begins [99, 117, 121]. However, some investigators have noted a
significant negative relationship between anxiety and performance, with winners generally
reporting lower cognitive and somatic anxiety and higher self-confidence [17, 20, 51, 170].
Few studies have validated the CSAI-2 with physiological measures of anxiety. Yan
Lan and Gill (1984) reported no relationship between heart rate and CSAI-2 components,
while McAuley (1985) reported no relationship between somatic anxiety and cortisol
response to competitive golf [121]. However, Filaire and colleagues reported significant
correlations between somatic state anxiety, cognitive state anxiety and cortisol [42].
Similarly, other investigators have reported significant correlations between cortisol response
and more general anxiety measures [59, 178].
Scoring methods for the CSAI-2 are explained in Martens and colleagues (1990)
[113]. The cognitive anxiety state subscale is scored by totaling responses for 1, 4, 7,10,
71
13, 16, 19, 22, and 25. The state self-confidence subscale is scored by adding items 6, 9,
12, 15, 18, 21, 24, and 27. The somatic state anxiety subscale is scored by adding items
2, 5, 8, 11, 14, 17, 20, 23, and 26 [113]. See Appendix C for CSAI-2 questionnaire.
Conclusions and Implications from the Literature Review
Golf is a multi-faceted sport and several different factors influence performance.
There is an abundance of scientific research investigating golf swing mechanics and
equipment. However, there is limited research investigating the effects of strength and
conditioning on golfers, particularly elite men and women golfers. Additionally, there is
little research investigating physiological stress during competitive golf.
It is clear from previous research that strength, power, and flexibility training has
positive effects on recreational male golfers. However, the influence of strength, power,
and flexibility training on elite men and women requires investigation. Additionally,
previous investigations have focused primarily on only two golf variables—maximum
distance and clubhead speed. A physical conditioning program may also affect putting
performance and consistency, which are important to overall golf performance.
Previous investigations of the effects of resistance training on golf performance
have not attempted to determine the causes of increased performance due to the training.
Performance changes may be due to more optimal mechanics or simply increased strength
and power. It's clear from the literature that the golf swing is a complex motion and
subtle changes in technique may cause changes in impact conditions and subsequent
72
performance.
Few studies have measured physiological variables in stressful situations outside
of the laboratory. However, recent biochemical assay developments allow reliable
salivary testosterone and cortisol determination. Salivary hormone values have also been
highly correlated to serum values and have been repeatedly used to investigate endocrine
response in the field.
Testosterone is an important hormone related to exercise and mood state. Several
investigators have reported testosterone measures in association with sport performance,
however results are inconsistent. Testosterone has never been measured in conjunction
with golf performance and golf may illicit a different response than other sports or
psychological Stressors.
Similar to excessive high intensity exercise, a decrease in T/C ratio may occur in
extended sports competition, which may slow recovery and cause overtraining symptoms.
Competitive college golf lasts longer than most sports and golfers may be under
endocrine stress for several hours during competition.
Psychometric tools are often used to assess state and trait anxiety. The relation of
psychometric tools with physiological measures in real-life stressful situations is rare and
valuable information. Research associating the CSAI-2 with competitive sport
performance is inconclusive and further research is necessary to understand the
psychometric measures relation to performance and endocrine response.
73
Chapter 3
Study #1: The Effects of Strength, Power, and
Flexibility Training on Golf Performance in
Competitive Intercollegiate Men and Women
Golfers
I plan on submitting this chapter as a paper for publication to: Medicine & Science in Sports & Exercise
References, table, and figure placement will be reformatted to meet author guidelines
74
The Effects of Strength, Power, and Flexibility Training on Golf Performance in Competitive Intercollegiate Men and
Women Golfers
Brandon K. Doan1, Robert U. Newton1, William J. Kraemer3, Justin L. Cecil2,
Michael J. Fleck2, Young-Hoo Kwon4, Najma H. Javed5, Thomas M. Harris6
^he Human Performance Laboratory, Ball State University, Muncie, IN 47306 2The Department of Athletics, Ball State University, Muncie, IN 47306
3The Human Performance Laboratory, Department of Kinesiology, The University of Connecticut, Storrs, CT 06269
4The Biomechanics Laboratory, Texas Women's University, Denton, TX 76204 department of Physiology and Health Science, Ball State University, Muncie, IN 47306
6Department of Management, Ball State University, Muncie, IN 47306
ADDRESS CORRESPONDENCE TO:
Brandon K. Doan The Human Performance Laboratory Ball State University McKinley Ave. Muncie, IN 47306
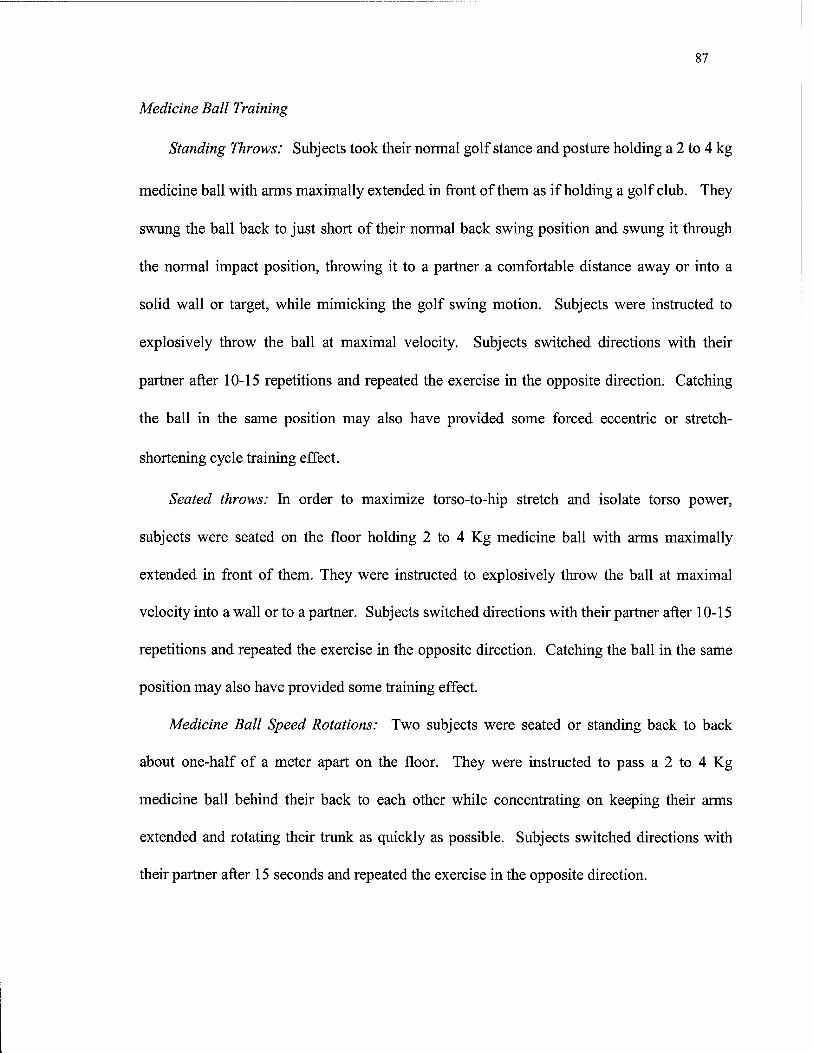
Standing Throws: Subjects took their normal golf stance and posture holding a 2 to 4 kg
medicine ball with arms maximally extended in front of them as if holding a golf club. They
swung the ball back to just short of their normal back swing position and swung it through
the normal impact position, throwing it to a partner a comfortable distance away or into a
solid wall or target, while mimicking the golf swing motion. Subjects were instructed to
explosively throw the ball at maximal velocity. Subjects switched directions with their
partner after 10-15 repetitions and repeated the exercise in the opposite direction. Catching
the ball in the same position may also have provided some forced eccentric or stretch-
shortening cycle training effect.
Seated throws: In order to maximize torso-to-hip stretch and isolate torso power,
subjects were seated on the floor holding 2 to 4 Kg medicine ball with arms maximally
extended in front of them. They were instructed to explosively throw the ball at maximal
velocity into a wall or to a partner. Subjects switched directions with their partner after 10-15
repetitions and repeated the exercise in the opposite direction. Catching the ball in the same
position may also have provided some training effect.
Medicine Ball Speed Rotations: Two subjects were seated or standing back to back
about one-half of a meter apart on the floor. They were instructed to pass a 2 to 4 Kg
medicine ball behind their back to each other while concentrating on keeping their arms
extended and rotating their trunk as quickly as possible. Subjects switched directions with
their partner after 15 seconds and repeated the exercise in the opposite direction.
88
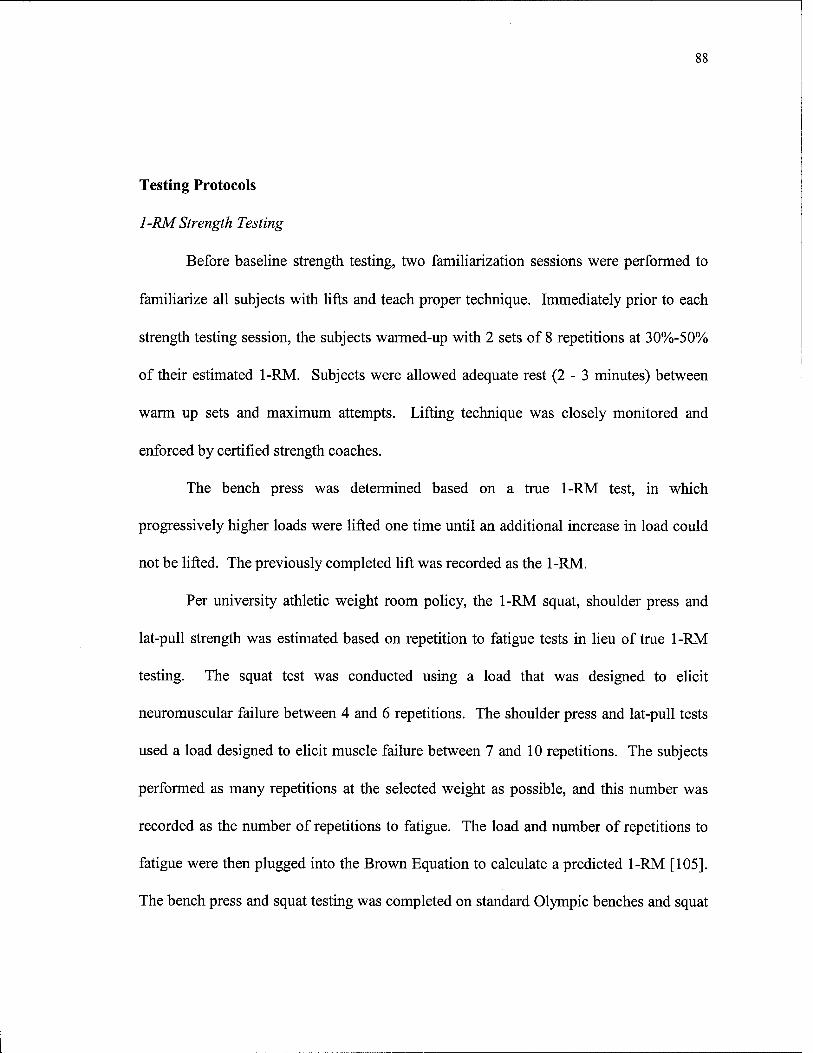
Testing Protocols
1-RM Strength Testing
Before baseline strength testing, two familiarization sessions were performed to
familiarize all subjects with lifts and teach proper technique. Immediately prior to each
strength testing session, the subjects warmed-up with 2 sets of 8 repetitions at 30%-50%
of their estimated 1-RM. Subjects were allowed adequate rest (2-3 minutes) between
warm up sets and maximum attempts. Lifting technique was closely monitored and
enforced by certified strength coaches.
The bench press was determined based on a true 1-RM test, in which
progressively higher loads were lifted one time until an additional increase in load could
not be lifted. The previously completed lift was recorded as the 1-RM.
Per university athletic weight room policy, the 1-RM squat, shoulder press and
lat-pull strength was estimated based on repetition to fatigue tests in lieu of true 1-RM
testing. The squat test was conducted using a load that was designed to elicit
neuromuscular failure between 4 and 6 repetitions. The shoulder press and lat-pull tests
used a load designed to elicit muscle failure between 7 and 10 repetitions. The subjects
performed as many repetitions at the selected weight as possible, and this number was
recorded as the number of repetitions to fatigue. The load and number of repetitions to
fatigue were then plugged into the Brown Equation to calculate a predicted 1-RM [105].
The bench press and squat testing was completed on standard Olympic benches and squat
89
racks with Olympic bars and weights. The shoulder press was completed using dumb
bells and the lat pull using a Universal lat pull cable machine.
Grip strength
Isometric handgrip strength testing was performed using a Jaymar model 30J4
(Country Technology, Gays Mills, WI) handgrip dynamometer. The dynamometer was
adjusted to the subject's hand. Subjects were instructed to fully extend at the elbow, raise
the arm to 90 degrees of shoulder flexion, and maintain 0 degrees of wrist extension to
ensure consistency between conditions. Three maximal trials were used for warm up and
familiarization. The mean of three maximal trials from the left hand was used in data
analysis [205].
Rotational Power
Subjects were tested on rotational trunk power by throwing a 2 kg medicine ball
into a target. The subject was seated on a weight-training bench with legs and hips
secured to the bench with Velcro straps. Target height was set at the same height as
release so flight would be horizontal. Trials where the ball did not hit the target were
discarded. Each throw was video taped with a JVC 9800 digital video camera at 240
frames per second.
The video was subsequently captured using a Marvel video capture card, edited in
Adobe Premiere 5.1 computer software, and digitized and analyzed using Kwon 3D
(version 3.0, Visol Inc., Seoul, Korea) motion analysis software. Four points of a
calibration frame were digitized prior to digitizing each videotaping session. The leading
edge of the ball was digitized for several frames before and after ball release. Raw
90
digitized coordinates were filtered using a 6 Hz, 2nd order Butterworth low-pass filter and
converted to real-life coordinates using 2-dimensional direct linear transformation (DLT)
[187]. Velocity at ball release was then calculated and three trials were averaged for
statistical analysis (Figure 3.1).
Target
Figure 3.1: Medicine ball rotational put test. Video-taped at 240 Hz, leading edge of ball digitized, and resultant velocity at release calculated.
Flexibility Testing
Maximum trunk rotation in both directions was measured using video analysis. A
video camera was centered above the subject's head. The subject was seated on a weight-
training bench with legs and hips secured to the bench with Velcro straps. Subjects
placed a 1-meter long board across their shoulders and were instructed to rotate their
trunk to the end of their range of motion and hold for three seconds. Three trials were
recorded for each subject in both directions and averaged for analysis.
The video was subsequently captured using a Matrox Marvel (Matrox Inc.,
Quebec, Canada) video capture card, edited in Adobe Premiere 5.1 computer software,
and then analyzed using Swinger® computer software. Swinger® allowed lines to be
91
drawn parallel to the shoulders at a neutral trunk position and at maximum trunk rotation.
Swinger® then computed the angle in degrees between the lines. Three trials were then
averaged for each subject to come up with a clockwise (back-swing direction) and
counter clockwise (follow-through direction) trunk-rotation mean (figure 3.2).
^^^^^^^H^^^^^^^^BBSm^^^B
Line drawn at starting position
Figure 3.2: Trunk rotation flexibility test. Angle between starting position and maximal rotation measured using Swinger® computer software. Three trials in each direction averaged for statistical analysis.
Qualitative Video Analyses
The last three swings for each subject during the 15-swing launch condition
testing session were recorded in the frontal view using a JVC 60 Hz VHS-C video camera
(Model GR-AX76). This order was chosen to conserve time and videotape during data
collection and there was little deviation expected between trial due to the high skill levels
of the golfers. Shutter speed was set at 1/2000 of a second. Qualitative analysis for each
subject was performed using Swinger (Victoria, Australia) computer software to overlay
pre- and post-training swing images and identify changes in critical swing elements from
92
pre to post testing.
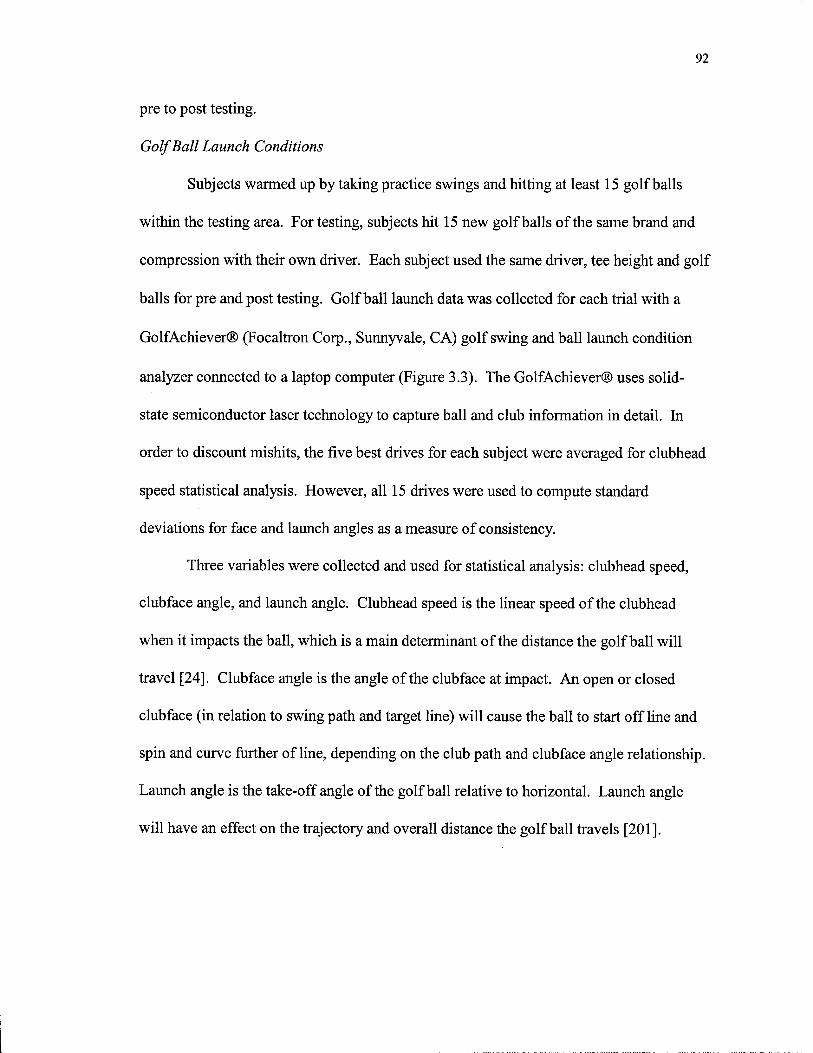
Golf Ball Launch Conditions
Subjects warmed up by taking practice swings and hitting at least 15 golf balls
within the testing area. For testing, subjects hit 15 new golf balls of the same brand and
compression with their own driver. Each subject used the same driver, tee height and golf
balls for pre and post testing. Golf ball launch data was collected for each trial with a
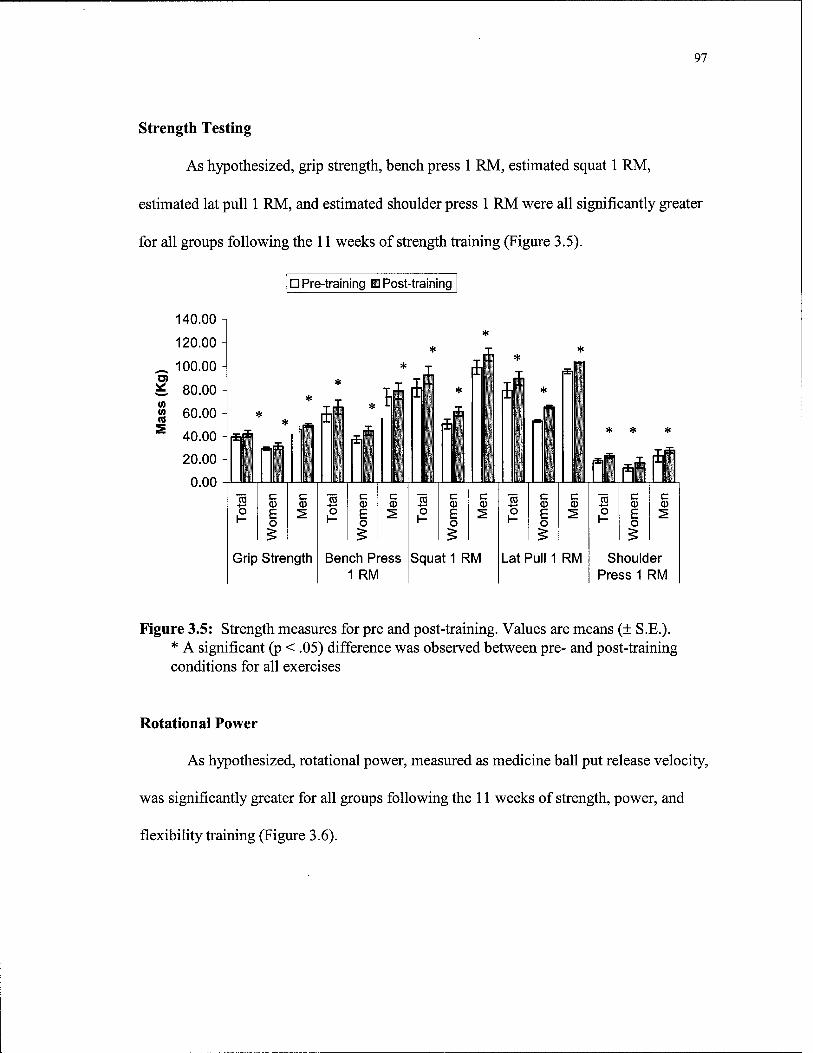
Figure 3.5: Strength measures for pre and post-training. Values are means (± S.E.). * A significant (p < .05) difference was observed between pre- and post-training conditions for all exercises
Rotational Power
As hypothesized, rotational power, measured as medicine ball put release velocity,
was significantly greater for all groups following the 11 weeks of strength, power, and
flexibility training (Figure 3.6).
98
D Pre Training ■ Post Training
^ 8.00 w E 7.50
3? 7.00 ü ° 6.50
^ 6.00 n m 5.50 0) .S 5.00
1 4.50 S 4.00
-i-
00
*
o 'tv-l
Total
in
*
Women
CD
Men
Figure 3.6: Rotational power (medicine ball put release velocity) means (+ S.E.) for pre- and post-training. * A significant (p < .05) difference was observed between pre and post-training conditions
Flexibility Testing
As hypothesized, trunk rotation flexibility in the back-swing and follow-through
direction was significantly greater for all groups following the strength, power, and
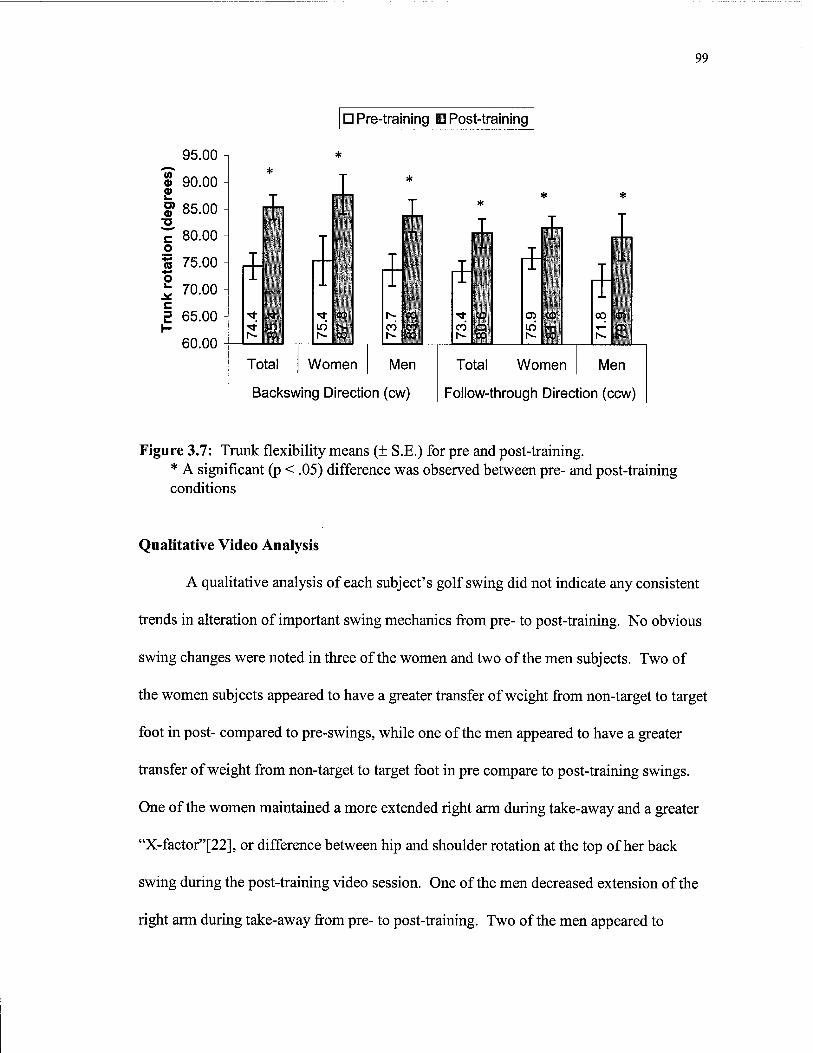
Figure 3.7: Trunk flexibility means (± S.E.) for pre and post-training. * A significant (p < .05) difference was observed between pre- and post-training conditions
Qualitative Video Analysis
A qualitative analysis of each subject's golf swing did not indicate any consistent
trends in alteration of important swing mechanics from pre- to post-training. No obvious
swing changes were noted in three of the women and two of the men subjects. Two of
the women subjects appeared to have a greater transfer of weight from non-target to target
foot in post- compared to pre-swings, while one of the men appeared to have a greater
transfer of weight from non-target to target foot in pre compare to post-training swings.
One of the women maintained a more extended right arm during take-away and a greater
"X-factor"[22], or difference between hip and shoulder rotation at the top of her back
swing during the post-training video session. One of the men decreased extension of the
right arm during take-away from pre- to post-training. Two of the men appeared to
100
release the club later (allow the wrists to uncock later) in the pre- compared to post-
training video session. One of the men had a decreased "X-factor" in the post- compared
to pre-video session. Another one of the men maintained a better synchronization
between his trunk rotation and arm swing in post- versus pre-swings. His arms lagged
further behind his trunk in the pre-training swings.
Golf Ball Launch Conditions
As hypothesized, clubhead speed for the entire group was significantly (p < 0.05)
higher following the training period (Figure 3.8). However, there were no significant
differences between pre- and post-training clubhead speeds for the men-only or women-
only groups. Contrary to hypothesis, no significant differences were demonstrated
between pre- and post-training values for face-angle deviation or launch-angle deviation
for the total, men-only, or women-only groups (Figures 3.9).
D Pre Training H Post Training
52
50
"g 48 o % 46 ■o S 44 £ ■Q = 42 o
40
Ui
CO o CO
Total
i CO
*
■3-
Women
oo oS o
Men
Figure 3.8: Clubhead speed means (± S.E.) for pre and post-training. * A significant (p < .05) difference was observed between pre and post-training conditions
^3.20 § 3.00- ö) 2.80 o 2. 2.60
2.40 2.20 2.00 1.80 1.60 1.40 1.20
o re
I a c re
J.
s CM CM
Total
101
D Pre training B Post training
i
co
Women Men
Face Angle Deviation
Total
CM Cvi
Women
CM
Men
Launch Angle Deviation
Figure 3.9: Launch and face angle deviation means (± S.E.) for pre- and post- training.
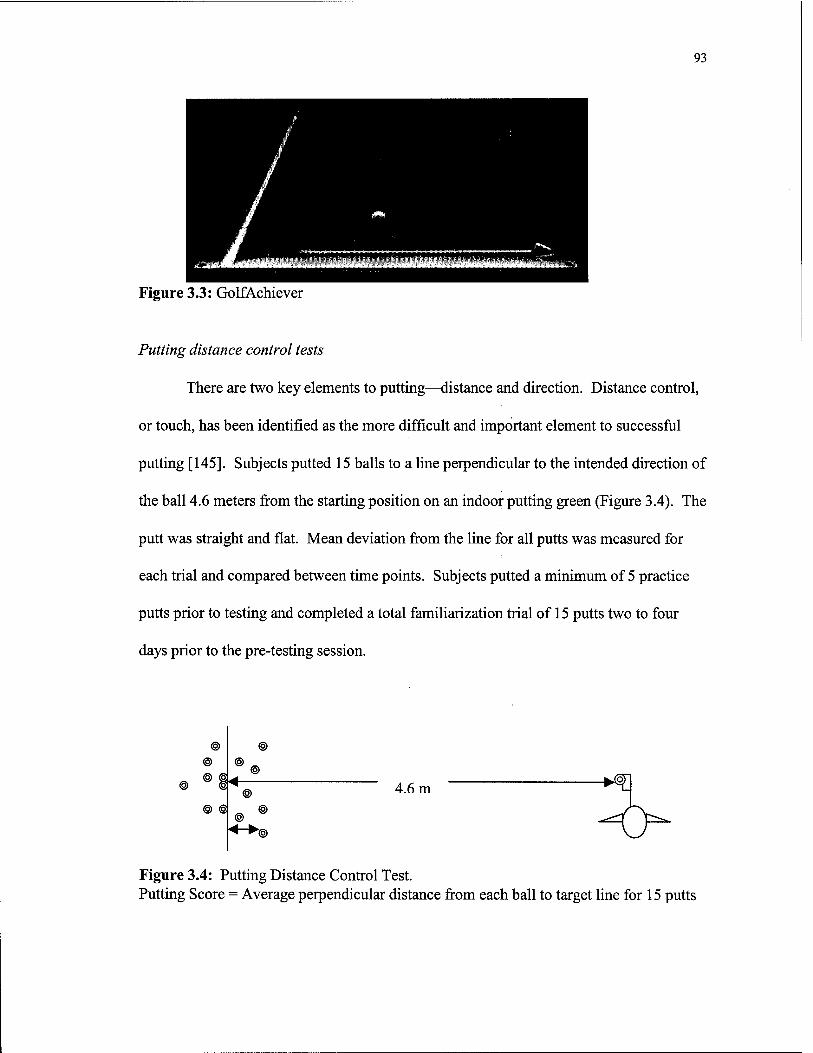
Putting distance control test
Contrary to hypothesis, there was no difference between pre- and post-training
putting test values for the total group and the women-only group. However, the men-only
group post-training putting test score was significantly lower than the pre-training putting
score, indicating better putting distance control performance following the training
(Figure 3.10).
102
Ö Pre Training B Post Training
| 35.00
S> 30.00 n
| 25.00
■2 20.00
15.00
10.00
5 •a c 0)
- *
T T _ J_
-
-
CO
-T
I-- IKS 00
■1 i
I' r
: CN CO C\l . CM
I
00 CM
' CO
1
io CN
tod
Total Women Men
Figure 3.10: Putting distance control means (+ S.E.) for pre and post-training. * A significant (p < .05) difference was observed between pre- and post-training conditions
Correlations Between Measures
Pearson product moment correlation analysis between golf performance, strength,
power, and flexibility measures for each group by gender resulted in only one significant
(p < 0.05) correlation between measures. Clubhead speed was significantly correlated to
medicine ball put velocity (r = 0.86).
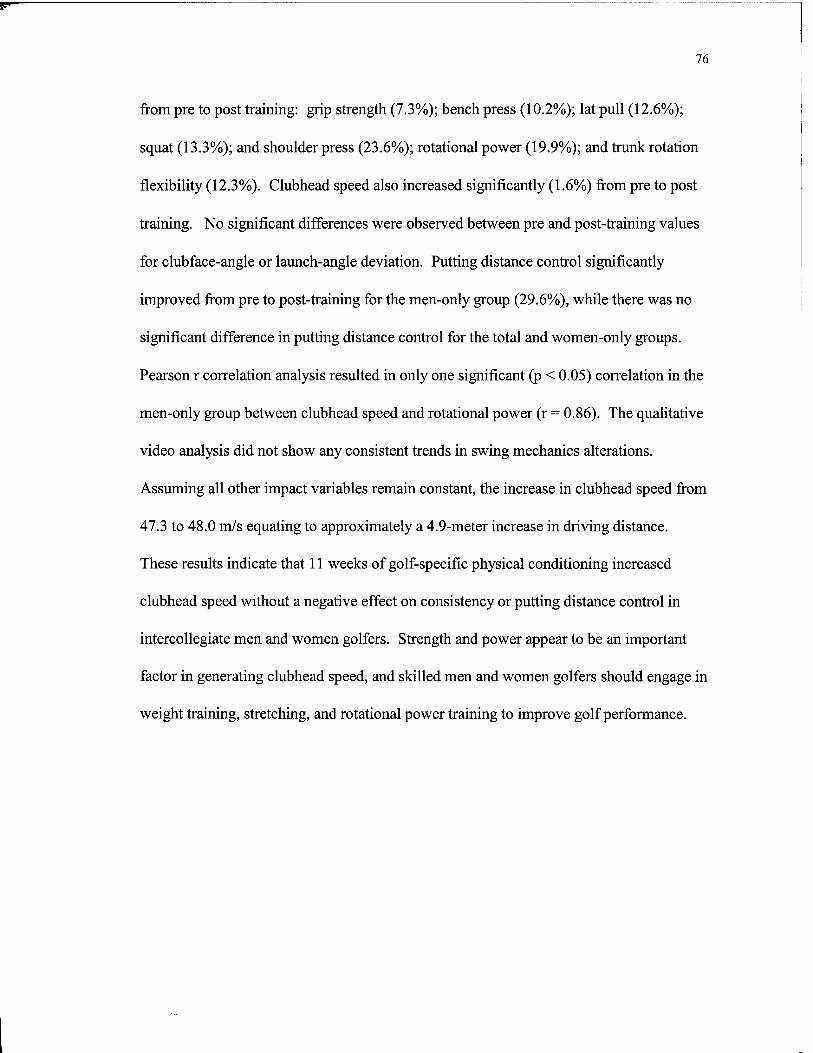
Discussion
Clubhead Speed
The primary finding in this investigation is that clubhead speed in a group of men
and women collegiate golfers increased following 11 weeks of strength, power and
flexibility training from 47.3 to 48.0 m/s. If all other impact variables were held constant,
103
this 0.7 m/s increase in clubhead speed equates to approximately a 4.9-meter increase in
driving distance [24]. Increased driving distance allows shorter, more accurate, iron shots
to be hit into the greens and is an important ingredient in overall golf performance.
Driving distance has been positively correlated with score in average golfers (r - 0.64)
[156] and elite golfers (r = 0.49 to r = 0.84) [58]. In a statistical comparison of
performance variables for the 1995 PGA Tour, only driving distance and total driving
(distance and accuracy) measures were significantly different (p < .05) between the top
and bottom 10 money winners [40]. Cochran and colleagues (1968) studied the
performance of a group of professional golfers playing in a professional tournament [24].
They concluded that a 17-meter increase in driving distance, with no change in accuracy,
would result in an improvement in golf score of 2.2 strokes per 18-hole round.
Comparatively, the approximately 4.9-meter increase in driving distance noted in this
investigation would equate to a 0.63 improvement in golf score per 18-hole round. PGA
Tour players would improve 72-hole tournament scores by 2.54 strokes, equating to an
over $20,000 increase in tournament winnings or an over $500,000 increase in annual
earnings over a 25-tournament season [122].
Mechanisms possibly responsible for the motor performance adaptations
following the training program may be related to greater activation and synchronization
of higher recruitment threshold motor units or enhanced inhibition of antagonist muscle
activity following resistance training [160]. Other possible mechanisms contributing to
the increased clubhead speed include: increased muscle strength, increased rate of force
development, increased velocity of muscle contraction, reduction of strength imbalances,
104
increased flexibility, or more optimal mechanics [91]. Further research is required to
directly relate specific mechanisms to changes in motor performance.
Several previous studies have noted increases in clubhead speed or distance of 4
to 7% following resistance and flexibility training [64, 74,103,106,168,190,193,194].
However, the clubhead speed increased only 1.62% in this investigation. There are
several possible explanations for the smaller relative gains in clubhead speed in this
investigation.
The higher skilled golfers participating in this investigation may respond
differently to strength, power, and flexibility training than recreational amateur golfers.
Measurable performance gains and adaptations require more intense training in highly
skilled versus novice athletes [56, 57, 167] and gains in novice performance may not
apply to elite athletes [66]. Jorgenson (1970), using a mathematical model determined
there are two important components in clubhead speed: the amount of torque supplied by
the golfer and the skill with which the golfer manages the torque [75]. Strength,
flexibility, and power gains may allow and encourage more optimal swing mechanics in
novice players, while skilled players have already refined mechanical methods. Further
study is required to investigate the differential effects of physiological adaptations on
skilled and novice golfer's mechanics.
Differences in training programs used in the current versus previous investigations
offers one possible explanation for differences in clubhead speed changes. However, key
training program variables, such as the total length, volume, specificity and intensity [8,
44] of the training program used in this investigation were at least as high as training
L
105
programs of previous investigations. Length of previous programs ranged from 8-12
weeks, while volume and intensity ranged from 1 to 3 sets of 8-12 repetitions.
Additionally, previous investigations did not include rotational power training, which was
included as part of the training program for this investigation. One investigation
documented increased gains in baseball bat speed when medicine ball rotational put
training was combined with traditional resistance training programs [109]. Finally, all
strength and power measures were significantly higher following the training program in
this investigation (Table 3.6; Figure 3.5). Relative strength (7 to 24%) and flexibility (7
to 16%) gains in this investigation were similar to previously reported strength (5% to
56%) and flexibility (7 to 39%) gains [64, 74, 103,106, 168, 190, 193, 194]. Therefore,
there must be another explanation for the lower relative gains in clubhead speed noted in
this investigation.
One confounding variable may be the volume of golf specific training. For this
investigation, the strength, power and flexibility training was conducted during the off-
season. Even though subjects were required to practice golf-specific skills a minimum of
eight hours per week during the training, this may not have been enough to prevent a
related decrease in golf performance. Initial testing was conducted two to three weeks
following the regular season. During the regular season, golfers were required to practice
and play golf five days per week for a minimum of 20 hours per week. Most previous
studies were conducted with less skilled golfers whose volume of golf-specific training
did not change during the resistance training. Further study is required to investigate the
effects of the volume of golf-specific training on golf performance.
106
Another interesting finding in this investigation is that although there was no
significant change in clubhead speed from pre- to post-training when the group was
separated by gender, the women showed a trend toward an increase (3.36%) in clubhead
speed, while the men's clubhead speed showed less of a trend towards an increase
(0.61%) from pre- to post-training. The effect size for the women-only group was 0.72,
indicating that with a larger sample size the increase in clubhead speed following training
may have been significant [173]. All six women increase clubhead speed from pre- to
post-training, while only 7 of the 10 men increased clubhead speed.
There are several possible explanations for these results. Although the men and
women participated in identical physical conditioning programs, the women made greater
relative strength gains in the bench press (men = 7%, women = 20%), squat (men =11%,
women = 21%), lat pull (men = 9%, women = 23%), and shoulder press (men = 21%,
women = 36%). Both gender groups were recently (past six months) untrained, however
most of the men had some type of background in resistance training, while five of the six
women did not. Subjects with no background in resistance training may have had a wider
window of adaptation for strength increases.
Another possibility for seemingly greater response in clubhead speed in women
subjects in this investigation is that the women were at a lower relative skill level than the
men. The women's team was in its first year and most of the players were freshmen.
According to end-of-season Golfweek rankings, the women's team was ranked 170th out
of 197 (the 14th percentile) NCAA Division I women's golf teams, while the men were
ranked 132 out of 286 (the 54th percentile) NCAA Division I men's golf teams [7]. The
107
increase in strength and flexibility may have allowed the women to adopt more optimal
swing mechanics, while the men already used closer to optimal swing mechanics.
However, no consistent trends were noted in either group when comparing pre- and post-
swings using qualitative analysis.
Lastly, men have significantly more overall, and especially more upper-body,
strength than women [104,197]. Because of the short duration of the downswing in golf
(0.3 seconds), maximal force values cannot be generated. Men would have a larger
explosive strength deficit (difference between maximal force and forces generated in the
downswing), which may reduce the effectiveness of maximal strength training. The
women's explosive strength deficit may have been lower, increasing the value of
maximal strength training to increasing clubhead speed [204]. Additionally, the slower
contraction velocities used in resistance training movements may not increase power
production capabilities, especially in trained subjects [57, 77, 199]. Since golf requires
high power outputs, more high velocity exercises may have caused more golf-specific
adaptations.
Consistency
Consistency in this investigation was measured as the standard deviation of golf-
ball launch and clubface angle for 15 driver shots. There was no change in these
measures from pre- to post-training. It is important to note that, in general, no negative
effect on consistency resulted from the training. A more fatiguing consistency protocol,
such as increased number of swing repetitions, walking interspersed between shots, or
108
collecting data following a competitive round of golf may reveal different results.
Qualitative Video Analysis
The effect of specific swing elements on clubhead speed or golf ball launch
conditions has not been investigated. However, several studies have compared novice
players to experts and correlated different swing elements to clubhead speed [4, 79, 86,
112, 127,128, 158, 186, 196]. No common trends in swing mechanics alteration from
pre- to post-training were noted in the qualitative analysis. Individual golf swings and
specific adaptations to resistance training are variable. Small, consistent differences in
technique from pre- to post-training may have existed. However, limitations in camera
frame-rate and shutter speed may have resulted in the qualitative video analysis being
insufficiently sensitive to detect them. The interaction of swing mechanics and strength
training is interesting and requires further study. A high-speed three-dimensional motion
analysis of golfers before and after a strength-training program would provide a more
sensitive quantitative analysis of swing alterations and possibly detect changes due to
increases in strength, flexibility and muscle size.
Putting Distance Control
Putting distance control significantly improved from pre- to post-training for the
men-only group (29.6%). There was a trend toward improved putting distance control in
the total (20.4%) and women-only (6.8%) groups, however differences were not
statistically significant. Two possible mechanisms for this improvement in putting
109
distance exist. First, the strength training induced increase in muscle strength may allow
more postural stability and less variation in putting distance control. Second,
improvement in motor unit recruitment and firing patterns has been noted with resistance
training, which may improve regulation of force [16]. This is an important finding
because an average of 40% of all golf shots in an 18-hole round are putts [53].
Correlations Between Measures
Pearson product moment correlation analysis between golf performance, strength,
power and flexibility measures for each group by gender resulted in only one significant
correlation. In the men-only group, medicine ball put velocity was correlated with
clubhead speed (r = 0.86, p < 0.05). This result is not surprising because the medicine
ball rotational put closely matches the speed and movement pattern of the golf swing.
The angular velocity of the arms (9.3 radians/sec) for the men during the medicine ball
puts in this investigation is similar to angular velocity values reported for the arms at
impact during male collegiate player golf swings [129]. When medicine ball rotational
put exercises were added to a resistance-training program for collegiate baseball players,
bat speed significantly improved when compared to a resistance training-only control
group [109]. Similarly, investigators have reported greater gains in vertical jump when
ballistic training is performed in conjunction with traditional resistance training [125].
These results are also in agreement with EMG investigations that have noted high trunk
muscle activation during golf swings [149]. It is apparent that ballistic rotational put
exercises should be included in golf-specific physical conditioning programs and they
110
may also be a valuable strength diagnosis tool for golfers. It should be noted, however,
that medicine ball training should be conducted in addition to resistance training. A
previous study with baseball players noted no change in running speed or throwing speed
in baseball players participating in only medicine ball training [138]. These results may
be valuable in guiding strength and conditioning coaches and players in designing golf-
specific training programs.
Previous work has not been done with the effects of specific resistance training
elements on golf performance. Further study is required to determine an optimal training
program for golfers. For instance, Kraemer and colleagues (1998) noted greater sports-
specific performance gains in collegiate tennis players following a periodized program
compared to a non-periodized resistance training program [96]. Additionally, many
golfers only strength train in off-season months and completely stop resistance training
during the competitive season, which may not be beneficial to performance due to
detraining effects [8]. Collegiate, professional and amateur golf seasons are very long
and split into two time blocks. Measuring effects of a year-round, including in-season,
linear or nonlinear periodized training program would be valuable.
Other possible contributions of physical conditioning to golf performance
It is an important finding that physical conditioning has some positive and no negative
effects on golf performance. Strength, power and flexibility training may have beneficial
effects for golfers other than overt improvements in distance and accuracy. Resistance
training has positive effects on bone, connective tissue and cardiovascular responses [26, 92].
Ill
These changes will influence quality of life and possibly have an effect on golf score,
longevity, or injury prevention [142, 150]. Additionally, a greater range of specialty shots
may be possible with greater strength levels. This possibility has not been scientifically
investigated, however Tiger Woods anecdotally claims he could not hit his low, controlled
tee shot or "stinger" before a prolonged strength-training regimen [189]. Increased strength
in hands, arms, shoulders and trunk may have helped him control the torque of the club at the
bottom of the swing to prevent the club from releasing, while still generating high clubhead
speed, resulting in a low, controlled shot. Finally, there may be some intangible benefits
related to improved fitness, such as increased confidence, concentration, and more optimal
stress response [130].
Conclusion
Competitive, recreational, and especially collegiate golfers have limitations on
practice time. It is valuable to know the effects of different training methods in order to
effectively allocate practice time. These results indicate that 11 weeks of physical
conditioning increased clubhead speed without a negative effect on consistency or putting
distance control in elite men and women golfers. Clubhead speed in elite men and
women golfers increased to a lesser degree than in previously reported studies with less
skilled golfers. This highlights the importance of creating golf and individual specific
conditioning programs. Strength and power appear to be important factors in swinging
the golf club fast and skilled men and women golfers should engage in weight training,
stretching, and rotational power training to improve golf performance.
112
Chapter 4
Salivary Cortisol, Testosterone, and T/C
Ratio Responses During a 36-hole Golf
Competition
I plan on submitting this chapter as a paper for publication to: Journal of Applied Physiology
- Table, and figure placement will be reformatted to meet author guidelines
L.
113
Salivary Cortisol, Testosterone, and T/C Ratio Responses During a 36-hole Golf Competition
Brandon K. Doan1, Robert U. Newton1, William J. Kraemer2, Young-Hoo
Kwon3, Najma H. Javed4, Thomas M. Harris5, Tim P. Scheet2
^he Human Performance Laboratory, Ball State University, Muncie, IN 47306 2The Human Performance Laboratory, Department of Kinesiology, The University of
4Department of Physiology and Health Science, Ball State University, Muncie, IN 47306 department of Management, Ball State University, Muncie, IN 47306
ADDRESS CORRESPONDENCE TO:
Brandon K. Doan The Human Performance Laboratory Ball State University McKinley Ave. Muncie, IN 47306
The purpose of this investigation was to study the effects of 36 continuous holes
of competitive golf on salivary testosterone, cortisol, and testosterone-to-cortisol ratio and
their relation to performance in elite male competitive collegiate golfers. Subjects were
eight NCAA Division I men golfers with the following characteristics: age 20.3 (1.5)
years; height 178.4 (4.5) cm; mass 75.5 (9.1) kg; competitive scoring average 76.4 (1.2)
strokes per 18-hole round. 36 holes of a 54-hole NCAA Division I golf tournament with
15 participating teams were played on the first day of the competition. A saliva sample
was taken 45 minutes prior to the round and immediately following each hole for a total
of 37 samples per subject. Time matched baseline samples were collected on a different
day to account for circadian rhythm. The Competitive State Anxiety rnventory-2 (CSAI-
2) was used to assess pre-round self-reported state anxiety. Six-hole area under the curve
(AUC) values were calculated for endocrine measures. Significant (p < 0.05) increases
were noted for salivary cortisol during competition compared to baseline. Salivary
testosterone did not change from baseline to competition. However, testosterone-to-
cortisol (T/C) ratio was significantly lower throughout the competition compared to
baseline measures. A high correlation (r = 0.82, p < 0.05) between 36-hole AUC
testosterone-to-cortisol ratio difference and 36-hole score was noted. Additionally, there
was a high correlation between pre-round testosterone (r = 0.71, p < 0.05) and T/C ratio
response (r = 0.82, p < 0.05) and 36-hole score. Lastly, there was a strong positive
correlation between CSAI-2 somatic anxiety (r = 0. 81, p < 0.05) and pre-round cortisol
115
response and a strong negative correlation between pre-round testosterone (r = -0.80, p <
0.05), T/C ratio (r = -.72, p < 0.05) and CSAI-2 somatic anxiety. These results indicate a
significant hormonal strain during almost 10 hours of competitive golf. The CSAI-2 has
been further validated by correlation with endocrine measures of stress. Good golf
performance (low golf scores) in this competition was related to low T/C ratio.
116
Introduction
Pfister and Muir (1992) describe stress as the physical or emotional influences
that disturb homeostasis of the organism and produce psychological and physiological
changes in the organism [147]. As early as the 1930's, endocrinologist Hans Selye
observed stimulation of animal adrenal glands when the animal was exposed to "stress"
[50]. Stress response has been described as a reaction of the body systems to a stimulus
or stimuli that disturb homeostasis and is commonly known as the general adaptation
syndrome (GAS) [83].
Reliability of saliva versus blood concentrations of testosterone and cortisol has been
studied extensively [101,155,181,182]. Specifically, Vining and colleagues (1983)
observed salivary steroids to be independent of salivary flow rate and to show equilibrium
with blood concentration [182]. Investigators have reported high to exact correlation of
blood and saliva cortisol curves during rest and exercise [152, 181]. Significant salivary
cortisol concentration increases were noted within the first minute after injection and
peak salivary values were detected within 1-2 minutes of peak cortisol detection in the
blood [184], while the half-life of salivary cortisol has been reported to be between 58
and 113 minutes [41, 65].
In men, salivary testosterone is made up of 78% free or unbound testosterone,
while serum testosterone is only 4% free [82]. Comparisons between salivary and serum
free and total testosterone measures result in high and significant correlations (r = 0.87 to
0.97) between saliva and serum free testosterone [183]. Vining and colleagues also
117
reported a high linear relationship (r = 0.87) between salivary and serum free testosterone
in men [33].
Testosterone and cortisol are secreted in a circadian rhythm. Hormone magnitude
is greatest in the early morning hours and smallest in the late evening [84]. Walker and
Colleagues investigated the intraindividual variability of daily cortisol patterns and
reported high stability of the pattern over five days [184]. Several investigations have
confirmed the circadian pattern of testosterone secretion, especially with frequent
samplings [107,159,164].
The primary endocrine response to stress is increased activation of the hypothalamic-
pituitary-adrenocortical-axis (HPAA) [43]. Cortisol serum concentration may be elevated
during and after athletic performance due to anticipation of or response to psychological
Stressors [6, 84, 115] or physical exertion of 70% of VC>2max or higher [35, 114]. One
previous investigation (basketball players) reported no change in salivary cortisol from
baseline to pre-competition [49]. However, other investigators have reported anticipatory
cortisol rises prior to competition in tennis players [14], marathon runners [28, 59], pistol
shooters [52], weight lifters [143], and judo fighters [42, 169]. All previous
investigations comparing post-athletic competition cortisol to baseline values have noted
significant increases [38, 42, 52, 126,144, 169].
Although not typically associated with stress response, rises in testosterone have been
associated with increased physical stress, such as short-term maximal exercise [88-90,
93], and psychological stress [52,162]. Higher testosterone has also been associated
with mood states such as competitiveness, drive, persistence, and contribution to winning
118
[32, 63].
Testosterone rises in anticipation of competition in tennis players [14], marathon
runners [28], pistol shooters [52], and judo fighters [169]. Contrarily, testosterone did
not rise prior to wrestling [144] or judo [42] competition. In fact, one previous
investigation reported no rise in testosterone prior to a purely psychologically stressful
event (skydiving) [21]. There is no apparent rationale for this disparity in results. It
seems further investigation is required to understand the anticipatory response of
testosterone to athletic competition.
Investigators have noted increases in testosterone from baseline measures to post-
athletic competition in wrestling, pistol-shooting, and judo competition [38, 52, 97, 169],
while others have reported no change from pre to post-wrestling or judo competition [42,
49, 143, 144]. Several investigators have also reported greater testosterone responses in
winners compared to losers [14, 38, 47, 49, 119]. Most investigators attribute the
increase to feelings of success or contribution to winning. Mazur's "biosocial theory of
status" hypothesized a relationship between an individual's assertiveness to maintain
status and testosterone concentration [118]. Competitive drive increases with rising
testosterone. Additionally, testosterone rises in response to winning or climbing in status
in preparation of further competition.
Previous investigators have compared post-competition cortisol responses in
winners and losers. Greater increases in cortisol from pre to post-competition have been
noted in winners vs. losers [14, 38, 143,169]. Passelergue and colleagues (1995) also
reported a low T/C ratio during competition, significantly lower T/C ratios in winners vs.
119
losers, and a significant positive correlation between pre-competition cortisol response
and performance [143].
Cortisol and testosterone are key hormones in protein metabolism. Cortisol
promotes breakdown of muscle protein, while testosterone increases protein synthesis [3].
Therefore, T/C ratio is a good indicator of anabolic/catabolic status. Investigators have
suggested T/C ratio as a marker of overtraining and plasma values below 0.35 10" or a
decrease of the T/C ratio of 30% or more could be an indication of overtraining in aerobic
endurance-type activities [1,9]. T/C ratio decreases as exercise intensity and duration
increase, as well as during intense training or competition periods [176]. Similar
responses are caused by psychological stress during competition and authors recommend
limiting of high intensity exercise and competition stress to avoid overtraining syndrome
[177]. In a recent review article, Clow and Hucklebridge (2001) suggested endurance
overtraining and chronic psychological stress to have similar effects [23]. Authors
warned the synergistic effects of psychological and physiological stress might have
detrimental effects on the immune system.
Most investigators investigating the relationship between anxiety and sports
performance have used the Competitive State Anxiety Inventory-2 (CSAI-2) [113]. This
anxiety-assessment tool separates anxiety into somatic anxiety and cognitive anxiety
based on prior research showing the two as distinct components of anxiety [39]. The
CSAI-2 also measures self-confidence and reliability and validity of the CSAI-2 have
been reported in depth [113].
Few studies have validated the CSAI-2 with physiological measures of anxiety.
120
Yan Lan and Gill (1984) reported no relationship between heart rate and CSAI-2
components [203], while McAuley (1985) reported no relationship between somatic
anxiety and cortisol response to competitive golf [121]. However, Filaire and colleagues
reported significant correlations between somatic state anxiety, cognitive state anxiety
and cortisol [42]. Similarly, other investigators have reported significant correlations
between cortisol response and more general anxiety measures [59,178].
Investigators report golf to require physical exertion of only 43% to 55% of
VC>2max [111]. Therefore, any elevation in cortisol or testosterone during golf
performance may be presumed to be the result of psychological stress. There is limited
research of stress response during competitive golf and its effects on performance. In one
investigation, salivary cortisol and self-reported anxiety (CSAI-2) were measured prior to
play and after holes 6,12 and 18 during competition and practice in 15 Professional
Golfer's Association (PGA) pros (aged 21-25 years). Salivary cortisol was also measured
on baseline days. Higher cortisol concentration, heart rate, cognitive and somatic anxiety
in competition versus practice was noted, but performance based on cortisol measures
could not be predicted. Cortisol response and heart rate were not correlated with anxiety
as measured by the CSAI-2 [126].
Another golf-related investigation measured performance and excretion of several
neurotransmitters (norepinephrine, epinephrine, dopamine, and seratonin) under play,
qualifying and competition conditions in 12 collegiate golfers. A significant sympathetic
nervous system stress response during competition versus practice and different patterns
of response for differing skill levels of golfers were noted [98].
121
Men's NCAA Division I golf teams play 12 or more tournaments each season and
tournaments are normally played over two days with 36 holes played on the first day and
18 holes on the second day. The playing of 36 holes in one day was implemented to
reduce the number of days of the competition, while maximizing the number of
competitive rounds. As golf has become more popular, golf courses are less willing to
allow collegiate golfers to take course time away from paying customers. Additionally,
universities, coaches and players strive to minimize time away from class. Other amateur
golf tournaments, such as the U.S. Amateur Championship require playing of 36 holes for
several consecutive days.
An 18-hole competitive round lasts from 4 to 6 hours, while a 36-hole competitive
round might last 8 to 12 hours. When metabolic demands are combined with the
psychological stress of competition there may be a significant endocrine response to
competitive golf, which may have an impact on performance, recovery, and long-term
health.
The purpose of this investigation was to study the effects of 36 continuous holes
of competitive golf on salivary testosterone and cortisol and their relation to performance
in elite male competitive collegiate golfers. A secondary purpose was to relate pre-
competition CSAI-2 measures of perceived anxiety to cortisol and testosterone response.
The following hypotheses were examined in this investigation:
1. Salivary cortisol will be higher in golf tournament competition than a baseline
condition.
122
2. Salivary testosterone will not change in golf tournament competition
compared to a baseline condition.
3. T/C ratio will be lower in golf tournament competition than a baseline
condition.
4. Perceived fatigue will be greater during competition than baseline.
5. Salivary cortisol will be negatively correlated to performance.
6. Salivary T/C ratio will be positively correlated to performance.
7. Pre-competition salivary cortisol will be positively correlated to pre-
competition somatic anxiety as measured by the CSAI-2.
8. Pre-round salivary testosterone will be elevated in competition compared to
baseline.
9. Pre-round salivary cortisol will be elevated in competition compared to
baseline.
Methods
Subjects
Subjects were eight NCAA Division I men golfers with the following
characteristics: age 20.3 (1.5) years; height 178.4 (4.5) cm; mass 75.5 (9.1) Kg.;
competitive scoring average 76.4 (1.2) strokes per 18-hole round. Estimated handicap for
all golfers was zero. The Institutional Review Board committee of the university
approved the investigation. Subjects were fully informed of the purpose and risks of
123
participating in this investigation and signed informed consent documents prior to testing.
Subjects were familiarized with sampling and survey procedures one to three days prior
to the actual testing.
Data Collection Procedures
Competition samples were taken during an NCAA Division I golf tournament.
Per NCAA requirements, all 80 players (15 teams) carried their own golf bag throughout
the competition. The format for starting was a "shotgun" start so all subjects started the
round at the same time of day on different holes. Pre-competition saliva samples were
taken at 7:15 A.M., 45 minutes prior to teeing off on the first hole of the round. During
the competition, a saliva sample was taken immediately following each hole for a total of
37 samples per subject during the 36-hole competition. Time between samples ranged
from 10 to 25 minutes, with an average time between samples of 16 minutes (Figure 4.1).
Competition Sampling
CM CO lO CD 00 O) CM CO in CO oo O) CM co
< V. 1 1-3 weeks between competition and baseline sampling i
E Sase ine Sampling
F in O lO in co in o m o
m m CM
m o o
in in CO
m m
o co co
o in o o in o m o o in in CO co CM m o ■* CM in m
T- CM co in T— co in *. . * , * . o CM CO If) o co ■sr in o CM co m CM ■* m CM co H [*- oo oo oo O) a> en o o o o T— Y~*
T— T— CSJ CM CM T_
T- T— CM CM CM CM co co CO co ■* ■* ■* ■* m m in
Figure 4.1: Saliva sampling procedure. Times are average time for end-of-corresponding hole and baseline sampling
124
One research assistant was assigned to each golfer for the entire 36-hole round.
The research assistant carried 36 pre-labeled Sarstedt salivettes (model #D-51588,
Newton, NC), stored in a small cooler on ice. Immediately following each hole, the
research assistant provided a new salivette to the subject and recorded the time of sample,
any food or drink ingested, as well as the subject's mental and physical fatigue using a
visual analog scale (Figure 4.2).
1 2 3 45 6 7 8 910 Completely Maximum Exhausted energy level
Figure 4.2: Fatigue Scale. Used after each saliva sampling.
Subjects were instructed to remove and replace the cotton wool swab from the
salivette without using their hands and lightly chew on it for 45 seconds. Saliva samples
were returned to the laboratory after 18 and 36 holes and centrifuged at 5000 rpm for 10
minutes to force saliva from the cotton swabs into the bottom of the salivettes. Saliva
was then transferred to 1.5 mL eppendorfs and stored at -80° C for subsequent analysis.
Saliva was thawed and analyzed in the laboratory at a later date to compare
cortisol and testosterone concentrations to baseline conditions and performance on the
previous and following holes. Baseline saliva samples were collected on a different day
within one to three weeks following the competition [84]. Timing of baseline samplings
was matched to corresponding time of samplings during competition (Figure 4.1).
Additionally, food and drink consumption were recorded during competition and
125
replicated during the baseline collection. Subjects were instructed to abstain from sexual
activity, alcohol, and caffeine the night before and the day of sampling.
126
Biochemical Analysis
Saliva was moved from -80° C to -20° 48 hours prior to analysis. 24 hours before
analysis the saliva samples were moved to 0° C and were allowed to warm to room
temperature immediately before analysis. Salivary testosterone concentration was
determined in duplicate by Enzyme Immunoassay using a Salimetrics Salivary
Testosterone Enzyme Immunoassay Kit (Catalog No. 1401/1402, State College, PA).
Salivary cortisol concentration was determined in duplicate by Enzyme Immunoassay
using a Diagnostic Systems Laboratories Salivary Cortisol Enzyme Immunoassay Kit
(DSL-10-671000 ACTIVE, Webster, Texas). Assay plates were read using a Wallac
1420 Victor2 Multilabel Reader (Turku, Finland). Intra-assay variance for cortisol was
2.51% and testosterone was 2.69%.
Competitive State Anxiety
Competitive state anxiety was assessed only on the competition day. 45 minutes
prior to the round, subjects completed the CSAI-2. Subjects all completed a practice
CSAI-2 one to three days prior to the competition for familiarization. The CSAI-2 is a
27-item written self-evaluation of state anxiety. The instrument assesses cognitive
anxiety, somatic anxiety and self-confidence. Extensive research has been done using the
CSAI-2 and it is a reliable and valid psychometric tool [113].
127
Data Analysis
Salivary testosterone and cortisol concentration, as well as T/C ratio differences
were computed by subtracting baseline from competition values to account for individual
circadian rhythm variations. These difference values were correlated to performance and
CSAI-2 values using a Pearson Correlation (p < 0.05). Each player's 36-hole score was
normalized by subtracting a handicap. Handicap was computed by subtracting each
player's 36-hole season average score from the tournament average. Tournament average
was computed as the mean 36-hole score of all 80 competitors. Score on each hole was
normalized by subtracting a prorated handicap and the average score on each hole of all
80 competitors in the tournament from each individual's hole-by-hole score.
Normalization of the scores allows more accurate assessment and comparison of
individual performance.
Area under the curve (AUC) values for salivary testosterone and cortisol
concentration, as well as T/C ratio, were approximated for the group by summing
measures over six holes (6-hole AUC) and over the entire 36 holes (36-hole AUC) during
competition and for each corresponding time period during the baseline day. For 6-hole
AUC measures, a competition by hole or time period (2 X 7) repeated measures ANOVA
was used to detect any differences between competition and baseline means. Separate
baseline and competition data were analyzed using a competition by hole or time period
(1X7) repeated measures ANOVA. A Fisher LSD post-hoc test was used to determine
pairwise differences. Separate hole or time period by competition (1 X 2) repeated
128
measures ANOVA's were used for pairwise comparison within each time period to
determine where specific differences occurred between competition and baseline
measures. A Pearson product moment was used to examine the relationship between
individual hole, 6-hole AUC, and 36-hole AUC and corresponding golf score. The
criterion for statistical significance was set at p < 0.05.
Experiment-wise error was not compensated for by adjusting alpha levels. The
small sample size and large variation in physiological measurement and competitive
performance measures makes it difficult to detect differences. This liberal approach was
chosen to highlight possible differences due to the exploratory nature of the experiment.
Results
Salivary Cortisol
6-hole AUC values were used for statistical analysis. Significant competition vs.
baseline effect (F(l,7) = 4.73, p < 0.05) and a significant hole or time point effect (F(6,
42) = 24.26, p < 0.001) was noted from the ANOVA. No significant interaction was
noted between baseline or competition cortisol measures and time of day or hole.
Significant pairwise differences were noted between baseline and competition
salivary cortisol measures at sample periods 1-6 through 25-30 (Figure 4.3).
Additionally, baseline salivary cortisol at all subsequent sample periods was significantly
lower than the pre-round baseline salivary cortisol. Baseline salivary cortisol at sample
periods 7-12,24-30 and 31-36 was significantly lower than baseline salivary cortisol
129
during sample period 1-6. Competition salivary cortisol was significantly lower during
sample periods 7-12,13-18,19-24, and 31-36 than the pre-round and hole 1-6 sample
periods. Competition salivary cortisol during holes 13-18 was significantly lower than
competition salivary cortisol during holes 7-12. Competition salivary cortisol was
significantly lower during holes 31-36 than all other sample periods.
130
7-12 13-18 19-24 25-30 31-36
Hole/Time Point
Figure 4.3: Salivary cortisol area under the curve (AUC) measures for a baseline and competition. Values are means (± S.E.). * Significant (p < 0.05) difference observed between baseline and competition conditions during sample period, (a) Significant difference observed between pre baseline salivary cortisol all other baseline sample periods, (b) Significant difference observed between competition salivary cortisol sample periods pre and 1-6 and all other competition sample periods, (c) Baseline salivary cortisol at sample periods 7- 12, 25-30 and 31-36 was significantly lower than salivary cortisol during sample period 1-6. (d) Significant difference observed between competition salivary cortisol sample periods 13-18 and 7-12. (e) Significant difference observed between competition salivary cortisol during sample period 31-36 and salivary cortisol during all other competition sample periods.
No statistical analysis was performed on individual sample period or hole samples.
However the mean and standard error salivary cortisol values for each sample period are
presented in figure 4.4. Figures for baseline and competition exhibit a normal circadian
pattern, with afternoon samples being lower than morning samples [84].
Figure 4.4: Salivary cortisol measures for baseline and competition. Values are means (± S.E.).
Salivary Testosterone
These 6-hole AUC values were used for statistical analyses. No significant
competition vs. baseline effect was noted. However, a significant hole or time point
effect (F (6, 42) = 3.65, p < 0.003) was noted from the ANOVA. No significant
interaction was noted between baseline or competition testosterone measures and time of
day or hole.
Figure 4.5 displays significant pairwise differences between pre-round baseline
and competition salivary testosterone measures only at sample period 25-30.
Additionally, pre and 1-6 sample period baseline salivary testosterone was significantly
higher than sample periods 19-24, 25-30, and 31-36 baseline salivary testosterone. Also,
sample period 1-6 baseline salivary testosterone was significantly higher than baseline
sample period 13-18 salivary testosterone. No significant differences were observed
between any sample periods for competition salivary testosterone. However, there is a
132
trend toward a typical circadian rhythm as each competition sample period is lower than
the previous competition sample period with the exception of sample periods 7-12 and
25-30.
D Baseline B Competition ^ =d 3.7 n o E 3.5- c ^ 3.3- c „ , a h
T
o 3.1 -
« 2.9- 1 a
o S |
■55 2.7 - fl ' j ( * 0) r ll
« 2.3- n II
11 (i
• i i l2-1- ■ ll _ _ "1 ^S
^ Q p m 1 .*J 1 1 1 1 i ^
Pre 1-6 7-12 13-18 19-24 25-30 31-36
h lole/T me Po int
Figure 4.5: Salivary testosterone area under the curve (AUC) measures for baseline and competition. Values are means (± S.E.) *Significant difference observed between baseline and competition conditions. (a) Baseline salivary testosterone was significantly higher than sample periods 19- 24, 25-30, and 31-36 baseline salivary testosterone. (b) Significantly higher than baseline 13-18 sample period salivary testosterone
No statistical analysis was performed on individual sample period or hole samples.
However the mean and standard error salivary cortisol values for each sample period are
presented in figure 4.6. Figures exhibit a normal, circadian pattern [84].
Figure 4.6: Salivary testosterone measures for baseline and competition. Values are means (± S.E.).
Salivary T/C Ratio
Significant competition vs. baseline effect (F(l,7) = 41.545, p < 0.001) and a
significant hole or time point effect (F(6, 42) = 9.85, p < 0.01) was noted from the
ANOVA. No significant interaction was noted between baseline or competition T/C ratio
and time of day or hole.
Significant pairwise differences were noted between baseline and competition
salivary T/C ratio at all sample periods (Figure 4.7). T/C ratio for the baseline sample
period pre was significantly lower than all other sample periods. T/C ratio for baseline
sample period 1-6 was significantly lower than baseline sample period 19-24. T/C ratio
for competition sample period pre was significantly lower than competition sample
periods 7-12 and 13-18. T/C ratio for competition sample period 31-36 was significantly
higher than competition sample periods 1-6 and 25-30.
134
D Baseline B Competition
n DC "5 w r o ü o 0) c o
(0 o w ffi I-
B
1-6 7-12 13-18 19-24 25-30 31-36
Hole/Time Point
Figure 4.7: T/C ratio AUC measures for a baseline and competition. Values are means (± S.E.). * A significant (p < .05) difference was observed between baseline and competition conditions, (a) Baseline T/C ratio was significantly lower than all subsequent baseline sampling periods, (b) T/C ratio for competition sample period pre was significantly lower than competition sample periods 7-12 and 13-18. (c) Baseline T/C ratio significantly lower than baseline sampling period 19-24. (d) T/C ratio for competition sample period 31-36 significantly higher than competition sample periods 1-6 and 25-30.
No statistical analysis was performed on individual sample period or hole samples.
However the mean and standard error salivary cortisol values for each sample period are
Figure 4.9: Physical fatigue AUC measures for baseline and competition. A lower score indicates a greater level of perceived fatigue. Values are means (± S.E.) * A significant (p < 0.05) difference was observed between baseline and competition conditions, (a) Significantly lower than all previous competition time periods.
Perceived Mental Fatigue
There was no significant competition vs. baseline perceived mental fatigue effect.
However, there was a significant effect (F(l,5) = 6.91, p < 0.001) of mental fatigue by
hole/time period. No significant interaction was noted between baseline or competition
perceived mental fatigue measures and time of day or hole.
Significant pairwise differences were noted between baseline and competition
perceived mental fatigue only at sample period 31-36 (Figure 4.10). There were no
significant pairwise differences between any baseline perceived mental fatigue time
periods. For competition perceived mental fatigue measures, sample periods 25-30 and
31-36 were significantly higher (lower numerically) than all previous competition
perceived mental fatigue time periods. Competition perceived mental fatigue sample
137
period 19-24 was significantly greater (lower numerically) than competition sample
periods 1-6 and 7-12. Competition perceived mental fatigue sample period 13-18 was
significantly greater (lower numerically) than competition sample period 1-6.
DBaseline ■Competition
65
£ 60 o (O 55 Q)
a so £ 45
5 40 c g 35
30
- " -1 L' •i ■*■ ft A
a b
i if *
C J *
Ä C ■ 1 IS»*
- 11 1 I 1
^ i
". 1 1-6 7-12 13-18 19-24
Hole/Time Point
25-30 31-36
Figure 4.10: Mental fatigue AUC measures for a baseline and competition. A lower score indicates a greater level of perceived fatigue. Values are means (± S.E.). * A significant (p < 0.05) difference was observed between baseline and competition conditions, (a) Significantly lower than competition sample periods 1- 6. (b) Significantly lower than competition sample periods 1-6 and 7-12. (c) Significantly lower than all previous competition time periods.
Correlations Among Measures
Correlations During Competition
Pearson Product Moment Correlation Coefficients were computed to examine the
relationship between 36-hole AUC biochemical measures and normalized 36-hole
performance. For cortisol, testosterone, and T/C ratio, differences between competition
and baseline measures were summed across all 36 samples to compute one 36-hole AUC
138
value for each biochemical measure per subject. Thirty six-hole AUC T/C ratio
difference was significantly (p < 0.05) correlated with 36-hole golf score (r = 0.82).
Lower 36-hole AUC T/C ratio difference measures were associated with lower 36-hole
golf scores (Figure 4.11). There was a trend towards a positive correlation between 36-
hole AUC testosterone (r = 0.68, p = 0.06) difference and 36-hole score and a negative
correlation between 36-hole AUC cortisol difference and 36-hole score (r = -0.41, p =
0.31); however, correlations were not significant.
Table 4.1: Pearson product moment correlations between 36-hole AUC biochemical measure responses, perceived fatigue, and 36-hole performance
36-Hole . y. T/C ratio Testosterone performance n.„° T^-^C Difference Difference
* Correlation is significant at the p < 0.05 level (2-tailed). T/C ratio difference = difference between competition and baseline 36 AUC T/C ratio Cortisol difference = difference between competition and baseline 36 AUC cortisol Testosterone Difference = difference between competition and baseline 36 AUC testosterone
139
0)
o u u> o o
(O CO
y = 5.5858X + 154.29
R2 = 0.6703 165 n
160-
155;
♦
^t-*" ^"l50 -
♦ ♦ 145-
1 1
140 -
, 435- i i
-3 -2.5 -2 -1.5 -1 -0.5 0 Testosterone-to-Cortisol Ratio (nmol/L)
36-hole AUC Difference (Competition - Baseline)
0.5
Figure 4.11: Net 36-hole score plotted against 36-hole AUC T/C ratio difference (competition minus baseline).
Pre-round Correlations
Pearson Product Moment Correlation Coefficients were also computed to examine
the relationship between pre-round biochemical measures, CSAI-2 components, and 36-
hole performance (Table 4.2). Pre-round cortisol difference was significantly positively
correlated to CSAI-2 Somatic Anxiety (r = 0.81, p < 0.05) (Figure 4.12). Pre-round
testosterone difference was significantly negatively correlated to CSAI-2 Somatic
Anxiety (r = -0.80, p < 0.05) and significantly positively correlated to 36-hole
performance (r = 0.71, p < 0.05). Additionally, pre-round cortisol difference was
negatively correlated (r = -.81, p < .05) to pre-round testosterone difference. Competition
T/C ratio difference was negatively correlated to CSAI-2 Somatic Anxiety (r = -0.72, p <
0.05) and positively correlated to 36-hole performance (r = 0.82, p < 0.05). A lower
performance score meant a better golf performance, so higher pre-round T/C ratio
difference and testosterone difference measures were related to worse golf performance.
140
Table 4.2: Pearson product moment correlations between pre-round biochemical measures, CSAI-2 components, and 36-hole performance
Testostero 36-Hole
performance CSAI-2
Self Cognitive Somatic T/C Ratio Confidence Anxiety Anxiety Difference T^.„
Difference
ACortisol -0.36 0.39 -0.57 -0.10 0.81* -0.78*
ATestosterone 0.71* -0.45 0.16 0.32 -0.80* 0.94*
T/C Ratio Difference
0.82* -0.36 0.11 0.39 -0.72*
Somatic Anxiety -0.51 0.75* -0.31 0.02
Cognitive Anxiety
0.61 0.51 -0.18
Self Confidence -0.15 0.09
CSAI-2 -0.17
-0.81"
*Correlation is significant at the p < 0.05 level (2-tailed) T/C ratio difference = difference between competition and baseline 36 AUC T/C ratio Cortisol difference = difference between competition and baseline 36 AUC cortisol Testosterone Difference = difference between competition and baseline 36 AUC testosterone
y = 0.1441x+ 18.087 24 -
Q R2 = 0.661 22 -
20 - >■
"5 c <
♦ 1^
^16* o n E o ♦
♦ 14 -
12 -
-60 -4G-
-40 -20 0 20
Pre-round Cortisol Difference (nmol/L)
40
Figure 4.12: Pre-round CSAI-2 Somatic Anxiety Score plotted against pre-round cortisol difference (competition minus baseline).
141
Pearson product moment correlation coefficients were also computed to examine the
relationship between biochemical measures, individual hole and 6-hole AUC
performance. There were no significant correlations between performance and
testosterone or cortisol measures.
Discussion
This investigation is pioneer, no known previous investigations have studied the
sum of testosterone or cortisol responses during an extended sport competition. Most
investigations have reported pre- and post-endocrine measurements and related them to
following or preceding performance. Additionally, the testosterone response during
competitive golf has not been investigated.
Several notable findings resulted from this investigation. The primary finding
was significant elevation in salivary cortisol in competitive golf compared to a baseline
condition and no significant change in salivary testosterone from the baseline to
competitive golf condition. This resulted in a significant decrease in T/C ratio throughout
the competition. A high positive correlation (r = 0.82, p < 0.05) between 36-hole AUC
T/C ratio and 36-hole score was noted. Additionally, there was a high positive
correlation between pre-round testosterone (r = 0.82, p < 0.05), T/C ratio (r = 0.71, p <
0.05) response and 36-hole score. Lastly, there was a strong positive correlation between
CSAI-2 somatic anxiety and pre-round cortisol response (0.81, p < 0.05) and a strong
142
negative correlation between pre-round testosterone (-0.80. p < 0.05) and T/C ratio (-0.72,
p < 0.05) and CSAI-2 somatic anxiety.
Salivary steroid values of subjects in this investigation are similar to previously
reported values. Baseline salivary testosterone values in this investigation averaged
across subjects and sample periods (0.38 nmol/L) are comparable to values reported for
100 male college students (0.34 nmol/L) [32]. Early morning (38.6 nmol/L) and evening
(6.1 nmol/L) baseline salivary cortisol values in this investigation averaged across
subjects are comparable to previously reported early morning (25.5 nmol/L) and evening
(6.1 nmol/L) baseline salivary cortisol values reported for 100 male college students
[182].
Salivary Cortisol and Testosterone Response During Competition
Salivary cortisol measures during 36-holes of competitive golf (19.0 nmol/L) were
significantly elevated an average of 111% from baseline (9.0 nmol/L) salivary cortisol
measures. McKay and colleagues reported a similar elevation in cortisol response during
competitive golf [126]. Results from this investigation confirm the finding that competitive
golf is a significant activator of the HPAA. Elevations in cortisol serum concentration have
been noted in anticipation of, or response to, psychological Stressors [6, 84, 115] or physical
exertion of 70% of VC^max or higher [35, 114]. Investigators report golf to require physical
exertion of only 43% to 55% of V02max [111]. Therefore any elevation in cortisol during
golf performance may be presumed to be the result of psychological or competitive stress.
Further evidence for this conclusion is that there was no difference between baseline and
143
competition salivary cortisol measures over the final six holes when physical and mental
fatigue were the greatest.
Testosterone was elevated in competitive golf (0.42 nmol/L) vs. baseline (0.39
nmol/L). However differences were not statistically significant except when comparing
pairwise between competition (0.40 nmol/L) and corresponding baseline (0.33 nmol/L)
AUC testosterone values for holes 25-30. This increase in testosterone late in the round
may have been due to a reduction in stress (cortisol). Decreasing cortisol may have
reduced inhibition of testosterone production [166]. Investigators have noted increases in
testosterone from baseline measures to post-athletic competition in wrestling, pistol-
shooting, and judo competition [38, 52, 97, 169], while others have reported no change
from pre to post-wrestling or judo competition [42, 49, 143, 144]. Interestingly, all
investigations reporting rises in testosterone from pre- to post-competition measured
serum testosterone, while those reporting no change measured salivary testosterone. This
may reflect differences between biocompartments and should be studied further.
Pre-competition Salivary Cortisol and Testosterone Response
Contrary to hypothesis, pre-round cortisol measures were not significantly
elevated from the baseline to competitive golf condition. These results agree with only
one previous investigation with basketball players [49]. However, most previous
investigators have reported anticipatory cortisol rises prior to competition in tennis
Following strength, power and flexibility training:
1. Strength, trunk power, and trunk flexibility will increase.
• Finding: Significant (p < 0.05) increases were noted for all strength,
152
power, and flexibility tests from pre to post training: grip strength (7.3%);
bench press (10.2%); lat pull (12.6%); squat (13.3%); and shoulder press
(23.6%); rotational power (19.9%); and trunk rotation flexibility (12.3%).
2. Swing mechanics will not change.
• No consistent trends were noted. Concluded changes in clubhead speed
were due to increased muscle power supplied by the golfer, not changes in
mechanics.
3. Clubhead speed will increase.
• Finding: Mean clubhead speed for the intercollegiate men and women golfers
increased (1.6%) significantly (p < 0.05) from 47.3 to 48.0 m/s equating to
approximately a 4.9-meter increase in driving distance. This increase in
clubhead speed is lower than previously reported increases in clubhead speed
or distance of 4 to 7% in predominantly recreational male golfers following
resistance and flexibility training [64, 74, 103, 106, 168,190, 193, 194].
4. Consistency will improve.
• Finding: No significant differences were observed between pre- and post-
training values for clubface-angle or launch-angle deviation.
5. Putting distance control will improve following strength, power and flexibility
training.
• Finding: Putting distance control significantly (p < 0.05) improved from
pre to post-training for the men-only group (29.6%), while there was no
significant difference in putting distance control for the total and women-
153
only groups
6. Strength, trunk power, and trunk flexibility measures will be positively correlated
to clubhead speed.
• Pearson r correlation analysis resulted in only one significant (p < 0.05)
correlation between clubhead speed and rotational power (r = 0.86).
Conclusions
Competitive, recreational, and especially collegiate golfers have limitations on
practice time. It is valuable to know the effects of different training methods in order to
effectively allocate practice time. These results indicate that 11 weeks of physical
conditioning increased clubhead speed without a negative effect on consistency or putting
distance control in elite men and women golfers. Clubhead speed in elite men and
women golfers increased to a lesser degree than in previously reported studies with less
skilled golfers. This highlights the importance of creating golf and individual specific
conditioning programs. Strength and power appear to be an important factor in
generating clubhead speed and skilled men and women golfers should engage in weight
training, stretching, and rotational power training to improve golf performance.
Recommendations for Future Study
A three-dimensional motion analysis of golfers before and after a strength-training
program would provide a more sensitive means for detecting changes in technique due to
physical conditioning. Also, a back-swing-side sagittal or down-the-line view would
154
have provided opportunity for qualitative analysis of additional important swing elements
such as swing plane and postural changes.
Due to the short duration of the training, most of the gains in strength in this
investigation were likely due to neural adaptations [160]. A longer training period may
cause increases in muscle size and strength, which may have different effects on swing
mechanics, clubhead speed, and putting distance control.
The short time period available for training did not allow for a fully periodized
training program. The athletes were not able to train at lower repetition maximum loads
(1 to 7 RM) more optimal for strength and power development. The strength coach did
not feel the athletes had an adequate strength-training base to progress to these higher
intensities in the first 8 weeks of training. Ideally, more time in training would allow a
longer linear or non-linear periodized training program that might elicit greater strength
and power gains and greater performance gains. Additionally, it would be valuable to
investigate the effects of an in-season resistance-training program on performance.
However, the rigorous competition, travel, and academic schedule of subjects
participating in this study would not allow continuation of the training into the
competitive season.
Previous studies using baseball batting and pitching have documented greater
increases in performance when rotational medicine ball throws were performed in
addition to traditionally resistance training. A similar study with golfers would produce
valuable information for developing golf-specific training programs.
155
Study #2:Salivary Cortisol, Testosterone, and T/C Ratio
Responses During a 36-hole Golf Competition
Summary
The purpose of this investigation was to study the effects of 36 continuous holes
of competitive golf on salivary testosterone, cortisol, and testosterone-to-cortisol ratio and
their relation to performance in elite male competitive collegiate golfers. Subjects were
eight NCAA Division I men golfers. Saliva samples were taken 45 minutes prior to the
round and after each hole during a 36-hole competition. Time matched baseline samples
were collected to account for circadian rhythm. The Competitive State Anxiety
Inventory-2 (CSAI-2) was used to measure pre-round self-reported state anxiety.
Hypotheses
1. Salivary cortisol will be higher in golf tournament competition than a baseline
condition.
• Salivary cortisol measures during 36-holes of competitive golf (19.0 nmol/L)
were significantly (p < 0.05) elevated an average of 111% from baseline (9.0
nmol/L) salivary cortisol measures.
2. Salivary testosterone will not change in golf tournament competition compared to
a baseline condition.
• Testosterone was elevated in competitive golf (0.42 nmol/L) vs. baseline (0.39
nmol/L). However differences were not statistically significant except when
156
comparing pairwise between competition (0.40 nmol/L) and corresponding
baseline (0.33 nmol/L) AUC testosterone values for holes 25-30.
3. T/C ratio will be lower in golf tournament competition than a baseline condition.
• T/C ratios in competition (0.026) were an average of 45% below baseline T/C
ratio values (0.048).
4. Perceived fatigue will be greater during competition than baseline.
• Greater fatigue later in golf round compared to baseline.
5. Salivary cortisol will be negatively correlated to performance.
• No significant correlation was noted between salivary cortisol and golf
performance.
6. Salivary T/C ratio will be positively correlated to performance.
• A high positive correlation (r = 0.82, p < 0.05) between 36-hole T/C ratio and
36-hole score was noted.
7. Pre-round salivary cortisol will be positively correlated to pre-competition
somatic anxiety as measured by the CSAI-2.
• There was a strong positive correlation between CSAI-2 somatic anxiety (r =
.81, p < 0.05) and pre-round cortisol response
8. Pre-round salivary testosterone will be elevated in competition compared to
baseline.
• Pre-round salivary testosterone did not change from baseline to competition
9. Pre-round salivary cortisol will be elevated in competition compared to baseline
• Pre-round salivary cortisol did not change from baseline to competition
157
Conclusion
36-holes of competitive golf exposed the body to almost 10 hours of hormonal
stress. Cortisol is elevated and testosterone-to-cortisol ratio is decreased for most of the
competitive round. The effects on health and subsequent performance are unknown.
Results also indicated a significant positive correlation of 36-hole golf score with
pre-round testosterone and the 36-hole AUC T/C ratio response. Mechanisms for this
relationship are unclear. High testosterone and aggressive, dominating moods may not
be facilitative to golf performance, and better performers may be more stressed or
concerned about their performance, reducing T/C ratio throughout the round.
Recommendations for Future Study
Tracking physiological measures of stress, fatigue, and performance over the days
and hours following 36 holes of competitive golf may produce valuable information for
golfers. A similar study was done with wrestlers and testosterone and T/C ratio were
elevated for five days following the competition. Also, subjects reported high levels of
perceived fatigue [144].
Blood glucose levels throughout 36-holes of golf competition may provide
valuable information for nutrient intake during competitive golf. Finger sticks might be a
feasible way to measure this in future investigations.
The alarm reaction to a Stressor or sympathetic nervous system activity was not
investigated and obviously plays a role in golf performance. Salivary amylase levels are
158
indication of sympathetic nervous system activity [21] and could be studied similarly to
testosterone and cortisol in this investigation.
Repeating this investigation during the final round of a competition may produce
different results. Final round psychological stress may be lower or higher depending on
the standing of the individual and team in the competition. Additionally, more clear
winners and losers may allow for a better comparison with post-round endocrine
response.
A combination of the two studies presented in this dissertation may also be a
valuable avenue for future research. Resistance and endurance training may have an
effect on endocrine stress response, possibly causing stress-response alterations during
competitive golf. Kraemer and colleagues (1999) demonstrated that chronic resistance
training reduces resting cortisol levels in older men, without an increase in ACTH
concentration [94]. Reduced hormonal response to Stressors has also been noted in elite
endurance athletes versus sedentary controls [130].
159
References
1. ADLERCREUTZ, H., M. HARKONEN, K. KUOPPASALMI, H. NAVERI, I. HUHTANIEMI,
H. TIKKANEN, K. REMES, A. DESSYPRIS, and J. KARVONEN. Effect of training on plasma anabolic and catabolic steroid hormones and their response during physical exercise. Int JSports Med. 7 Suppl 1:27-28., 1986.
2. ADLINGTON, G. S. Proper swing technique and biomechanics of golf. Clinics in- sports medicine. 15:9-26, 1996.
3. ALMON, R. R. and D. C. DUBOIS. Fiber-type discrimination in disuse and glucocorticoid-induced atrophy. Med Sei Sports Exerc. 22:304-311., 1990.
4. ALPENFELS, E. Common pre-swing and in-swing tendencies of amateur golfers. In: Science and Golf II: Proceedings of the Second World Scientific Congress of Golf. A. J. Cochran and M. R. Farrally (Eds.) London: E & FN Spon, 1994, pp. 103-108.
5. ANDERSON, T. and J. T. KEARNEY. Effects of three resistance training programs on muscular strength and absolute and relative endurance. Res Q Exerc Sport. 53:1-7., 1982.
6. ARTHUR, A. Z. Stress as a state of anticipatory vigilance. Percept Mot Skills. 64:75-85., 1987.
7. BABINEAU, J. E. Golfweek website, www.golfweek.com, Golfweek Collegiate Golf Rankings. Available at: www.golfweek.com Accessed, 2001.
8. BAECHLE, T. R. and R. W. EARLE (Eds.). Essentials of Strength Training and Conditioning. Champaign, EL: Human Kinetics, 2000.
9. BANFI, G, M. MARINELLI, G. S. ROI, and V. AGAPE. Usefulness of free testosterone/cortisol ratio during a season of elite speed skating athletes. IntJ Sports Med. 14:373-379., 1993.
10. BARRENTINE, S. W., G. S. FLEISIG, H. JOHNSON, and T. W. WOOLLEY. Ground reaction forces and torques of professional and amateur golfers. In: Science and Golf II: Proceedings of the Second World Scientific Congress of Golf A. J. Cochran and M. R. Farrally (Eds.) London: E. & F. N. Spon, 1994, pp. 33-39.
11. BATT, M. E. A survey of golf injuries in amateur golfers. Br J Sports Med. 26:63- 65., 1992.
160
12. BATUMAN, O. A., D. SAJEWSKI, J. E. OTTENWELLER, D. L. PITMAN, and B. H. NATELSON. Effects of repeated stress on T cell numbers and function in rats. Brain Behav Immun. 4:105-117., 1990.
13. BECHLER, J. R., F. W. JOBE, M. PINK, J. PERRY, and P. A. RUWE.
Electromyographic analysis of the hip and knee during the golf swing. Clin J SportMed. 5:162-166., 1995.
14. BOOTH, A., G. SHELLEY, A. MAZUR, G. THARP, and R. KITTOK. Testosterone, and winning and losing in human competition. Horm Behav. 23:556-571., 1989.
15. BOYLE, N. Immunoregulation of Interleukin-1 and Interactions with Plasma Corticosteroids. hi: Stress Effects on Central and Peripheral Systems: A Primer. P. H. Pfister (Ed.) Brisbane, Australia: Australian Academic Press, 1992.
16. BURKE, R. E. The control of muscle force: motor unit recruitment and firing patterns. In: Human Muscle Power. N. L. Jones, M. McCartney, and A. J. McComas (Eds.) Champaign, IL: Human Kinetics, 1986, pp. 97-106.
17. BURTON, D. DO anxious swimmers swim slower? Reexamining the elusive anxiety performance relationship. The journal of sport and exercise psychology USA. 10:45-61,1988.
18. CATTELL, R. B. and I. H. SCHEIER. Stimuli related to stress, neuroticism, excitation, and anxiety response patterns: Illustrating a new multivariate experimental design. Journal of Abnormal and Social Psychology. 60:195-204, 1960.
19. CHAO, E. Y., W. P. COONEY, T. D. CAHALAN, and K. TAMAI. Biomechanics of golf swing and a comparison of club handle design. Biomedical sciences instrumentation. 23:23-27, 1987.
20. CHAPMAN, C, A. M. LANE, J. H. BRIERLEY, and P. C. TERRY. Anxiety, self- confidence and performance in Tae Kwon-Do. Percept Mot Skills. 85:1275-1278., 1997.
21. CHATTERTON, R. T., JR., K. M. VOGELSONG, Y. C. LU, and G A. HUDGENS.
Hormonal responses to psychological stress in men preparing for skydiving. J Clin Endocrinol Metab. 82:2503-2509., 1997.
22. CHEETHAM, P. J., P. E. MARTIN, R. E. MOTTRAM, and B. F. ST.-LAURENT. The importance of stretching the Xfactor in the golf downswing - abstract, 2000
23. CLOW, A. and F. HUCKLEBRIDGE. The impact of psychological stress on immune function in the athletic population. Exerc Immunol Rev. 7:5-17, 2001.
24. COCHRAN, A., J. STOBBS, D. NOBLE, C. B. DAISH, and W. F. FLOUD. Search for the perfect swing: an account of the Golf Society of Great Britain Scientific Study. Heinemann, London, cl968, xiii. 242, 1968.
25. COCHRAN, A. J. Club face flexibility and coefficient of restitution, 1999 26. CONROY, B. P., W. J. KRAEMER, C. M. MARESH, S. J. FLECK, M. H. STONE, A. C.
FRY, P. D. MILLER, and G P. DALSKY. Bone mineral density in elite junior Olympic weightiifters. Med Sei Sports Exerc. 25:1103-1109., 1993.
27. COOK, D., B. GANSNEDER, R. ROTELLA, C. MALONE, L. BUNKER, and D. OWENS.
Relationship among competitive state anxiety, ability and golf performance. Journal of Sport Psychology. 5:460-465, 1983.
161
28. COOK, N. J., G. F. READ, R. F. WALKER, B. HARRIS, and D. RIAD-FAHMY.
Changes in adrenal and testicular activity monitored by salivary sampling in males throughout marathon runs. Eur JAppl Physiol Occup Physiol. 55:634-638,1986.
29. COOPER, M. A. J. and J. S. B. MATHER. Categorization of golf swings. In: Science and Golf II: Proceedings of the Second World Scientific Congress of Golf M. R. Farrally and A. J. Cochran (Eds.) London: E & FN Spon, 1994, pp. 65-70.
30. CORRIGAN, C. Whippy or stiff- which shafts are better for you? Golf journal 32(4), Jul 1979, 16 18, Total Pages: 3, 1979.
31. CUMMING, D. C, M. E. QUIGLEY, and S. S. YEN. Acute suppression of circulating testosterone levels by cortisol in men. JClin Endocrinol Metab. 57:671-673., 1983.
32. DABBS, J. M., JR. Salivary testosterone measurements in behavioral studies. In: Saliva as a diagnostic fluid. D. Malamud and L. Tabak (Eds.) New York: New York Academy of Sciences, 1993, pp. 177-183.
33. DABBS, J. M., JR., B. C. CAMPBELL, B. A. GLADUE, A. R. MIDGLEY, M. A. NAVARRO, G. F. READ, E. J. SUSMAN, L. M. SWINKELS, and C. M. WORTHMAN.
Reliability of salivary testosterone measurements: a multicenter evaluation. Clin Chem. 41:1581-1584., 1995.
34. DAVIDSON, J. D. and T. T.J. Determinants of success among professional golfers. Research Quarterly. 57:60-67, 1986.
35. DA VIES, C. T. and J. D. FEW. Effects of exercise on adrenocortical function. J ApplPhysiol. 35:887-891., 1973.
36. DILLMAN, C. J. and G. W. LANGE. HOW has biomechanics contributed to the understanding of the golf swing? In: Science and Golf II: Proceedings of the 1994 World Scientific Congress of Golf A. J. Cochran and M. R. Farrally (Eds.) London: E & FN Spon, 1994, pp. 3-13.
37. EDWARDS, S., P. EVANS, F. HUCKLEBRIDGE, and A. CLOW. Association between time of awakening and diurnal cortisol secretory activity. Psychoneuroendocrinology. 26:613-622., 2001.
38. ELIAS, M. Serum cortisol, testosterone, and testosterone-binding globulin responses to competitive fighting in human males. Aggressive Behavior. 7:215- 224,1981.
39. ENDLER, N. S. Interaction model of anxiety: some possible implications. In: Psychology of Motor Behaviour and Sport. D. M. a. C. Landers, R.W (Ed.) Champaign, IL: Human Kinetics, 1977, pp. 332-351.
40. ENGELHARDT, G. M. Differences in shot-making skills among high and low money winners on the PGA tour. Perceptual and Motor Skills. 84:1314,1997.
. 41. EVANS, P. J., J. R. PETERS, J. DYAS, R. F. WALKER, D. RIAD-FAHMY, and R. HALL. Salivary cortisol levels in true and apparent hypercortisolism. Clin Endocrinol (Oxf). 20:709-715., 1984.
42. FILAIRE, E., M. SAGNOL, C. FERRAND, F. MASO, and G LAC. Psychophysiological stress in judo athletes during competitions. J Sports MedPhys Fitness. 41:263- 268., 2001.
43. FISHER, L. A. Corticotropin-releasing factor: endocrine and autonomic integration
162
of responses to stress. Trends Pharmacol Sei. 10:189-193., 1989. 44. FLECK, S. J. and W. J. KRAEMER. Designing Resistance Training Programs.
Champaign, IL: Human Kinetics, 1999 45. FRANCIS, K. T. The relationship between high and low trait psychological stress,
serum testosterone, and serum cortisol. Experientia. 37:1296-1297., 1981. 46. FRISWELL, M. I., J. E. MOTTERSHEAD, and M. G. SMART. Dynamic models of golf
clubs. Sports engineering. 1:41-50,1998. 47. FRY, A. C, W. J. KRAEMER, S. J. FLECK, N. T. TRIPLETT MCBRIDE, L. P. KOZIRIS,
and S. E. GORDON. The effects of competitive wrestling success on acute hormonal responses. (Abstract). Journal of strength and conditioning research. 15:1,2001.
48. GARRISON, L. E. Electromyographic - cinematographic study of muscular activity during the golf swing. Thesis. Florida State University 1963.
49. GONZALEZ-BONO, E., A. SALVADOR, M. A. SERRANO, and J. RICARTE.
Testosterone, cortisol, and mood in a sports team competition. Horm Behav. 35:55-62., 1999.
50. GOODMAN, H. M. Basic Medical Endocrinology. Second ed. New York: Lippincott-Raven Publishers, 1994
51. GOULD, D., L. PETLICHKOFF, J. SIMONS, and M. VEVERA. Relationship between competitive state anxiety inventory-2 and pistol shooting performance. Journal of Sport Psychology. 9:33-42, 1987.
52. GUEZENNEC, C. Y., J. P. LAFARGE, V. A. BRICOUT, D. MERINO, and B. SERRURIER. Effect of competition stress on tests used to assess testosterone administration in athletes. IntJSports Med. 16:368-372., 1995.
53. GWYN, R. G. and C. E. PATCH. Comparing two putting styles for putting accuracy. Perceptual and motor skills. 76:387-390, 1993.
54. GWYN, R. G, F. ORMOND, and C. E. PATCH. Comparing putters with a conventional blade and a cylindrically shaped clubhead. Perceptual and motor skills. 82:31-34, 1996.
55. HACKFORT, D. and C. D. SPIELBERGER. Sport-related anxiety: current trends in theory and research. In: Anxiety in sports - an international perspective. D. Hackfort and C. D. Spielberger (Eds.) New York: Hemisphere Publishing, 1989, pp. 261-267.
56. HäKKINEN, K. and P. V. KOMI. Changes in electrical and mechanical behavior of leg extensor muscles during heavy resistance strength training (Les modifications des comportements electrique et mecanique des muscles extenseurs de la jambe au cours d' un entrainement de musculation a haute resistance). Scandinavian journal of sports sciences FINLANDE. 7:55-64,1985a.
57. HäKKINEN, K. and P. KOMI. The Effect of Explosive Type Strength Training on Electromyographic and Force Production Characteristics of Leg Extensor Muscles During Concentric and Various Stretch-Shortening Cycle Exercises. Scandinavian Journal of Sports Science. 7:65-76,1985b.
58. HALE, T. and G. T. HALE. Lies, damned lies and statistics in golf. In: Science in Golf Proceedings of the First World Scientific Congress of Golf. A. J. Cochran
163
(Ed.) New York: E. & F. N. Spon, 1990, pp. 159-164. 59. HARRIS, B., N. J. COOK, R. F. WALKER, G. F. READ, and D. RIAD-FAHMY.
Salivary steroids and psychometric parameters in male marathon runners. Br J Sports Med. 23:89-93., 1989.
60. HAY, J. D. The Biomechanics of Sports Techniques. 4th ed. Englewood Cliffs, New Jersey: Prentice Hall, 1993
61. HAY, J. G. Anatomy, Mechanics and Human Motion. 2nd ed. Englewood Cliffs, New Jersey: Prentice Hall, 1988
62. HELLHAMMER, D. H., W. HUBERT, and T. SCHURMEYER. Changes in saliva testosterone after psychological stimulation in men. Psychoneuroendocrinology. 10:77-81,1985.
63. HENRY, J. P. Biological basis of the stress response. Integr Physiol Behav Sei. 27:66-83., 1992.
64. HETU, F. E., C. A. CHRISTIE, and A. D. FAIGENBAUM. Effects of conditioning on physical fitness and club head speed in mature golfers.:, 1998.
65. HIRAMATSU, R. Direct assay of cortisol in human saliva by solid phase radioimmunoassay and its clinical applications. Clin Chim Acta. 117:239-249., 1981.
66. HOPKINS, W. G., J. A. HAWLEY, and L. M. BURKE. Design and analysis of research on sport performance enhancement. Med Sei Sports Exerc. 31:472-485., 1999.
67. HOSEA, T. M., C. J. GATT, K. M. GALLI, N. A. LANGRANA, and J. P. ZAWADSKY.
Biomechanical analysis of the golfer's back. Science and Golf, Proceedings of the First World Scientific Congress ofGolf.43-48, 1990.
68. HOSEA, T. M. and C. J. GATT, JR. Back pain in golf. Clin Sports Med. 15:37-53., 1996.
69. HUNTER, C. L. Sequence of hip and selected upper extremity joint movements during the golf drive. Univ. of Oregon, Eugene, Ore. 2, 1973.
70. JOBE, F. W., D. R. MOYNES, and D. J. ANTONELLI. Rotator cuff function during a golf swing. Am J Sports Med. 14:388-392., 1986.
71. JOBE, F. W., J. PERRY, and M. PINK. Electromyographic shoulder activity in men and women professional golfers. Am J Sports Med. 17:782-787., 1989.
72. JOBE, F. W., L. A. YOCUM, R. E. MOTTRAM, and M. M. PINK. Exercise guide to better golf. Inglewood, CA: Champion Press, 1994
73. JOBE, F. W. and M. M. PINK. Shoulder pain in golf. Clin Sports Med. 15:55-63., 1996.
74. JONES, D. The Effects of Proprioceptive Neuromuscular Facilitation Flexibility Training on the Clubhead Speed of Recreational Golfers. In Science and Golf III, Proceedings of the 1998 World Scientific Congress of Golf. St Andrews, Scotland: Human Kinetics,, 1998.
75. JORGENSEN, T. On the dynamics of the swing of a golf club. American Journal of Physics. 38:644-651, 1970.
76. KAHN, J. P., D. R. RUBINOW, C. L. DAVIS, M. KLING, and R. M. POST. Salivary cortisol: a practical method for evaluation of adrenal function. Biol Psychiatry.
164
23:335-349., 1988. 77. KANEKO, M., T. FUCHIMOTO, K. TOJI, and K. SUEI. Training Effect of Different Loads on the
Force-Velocity Relationship and Mechanical Power Output in Human Muscle. Scandinavian
Journal of Sports Science. 5:50-55, 1983.
78. KANEKO, Y. and F. SATO. The optimization of golf swing and its application to the golfclub design. In Abstracts of the Internaltional Society ofBiomechanics, XlVth Congress. Paris:, pp. 652-653, 1993.
79. KANWAR, K. and R. V. CHOWGULE. One move to better ball flight. In: Science and GolfII: Proceedings of the Second World Scientific Congress of Golf A. J. Cochran and M. R. Farrally (Eds.) London: E & FN Spon, 1994, pp. 97-102.
80. KAO, J. T., M. PINK, F. W. JOBE, and J. PERRY. Electromyographic analysis of the scapular muscles during a golf swing. Am J Sports Med. 23:19-23., 1995.
81. KAWASHIMA, K., T. MESHIZUKA, and S. TAKESHITA. A kinematic analysis of foot force exerted on the soles during the golf swing among skilled and unskilled golfers. Science and Golf III, Proceedings of the 1998 World Scientific Congress of Golf 1998.
82. KHAN-DAWOOD, F. S., J. K. CHOE, and M. Y. DA WOOD. Salivary and plasma bound and "free" testosterone in men and women. Am J Obstet Gynecol. 148:441- 445., 1984.
83. KHANSARI, D. N., A. J. MURGO, and R. E. FAITH. Effects of stress on the immune system. Immunol Today. 11:170-175., 1990.
84. KIRSCHBAUM, C. and D. H. HELLHAMMER. Salivary cortisol in psychobiological research: an overview. Neuropsychobiology. 22:150-169, 1989.
85. KNUTTGEN, H. G. and W. J. KRAEMER. Terminology and Measurement in Exercise Performance. Journal of Applied Sport Science Research. 1:1-10, 1987.
86. KOENIG, G., M. TAMRES, and R. W. MANN. An analysis of the kinetics and kinematics of the golf swing, hi: Science and Golf II: Proceedings of the Second World Scientific Congress of Golf. M. R. Farrally and A. J. Cochran (Eds.) London: E & FN Spon, 1994, pp. 40-45.
87. KOHLMAIER, J. T. Coordination in golf swing: advanced vs. novice golfers.:, 1998.
88. KRAEMER, W. J., L. MARCHITELLI, S. E. GORDON, E. HARMAN, J. E. DZIADOS, R. MELLO, P. FRYKMAN, D. MCCURRY, and S. J. FLECK. Hormonal and growth factor responses to heavy resistance exercise protocols. J Appl Physiol. 69:1442- 1450., 1990.
89. KRAEMER, W. J., S. E. GORDON, S. J. FLECK, L. J. MARCHITELLI, R. MELLO, J. E. DZIADOS, K. FRIEDL, E. HARMAN, C. MARESH, and A. C. FRY. Endogenous anabolic hormonal and growth factor responses to heavy resistance exercise in males and females. Int J Sports Med. 12:228-235., 1991.
90. KRAEMER, W. J., A. C. FRY, B. J. WARREN, M. H. STONE, S. J. FLECK, J. T. KEARNEY, B. P. CONROY, C. M. MARESH, C. A. WESEMAN, N. T. TRIPLETT, and ET AL. Acute hormonal responses in elite junior weightlifters. Int J Sports Med. 13:103-109., 1992.
91. KRAEMER, W. J., N. T. TRIPLETT, A. C. FRY, L. P. KOZIRIS, J. E. BAUER, J. M.
165
LYNCH, T. MCCONNELL, R. U. NEWTON, S. E. GORDON, R. C. NELSON, and H. G. KNUTTGEN. An in-depth sports medicine profile of women college tennis players. Journal of sport rehabilitation. 4:79-98,1995.
92. KRAEMER, W. J., J. S. VOLEK, K. L. CLARK, S. E. GORDON, T. INCLEDON, S. M. PUHL, N. T. TRIPLETT-MCBRIDE, J. M. MCBRIDE, M. PUTUKIAN, and W. J. SEBASTIANELLI. Physiological adaptations to a weight-loss dietary regimen and exercise programs in women. JAppl Physiol. 83:270-279., 1997.
93. KRAEMER, W. J., J. S. VOLEK, J. A. BUSH, M. PUTUKIAN, and W. J. SEBASTIANELLI. Hormonal responses to consecutive days of heavy-resistance exercise with or without nutritional supplementation. JAppl Physiol. 85:1544- 1555., 1998.
94. KRAEMER, W. J., S. J. FLECK, C. M. MARESH, N. A. RATAMESS, S. E. GORDON,
K. L. GOETZ, E. A. HARMAN, P. N. FRYKMAN, J. S. VOLEK, S. A. MAZZETTI, A. C. FRY, L. J. MARCHITELLI, and J. F. PATTON. Acute hormonal responses to a single bout of heavy resistance exercise in trained power lifters and untrained men. Can JAppl Physiol. 24:524-537., 1999.
95. KRAEMER, W. J., P. A. PIORKOWSKI, J. A. BUSH, A. L. GOMEZ, C. C. LOEBEL, J. S. VOLEK, R. U. NEWTON, S. A. MAZZETTI, S. W. ETZWEILER, M. PUTUKIAN, and W. J. SEBASTIANELLI. The effects of NCAA Division I intercollegiate competitive tennis match play on recovery of physical performance in women. Journal of strength and conditioning research. 14:265-272, 2000.
96. KRAEMER, W. J., N. RATAMESS, A. C. FRY, T. TRIPLETT-MCBRIDE, L. P. KOZIRIS,
J. A. BAUER, J. M. LYNCH, and S. J. FLECK. Influence of resistance training volume and periodization on physiological and performance adaptations in collegiate women tennis players. Am J Sports Med. 28:626-633., 2000.
97. KRAEMER, W. J., A. C. FRY, M. R. RUBIN, T. TRIPLETT-MCBRIDE, S. E. GORDON,
L. P. KOZIRIS, J. M. LYNCH, J. S. VOLEK, D. E. MEUFFELS, R. U. NEWTON, and S. J. FLECK. Physiological and performance responses to tournament wrestling. Med Sei Sports Exerc. 33:1367-1378., 2001.
98. KRAHENBUHL, G. S., J. HARRIS, J. STERN, D. J. CREWS, and N. HUBALIK. Stress responses and performance in intercollegiate golfers.:, 1999.
99. KRANE, V. and J. WILLIAMS. Performance and somatic anxiety, cognitive anxiety, and confidence changes prior to competition. Journal of Sport Behavior. 10:47- 56, 1987.
100. KREUZ, L. E., R. M. ROSE, and J. R. JENNINGS. Suppression of plasma testosterone levels and psychological stress. A longitudinal study of young men in Officer Candidate School. Arch Gen Psychiatry. 26:479-482., 1972.
101. LAC, G., N. LAC, and A. ROBERT. Steroid assays in saliva: a method to detect plasmatic contaminations. Arch Int PhysiolBiochim Biophys. 101:257-262., 1993.
102. LAMPSA, M. A. Maximizing distance of the golf drive: an optimal control study. Journal of dynamic Systems, Measurement, and Control:362-367, 1975.
103. LANFORD, E. E. Effect of strength training on distance and accuracy in golf, Univ. of Oregon, Eugene, Ore 1978.
104. LAUBACH, L. L. Comparative muscular strength of men and women: a review of
166
the literature. Aviat Space Environ Med. 47:534-542., 1976. 105. LAUDER, D., J. L. MAYHEW, W. KEMMLER, and J. WEINECK. Repetitions to
fatigue to predict 1-RM bench press, squat, and deadlift in elite European power lifters..
106. LENNON, H. M. Physiological profiling and physical conditioning for elite golfers. In Science and Golf III, Proceedings of the 1998 World Scientific Congress of Golf St Andrews, Scotland: Human Kinetics,, 1998.
107. LEYMARIE, P., M. ROGER, M. CASTANIER, and R. SCHOLLER. Circadian variations of plasma testosterone and estrogens in normal men. A study by frequent sampling. J Steroid Biochem. 5:167-171., 1974.
108. LOWE, B. and L. H. FAIRWEATHER. Centrifugal force and the planar golf swing. In: Science and GolfII: Proceedings of the Second World Scientific Congress of Golf. A. J. Cochran and M. R. Farrally (Eds.) London: E & FN Spon, 1994, pp. 59-64.
109. LUND, R. J. The effects of a torso strengthening and rotational power program vs strength training on angular hip, angular shoulder and linear bat head velocity in male college baseball players. Eastern Washington University, Eugene, OR, 1997.
110. LYTTLE, A. D., G. J. WILSON, and K. J. OSTROWSKI. Enhancing performance: maximal power versus combined weights and plyometrics training. Journal of strength and conditioning research. 10:173-179, 1996.
111. MAGNUSSON, G. Golf: Exercise for Fitness and Health. In Science and Golf III, Proceedings of the 1998 World Scientific Congress of Golf. St Andrews, Scotland: Human Kinetics, pp. 51-57, 1998.
112. MANN, R. and F. GRIFFIN. Swing Like a Pro. New York: Bantam Doubleday Dell Publishing Group, Inc., 1998
113. MARTENS, R., R. VEALEY, and D. BURTON. Competitive Anxiety in Sport. Champaign, IL: Human Kinetics, 1990
114. MASON, D. R. Effects of different weight golf shafts on clubhead velocity prior to contact with the ball. Univ. of Oregon, Eugene, Ore. 2, 1973.
115. MASON, J. W. A review of psychoendocrine research on the sympathetic-adrenal medullary system. Psychosom Med. 30:Suppl:631-653., 1968.
116. MATHER, J. S. B., M. J. SMITH, S. JOWETT, K. A. H. GIBSON, and D. MOYNIHAN.
Application of a photogrammetric technique to golf club evaluation. Sports engineering. 3:37-47, 2000.
117. MAYNARD, I. W. and B. L. HOWE. Interrelations of trait and state anxiety with game performance of rugby players. Perceptual and Motor Skills. 64:599-602, 1987.
118. MAZUR, A. A biosocial model of status in face-to-face primate groups. Social Forces. 64:377-402, 1985.
119. MAZUR, A., A. BOOTH, and J. M. DABBS. Testosterone and chess competition. Social Psychology Quarterly. 55:70-77, 1992.
120. MAZZETTI, S. A., W. J. KRAEMER, J. S. VOLEK, N. D. DUNCAN, N. A. RATAMESS,
A. L. GOMEZ, R. U. NEWTON, K. HäKKINEN, and S. J. FLECK. The influence of direct supervision of resistance training on strength performance. Med Sei Sports
167
Exerc. 32:1175-1184., 2000. 121. MCAULEY, E. State anxiety: antecedent or result of sport performance. Journal of
sport behavior. 8:71-77,1985. 122. MCBRIDE, D. K. Provision of enabling technology in professional sports.
Perceptual and motor skills. 90:1219-1231, 2000. 123. MCCARROL, J. R. and T. J. GIOE. Professional Golfers and the Price They Pay.
Physiology and Sports Medicine. 10:64, 1982. 124. MCCARROLL, J. R., A. C. RETTIG, and K. D. SHELBOURNE. Injuries in the amateur
golfer. Physician andsportsmedicine. 18:122-126, 1990. 125. MCEVOY, K. P. and R. U. NEWTON. Baseball throwing speed and base running
speed: the effects of ballistic resistance training. Journal of strength and conditioning research. 12:216-221,1998.
126. MCKAY, J. M., S. E. SELIG, J. S. CARLSON, and T. MORRIS. Psychophysiological stress in elite golfers during practice and competition. AustJSci Med Sport. 29:55-61., 1997.
127. MCLAUGHLIN, P. A. and R. J. BEST. Three-dimensional kinematic analysis of the golf swing. In Science and Golf II: Proceedings of the Second World Scientific Congress of Golf. London: E & FN Spon,, 1994.
128. MCTEIGUE, M., S. R. LAMB, R. MOTTRAM, and F. PRIOZZOLO. Spine and Hip Motion Analysis during the golf swing. In: Science and Golf II: Proceedings of the Second World Scientific Congress of Golf. M. R. Farrally and A. J. Cochran (Eds.) London: E & FN Spon, 1994, pp. 50-58.
129. MlLBURN, P. D. Summation of segmental velocities in the golf swing. Med Sei Sports Exerc. 14:60-64, 1982.
130. MOYA-ALBIOL, L., A. SALVADOR, R. COSTA, S. MARTINEZ-SANCHIS, E. GONZALEZ-BONO, J. RICARTE, and M. ARNEDO. Psychophysiological responses to the Stroop Task after a maximal cycle ergometry in elite sportsmen and physically active subjects. Int JPsychophysiol. 40:47-59., 2001.
131. MOYNES, D. R., J. PERRY, D. J. ANTONELLI, and F. W. JOBE. Electromyography and motion analysis of the upper extremity in sports. Phys Ther. 66:1905-1911., 1986.
132. MURRAY, P. M. and W. P. COONEY. Golf-induced injuries of the wrist. Clin Sports Med. 15:85-109., 1996.
133. NATIONAL SPORTING GOODS, A. Exercise walking remains America's favorite participant sport, according to NSGA study. NSGA news. 14:4, 2001.
134. NAVARRO, M. A., J. M. GOMEZ, C. M. VILLABONA, and R. BONNIN. Salivary testosterone: a good measure to reflect free testosterone. Arch Intern Med. 147:1189., 1987.
135. NEAL, R. J., B. ABERNETHY, and R. J. BURGESS-LIMERICK. 3D Kinematics and kinetics of the golf swing. International Journal ofBiomechanics. 1:221-232, 1985.
136. NEAL, R. J., B. ABERNETHY, M. J. MORAN, and A. W. PARKER. Expert-novice differences in muscle activity during the golf swing. In Science and Golf Proceedings of the First World Scientific Congress of Golf. St Andrews, Scotland:
168
E. &F.N. Spon„1990. 137. NESBIT, S. M., J.S. COLE, K. A. THARTZELL, OGLESBY, and RADICH. Dynamic
model and computer simulation of a golf swing. In Science and Golf II. St Andrews, Scotland: E & FN Spon, pp. 66-71,1994.
138. NEWTON, R. U. and K. P. MCEVOY. Baseball throwing velocity: a comparison of medicine ball training and weight training. Journal of strength and conditioning research. 8:198-203, 1994.
139. NILSSON, P. M., L. MOLLER, and K. SOLSTAD. Adverse effects of psychosocial stress on gonadal function and insulin levels in middle-aged males. JIntern Med. 237:479-486., 1995.
140. ORLICK, T. and J. PARTINGTON. Mental links to excellence. The Sports Psychologist. 2:105-130, 1988.
141. OVER, R., AND THOMAS, P. Age and skilled psychomotor performance: A comparison of younger and older golfers. International Journal of Aging and Human Development. 41:1-12, 1995.
142. PARCHMAN, L. L. Cinematographical and mechanical analysis of the golf swing of female golfers. University Microfilms, Ann Arbor. 1, 1970.
143. PASSELERGUE, P., A. ROBERT, and G. LAC. Salivary cortisol and testosterone variations during an official and a simulated weight-lifting competition. Int J Sports Med. 16:298-303., 1995.
144. PASSELERGUE, P. and G. LAC. Saliva cortisol, testosterone and T/C ratio variations during a wrestling competition and during the post-competitive recovery period. M JSports Med. 20:109-113., 1999.
145. PELZ, D. Dave Pelz's Putting Bible. New York: Doubleday, 2000 146. PFISTER, H. P. and G. MAFFESONI. Stress induced activation of the endogenous
opioid systems. In: Stress Effects on Central and Peripheral Systems: A Primer. P. H. Pfister (Ed.) Brisbane, Australia: Australian Academic Press, 1992.
147. PFISTER, H. P. and J. L. MUIR. Arousal and Stress: A Consideration of Theoretical Approaches. In: Stress Effects on Central and Peripheral Systems: A Primer. P. H. Pfister (Ed.) Brisbane, Australia: Australian Academic Press, 1992.
148. PINK, M., F. W. JOBE, and J. PERRY. Electromyographic analysis of the shoulder during the golf swing. Am J Sports Med. 18:137-140,, 1990.
149. PINK, M., J. PERRY, and F. W. JOBE. Electromyographic analysis of the trunk in golfers. Am J Sports Med. 21:385-388., 1993.
150. PINK, M. M., F. W. JOBE, L. A. YOCUM, and R. MOTTRAM. Preventative exercises in golf: arm, leg, and back. Clin Sports Med. 15:147-162., 1996.
151. POMPA, B. Shaft tip flex & kick point affect recovery speed. Golfclubmaker. 16:11-12,1993.
152. PORT, K. Serum and saliva cortisol responses and blood lactate accumulation during incremental exercise testing. Int J Sports Med. 12:490-494., 1991.
153. RAGLIN, J. S. Anxiety and sport performance. Exerc Sport Sei Rev. 20:243-274, 1992.
154. REDDY, A. P. Relationships among technical skills and physical fitness of amateur golf players in India. In Science and Golf Proceedings of the First World
169
Scientific Congress of Golf. St Andrews, Scotland: E. & F. N. Spon, pp. 64-69, 1990.
155. RIAD-FAHMY, D., G. F. READ, R. F. WALKER, and K. GRIFFITHS. Steroids in saliva for assessing endocrine function. EndocrRev. 3:367-395., 1982.
156. RlCClO, L. J. Statistical analysis of the average golfer. In: Science in Golf Proceedings of the First World Scientific Congress of Golf A. J. Cochran (Ed.) New York: E & FN Spon, 1990, pp. 153-158.
157. RICHARDS, J., M. FARRELL, and J. KENT. Weight transfer patterns during the golf swing. Research Quarterly. 56:361-365, 1985.
158. ROBINSON, R. L. A study of the correlation between swing characteristics and club head velocity. In: Science and Golf II: Proceedings of the Second World Scientific Congress of Golf. A. J. Cochran and M. R. Farrally (Eds.) London: E & FNSpon, 1994, pp. 84-91.
159. ROSE, R. M., L. E. KREUZ, J. W. HOLADAY, K. J. SULAK, and C. E. JOHNSON.
Diurnal variation of plasma testosterone and cortisol. J Endocrinol. 54:177-178., 1972.
160. SALE, D. G. Neural adaptation to resistance training. Med Sei Sports Exerc. 20:S135-145., 1988.
161. SHERMAN, C. A. and C. F. FINCH. Preventing injuries to competitive and recreational adult golfers: what is the evidence? J Sei Med Sport. 3:65-78., 2000.
162. SIEGEL, R. A., J. WEIDENFELD, S. FELDMAN, N. CONFORTI, and I. CHOWERS.
Neural pathways mediating basal and stress-induced secretion of luteinizing hormone, follicle-stimulating hormone, and testosterone in the rat. Endocrinology. 108:2302-2307., 1981.
163. SMITH, A. M., S. A. MALO, E. R. LASKOWSKI, M. SABICK, W. P. COONEY, 3RD, S. B. FINNIE, D. J. CREWS, J. J. EISCHEN, I. D. HAY, N. J. DETLING, and K. KAUFMAN. A multidisciplinary study of the 'yips' phenomenon in golf: An exploratory analysis. Sports Med. 30:423-437., 2000.
164. SPRATT, D. I., L. S. O'DEA, D. SCHOENFELD, J. BUTLER, P. N. RAO, and W. F. CROWLEY, JR. Neuroendocrine-gonadal axis in men: frequent sampling of LH, FSH, and testosterone. Am JPhysiol. 254:E658-666., 1988.
165. SPRIGINGS, E. J. and R. J. NEAL. An insight into the importance of wrist torque in driving the golf ball: a simulation study. Journal of applied biomechanics. 16:356-366, 2000.
166. STEIN-BEHRENS, B. A. and R. M. SAPOLSKY. Stress, glucocorticoids, and aging. Aging (Milano). 4:197-210., 1992.
167. STONE, M. H., S. S. PLISK, M. E. STONE, B. K. SCHILLING, H. S. O'BRYANT, and K. C. PIERCE. Athletic performance development: volume load-1 set vs. multiple sets, training velocity and training variation. Strength and conditioning. 20:22-31, 1998.
168. STROHMEYER, D. D. Effect of an exercise training program on grip strength and hitting distance and the relationship of grip strength and arm length to hitting distance in golf with a five iron. Unpublished Dissertation. Brigham Young University, Univ. of Oregon, Eugene, Ore 1978.
170
169. SUAY, F., A. SALVADOR, E. GONZALEZ-BONO, C. SANCHIS, M. MARTINEZ, S. MARTINEZ-SANCHIS, V. M. SIMON, and J. B. MONTORO. Effects of competition and its outcome on serum testosterone, cortisol and prolactin. Psychoneuroendocrinology. 24:551-566., 1999.
170. TAYLOR, J. Predicting athletic performance with self-confidence and somatic and cognitive anxiety as a function of motor and physiological requirements in six sports. Journal ofPersonality. 55:139-153,1987.
171. THERIAULT, G., E. LACOSTE, and M. P. GABOURY. Golf injury characteristics: a survey from 528 golfers. Med Sei Sports Exerc. 28:565, 1996.
172. THERIAULT, G. and P. LACHANCE. Golf injuries. An overview. Sports Med. 26:43- 57., 1998.
173. THOMAS, J. R. and J. K. NELSON. Research Methods in Physical Activity. Champaign, IL: Human Kinetics, 1996
174. TORTORA, G. J. and S. R. GRABOWKI. Principles of Anatomy and Physiology. 9th ed. New York: John Wiley & Sons, Inc., 2000
175. UMEDA, T., R. HIRAMATSU, T. IWAOKA, T. SHIMADA, F. MRJRA, and T. SATO.
Use of saliva for monitoring unbound free cortisol levels in serum. Clin Chim Acta. 110:245-253., 1981.
176. URHAUSEN, A., T. KULLMER, and W. KINDERMANN. A 7-week follow-up study of the behaviour of testosterone and cortisol during the competition period in rowers. Eur JAppl Physiol Occup Physiol. 56:528-533, 1987.
177. URHAUSEN, A., H. GABRIEL, and W. KINDERMANN. Blood hormones as markers of training stress and overtraining. Sports Med. 20:251-276., 1995.
178. VAERNES, R., H. URSIN, A. DARRAGH, and R. LAMBE. Endocrine response patterns and psychological correlates. JPsychosom Res. 26:123-131, 1982.
179. VAN TUN, S. and C. W. GRIFFING. Search of the perfect golf ball. Extraordinary evolution of the dimpled orb Maximum test. Why how the USGA is setting Overall Distance Standards for golf balls and clubs. Financial post magazine. 20:10-12, 1977.
180. VELDHUIS, J. D., J. C. KING, R. J. URBAN, A. D. ROGOL, S. A. EVANS, S. A. KOLF, and M. L. JOHNSON. Operating characteristics of the male hypothalomo- pituitary-gonadal axis: pulsatile release of testoserone and follicle-stimulating hormone and their temporal coupling with lutenizing hormone. Journal of Clinical Endocrinology and Metabolism. 65:929-941, 1993.
181. VINING, R. F., R. A. MCGINLEY, J. J. MAKSVYTIS, and K. Y. Ho. Salivary cortisol: a better measure of adrenal cortical function than serum cortisol. Ann ClinBiochem. 20:329-335., 1983.
182. VINING, R. F., R. A. MCGINLEY, and R. G. SYMONS. Hormones in saliva: mode of entry and consequent implications for clinical interpretation. Clin Chem. 29:1752- 1756., 1983.
183. VITTEK, J., D. G. L'HOMMEDIEU, G. G. GORDON, S. C. RAPPAPORT, and A. L. SOUTHREN. Direct radioimmunoassay (RIA) of salivary testosterone: correlation with free and total serum testosterone. Life Sei. 37:711-716., 1985.
184. WALKER, R. F., B. G. JOYCE, and J. DYAS. Monitoring changes in normal adrenal
171
activity. In: Immunoassays of Steroids in Saliva. G. F. Read, R.-F. D., and R. F. Walker (Eds.) Cardiff: Alpha Omega, 1984, pp. 308-316.
185. WALLACE, E. S., D. GRAHAM, and E. W. BLEAKLEY. Foot-to-ground pressure patterns during the golf drive: a case study involving a low handicap player and a high handicap player. In: Science and Golf, Proceedings of the First World Scientific Congress of Golf. A. J. Cochran (Ed.) St Andrews, Scotland: E. & F. N. Spon, 1990.
186. WALLACE, E. S., P. N. GRIMSHAW, and R. L. ASHFORD. Discrete pressure profiles of the feet and weight transfer patterns during the golf swing. In: Science and Golf II: Proceedings of the Second World Scientific Congress of Golf A. J. Cochran and M. R. Farrally (Eds.) London: E & FN Spon, 1994, pp. 26-32.
187. WALTON, J. S. Close-range cine-photogrammetry: a generalized technique for quantifying gross human motion. Pennsylvania State University, University Park, PA, 1981.
188. WATKINS, R. G., G. S. UPPAL, J. PERRY, M. PINK, and J. M. DINSAY. Dynamic electromyographic analysis of trunk musculature in professional golfers. Am J Sports Med. 24:535-538., 1996.
189. WEATHERS, E. Tiger's supersonic stinger. Golf Digest. Apr. 51:84-88,2000. 190. WENZEL, D. Weight Training and Its Effect on the Golf Drive. Unpublished
Masters Thesis. University of North Dakotal967. 191. WERNERMAN, J., D. BOTTA, F. HAMMARQVIST, S. THUNELL, A. VON DER DECKEN,
and E. VTNNARS. Stress hormones given to healthy volunteers alter the concentration and configuration of ribosomes in skeletal muscle, reflecting changes in protein synthesis. Clin Sei (Colch). 77:611-616., 1989.
192. WERNERMAN, J., F. HAMMARQVIST, D. BOTTA, and E. VINARS. Stress hormones alter the pattern of free amino acids in human skeletal muscle. Clin Physiol. 13:309-319., 1993.
193. WESTCOTT, W. L., F. DOLAN, and T. CAVICCHI. Golf and strength training are compatible activities. Strength and conditioning. 18:54-56, 1996.
194. WESTCOTT, W. L. and J. R. PARZIALE. Golf Power: strength training takes its place alongside flexibility training for improving both power and speed in the golfer's swing. Fitness management. 13:39-41, 1997.
195. WHITTAKER, A. R. A study of the dynamics of the golf club. Sports engineering. 1:115-124,1998.
196. WILLIAMS, K. R. and P. R. CAVANAGH. The mechanics of foot action during the golf swing and implications for shoe design. Medicine Science Sports and Exercise. 15:247-255, 1983.
197. WILMORE, J. H. Alterations in strength, body composition and anthropometric measurements consequent to a 10-week weight training program. Med Sei Sports. 6:133-138., 1974.
198. WILMORE, J. H. and D. L. COSTILL. Physiology of Sport and Exercise. Champaign, IL: Human Kinetics, 1999
199. WILSON, G., R. NEWTON, A. MURPHY, and B. HUMPHRIES. The Optimal Training Load for the Development of Dynamic Athletic Performance. Medicine and
172
Science in Sports and Exercise. 25:1279-1286, 1993. 200. WIREN, G. Human Factors influencing the golf drive for distance. Doctoral
Dissertation. University of Oregonl968. 201. WlREN, G. Laws, principles and preference-a teaching models. In: Science and
Golf, Proceedings of the First World Scientific Congress of Golf. A. J. Cochran (Ed.) London: E. & F. N. Spon, 1990, pp. 3-13.
202. WOLOSKI, B. M., E. M. SMITH, W. J. MEYER, 3RD, G. M. FULLER, and J. E. BLALOCK. Corticotropin-releasing activity of monokines. Science. 230:1035- 1037., 1985.
203. YAN LAN, L. and D. L. GILL. The relationships among self-efficacy, stress responses, and a cognitive feedback manipulation. Journal of Sport Psychology. 6, 1984.
204. ZATSIORSKY, V. M. Science and Practice of Strength Training. Champaign, IL: Human Kinetics, 1995
205. ZHANG, J. The correlation among three hand strength measurement methods: hand dynamometer. Masters Thesis. Ball State University, School of Physical Education, Muncie, IN, 1996.
173
Appendix A
INFORMED CONSENT FORM FOR
STUDY #1: THE EFFECTS OF
RESISTANCE TRAINING ON GOLF
PERFORMANCE IN COMPETETITIVE
INTERCOLLEGIATE MEN AND WOMEN
GOLFERS
174
SUBJECT CONSENT FORM FOR PARTICIPATION IN HUMAN SUBJECT RESEARCH
Ball State University "The effects of periodized resistance training on golf performance in
Collegiate golfers."
You have been chosen as a potential subject based on your membership on the Ball State Men's and Women's Golf teams. All athletes on the Golf teams are invited to participate. The investigators and coaches give you the strongest commitment that you are under no pressure or coercion to participate in this study. The decision to participate or not will have no influence or prejudice on you in any form and should you choose not to participate, you will be provided with the same resistance training program and coaching time commitment that you would have received should this project never have been performed.
Purpose The purpose of this study is to examine the effects of strength, power, and flexibility training on competitive men and women golfers.
Procedures You are fully welcome to decline participation in this study. If you agree to participate, you will be tested on measures of muscle strength and power, joint flexibility and golf performance before, after and during a resistance-training program. There is a requirement for you to attend and complete these testing and training sessions to be involved in this study.
All neuromuscular testing and training will be completed in the Ball State University Biomechanics Laboratory and the University Arena. Golf ball launch condition and putting distance control testing will be completed at MD's Golf Academy, Muncie IN. All subjects will train for 11 weeks using standard resistance training exercises and upper-body plyometric exercises.
Ball State Athletic Weight-room staff will supervise all resistance training. You are normally required to participate in periodized resistance training and upper-body plyometrics, this investigation will simply measure the neuromuscular and golf performance related effects of the training. You will complete the usual warm-up performed prior to commencing their normal resistance training workouts. You will then complete 3 to 6 sets of 3 to 15 repetitions at loads of 50% to 90% of 1 repetition maximum (RM) on several traditional resistance training and upper-body plyometric exercises. One to three minutes of rest will be enforced between sets. Training will be performed three times per week.
Test Protocol: You will be tested before and after 11 weeks of strength, power, and
175
flexibility training.
Golf Ball Launch Conditions: You will hit 30 golf balls with a driver and 30 golf balls with a 5 iron. Golf ball launch data will be collected for each trial with a golf swing and ball launch condition analyzer. Additionally, your swing will be recorded using a digital video camera. A qualitative analyses will be performed using computer software to overlay swing images from different time periods and compare critical swing elements before, during and after training.
Putting distance control test: Subjects will putt 30 balls two different distances (10 feet and 30 feet) to a line perpendicular to the intended direction of the ball. Deviation from the line will be measured for each trial and compared between time points.
Strength testing: You will be tested on rotational trunk power by throwing medicine ball (3 lbs. to 8 lbs.) through a target for maximum distance. Grip strength will be measured using a handgrip dynamometer.
Flexibility: Maximum trunk rotation in both directions and sit and reach maximum flexibility will be measured.
Confidentiality All data collected will remain confidential. The results from testing will be kept in locked cabinets at Ball State University. Only the Investigator will know which data is associated with which specific athletes.
A random identification number will identify you. Only the Investigator will have access to this code. Your name will not be used in connection with any part of this study nor will the results be shared with any member of your coaching staff without your consent.
Please be aware that should any of the individual project results be used in the development of instructional materials, or for presentations, you will have to approve such use in writing, otherwise the results will be stored at the completion of the project.
Risks This study will use standard biomechanical and physiological analysis techniques. There is risk of sustaining an injury to a muscle or joint during strength testing and training exercise, however, the risk is no greater than the risk normally associated with the performance of resistance training movements that competitive Golfers use in training. You may also experience muscle soreness 24-48 hours following the protocol. There is no additional risk to the standard risks an individual assumes when playing Golf.
The investigators are very experienced with the testing and training procedures to be used
176
and there are many safeguards to ensure that risk of injury is minimized. During all tests, you will be monitored to ensure that you use the correct lifting technique. You will be required to warm-up thoroughly prior to any testing or training session. Research assistants will be in attendance to "spot" for you during the heavy lifting and help should you get into difficulty. During all testing and training sessions trained personnel will be present to ensure your safety and monitor your training.
Potential Benefits There is a positive direct benefit of this study to you in that you will learn more about your strength and power in movements that are very specific to your sport and about actual performance of your sport. Also, it is anticipated that your performance will benefit from the training program. You are welcome to contact the Investigator to obtain access to your data. You are welcome to discuss your results with the Investigator.
Injury and Compensation It is understood that in the unlikely event of physical injury resulting from research procedures, Ball State University, its agents and employees, will assume whatever responsibility is required by law. Emergency medical treatment for injuries of illness is available where the injury or illness is incurred during the course of the study.
Assurance Statement For one's rights as a research subject, the following persons maybe contacted: Ms. Sandra Smith, Coordinator of Research Compliance, Office of Academic Research and Sponsored Programs, Ball State University, Muncie, IN 47306, (765) 285-5070, or Dr. Daniel Goffman, Chairperson of the Institutional Review Board, Dept. of History, Ball State University, Muncie, IN 47306, (765) 285-8700. Please direct questions to Dr. Robert Newton, telephone (765) 285 5139 if you need further information concerning this study. If you decline to participate in this study, none of your data will be chosen for analysis, nor will your capacity for participation in Ball State Athletics be affected.
Authorization - The investigation and my part in the investigation have been defined and fully explained to me by Dr. Robert Newton, and I understand his explanation. A copy of the procedures of this investigation and a description of any risks and discomforts (e.g., muscle soreness, possible muscle strain), which are encountered during the experiment has been provided to me and has been discussed in detail with me. -1 have been given an opportunity to ask whatever questions I may have had and all such questions and inquiries have been answered to my satisfaction. - It has been made very clear to me that I am under no pressure or coercion from the investigators or coaches to participate in this study. -1 understand that I may withdraw from the data collection session at any time should I feel uncomfortable or wish to stop. -1 understand that I am free to deny any answers to specific items or questions in
177
interviews or questionnaires. -1 understand that any data or answers to questions will remain confidential with regard to my identity. - I understand that in the unlikely event of a physical injury resulting from such procedures, Ball State University, its agents and employees, will assume whatever responsibility required by law. Emergency medical treatment for injuries or illness is available if the injury or illness is incurred in the course of this study. -1 certify that to the best of my knowledge and belief, I have no physical or mental illness or weakness that would increase the risk to me of participation in this investigation. -1 FURTHER UNDERSTAND THAT I AM FREE TO WITHDRAW MY CONSENT AND TERMINATE MY PARTICIPATION AT ANY TIME WITHOUT PENALTY OR LOSS OF BENEFITS TO WHICH SUBJECTS/ATHLETES ARE ENTITLED. I have read the above and understand the discomforts, inconvenience, and risk of this study. I , agree to participate in this research entitled "The effects of periodized resistance training on golf performance in collegiate golfers". I understand that I may later refuse to participate, and that I may withdraw from this study at any time with no consequences to my standing as an athlete. I have received a copy of this consent form for my own records and I understand that no one will know my individual results from this study.
Participant's Signature Date
I _,( consent / do not consent ) to have the results of this study provided to (Mike Fleck / Shelly Sanders), Head Coach by the investigators.
Participant's Signature Date
Principal Investigator: Dr. Robert U. Newton Human Performance Laboratory Ball State University Muncie, IN 47306 (765)285-5139
Co-Investigator: Brandon Doan Human Performance Laboratory Ball State University Muncie, IN 47306 (765)285-5178
178
Appendix B
INFORMED CONSENT FORM FOR
STUDY #2: PHYSIOLOGICAL STRESS
RESPONSE DURING COMPETITIVE
GOLF
179
SUBJECT CONSENT FORM FOR PARTICIPATION IN HUMAN SUBJECT RESEARCH
Ball State University "Physiological Stress Response During Competitive Golf."
You have been chosen as a potential subject based on your membership on the Ball State Men's or Women's Golf teams. All athletes on the Golf teams are invited to participate. The investigators and coaches give you the strongest commitment that you are under no pressure or coercion to participate in this study. The decision to participate or not will have no influence or prejudice on you in any form and should you choose not to participate, you will be provided with the same resistance training program and coaching time commitment that you would have received should this project never have been performed.
Purpose You are being asked to participate in a study to examine the relationship between golf competitive environment, performance and physiological stress response. This study is being conducted to gain information on the physiological stress response of a golfer in competition.
Rationale for conducting study Increased secretion of the catabolic hormone Cortisol has been correlated to increases in physical and psychological stress, particularly negative mood states. Decreased secretion of the anabolic hormone Testosterone has been correlated to increased physical activity and decreased performance in competition. The interaction of these two hormones with individual performance on each hole and overall performance will be valuable information for golfers and sport psychologists. Additionally, the ratio of Testosterone to Cortisol secretion is an important indicator of energetic state. Collegiate golfers may be in a catabolic state for an excessive period of time during a 36-hole competition, which has implications for pre and post-round nutrition, immune response and overall health of the competitive golfer. Finally, performance anxiety may be correlated with increased Cortisol secretion, decreased Testosterone secretion, and performance. Some golfers may be too aroused before the round, while others are not aroused enough for optimal performance.
Procedures You are fully welcome to decline participation in this study. If you agree to participate, there is a requirement for you to collect saliva samples after each hole during the first 36 holes (18 holes for the women) of your home golf tournament. You will remove the cotton wool swab from the salivette and chew on it for 45 seconds while recording the time of sample. 36 salivettes will be pre-labeled and stored in a small Styrofoam cooler attached to the your golf bag. You will be asked not to consume caffeine on the day of
180
testing, however, there are no other dietary restrictions. Additionally, subjects will complete a standardized competitive state anxiety questionnaire prior to performance. The questionnaire will only take approximately five minutes to complete.
Baseline saliva samples will be collected on a different day. You will collect your own samples and participate in normal daily activities, except for strenuous exercise. You will report to the Human Performance Lab in the morning for instructions and a collection kit and will return samples at the end of the day. Timing of baseline samplings will be dependent on timing of samplings during competition. You will be asked to replicate dietary intake from first day of collection. Saliva samples will be analyzed in the laboratory at a later date to compare Cortisol and Testosterone concentration to baseline conditions and performance on the previous and following holes.
Confidentiality All data collected will remain confidential. The results from testing will be kept in locked cabinets at Ball State University. Only the Investigator will know which data is associated with which specific athletes.
A random identification number will identify you. Only the Investigator will have access to this code. Your name will not be used in connection with any part of this study nor will the results be shared with any member of your coaching staff without your consent.
Please be aware that should any of the individual project results be used in the development of instruction materials, or for presentations, you will have to approve such use in writing, otherwise the results will be stored at the completion of the project.
Risks There is no additional risk to the standard risks an individual assumes when competing in golf other than the unlikely possibility of choking on or swallowing one of the cotton wool swabs.
Potential Benefits There is a positive direct benefit of this study to you in that you will learn more about their stress hormone response during competition. You are welcome to contact the Investigator to obtain access to your data. You are welcome to discuss your results with the Investigator.
Injury and Compensation It is understood that in the unlikely event of physical injury resulting from research procedures, Ball State University, its agents and employees, will assume whatever responsibility is required by law. Emergency medical treatment for injuries or illness is available where the injury or illness is incurred during the course of the study.
Assurance Statement For one's rights as a research subject, the following persons may be contacted: Ms.
181
Sandra Smith, Coordinator of Research Compliance, Office of Academic Research and Sponsored Programs, Ball State University, Muncie, IN 47306, (765) 285-5070, or Dr. Daniel Goffman, Chairperson of the Institutional Review Board, Dept. of History, Ball State University, Muncie, IN 47306, (765) 285-8700. Please direct questions to Dr. Robert Newton, telephone (765) 285-5139 if you need further information concerning this study. If you decline to participate in this study, none of your data will be chosen for analysis, nor will your capacity for participation in Ball State Athletics be affected.
Authorization - The investigation and my part in the investigation have been defined and fully explained to me by Mr. Brandon Doan, and I understand his explanation. A copy of the procedures of this investigation and a description of any risks and discomforts (e.g., muscle soreness, possible muscle strain), which are encountered during the experiment has been provided to me and has been discussed in detail with me. -1 have been given an opportunity to ask whatever questions I may have had and all such questions and inquiries have been answered to my satisfaction. - It has been made very clear to me that I am under no pressure or coercion from the investigators or coaches to participate in this study. -1 understand that I may withdraw from the data collection session at any time should I feel uncomfortable or wish to stop. -1 understand that I am free to deny any answers to specific items or questions in interviews or questionnaires. -1 understand that any data or answers to questions will remain confidential with regard to my identity. - I understand that in the unlikely event of a physical injury resulting from such procedures, Ball State University, its agents and employees, will assume whatever responsibility required by law. Emergency medical treatment for injuries or illness is available if the injury or illness is incurred in the course of this study. -1 certify that to the best of my knowledge and belief, I have no physical or mental illness or weakness that would increase the risk to me of participation in this investigation. -1 FURTHER UNDERSTAND THAT I AM FREE TO WITHDRAW MY CONSENT AND TERMINATE MY PARTICIPATION AT ANY TIME WITHOUT PENALTY OR LOSS OF BENEFITS TO WHICH SUBJECTS/ATHLETES ARE ENTITLED. I have read the above and understand the discomforts, inconvenience, and risk of this study. I , agree to participate in this research entitled "Physiological Stress Response During Competitive Golf. I understand that I may later refuse to participate, and that I may withdraw from this study at any time with no consequences to my standing as an athlete. I have received a copy of this consent form for my own records and I understand that no one will know my individual results from this study.
I ,( consent / do not consent ) to have the
182
results of this study provided to (Mike Fleck / Shelly Sanders), Head Coach by the investigators.
Participant's Signature Date
Investigator's Signature Date
Principal Investigator: Dr. Robert U. Newton Human Performance Laboratory Ball State University Muncie, IN 47306 (765)285-5139
Co-Investigator: Brandon Doan Human Performance Laboratory Ball State University Muncie, IN 47306 (765)285-5178
183
Appendix C
COMPETITIVE STATE ANXIETY
INVENTORY-2 (CSAI-2)
184
Illinois Self-Evaluation Questionnaire Name:. Sex: M F Date: _
Directions: A number of statements that athletes have used to describe their feelings be- fore competition are given below. Read each statement and then circle the appropriate number to the right of the statement to indicate how you feel right now—a* this moment. There are no right or wrong answers. Do not spend too much time on any one statement, but choose the answer which dePTibes your feelings right noyy+_ -- ,
Not At Moderately Very Much All Somewhat So So
1. I am concerned about this competition l 2 3.. 4
2. I feel nervous l 2 3. 4 3. I feel at ease 1 2 3 4 4. I have self-doubts 1 2 3 4 5. I feel jittery 1 2 3 4,... 6. I feel comfortable 1 2 3... 4 7. I am concerned that I may not
do as well in this competition as I could 1 2 3 4
8. My body feels tense 1 2 3 4 9. I feel self-confident l 2 3 4..
10. I am concerned about losing .. ..1 2 3 4 11. I feel tense in my stomach .. ..1 2 3 4... 12. I feel secure 1 2 3 4 13. I am concerned about
choking under pressure 1 2 3 4 14. My body feels relaxed 1 2 3 4 15. I'm confident I can meet the
challenge 1 2 3 4 16. I'm concerned about per-
forming poorly 1 2 3 4 17. My heart is racing 1 .. .. ... 2 3 4 18. I'm confident about perform-
ing well 1 2 3 4.... 19. I'm concerned about
reaching my goal 1 2 3 4 20. I feel my stomach sinking 1 2 3 4 21.1 feel mentally relaxed 1 2 3 4 22. I'm concerned that others
will be disappointed with my performance 1 2 3 4
23. My hands are clammy 1 2 3 4 24. I'm confident because I
mentally picture myself reaching my goal 1 2 3 4
25. I'm concerned I won't be able to concentrate l 2 3 4
26. My body feels tight 1 2 3 4 27. I'm confident of coming
through under pressure 1 2 3 4
185
Appendix D
SALIVA COLLECTION, FATIGUE
SURVEY, AND FOOD/BEVERAGE
CONSUMPTION FORM
186
1. Remove cotton swab from each salivette (in numerical order) at specified time and LIGHTLY CHEW for 45 seconds. (If you have trouble producing saliva, chew sugarless gum) 2. Carefully replace cotton swab into salivette and replace salivette into cooler. 3. Record actual time of sample in hours and minutes (e.g. 3:30). 4. Use the scale below to rate your fatigue level after each sample. Enter one number that best describes your current mental and physical fatigue level after each hole. MF = mental fatigue, PF = physical fatigue.
1 2 3 4 5 6 7 8 9 10 Completely Exhausted
Maximum energy level
Sample Time Actual Time
Food/Drink (other than water)
MF P F
Sample Time Actual Time
Food/Drink (other than water)
P F
MF
Pre 19
1 20
2 21
3 22
4 23
5 24
6 25
7 26
8 27
9 28
10 29
11 30
12 31
13 32
14 33
15 34
16 35
17 36
18
*drink as much water as you need when you need it
RESTRICTIONS: *no caffeine on day of testing* *no alcohol the night before or day of testing *no sexual activity the day of testing *nofood or drink for five minutes prior to sample
BASELINE RESTRICTIONS ONLY *No major examinations or papers due that day or following day if possible