13
Targa Resources Partners LP Investor Presentation January 26, 2010
Targa Resources Partners LP
Investor Presentation
January 26, 2010
2
Forward Looking Statements
Certain statements in this presentation are "forwar d-looking statements" within the meaning of Section 27A of the Securities Act of 193 3, as amended, and Section 21E of the Securities Exchange Act of 1934, as amended. A ll statements, other than statements of historical facts, included in this pr esentation that address activities, events or developments that the Targa Resources Par tners LP (“NGLS” or the “Partnership”) expects, believes or anticipates wil l or may occur in the future are forward-looking statements. These forward-looking s tatements rely on a number of assumptions concerning future events and are subjec t to a number of uncertainties, factors and risks, many of which are outside the Pa rtnership’s control, which could cause results to differ materially from those expec ted by management of Targa Resources Partners. Such risks and uncertainties i nclude, but are not limited to, weather, political, economic and market conditions, including declines in the production of natural gas or in the price and marke t demand for natural gas and natural gas liquids, the timing and success of busi ness development efforts, the credit risk of customers and other uncertainties. These a nd other applicable uncertainties, factors and risks are described more fully in the P artnership's Annual Report on Form 10-K for the year ended December 31, 2008 and other r eports filed with the Securities and Exchange Commission. The Partnership undertakes no obligation to update or revise any forward-looking statement, whether as a result of new information, future events or otherwise.
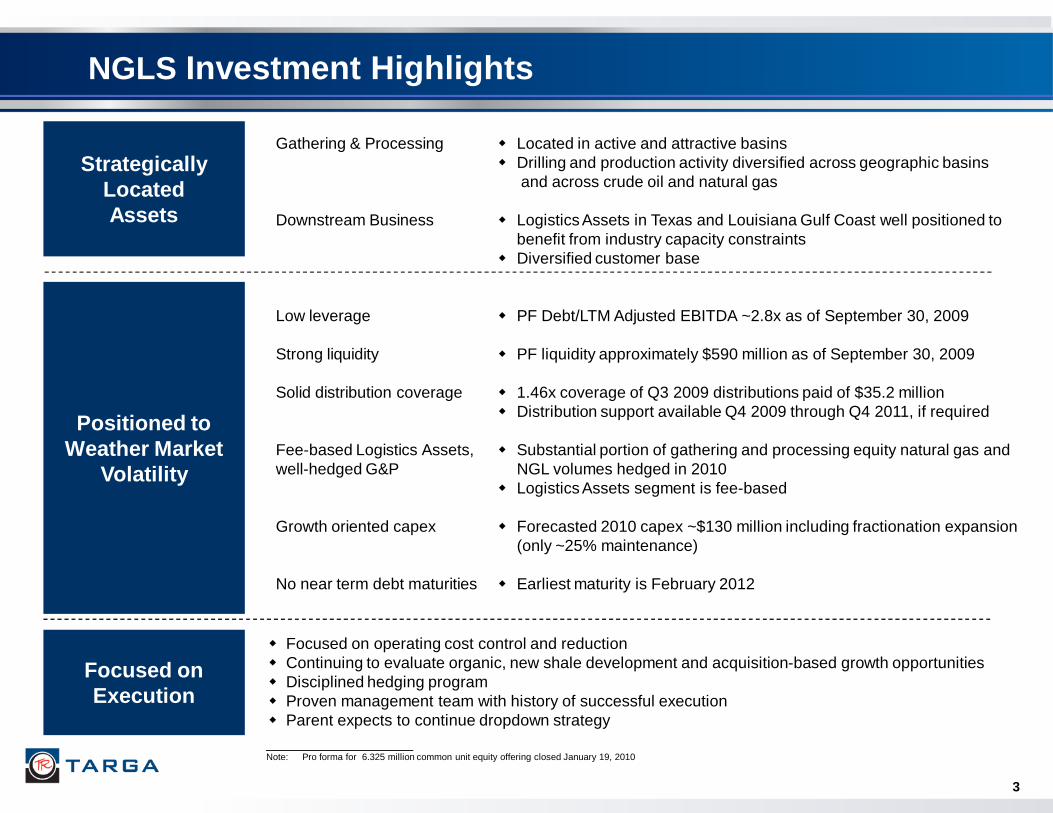
NGLS Investment Highlights
Strategically LocatedAssets
Positioned to Weather Market
Volatility
Focused on Execution
3
Gathering & Processing
Downstream Business
Low leverage
Strong liquidity
Solid distribution coverage
Fee-based Logistics Assets, well-hedged G&P
Growth oriented capex
No near term debt maturities
� Located in active and attractive basins� Drilling and production activity diversified across geographic basins
and across crude oil and natural gas
� Logistics Assets in Texas and Louisiana Gulf Coast well positioned to benefit from industry capacity constraints
� Diversified customer base
� PF Debt/LTM Adjusted EBITDA ~2.8x as of September 30, 2009
� PF liquidity approximately $590 million as of September 30, 2009
� 1.46x coverage of Q3 2009 distributions paid of $35.2 million� Distribution support available Q4 2009 through Q4 2011, if required
� Substantial portion of gathering and processing equity natural gas and NGL volumes hedged in 2010
� Logistics Assets segment is fee-based
� Forecasted 2010 capex ~$130 million including fractionation expansion (only ~25% maintenance)
� Earliest maturity is February 2012
� Focused on operating cost control and reduction� Continuing to evaluate organic, new shale development and acquisition-based growth opportunities� Disciplined hedging program � Proven management team with history of successful execution� Parent expects to continue dropdown strategy____________________Note: Pro forma for 6.325 million common unit equity offering closed January 19, 2010
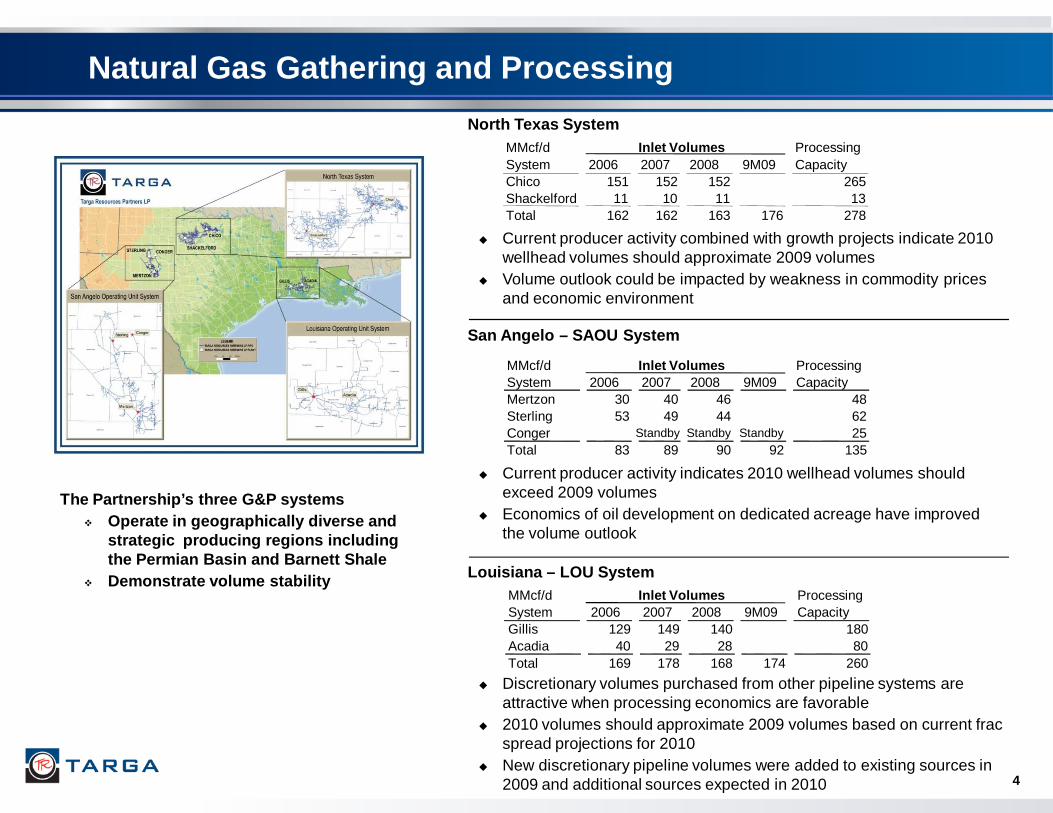
Natural Gas Gathering and Processing
4
� Current producer activity combined with growth projects indicate 2010 wellhead volumes should approximate 2009 volumes
� Volume outlook could be impacted by weakness in commodity prices and economic environment
� Current producer activity indicates 2010 wellhead volumes should exceed 2009 volumes
� Economics of oil development on dedicated acreage have improved the volume outlook
� Discretionary volumes purchased from other pipeline systems are attractive when processing economics are favorable
� 2010 volumes should approximate 2009 volumes based on current frac spread projections for 2010
� New discretionary pipeline volumes were added to existing sources in 2009 and additional sources expected in 2010
North Texas System
MMcf/d ProcessingSystem 2006 2007 2008 9M09 CapacityMertzon 30 40 46 48Sterling 53 49 44 62Conger Standby Standby Standby 25Total 83 89 90 92 135
Inlet Volumes
San Angelo – SAOU System
Louisiana – LOU System
The Partnership’s three G&P systems� Operate in geographically diverse and
strategic producing regions including the Permian Basin and Barnett Shale
� Demonstrate volume stability MMcf/d ProcessingSystem 2006 2007 2008 9M09 CapacityGillis 129 149 140 180Acadia 40 29 28 80Total 169 178 168 174 260
Inlet Volumes
MMcf/d ProcessingSystem 2006 2007 2008 9M09 CapacityChico 151 152 152 265Shackelford 11 10 11 13Total 162 162 163 176 278
Inlet Volumes
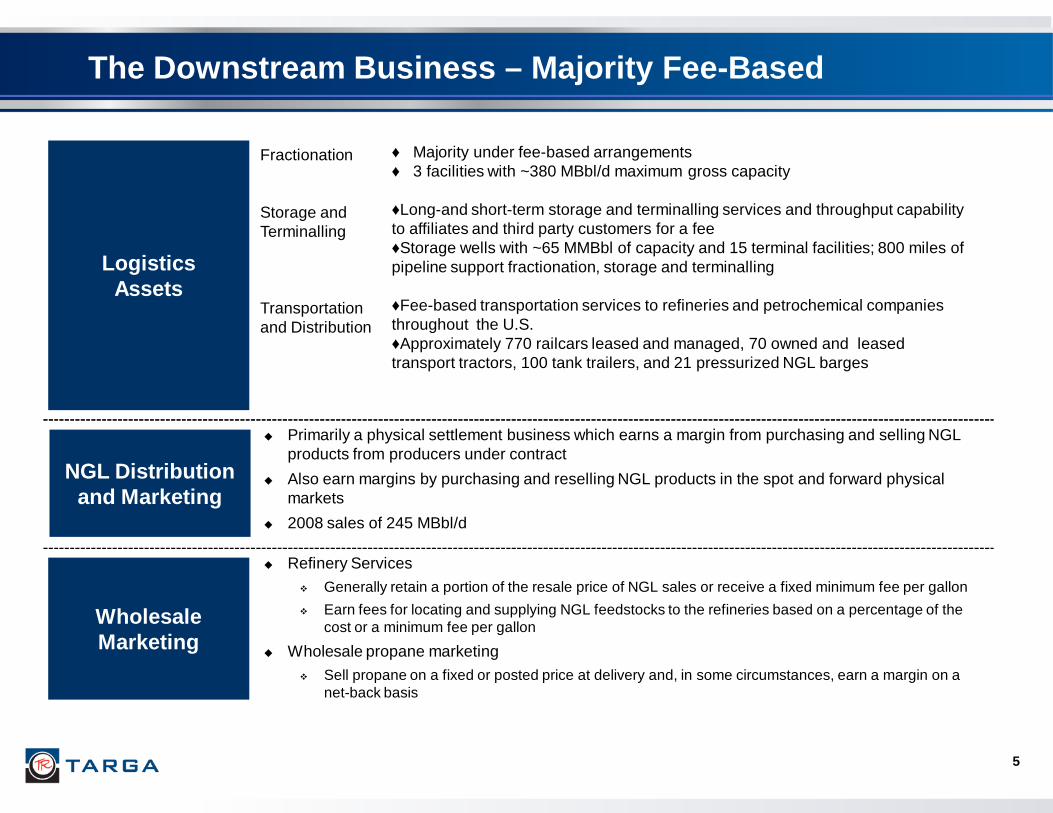
� Primarily a physical settlement business which earns a margin from purchasing and selling NGL products from producers under contract
� Also earn margins by purchasing and reselling NGL products in the spot and forward physical markets
� 2008 sales of 245 MBbl/d
� Refinery Services
� Generally retain a portion of the resale price of NGL sales or receive a fixed minimum fee per gallon
� Earn fees for locating and supplying NGL feedstocks to the refineries based on a percentage of the cost or a minimum fee per gallon
� Wholesale propane marketing
� Sell propane on a fixed or posted price at delivery and, in some circumstances, earn a margin on a net-back basis
The Downstream Business – Majority Fee-Based
LogisticsAssets
NGL Distribution and Marketing
WholesaleMarketing
5
Fractionation
Storage and Terminalling
Transportation and Distribution
♦ Majority under fee-based arrangements♦ 3 facilities with ~380 MBbl/d maximum gross capacity
♦Long-and short-term storage and terminalling services and throughput capability to affiliates and third party customers for a fee♦Storage wells with ~65 MMBbl of capacity and 15 terminal facilities; 800 miles of pipeline support fractionation, storage and terminalling
♦Fee-based transportation services to refineries and petrochemical companies throughout the U.S.♦Approximately 770 railcars leased and managed, 70 owned and leased transport tractors, 100 tank trailers, and 21 pressurized NGL barges
6
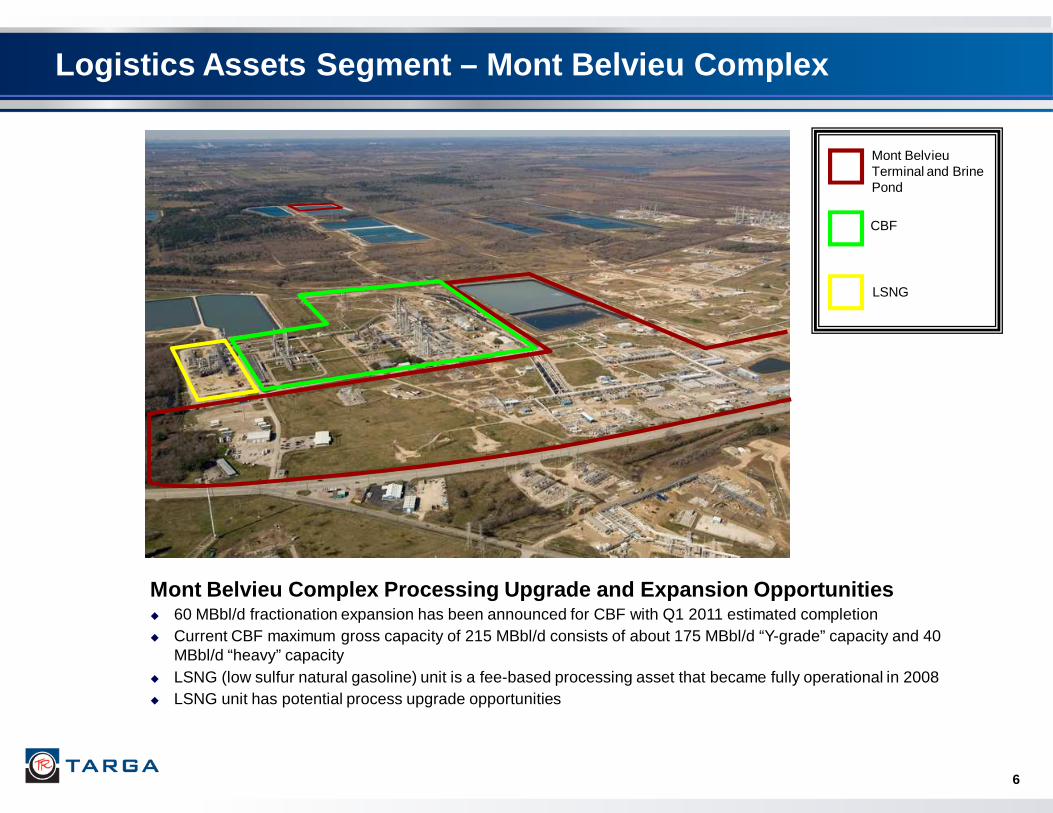
Logistics Assets Segment – Mont Belvieu Complex
CBF
Mont Belvieu Terminal and Brine Pond
LSNG
Mont Belvieu Complex Processing Upgrade and Expansi on Opportunities� 60 MBbl/d fractionation expansion has been announced for CBF with Q1 2011 estimated completion� Current CBF maximum gross capacity of 215 MBbl/d consists of about 175 MBbl/d “Y-grade” capacity and 40
MBbl/d “heavy” capacity� LSNG (low sulfur natural gasoline) unit is a fee-based processing asset that became fully operational in 2008 � LSNG unit has potential process upgrade opportunities
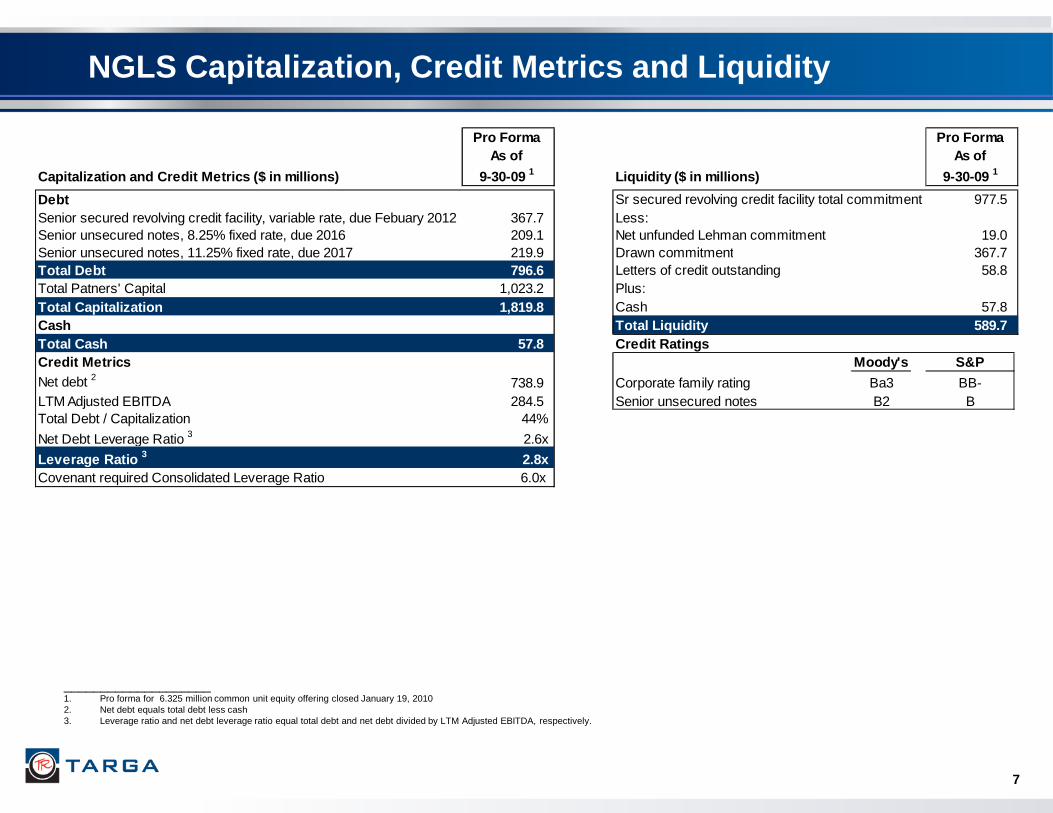
NGLS Capitalization, Credit Metrics and Liquidity
7
____________________1. Pro forma for 6.325 million common unit equity offering closed January 19, 20102. Net debt equals total debt less cash3. Leverage ratio and net debt leverage ratio equal total debt and net debt divided by LTM Adjusted EBITDA, respectively.
Pro Forma As of
9-30-09 1
Pro Forma As of
9-30-09 1
Debt Sr secured revolving credit facility total commitment 977.5 Senior secured revolving credit facility, variable rate, due Febuary 2012 367.7 Less:Senior unsecured notes, 8.25% fixed rate, due 2016 209.1 Net unfunded Lehman commitment 19.0 Senior unsecured notes, 11.25% fixed rate, due 2017 219.9 Drawn commitment 367.7 Total Debt 796.6 Letters of credit outstanding 58.8 Total Patners' Capital 1,023.2 Plus:Total Capitalization 1,819.8 Cash 57.8 Cash Total Liquidity 589.7 Total Cash 57.8 Credit RatingsCredit Metrics Moody's S&PNet debt 2 738.9 Corporate family rating Ba3 BB-LTM Adjusted EBITDA 284.5 Senior unsecured notes B2 BTotal Debt / Capitalization 44%
Net Debt Leverage Ratio 3 2.6x
Leverage Ratio 3 2.8xCovenant required Consolidated Leverage Ratio 6.0x
Capitalization and Credit Metrics ($ in millions) Liquidity ($ in millions)
8
9
Appendix
10
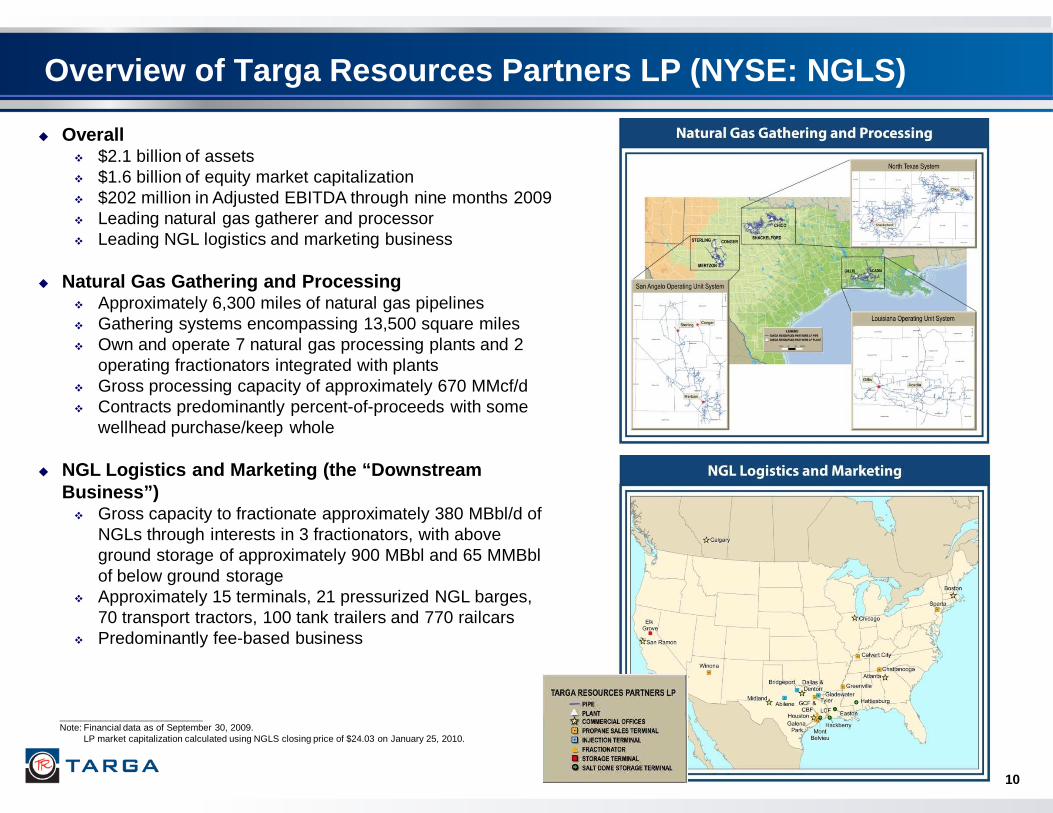
Overview of Targa Resources Partners LP (NYSE: NGLS )
� Overall� $2.1 billion of assets� $1.6 billion of equity market capitalization� $202 million in Adjusted EBITDA through nine months 2009� Leading natural gas gatherer and processor� Leading NGL logistics and marketing business
� Natural Gas Gathering and Processing� Approximately 6,300 miles of natural gas pipelines� Gathering systems encompassing 13,500 square miles� Own and operate 7 natural gas processing plants and 2
operating fractionators integrated with plants� Gross processing capacity of approximately 670 MMcf/d � Contracts predominantly percent-of-proceeds with some
wellhead purchase/keep whole
� NGL Logistics and Marketing (the “Downstream Business”)
� Gross capacity to fractionate approximately 380 MBbl/d of NGLs through interests in 3 fractionators, with above ground storage of approximately 900 MBbl and 65 MMBbl of below ground storage
� Approximately 15 terminals, 21 pressurized NGL barges, 70 transport tractors, 100 tank trailers and 770 railcars
� Predominantly fee-based business
____________________________Note: Financial data as of September 30, 2009.
LP market capitalization calculated using NGLS closing price of $24.03 on January 25, 2010.
11
Non-GAAP Measures Reconciliation
This presentation includes non-GAAP financial measures of Adjusted EBITDA and distributable cash flow. The presentation provides reconciliations of these non-GAAP financial measures to their most directly comparable financial measure calculated and presented in accordance with generally accepted accounting principles in the United States of America ("GAAP"). Our non-GAAP financial measures should not be considered as alternatives to GAAP measures such as net income, operating income, net cash flows provided by operating activities or any other GAAP measure of liquidity or financial performance.

12
Non-GAAP Measures Reconciliation
The following table presents a reconciliation of Adjusted EBITDA and distributable cash flow to net income (loss) for the periods shown for NGLS. The results of operations for NGLS below include the historical results of the Downstream business:
Targa Resources Partners LP($ in millions)
____________________________Note: See section of this presentation starting on page 13 for a discussion of Adjusted EBITDA and distributable cash flow
2009 2009
Reconciliation of net income (loss) to Targa Resources Partners LP to distributable cash flowNet income (loss) to Targa Resources Partners LP 10.0$ 13.6$ Add:
Depreciation and amortization expense 25.6 75.5 Deferred income tax expense (benefit) 0.1 0.8 Noncash interest expense 15.0 45.9 Loss on debt repurchases 1.5 1.5 Non-cash loss related to derivatives 4.1 33.8 Maintenance capital expenditures (4.7) (12.1)Other (0.1) (0.4)
Distributable cash flow $ 51.5 $ 158.6
Three Months
Ended
September 30,
Nine Months
Ended
September 30,
(In millions)
Nine Months
Ended
September 30,
Twelve Months
Ended
December 31,
2009 2009 2008 2008
Reconciliation of net income (loss) to Targa Resources Partners LP to Adjusted EBITDA:
Net income (loss) to Targa Resources Partners LP 10.0$ 13.6$ 29.6$ 49.4$
Add:
Interest expense, net 29.8 78.8 71.6 97.1
Income tax expense (benefit) (0.2) 0.8 1.8 2.4
Depreciation and amortization expense 25.6 75.5 72.8 97.8
Non-cash loss related to derivatives 4.1 33.8 11.6 23.4 Noncontrolling interest adjustment (0.2) (0.7) (0.7) (0.7)
Adjusted EBITDA 69.1$ 201.8$ 186.7$ 269.4$
Three Months
Ended
September 30,
Nine Months
Ended
September 30,
(In millions)
13
Non-GAAP Measures Reconciliation
Adjusted EBITDA – The Partnership and Targa define Adjusted EBITDA as net income before interest, income taxes, depreciation andamortization and non-cash income or loss related to derivative instruments. Adjusted EBITDA is used as a supplemental financial measure by our management and by external users of our financial statements such as investors, commercial banks and others, to assess: (1) the financial performance of our assets without regard to financing methods, capital structure or historical cost basis; (2) our operating performance and return on capital as compared to other companies in the midstream energy sector, without regard to financing or capital structure; and (3) the viability of acquisitions and capital expenditure projects and the overall rates of return on alternative investment opportunities. The economic substance behind management’s use of Adjusted EBITDA is to measure the ability of our assets to generate cash sufficient to pay interest costs, support our indebtedness and make distributions to our investors. The GAAP measure most directly comparable to Adjusted EBITDA is net income (loss). Our non-GAAP financial measure of Adjusted EBITDA should not be considered as an alternative to GAAP net income (loss). Adjusted EBITDA is not a presentation made in accordance with GAAP and has important limitations as an analytical tool. You should not consider Adjusted EBITDA in isolation or as a substitute for analysis of our results as reported under GAAP. Because Adjusted EBITDA excludes some, but not all, items that affect net income and is defined differently by different companies in our industry, our definition of Adjusted EBITDA may not be comparable to similarly titled measures of other companies. Management compensates for the limitations of Adjusted EBITDA as an analytical tool by reviewing the comparable GAAP measures, understanding the differences between the measures and incorporating these insights into management’s decision-making processes.
Distributable Cash Flow – Distributable cash flow is a significant performance metric used by us and by external users of our financial statements, such as investors, commercial banks, research analysts and others to compare basic cash flows generated by us (prior to the establishment of any retained cash reserves by our general partner) to the cash distributions we expect to pay our unitholders. Using this metric, management can quickly compute the coverage ratio of estimated cash flows to planned cash distributions. Distributable cash flow is also an important non-GAAP financial measure for our unitholders because it serves as an indicator of our success in providing a cash return on investment. Specifically, this financial measure indicates to investors whether or not we are generating cash flow at a level that can sustain or support an increase in our quarterly distribution rates. Distributable cash flow is also a quantitative standard used throughout the investment community with respect to publicly-traded partnerships and limited liability companies because the value of a unit of such an entity is generally determined by the unit’s yield (which in turn is based on the amount of cash distributions the entity pays to a unitholder). The economic substance behind our use of distributable cash flow is to measure the ability of our assets to generate cash flows sufficient to make distributions to our investors. The GAAP measure most directly comparable to distributable cash flow is net income (loss). Our non-GAAP measure of distributable cash flow should not be considered as an alternative to GAAP net income (loss). Distributable cash flow is not a presentation made in accordance with GAAP and has important limitations as an analytical tool. You should not consider distributable cash flow in isolation or as a substitute for analysis of our results as reported under GAAP. Because distributable cash flow excludes some but not all, items that affect net income (loss) and is defined differently by different companies in our industry, our definition of distributable cash flow may not be compatible to similarly titled measures of other companies, thereby diminishing its utility. We compensate for the limitations of distributable cash flow as an analytical tool by reviewing the comparable GAAP measures, understanding the differences between the measures and incorporating these insights into our decision-making processes.


