PSYCHIATRY ORIGINAL RESEARCH ARTICLE published: 17 October 2012 doi: 10.3389/fpsyt.2012.00090 Target optimization in transcranial direct current stimulation Rosalind J. Sadleir 1,2 *,Tracy D.Vannorsdall 3 , David J. Schretlen 3,4 and Barry Gordon 5,6 1 J. Crayton Pruitt Family Department of Biomedical Engineering, University of Florida, Gainesville, FL, USA 2 Department of Biomedical Engineering, Kyung Hee University, Seoul, South Korea 3 Department of Psychiatry and Behavioral Sciences,The Johns Hopkins University School of Medicine, Baltimore, MD, USA 4 Russell H. Morgan Department of Radiology and Radiological Science,The Johns Hopkins University School of Medicine, Baltimore, MD, USA 5 Department of Neurology, Cognitive Neurology/Neuropsychology,The Johns Hopkins University School of Medicine, Baltimore, MD, USA 6 Department of Cognitive Science,The Johns Hopkins University, Baltimore, MD, USA Edited by: Andre R. Brunoni, Universidade de São Paulo, Brazil Reviewed by: Abhishek Datta, Soterix Medical, USA Pedro Shiozawa, Santa Casa de Misericórdia de São Paulo, Brazil *Correspondence: Rosalind J. Sadleir, J. Crayton Pruitt Family Department of Biomedical Engineering, University of Florida, Box 116131, Gainesville, FL 32611-6131, USA. e-mail: sadleir@ufl.edu Transcranial direct current stimulation (tDCS) is an emerging neuromodulation therapy that has been experimentally determined to affect a wide range of behaviors and diseases rang- ing from motor, cognitive, and memory processes to depression and pain syndromes. The effects of tDCS may be inhibitory or excitatory, depending on the relative polarities of elec- trodes and their proximity to different brain structures.This distinction is believed to relate to the interaction of current flow with activation thresholds of different neural complexes. tDCS currents are typically applied via a single pair of large electrodes, with one (the active electrode) sited close to brain structures associated with targeted processes.To efficiently direct current toward the areas presumed related to these effects, we devised a method of steering current toward a selected area by reference to a 19-electrode montage applied to a high-resolution finite element model of the head. We used a non-linear optimization procedure to maximize mean current densities inside the left inferior frontal gyrus (IFG), while simultaneously restricting overall current, and median current densities within the accumbens.We found that a distributed current pattern could be found that would indeed direct current toward the IFG in this way, and compared it to other candidate 2-electrode configurations. Further, we found a combination of four anterior-posterior electrodes could direct current densities to the accumbens. We conclude that a similar method using mul- tiple electrodes may be a useful means of directing current toward or away from specific brain regions and also of reducing tDCS side effects. Keywords: tDCS, neuroplasticity, finite element model, optimization INTRODUCTION Transcranial direct current stimulation (tDCS) is an emerging method for modulation of brain function. Applications have been widely tested in experimental scenarios of motor, semantic, and attention processes (Nitsche et al., 2008). Other recent experi- mental uses include therapy for depression and hallucinations in schizophrenia (Brunelin et al., 2012; Loo et al., 2012). The mechanism of tDCS is believed to arise through a mod- ulation of baseline cortical excitability, caused by shifts in rest- ing membrane potentials in regions experiencing current flow (Brunoni et al., 2012). The effects of tDCS depend on the rel- ative polarity of electrodes. In general, anodal tDCS (where the active electrode is more positive than the reference electrode) has excitatory effects, and cathodal tDCS has inhibitory effects (Nitsche and Paulus, 2000). This has been substantiated in numer- ous experiments. For example studies of tDCS in cognitive tasks found that anodal tDCS delivered over the dorsolateral prefrontal cortex facilitated visual working memory (Fregni et al., 2005) and cathodal stimulation impaired short-term auditory mem- ory performance (Elmer et al., 2009). Application of tDCS may, in turn affect the manifestations of neuropsychiatric conditions, including autism, depression, migraine, and schizophrenia, as baseline cortical excitability is characteristic of these conditions (Brunoni et al., 2012). Little is known about the exact current flow patterns elicited by tDCS. Although methods using MRI scanners exist for mea- suring intracranial current flow (Scott et al., 1991), they are not conveniently applied because of the need for subject reposition- ing. Detailed models of current flow have therefore been created using finite element modeling in lieu of actual current measure- ment (Wagner et al., 2007; Datta et al., 2009; Sadleir et al., 2010). Though modeling is informative, there is still no clear mecha- nism linking current direction, current distribution, and observed experimental effects. If it is possible to direct current toward or away from specific brain areas, the mechanisms, and structures responsible for the observed effects of tDCS may become clear. The ability to con- trol current distribution throughout the brain may also provide a deeper understanding of general neural circuitry and networks. To best determine the stimulation parameters required to tar- get different brain areas, we must refer to a complete electrical model of the head. This approach is natural because the paths www.frontiersin.org October 2012 |Volume 3 | Article 90 | 1
Transcript
PSYCHIATRYORIGINAL RESEARCH ARTICLE
published: 17 October 2012doi: 10.3389/fpsyt.2012.00090
Target optimization in transcranial direct currentstimulationRosalind J. Sadleir 1,2*,Tracy D. Vannorsdall 3, David J. Schretlen3,4 and Barry Gordon5,6
1 J. Crayton Pruitt Family Department of Biomedical Engineering, University of Florida, Gainesville, FL, USA2 Department of Biomedical Engineering, Kyung Hee University, Seoul, South Korea3 Department of Psychiatry and Behavioral Sciences, The Johns Hopkins University School of Medicine, Baltimore, MD, USA4 Russell H. Morgan Department of Radiology and Radiological Science, The Johns Hopkins University School of Medicine, Baltimore, MD, USA5 Department of Neurology, Cognitive Neurology/Neuropsychology, The Johns Hopkins University School of Medicine, Baltimore, MD, USA6 Department of Cognitive Science, The Johns Hopkins University, Baltimore, MD, USA
Edited by:Andre R. Brunoni, Universidade deSão Paulo, Brazil
Reviewed by:Abhishek Datta, Soterix Medical, USAPedro Shiozawa, Santa Casa deMisericórdia de São Paulo, Brazil
*Correspondence:Rosalind J. Sadleir , J. Crayton PruittFamily Department of BiomedicalEngineering, University of Florida,Box 116131, Gainesville, FL32611-6131, USA.e-mail: [email protected]
Transcranial direct current stimulation (tDCS) is an emerging neuromodulation therapy thathas been experimentally determined to affect a wide range of behaviors and diseases rang-ing from motor, cognitive, and memory processes to depression and pain syndromes.Theeffects of tDCS may be inhibitory or excitatory, depending on the relative polarities of elec-trodes and their proximity to different brain structures. This distinction is believed to relateto the interaction of current flow with activation thresholds of different neural complexes.tDCS currents are typically applied via a single pair of large electrodes, with one (the activeelectrode) sited close to brain structures associated with targeted processes.To efficientlydirect current toward the areas presumed related to these effects, we devised a methodof steering current toward a selected area by reference to a 19-electrode montage appliedto a high-resolution finite element model of the head. We used a non-linear optimizationprocedure to maximize mean current densities inside the left inferior frontal gyrus (IFG),while simultaneously restricting overall current, and median current densities within theaccumbens. We found that a distributed current pattern could be found that would indeeddirect current toward the IFG in this way, and compared it to other candidate 2-electrodeconfigurations. Further, we found a combination of four anterior-posterior electrodes coulddirect current densities to the accumbens. We conclude that a similar method using mul-tiple electrodes may be a useful means of directing current toward or away from specificbrain regions and also of reducing tDCS side effects.
Keywords: tDCS, neuroplasticity, finite element model, optimization
INTRODUCTIONTranscranial direct current stimulation (tDCS) is an emergingmethod for modulation of brain function. Applications have beenwidely tested in experimental scenarios of motor, semantic, andattention processes (Nitsche et al., 2008). Other recent experi-mental uses include therapy for depression and hallucinations inschizophrenia (Brunelin et al., 2012; Loo et al., 2012).
The mechanism of tDCS is believed to arise through a mod-ulation of baseline cortical excitability, caused by shifts in rest-ing membrane potentials in regions experiencing current flow(Brunoni et al., 2012). The effects of tDCS depend on the rel-ative polarity of electrodes. In general, anodal tDCS (where theactive electrode is more positive than the reference electrode)has excitatory effects, and cathodal tDCS has inhibitory effects(Nitsche and Paulus, 2000). This has been substantiated in numer-ous experiments. For example studies of tDCS in cognitive tasksfound that anodal tDCS delivered over the dorsolateral prefrontalcortex facilitated visual working memory (Fregni et al., 2005)and cathodal stimulation impaired short-term auditory mem-ory performance (Elmer et al., 2009). Application of tDCS may,in turn affect the manifestations of neuropsychiatric conditions,
including autism, depression, migraine, and schizophrenia, asbaseline cortical excitability is characteristic of these conditions(Brunoni et al., 2012).
Little is known about the exact current flow patterns elicitedby tDCS. Although methods using MRI scanners exist for mea-suring intracranial current flow (Scott et al., 1991), they are notconveniently applied because of the need for subject reposition-ing. Detailed models of current flow have therefore been createdusing finite element modeling in lieu of actual current measure-ment (Wagner et al., 2007; Datta et al., 2009; Sadleir et al., 2010).Though modeling is informative, there is still no clear mecha-nism linking current direction, current distribution, and observedexperimental effects.
If it is possible to direct current toward or away from specificbrain areas, the mechanisms, and structures responsible for theobserved effects of tDCS may become clear. The ability to con-trol current distribution throughout the brain may also provide adeeper understanding of general neural circuitry and networks.To best determine the stimulation parameters required to tar-get different brain areas, we must refer to a complete electricalmodel of the head. This approach is natural because the paths
taken by transcranial currents are defined by head geometry andconductivity, as well as electrode shape and location.
In this study, we performed tests using a non-linear optimiza-tion technique to determine if current densities in brain structurescould be shaped. We investigated three scenarios: one in which wewished to target cortical structures and to avoid the accumbens; asecond in which we wished to target the region of the accumbens(left and right) with no constraint on regions to be avoided; anda third in which the accumbens was targeted, but the left inferiorfrontal gyrus (IFG) was avoided.
Other authors have used related optimization approaches (Imet al., 2008; Dmochowski et al., 2011; Park et al., 2011). WhileIm et al. (2008) used a evolution strategy approach to find opti-mal two-electrode locations from which to target a nominatedbrain area, a more recent work from their group used fixed ante-rior and posterior electrode location and a simplex algorithm todetermine the appropriate current amplitudes needed to applymaximal currents (Park et al., 2011). Similarly, Dmochowski et al.(2011) used a fixed 64-electrode array and a variety of optimiza-tion approaches to determine current amplitudes needed to createmaximal currents in a nominated cortical area.
Our methods use a general non-linear algorithm, which allowsfor flexible and general constraints to be applied. Dmochowskiet al. (2011) used a similar approach. We used a linear basis for ourcomputations comprising calculations of current flows betweenindividual electrodes and a reference ground plane, whereas Parket al. (2011) and Dmochowski et al. (2011) used pairs of mod-eled electrodes to compute test intracranial current patterns. Ourapproach led to the implicit option to include extracranial elec-trodes. Normally the sum of all currents flowing into and out of thehead should be zero. However, in part of the work presented herewe have calculated optimal current flows through electrodes with-out this constraint. Any uncompensated current flowing throughscalp electrodes after optimization can then be accounted for inreal experiments by attaching an extracranial electrode to completethe circuit and supply the remaining current. As in Dmochowskiet al. (2011) we used a general non-linear algorithm that allowedthe inclusion of both target and avoidance areas. In contrast totheir approach, we have explicitly specified avoidance areas ratherthan seeking to minimize current densities in all regions outsidethe target. Our method used large electrodes similar to those cur-rently used in tDCS studies. Use of large electrodes avoids the riskof applying large currents to the skin, an effect that can lead tosuperficial burning. Finally, the model used as the base for ourcomputations included white matter anisotropy. This more real-istic model potentially facilitates better current localization andhelped us discern an intriguing anatomical asymmetry in our testmodel.
MATERIALS AND METHODSIn the following sections we detail our electrical head model andthe constructs and calculations used in optimization procedures.
TISSUE SEGMENTATION AND CONDUCTIVITY ASSIGNMENTSWe used the “Re-sliced Adam” (RA) dataset from the DTI WhiteMatter atlas repository housed at the Johns Hopkins Medical Insti-tutes (http://cmrm.med.jhmi.edu/). The RA model is a single
subject atlas with a resolution of 1× 1× 1 mm3 and includeswhite matter anisotropy vectors and T1 weighted (MPRAGE) MRimages (Wakana et al., 2004). Segmentation was performed usingboth automatic classification and manual comparison with ananatomical atlas (Rubin and Safdieh, 2007). Non-brain data weresegmented manually using ScanIP (Simpleware, Exeter, UK) soft-ware into 10 tissue types: cancelous bone, cortical bone, blood,cerebrospinal fluid (CSF), sclera, fat, muscle, brain, and skin. Theoriginal model did not include slices above the superior limit of thecortex. Therefore, to include the crown of the head, we extendedthe model by adding 12 slices (12 mm height) to the superior por-tion of the model, completing the head with CSF, cortical bone,and scalp materials. The brain tissue itself was further segmentedautomatically using FreeSurfer 5.0.0 (Cambridge, MA, USA) soft-ware into white matter and gray matter; and then subclassified intomany cortical and deep brain structures. Specific target areas usedin this study – the IFG, angular gyrus (AG), and dorsolateral pre-frontal cortex (DLPFC) – were isolated using manually, referringanatomical atlas information.
Conductivity values were assigned to each tissue, chosen frommeasurements reported below 1 kHz. Table 1 lists the sources forconductivities.
White matter was assumed anisotropic. We distinguishedbetween conductivities of cancelous and cortical bone becauseof the large electrical property differences between these tissues(Akhtari et al., 2000, 2002; Sadleir and Argibay, 2007).
FINITE ELEMENT MODELINGThe model solved the Laplace equation
∇ ·(σ(x , y , z
)∇φ)= 0 (1)
on the domain Ω (the head), subject to
σ∂φ
dn= j and φbase = 0; (2)
Table 1 | Conductivities assigned to tissues in our model.
Compartment Conductivity (S/m) Reference
Air 0 –
Skin 4.3×10⁻¹ Holdefer et al. (2006)
Cerebrospinal fluid 1.8×100 Baumann et al. (1997)
Sclera 5.0×10⁻¹ Gabriel et al. (1996)
Cortical bone 5.52×10⁻³ Akhtari et al. (2002)
Cancelous bone 21.4×10⁻³ Akhtari et al. (2002)
Muscle* 1.6×10⁻¹ Geddes and Baker (1967)
Fat 2.5×10⁻² Gabriel et al. (1996)
Blood 6.7×10⁻¹ Geddes and Baker (1967)
White matter* 1.2×10⁻¹ (trans.) Geddes and Baker (1967)
1.2×10−0 (long.)
Gray matter 1.0×10⁻¹ Gabriel et al. (1996)
Values were chosen from available low frequency (<1 kHz) data in the literature.
Compartments marked with an asterisk were anisotropic.The isotropic conductiv-
ity assigned to muscle was calculated according to the formula σ*= (σl σt) where
σl is longitudinal and σt is transverse measured conductivity.
Frontiers in Psychiatry | Neuropsychiatric Imaging and Stimulation October 2012 | Volume 3 | Article 90 | 2
on the surface of the domain dΩ. Here, σ(x,y,z) is the conductivitydistribution within the head, φ is the voltage distribution, j is thesurface current density, and n is a vector normal to the surface.The quantity j was only non-zero on electrodes. The voltage onthe base plane (the caudal slice) of the model (φbase) was set tozero.
The segmented phantom was converted into a quadratic tetra-hedral finite element model containing ∼18 million elements. Ineach white matter voxel, the anisotropic conductivity tensor wascalculated as
DW = AT D∗W A
where
D∗W =
σl 0 00 σt 00 0 σt
and A=RzRyRx. Rz, Ry, and Rx are
rotation matrices about the z, y, and x axes, respectively. Inisotropic voxels, D was a diagonal matrix with all entries equalto the local isotropic conductivity value.
Computations of finite element model matrix equations andboundary conditions were implemented in C and solved using thepreconditioned conjugate gradient method.
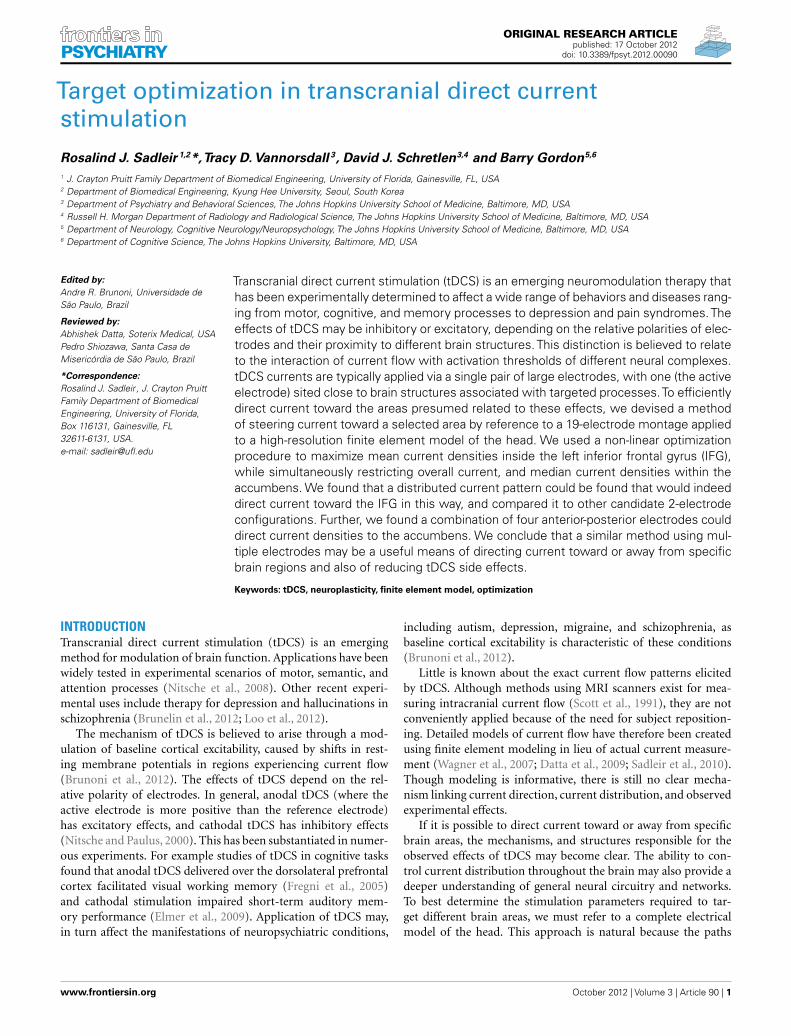
Electrode assignment and definitionTranscranial direct current stimulation current is normallyintroduced via a pair of large (∼35 cm2) saline/sponge electrodes.One (the active electrode) is sited close to brain regions presumedinvolved in target processes. The other (the reference electrode) isplaced elsewhere on the head or body. For this study, we defineda montage of NE= 19 electrodes (Figure 1). The electrodes wereselected from standard 10–20 EEG locations. Each electrode hadan area of ∼22 cm2. Use of large electrodes reduces the risk thatsuperficial burns will result from current application.
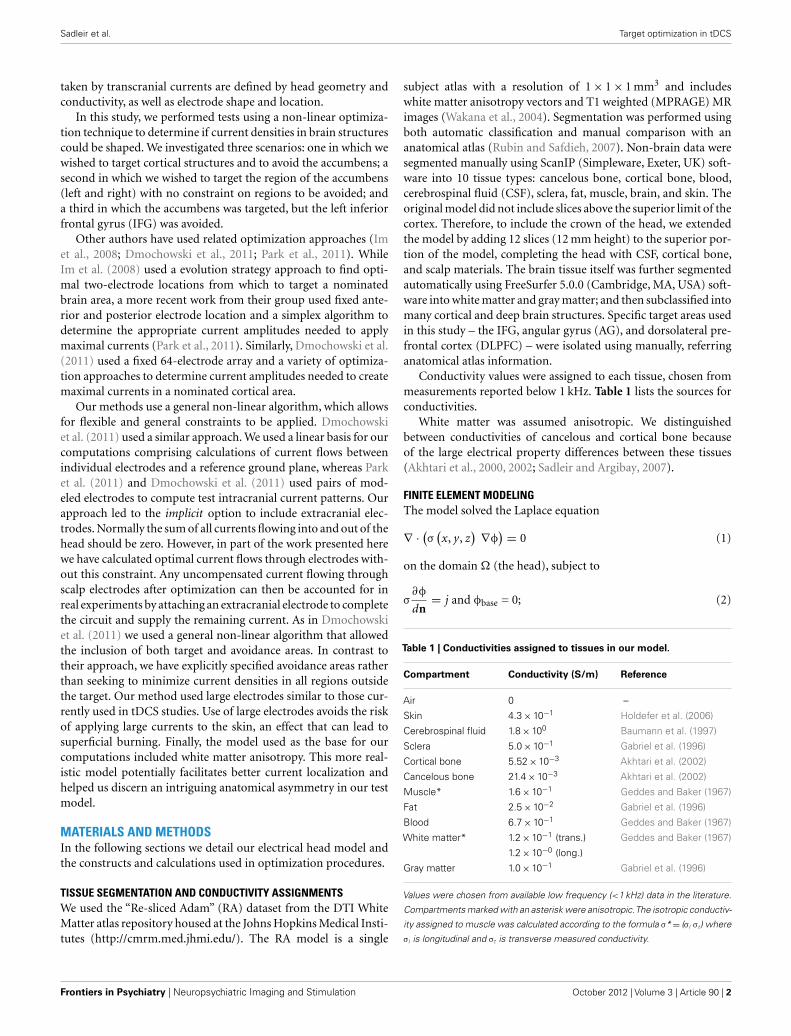
Boundary conditionsThe base data used in the optimization procedure consisted ofvoltage data calculated between each electrode and a ground planesituated at the base of the model (Figure 2). In calculating thevoltage data for each isolated electrode in turn, we simulated atotal current of 1 mA injected into the head. Use of this singleelectrode arrangement allowed us to include the possibility thatextracranial electrodes could be included (simply by allowing thesum of currents applied to the model to have a net non-zero value,implying that the extra current flowed through the neck and to anelectrode located away from the head.
F3
T3F7
C3
FPz
Fz
Cz
Pz
P3
T5
Angular Gyrus
Postcentral GyrusPrecentral Gyrus
DLPFC
IFG
A
B
FIGURE 1 | Electrode montage and tissue segmentation. (A) Leftfrontal view of electrode montage shown on a transparent head model.There were 19 electrodes in total, not all of which are shown. (B)Segmented cortical structures, showing frontal (aqua), parietal (red),
FIGURE 2 | Illustration of addition of 2 base voltage distributions withopposite weights to form a generic 2-electrode tDCS pattern. (Top)Current streamlines formed between the electrode at F3 and model base;(center) current streamlines formed between P4 and model base; (bottom)current streamlines resulting from subtraction of P4 data from F3 data.Streamline colors are indexed to voltage values.
DATA COMPUTATIONVoltage distributions for a particular electrode combination werecomputed using the principle of superposition by summing theweighted basis data set as
VX = X1V1 + X2V2 + · · · + XNEVNE (3)
where X = [X 1X 2. . .X NE] was a vector of weighting factors foreach voltage data set, V 1 . . .NE were the basis data sets, and VX
was the resulting voltage. Figure 2 shows the result of weightedsummation of voltage basis data using electrodes F3 and P4. Thetop and center panels of Figure 2 show individual voltage basis datafor electrodes F3 and P4, and the lower panel shows the result of
adding data for electrode F3 (weight 1 mA) to data for P3 (weight−1 mA). The total current magnitude injected into the head wascomputed as
Ctotal =1
2
NE∑i=1
|Xi | (4)
The current density J in each voxel k was calculated as
Jk = − Dk∇φ (5)
where5φ is the local voltage gradient.Current density norms J were calculated within each voxel from
individual vector components as
J =(
J 2x + J 2
y + J 2z
)1/2(6)
This distribution was then used to compute mean or mediancurrent densities within regions of interest.
OPTIMIZATION PROCEDUREWe used the interior point optimization method to calculate theoptimal electrode currents. The interior point algorithm (Waltzet al., 2006) solves a general non-linear minimization problemsubject to linear and non-linear constraints. Other methods forsolving such problems include sequential quadratic program-ming methods (Bonnans et al., 2006) and simulated annealing(Kirkpatrick et al., 1983).
Our interior point optimization algorithm was implementedin the MATLAB (Natick, MA, USA) function fmincon to solve.
Here, X is the vector consisting of coefficients denoting the stim-ulus intensity to be delivered to each electrode, and J refers tothe current density norm within a brain structure (a target regionor a region to avoid). The quantity max
X
[mean(Jtarget (X ))
]is the
objective function. The optimization is subject to the constraintsthat the total current injected into the brain is zero (constraint 1),the mean J delivered to the “avoid” region is less than a prescribedmaximum value (J max, constraint 2), the total absolute deliveredcurrent is above a set threshold (Cmin, constraint 3) and belowanother threshold (Cmax, constraint 4), and the mean J in thetarget region is at least r times the mean current density in theavoid region, where r is a dimensionless constant (constraint 5).Only constraint 4 is essential. For example, if constraint 1 is not
Frontiers in Psychiatry | Neuropsychiatric Imaging and Stimulation October 2012 | Volume 3 | Article 90 | 4
FIGURE 3 | Optimized current weights (in mA) found in the three problems, shown in graphical and tabular format. Weights are displayed in (top)Anterior-Posterior and (bottom) Left-Right arrangements.
applied, any unbalanced flow of current through the ground planemay be considered as flow to or from an extracranial electrode,such as those used in several previous studies (Cogiamanian et al.,2007; Monti et al., 2008; Priori et al., 2008). We may consider otherconstraints, such as a limit on the maximum skin J.
Termination criteriaThe optimization procedure was terminated if more than 100 iter-ations were required, if the relative step size of any iteration wasbelow 1 part in 1010 or if the gradient estimate was below 1 part in103. A feasible solution was considered achieved if the maximumconstraint violation was smaller than 1 part in 1010
.
Mean and median current density valuesAlthough we have previously (Sadleir et al., 2010) quoted mediancurrent densities as best representative of distributions, and haveobserved that the current density distributions are approximatelylog-normal, there is no analytical method to associate the medianof sums and the sum of medians for log-normal distributions(Limpert et al., 2001). This limitation prevents us from associatingmedian current densities in individual base current distributionswith the median of their sum. Consequently, the gradient of
the objective function cannot be computed, except numerically.Numerical gradient estimation requires many extra function esti-mations and greatly slows the optimization algorithm. We there-fore estimated the gradient of the objective function by computingthe mean J created in the target region for each of the 19 candi-date patterns. This approach does not produce an exact gradient,but the sum of weighted mean current densities is greater than orequal to actual mean J values, that is
FIGURE 4 | Comparison of current density distributions formed by threecandidate current patterns (the optimal solution to Problem 1, X; aconfiguration previously used in the literature (F3-RS); and a
configuration formed using the two electrodes with the largest weightsof X. Median values found in each tissue for the optimal solution (X) areshown within each graph of the figure.
Frontiers in Psychiatry | Neuropsychiatric Imaging and Stimulation October 2012 | Volume 3 | Article 90 | 6
In the first step of the optimization algorithm,our precomputedgradient was compared with internal estimations of gradient andfound to agree within a relative tolerance of 1× 10⁻⁶. Thus, webelieve that the precomputed gradient provided a satisfactory esti-mate to guide optimization. In the results that follow, we continueto present our findings in terms of median values.
PROBLEMS CONSIDEREDWe tested the optimization procedure in the context of three dif-ferent problems. First, we sought to deliver current preferentiallyto the left IFG, while avoiding delivery to the accumbens (Problem1). In this problem we required that the J max experienced by leftand right accumbens was less than 0.5 µA/cm2, while we choseCmin and Cmax to be 0.5 and 2 mA, respectively. We also requiredthat the mean J in the left IFG was at least twice the mean J in theaccumbens (r = 2).
In Problem 2, we wished to deliver maximal J to the accum-bens. No “avoid” region was nominated, but we again chose Cmin
and Cmax to be 0.5 and 2 mA, respectively.In Problem 3, we again nominated the accumbens as the target,
but specified that the left IFG be avoided. We set the mean J ratio,r, to be 1. Again, Cmin and Cmax were 0.5 and 2 mA, respectively.
RESULTSPROBLEM 1We executed Problem 1 using the procedures outlined above andobtained a result X that satisfied all constraints. The optimizationalgorithm was terminated because the step size was smaller thanthe threshold value of 10−10. First-order optimality was found tobe around 10−3. The values of individual coefficients are plottedin Figure 3. Note that the positive weights of each electrode werebiased toward those near the left IFG, such as F3.
We compared the results of Problem 1 optimization with thoseachieved for an earlier simulation in which only two electrodeswere used [F3 and a right supraorbital (RS) electrode]. We alsocomputed the current densities resulting from an F3-P3 pattern,given that the estimated X value contained large coefficients foreach of these electrodes. The results for these three configura-tions are compared in Figure 4, showing the current distributionsin different tissues. The 1-norm of the total current found forour “optimized” problem, C = 1.15 mA, was scaled so that thetotal injected current had the same value of 1 mA in all threeconfigurations.
The median current density in different tissues found in each ofthese three configurations is shown in Table 2. The current densi-ties in the target and avoided regions are highlighted in green andred respectively.
The current distributions in peripheral cortical tissues are sum-marized in Figure 5. The distributions in the IFG, DLPFC, andangular gyrus are shown bilaterally. The median current densi-ties in the left IFG were approximately four times those in theright IFG.
PROBLEM 2Solution of Problem 2, which sought to maximize mean cur-rent densities in the accumbens with no “avoid” region specified,was terminated because the maximum number of iterations was
Table 2 | Median current density values found in different tissues and
structures for Problem 1.
X F3-RS F3-P3
mA/cm2 mA/cm2 mA/cm2
TISSUE
Blood 1.04×10⁻⁴ 4.45×10⁻³ 4.85×10⁻⁴
Cancelous bone 7.49×10⁻⁵ 8.04×10⁻⁴ 1.32×10⁻⁴
Cortical bone 2.97×10⁻⁵ 3.66×10⁻⁴ 4.41×10⁻⁵
CSF 2.75×10⁻⁴ 7.49×10⁻³ 9.36×10⁻⁴
Fat 9.67×10⁻⁴ 8.54×10⁻⁴ 1.22×10⁻⁴
Gray matter 3.21×10⁻⁴ 9.06×10⁻⁴ 1.01×10⁻⁴
Muscle 3.36×10⁻³ 4.52×10⁻³ 1.53×10⁻⁴
Sclera 6.22×10⁻⁴ 4.65×10⁻³ 2.12×10⁻⁴
Skin 1.18×10⁻² 9.42×10⁻³ 2.80×10⁻³
White matter 6.98×10⁻⁴ 2.26×10⁻³ 2.22×10⁻⁴
CORTICAL STRUCTURE
AG (L) 7.20×10⁻⁴ 9.31×10⁻⁴ 2.22×10⁻³
AG (R) 3.10×10⁻⁴ 5.96×10⁻⁴ 7.00×10⁻⁴
Cingulate 2.88×10⁻⁴ 9.09×10⁻⁴ 1.18×10⁻³
DLPFC (L) 1.13×10⁻³ 1.52×10⁻³ 2.82×10⁻³
DLPFC (R) 3.26×10⁻⁴ 1.68×10⁻³ 9.78×10⁻⁴
Frontal lobe 4.39×10⁻⁴ 2.07×10⁻³ 1.31×10⁻³
IFG (L) 8.26×10⁻⁴ 1.87×10⁻³ 2.14×10⁻³
IFG (R) 2.63×10⁻⁴ 1.49×10⁻³ 7.73×10⁻⁴
Occipital lobe 3.14×10⁻⁴ 3.84×10⁻⁴ 8.89×10⁻⁴
Parietal lobe 3.92×10⁻⁴ 6.45×10⁻⁴ 1.20×10⁻³
Temporal lobe 3.49×10⁻⁴ 8.72×10⁻⁴ 8.93×10⁻⁴
DEEP STRUCTURE
Accumbens 9.74×10⁻⁵ 1.38×10⁻³ 9.08×10⁻⁴
Amygdala 2.19×10⁻⁴ 1.37×10⁻³ 1.18×10⁻³
Caudate nucleus 1.66×10⁻⁴ 1.70×10⁻³ 9.13×10⁻⁴
Cerebellar GM 2.03×10⁻⁴ 4.06×10⁻⁴ 4.92×10⁻⁴
Hippocampus 2.46×10⁻⁴ 1.15×10⁻³ 8.91×10⁻⁴
Globus pallidus 1.65×10⁻⁴ 1.20×10⁻³ 9.26×10⁻⁴
Putamen 2.06×10⁻⁴ 1.37×10⁻³ 8.70×10⁻⁴
Thalamus 2.01×10⁻⁴ 1.03×10⁻³ 1.02×10⁻³
The optimal weighting X was compared with another candidate pattern (F3-RS)
and a pattern found using the 2 greatest weights in X. Median values in targeted
and avoided regions are highlighted in green and red shading, respectively.
exceeded. However, substantial progress toward a solution wasmade. We found that the optimization procedure produced a clearbias toward anterior and posterior electrodes. Also, there were onlyfour electrodes with an absolute normalized weight greater than1 µA – electrodes F7, O1, O2, Oz, and T6. The electrode with thelargest weight, F7, was not centrally located, being on the lowerleft head, and all other electrodes had negative weights. We believethat this unexpected bias may have resulted from inhomogene-ity in the conductivity distribution or white matter directions.The problem resulted in a first-order optimization value of about2× 10−3, larger than the value found in solving Problem 1.
Distribution estimations within basal ganglia and peripheralcortical structures for Problem 2 are plotted in Figure 6 for thenormalized optimized pattern. A comparison with a 2-electrodepattern chosen by using only the electrodes with the two largest
FIGURE 5 | Distribution of current densities in peripheral corticalstructures in Problem 1 found using the optimal solution, X. Medianvalues in each structure obtained using the optimal solution are shown withineach graph of the figure. IFG, DLPFC, and AG refer to the inferior frontal gyrus
(IFG), dorsolateral prefrontal cortex (DLPFC), and angular gyrus (AG),respectively. For the IFG, DLPFC, and AG, current density distributions areshown separately for left (blue) and right (red) structures, with median valuesshown on either side of each plot.
magnitude weights found by the optimization procedure, F7 andOz, is shown in Table 3. The current densities found in target struc-tures by the optimization procedure (using five electrodes) werevery similar to this 2-electrode pattern. Median eye current den-sities found for both the F7-Oz pattern and the optimal solutionwere around 10 µA/cm2. The threshold for phosphene generationcited in the literature (8 mA/m2 or 0.8 µA/cm2; Reilly, 1998) wasbased on stimulation at 20 Hz. Therefore, even though the thresh-old for DC stimulation might in fact be at least a factor of 10 higher(Adrian, 1977), we would expect this current pattern to producephosphenes.
A test performed using the F7-Oz pattern as an initial point forthe procedure resulted in no progress toward the final solution.Interestingly, the first-order optimality measure found using F7-Oz was 3.5× 10⁻³, larger than that found for the final value of Xfor Problem 2, which was around 2× 10⁻³.
PROBLEM 3The pattern found when the IFG was specified as the“avoid”regionwas biased toward electrodes on the right side of the head, asexpected. Execution of Problem 3 was terminated because thestep size decreased below threshold. Results for the normalizedoptimized pattern are shown in Figure 7 for peripheral and deepstructures. Table 4 shows median values in different structures forthis pattern and for a 2-electrode pattern found by combining the
electrodes that had the two largest magnitude weights in X–C4and FPz. Current densities found in the right cortex were gener-ally larger than those in the left cortex or deep brain structures.Median current densities in the eye for this case were larger than inProblem 2 (around 7× 10⁻² mA/cm2), and therefore phosphenegeneration would be highly likely with this configuration.
USE OF FEWER THAN 19 ELECTRODESResults obtained by the optimization, with approximate normal-ized “optimal” patterns created using the 2-, 4-, and 6-highestmagnitude current electrodes are shown in Table 5, now com-paring target and avoid regions for each pattern. In this test, ifthe sum of currents from the set of electrodes was found to benon-zero (contrary to constraint 1), we assumed that remain-ing current flowed to an extracranial electrode. These electrodepatterns resulted in distributions in the target or avoid struc-tures being of the same magnitude as those found using the full19-electrode montage.
DISCUSSIONThe solution of problem 1 demonstrates how an optimizationapproach might be used to allow more efficient and precise tar-geting of tDCS currents to nominated brain regions and enablesteering of current away from other specified areas in individ-ual subjects. The solution we found for this problem successfully
Frontiers in Psychiatry | Neuropsychiatric Imaging and Stimulation October 2012 | Volume 3 | Article 90 | 8
FIGURE 6 | Distribution of current densities in (top) peripheral corticalstructures and (bottom) deep brain structures for Problem 2. Medianvalues in each structure obtained using the optimal solution X are shownwithin each graph of the figure. IFG, DLPFC, and AG refer to the inferior
frontal gyrus (IFG), dorsolateral prefrontal cortex (DLPFC), and angular gyrus(AG), respectively. For the IFG, DLPFC, and AG, current density distributionsare shown separately for left (blue) and right (red) structures, with medianvalues shown on either side of each plot.
directed current away from the accumbens (producing a bilateralmedian current density of 9.74× 10⁻⁵ mA/cm2) and producinga median current density in the IFG of 8.26× 10⁻⁴ mA/cm2 inthe IFG target. By comparison, the two alternative current pat-terns, F3-RS and F3-P3, although producing larger current den-sities in the IFG, both produced median current densities in theaccumbens that were at least a factor of 10 larger. The abilityto selectively deliver current to different structures may thereforefacilitate experiments relating to the structures and mechanismsinvolved in tDCS effects, particularly when implemented usingsubject-specific models. Further, use of distributed (i.e., more thantwo electrodes) current patterns may reduce skin currents and thelikelihood of peripheral nerve stimulation and therefore provide asafety benefit over other patterns.
USE OF FEWER ELECTRODESIt may also be that patterns using fewer electrodes, based on these“optimal” designs, can be achieved, as demonstrated in Section“Use of Fewer Than 19 Electrodes.”These patterns could be imple-mented by coupling several current generators together. Use of aselection of higher weighted electrodes in combination with a sin-gle extracranial electrode might provide a practical method ofimplementing computed patterns.
SAFETY CONSIDERATIONSThe maximal skin currents shown in Table 5 were reduced asmore electrodes were incorporated. Therefore, use of more elec-trodes may make it possible to apply a larger total current andachieve some current steering without causing peripheral nervestimulation. The nominal current density value thought to pro-duce peripheral nerve stimulation is about 0.1 mA/cm2 (Reilly,1998). Note that in all but one case shown in Table 5, the predictedmaximum skin current densities were above this limit. However,these current densities were observed in very small volumes nearelectrodes, and it is unclear whether these patterns would actuallyresult in a subject’s perception of the current. In the two problemstargeting deep structures, we observed median eye currents of theorder of 0.1 mA/cm2. This prediction implies that phosphene gen-eration is likely using these patterns. Use of the eye as an “avoid”region might produce more acceptable patterns.
USE OF MORE CONSTRAINTSThe problems we have considered here involve a fixed amountof current applied to the head. This current must flow some-where. Use of “avoid”constraints may result in large currents beingobserved in areas that are neither avoided nor target regions, suchas those found in right peripheral cortical regions in Problem3. This issue will obviously be more prevalent as more avoidedregions are chosen and will depend on the relative geometry ofelectrodes, avoided regions, and target regions. We expect that itmay not be possible to solve some over constrained optimizationtasks, or to find a feasible starting point.
A corollary finding is that these observations may be beneficialand provide alternatives to previous stimulation protocols. Forexample, the median J found in the left IFG by Problem 2 waslarger than that found using the F3-RS current pattern, which hasbeen presumed appropriate for stimulating this area. If applying a
Table 3 | Median current density values found in different tissues and
structures for Problem 2.
X FPz-Oz F7-Oz
mA/cm2 mA/cm2 mA/cm2
TISSUE
Blood 6.00×10⁻³ 5.94×10⁻³ 6.07×10⁻³
Cancelous bone 6.89×10⁻⁴ 6.69×10⁻⁴ 6.81×10⁻⁴
Cortical bone 6.09×10⁻⁴ 3.42×10⁻⁴ 5.76×10⁻⁴
CSF 1.00×10⁻² 1.21×10⁻² 1.02×10⁻²
Fat 1.09×10⁻³ 8.46×10⁻⁴ 9.90×10⁻⁴
Gray matter 1.38×10⁻³ 1.36×10⁻³ 1.40×10⁻³
Muscle 6.84×10⁻³ 3.56×10⁻³ 6.78×10⁻³
Sclera 7.47×10⁻³ 6.58×10⁻³ 7.53×10⁻³
Skin 1.14×10⁻² 8.38×10⁻³ 1.11×10⁻²
White matter 6.92×10⁻³ 2.81×10⁻³ 6.96×10⁻³
CORTICAL STRUCTURE
AG (L) 1.69×10⁻³ 1.27×10⁻³ 1.70×10⁻³
AG (R) 1.00×10⁻³ 1.27×10⁻³ 9.80×10⁻⁴
Cingulate 8.70×10⁻⁴ 1.07×10⁻³ 8.86×10⁻⁴
DLPFC (L) 1.99×10⁻³ 1.86×10⁻³ 2.00×10⁻³
DLPFC (R) 8.92×10⁻⁴ 1.71×10⁻³ 8.92×10⁻⁴
Frontal lobe 1.44×10⁻³ 1.82×10⁻³ 1.45×10⁻³
IFG (L) 3.03×10⁻³ 1.83×10⁻³ 3.05×10⁻³
IFG (R) 8.73×10⁻⁴ 1.62×10⁻³ 8.75×10⁻⁴
Occipital lobe 1.26×10⁻³ 1.12×10⁻³ 1.32×10⁻³
Parietal lobe 9.47×10⁻⁴ 9.72×10⁻⁴ 9.50×10⁻⁴
Temporal lobe 1.85×10⁻³ 1.44×10⁻³ 1.87×10⁻³
DEEP STRUCTURE
Accumbens (L) 2.33×10⁻³ 1.46×10⁻³ 2.34×10⁻³
Accumbens (R) 1.74×10⁻³ 1.42×10⁻³ 1.75×10⁻³
Amygdala 2.37×10⁻³ 1.95×10⁻³ 2.39×10⁻³
Caudate nucleus 1.70×10⁻³ 1.26×10⁻³ 1.71×10⁻³
Cerebellar GM 1.43×10⁻³ 1.40×10⁻³ 1.46×10⁻³
Hippocampus 2.01×10⁻³ 1.52×10⁻³ 2.03×10⁻³
Globus pallidus 1.80×10⁻³ 1.32×10⁻³ 1.82×10⁻³
Putamen 2.06×10⁻³ 1.23×10⁻³ 2.07×10⁻³
Thalamus 1.42×10⁻³ 1.48×10⁻³ 1.43×10⁻³
The optimal weighting X is compared with a symmetric pattern (FPz-Oz) and a
pattern found using the 2 greatest weights in X (F7-Oz). Median values in the
targeted region are highlighted in green shading.
large current to the left IFG is the only requirement, then a patternsimilar to that found in Problem 2 might also be considered tostimulate the IFG of a similar subject.
OPTIMALITYThe results we have found have satisfied the requirements specifiedto the optimization algorithm, with some exceptions. However,there is no guarantee that the solution is a global optimum oreven unique. A trivial demonstration of the non-uniqueness ofsolutions is that exactly the same current densities as any candi-date weighting, X, will be produced by−X, since most constraintsand objective function are based solely on current density magni-tude. This lack of uniqueness could be resolved by introducing a
Frontiers in Psychiatry | Neuropsychiatric Imaging and Stimulation October 2012 | Volume 3 | Article 90 | 10
FIGURE 7 | Distribution of current densities in (top) peripheral corticalstructures and (bottom) deep brain structures for Problem 3. Medianvalues in each structure obtained using the optimal solution X are shownwithin each graph of the figure. IFG, DLPFC, and AG refer to the inferior
frontal gyrus (IFG), dorsolateral prefrontal cortex (DLPFC), and angular gyrus(AG), respectively. For the IFG, DLPFC, and AG, current density distributionsare shown separately for left (blue) and right (red) structures, with medianvalues shown on either side of each plot.
Table 4 | Median current density values found in different tissues and
structures for Problem 3.
X C4-FPz
mA/cm2 mA/cm2
TISSUE
Blood 5.31×10⁻⁴ 4.67×10⁻³
Cancelous bone 1.66×10⁻³ 1.31×10⁻³
Cortical bone 7.18×10⁻⁴ 3.42×10⁻⁴
CSF 1.00×10⁻² 9.91×10⁻³
Fat 2.41×10⁻³ 1.25×10⁻³
Gray matter 1.48×10⁻³ 1.09×10⁻³
Muscle 7.79×10⁻³ 3.01×10⁻³
Sclera 2.90×10⁻³ 4.93×10⁻³
Skin 2.46×10⁻² 1.58×10⁻²
White matter 3.09×10⁻³ 2.75×10⁻³
CORTICAL STRUCTURE
AG (L) 9.10×10⁻⁴ 5.48×10⁻⁴
AG (R) 2.85×10⁻³ 2.55×10⁻³
Cingulate 1.24×10⁻³ 1.36×10⁻³
DLPFC (L) 3.67×10⁻⁴ 1.67×10⁻³
DLPFC (R) 1.46×10⁻³ 2.82×10⁻³
Frontal lobe 6.89×10⁻³ 1.94×10⁻³
IFG (L) 2.28×10⁻⁴ 1.43×10⁻³
IFG (R) 1.76×10⁻³ 2.11×10⁻³
Occipital lobe 1.69×10⁻³ 6.92×10⁻⁴
Parietal lobe 1.26×10⁻³ 1.03×10⁻³
Temporal lobe 1.79×10⁻³ 7.06×10⁻⁴
DEEP STRUCTURE
Accumbens (L) 6.56×10⁻⁴ 1.00×10⁻³
Accumbens (R) 1.11×10⁻³ 1.36×10⁻⁴
Amygdala 1.37×10⁻³ 1.19×10⁻³
Caudate nucleus 1.04×10⁻³ 1.12×10⁻³
Cerebellum GM 2.31×10⁻³ 7.04×10⁻⁴
Hippocampus 1.57×10⁻³ 7.85×10⁻⁴
Globus pallidus 1.16×10⁻³ 8.97×10⁻⁴
Putamen 1.12×10⁻³ 9.93×10⁻⁴
Thalamus 1.27×10⁻³ 9.91×10⁻⁴
The optimal weighting X is compared with a pattern found using the 2 great-
est weights in X (C4-Pz). Median values in targeted and avoided regions are
highlighted in green and red shading, respectively.
constraint on a single electrode, i, that restricted its coefficient, X i,to be either less than or greater than zero.
The optimality measure produced by the algorithm, a numer-ical measure of the gradient of the objective function at eachiteration, was found to be less than 10−3 for solution of Problem 1.We know that our gradient estimation is not exact, but this valueshould provide some indication of the landscape of the objectivefunction. Even if gradient estimation is exact, finding an optimal-ity measure that suggests the objective function is at or near anextreme value does not guarantee that the solution attained is aglobal minimum.
Solutions in Problems 2 and 3 produced optimality measuresof around 2 and 3× 10⁻³, respectively. Solutions in these twoproblems took many more iterations to produce than in Problem
Table 5 | Comparison of effects of using 2-, 4- and 6-electrode patterns
Skin maximum 2.34×10⁻¹ 1.32×10⁻¹ 9.71×10⁻² 2.31×10⁻¹
Medians in targeted and avoided regions are highlighted in green and red shading,
respectively. Maximum skin current densities are also shown for each pattern.
1, and solution of Problem 2 was terminated because the algorithmrequired more than 100 iterations. Very similar results to the opti-mal solution (X) to Problem 2 were found using its two principalelectrodes, and, in fact, J values in the target structure were slightlylarger when the two principal electrodes were used. It is possiblethat the F7-Oz solution is very close to the optimum solutionfor this Problem, and with this subject model. This finding mayalso suggest that solutions targeting of deep structures may notbe unique, and that there are other possible configurations thatsatisfy the problem specification.
CONCLUSIONWe demonstrated that use of a finite element model of the head,in conjunction with a non-linear optimization procedure, couldresult in current steering both away from and toward differentstructures. We found that it was possible to direct current to theleft IFG while avoiding the accumbens region; to target current onthe basal ganglia exclusively; and to avoid the left IFG while target-ing basal ganglia. When deep structures were targeted, it was notpossible to avoid delivering current to peripheral cortical regions.Further, use of this methodology revealed asymmetry in struc-tures that may not have easily been found using other strategies.We believe that this or a similar method of optimization may proveuseful in further studies of tDCS.
ACKNOWLEDGMENTSThis work was supported by the Therapeutic Cognitive Neuro-science Fund (Barry Gordon) and by the Benjamin A. Miller andFamily Endowment for Aging, Alzheimer’s Disease, and Autism(Barry Gordon).
Frontiers in Psychiatry | Neuropsychiatric Imaging and Stimulation October 2012 | Volume 3 | Article 90 | 12
visual sensations stimulated by low-frequency electric currents. RadioSci. 12, 243–250.
Akhtari, M., Bryant, H. C., Mamelak, A.N., Flynn, E. R., Heller, L., Shih, J. J.,et al. (2002). Conductivities of three-layer live human skull. Brain Topogr.14, 151–167.
Akhtari, M., Bryant, H. C., Mamelak, A.N., Heller, L., Shih, J. J., Mandelk-ern, M., et al. (2000). Conductivi-ties of three-layer human skull. BrainTopogr. 13, 29–42.
Baumann, S. B., Wozny, D. R., Kelly, S.K., and Meno, F. M. (1997). The elec-trical conductivity of human cere-brospinal fluid at body tempera-ture. IEEE Trans. Biomed. Eng. 44,220–223.
Bonnans, J. F., Gilbert, J. C., Lemarechal,C., and Sagastizabal, C. (2006).Numerical Optimization – Theoret-ical and Practical Aspects, 2nd Edn.Berlin: Springer Verlag.
Brunelin, J., Mondino, M., Gassab, L.,Haesebaert, F., Gaha, L., Suaud-Chagny, M., et al. (2012). Examiningtranscranial direct-current stimula-tion (tDCS) as a treatment for hal-lucinations in schizophrenia. Am. J.Psychiatry 169, 719–724.
Brunoni, A., Nitsche, M. A., Bolognini,N., Bikson, M., Wagner, T., Mer-abet, L., et al. (2012). Clinicalresearch with transcranial direct cur-rent stimulation (tDCS): challengesand future directions. Brain Stimul.5, 175–195.
Cogiamanian, F., Marceglia, S.,Ardolino, G., Barbieri, S., and Priori,A. (2007). Improved isometric forceendurance after transcranial directcurrent stimulation over the humanmotor cortical areas. Eur. J. Neurosci.26, 242–249.
Datta, A., Bansal, V., Diaz, J., Patel, J.,Reato, D., and Bikson, M. (2009).Gyri-precise head model of tran-scranial direct current stimulation:improved spatial focality using a
ring electrode versus conventionalrectangular pad. Brain Stimulat. 2,201–207.
Dmochowski, J. P., Datta, A., Bikson,M., Su, Y., and Parra, L. C. (2011).Optimized multi-electrode stimula-tion increases focality and intensityat target. J. Neural Eng. 8, 046011.
Elmer, S., Burkard, M., Renz, B., Meyer,M., and Jancke, L. (2009). Directcurrent induced short-term modu-lation of the left dorsolateral pre-frontal cortex while learning audi-tory presented nouns. Behav. BrainFunct. 5, 29.
Fregni, F., Boggio, P. S., Nitsche, M.A., Bermpohl, F., Antal, A., Fere-does, E., et al. (2005). Anodal tran-scranial direct current stimulationof prefrontal cortex enhances work-ing memory. Exp. Brain Res. 166,23–30.
Gabriel, C., Gabriel, S., and Corthout,E. (1996). The dielectric proper-ties of biological tissues: I. Liter-ature survey. Phys. Med. Biol. 41,2231–2249.
Geddes, L., and Baker, L. E. (1967).The specific resistance of biologicalmaterials: a compendium of data forthe biomedical engineer and physi-ologist. Med. Biol. Eng. Comput. 5,271–293.
Holdefer, R. N., Sadleir, R. J., and Rus-sell, M. J. (2006). Predicted currentdensities in the brain during tran-scranial electrical stimulation. Clin.Neurophysiol. 117, 1388–1397.
Im, C.-H., Jung, H.-H., Choi, J.-D., Lee,S. Y., and Jung, K.-Y. (2008). Deter-mination of optimal electrode posi-tions for transcranial direct currentstimulation (tDCS). Phys. Med. Biol.53, N219–N225.
Kirkpatrick, S., Gelatt, C. D., and Vec-chi, M. P. (1983). Optimization bysimulated annealing. Science 220,671–680.
Limpert, E., Stahel, W. A., and Abbt,M. (2001). Log-normal distribu-tions across the sciences: keys andclues. Bioscience 51, 341–352.
Loo, C. K., Alonzo, A., Martin, D.,Mitchell, P. B., Galvez, V., andSachdev, P. (2012). Transcranialdirect current stimulation fordepression: 3-week, randomised,sham-controlled trial. Br. J.Psychiatry 200, 52–59.
Monti, A., Cogiamanian, F., Marceglia,S.,Ferrucci,R.,Marmeli,F.,Mrackic-Sposta, S., et al. (2008). Improvednaming after transcranial directcurrent stimulation in aphasia. J.Neurol. Neurosurg. Psychiatr. 79,451–453.
Nitsche, M. A., Cohen, L. G., Wasser-mann, E. M., Priori, A., Lang, N.,Antal, A., et al. (2008). Transcra-nial direct current stimulation: stateof the art 2008. Brain Stimulat. 1,206–223.
Nitsche, M. A., and Paulus, W. (2000).Excitability changes induced in thehuman motor cortex by weak tran-scranial direct current stimulation. J.Physiol. 527, 633–639.
Park, J. H., Hong, S. B., Kim, D.-W., Suh,M., and Im, C.-H. (2011). A novelarray-ype transcranial direct currentstimulation (tDCS) system for accu-rate focusing on targeted brain areas.IEEE Trans. Magn. 47, 882–885.
Priori, A., Mameli, F., Cogiamanian, F.,Marceglia, S., Tiriticco, M., Mrackic-Sposta, S., et al. (2008). Lie-specificinvolvement of dorsolateral pre-frontal cortex in deception. Cereb.Cortex 18, 451–455.
Reilly, J. P. (1998). Applied Bioelectricity:From Electrical Stimulation to Elec-tropathology. New York: Springer.
Rubin, M., and Safdieh, J. E. (2007).Netter’s Concise Neuroanatomy.Philadelphia: Saunders Elsevier.
Sadleir, R. J., and Argibay, A. (2007).Modeling skull electrical properties.Ann. Biomed. Eng. 35, 1699–1712.
Sadleir, R. J., Vannorsdall, T. D.,Schretlen, D. J., and Gordon, B.(2010). Transcranial direct currentstimulation (tDCS) in a realis-tic head model. Neuroimage 51,1310–1318.
Scott, G. C., Joy, M. L. G., Arm-strong, R. L., and Henkelman, R.M. (1991). Measurement of nonuni-form current density by magneticresonance. IEEE Trans. Med. Imaging10, 362–374.
Wagner, T., Fregni, F., Fecteau, S.,Grodzinsky, A., Zahn, M., andPascual-Leone, A. (2007). Tran-scranial direct current stimulation:a computer-based human modelstudy. Neuroimage 35, 1113–1124.
Wakana, S., Jiang, H., Nagae-Poetscher,L. M., Van Zijl, P. C. M., and Mori,S. (2004). Fiber tract-based atlas ofhuman white matter anatomy. Radi-ology 230, 77–87.
Waltz, R. A., Morales, J. L., Nocedal, J.,and Orban, D. (2006). An interioralgorithm for nonlinear optimiza-tion that combines line search andtrust region steps. Math. Program-ming 107, 391–408.
Conflict of Interest Statement: Theauthors declare that the research wasconducted in the absence of any com-mercial or financial relationships thatcould be construed as a potential con-flict of interest.