Anand Rathi Share and Stock Brokers Limited (hereinafter “ARSSBL”) is a full-service brokerage and equities-research firm and the views expressed therein are solely of ARSSBL and not of the companies which have been covered in the Research Report. This report is intended for the sole use of the Recipient. Disclosures and analyst certifications are present in the Appendix. Anand Rathi Research India Equities India I Equities Key financials (YE Mar) FY17 FY18 FY19e FY20e FY21e Sales (` m) 7,422 9,676 11,376 14,903 17,751 Net profit (` m) 971 1,699 2,039 2,334 2,594 EPS (`) 5.9 10.3 12.4 14.2 15.8 PE (x) 27.9 16.0 13.4 11.7 10.5 EV / EBITDA (x) 15.3 9.1 7.6 7.0 6.0 PBV (x) 3.0 2.6 2.3 2.0 1.8 RoE (%) 10.6 16.2 17.1 17.3 16.9 RoCE (%) 10.2 15.6 16.7 16.9 16.7 Dividend yield (%) 1.1 1.5 1.9 2.1 2.4 Net debt / equity (x) -0.3 -0.3 -0.2 -0.1 -0.2 Source: Company, Anand Rathi Research Chemicals Initiating Coverage Nav Bhardwaj Research Analyst +9122 66266576 [email protected]Bhawana Israni Research Associate Rating: Buy Target Price: `210 Share Price: `166 Relative price performance Source: Bloomberg NOCIL Sensex 140 150 160 170 180 190 200 210 220 230 Dec-17 Jan-18 Feb-18 Mar-18 Apr-18 May-18 Jun-18 Jul-18 Aug-18 Sep-18 Oct-18 Nov-18 Dec-18 Key data NOCIL IN / NOCL.BO 52-week high / low `236 / 140 Sensex / Nifty 36255 / 10910 3-m average volume $1.4m Market cap `28bn / $395m Shares outstanding 165m Shareholding pattern (%) Sep ’18 Jun ’18 Mar ’18 Promoters 34.1 35.1 35.8 - of which, Pledged 12.6 16.4 13.0 Free float 65.9 64.9 64.2 - Foreign institutions 4.7 4.8 5.5 - Domestic institutions 60. 5.3 5.0 - Public 55.2 54.9 53.7 02 January 2019 Nocil Ceteris Paribus; Buy Capacity expansions of tyre companies (demand side) and the doubling of Nocil’s production capacity (supply side) should keep volume growth steady for the company. However, auto sector sales would determine OEM demand and, growth in the logistics sector, the tyre replacement market, and in turn utilisation of tyre-companies’ new capex. This would govern realisations of rubber chemicals. Potential growth in this jamboree of binary events keeps us cautiously optimistic about Nocil. Nevertheless, we initiate coverage on it, with a Buy rating, for a target price of `210. Capacity doubling, market leader. Nocil has captured over 50% of the rubber chemicals market in India, and nearly 5% globally. It is confident of controlling nearly 10% of the global market in rubber chemicals. It is investing `4.5bn in three phases, expected to be operational from H2 FY20. Pricing/margins impacted by many moving parts. Indian anti-dumping duty (ADD) on Chinese rubber chemicals, Indian ADD on Chinese tyres, American ADD on Chinese tyres, growth of China’s auto industry, growth of the Indian auto industry, growth in Indian logistics (resulting in demand in the tyre-replacement market) are key moving parts which would determine growth and realisations in rubber chemicals. Peak margins due to efficient cost control. The EBITDA margin expansion from ~10% in FY14 to ~27% in FY18 was primarily due to efficient cost-control measures since realisation per ton has not increased greatly. Valuation. The stock trades at 13x FY19e, 12x FY20e and 10x FY21e. Expected FY19 sales growth is ~18%, and ~31% for FY20. The expected FY19 operating margin is ~29%, and ~25% for FY20. Risks: Removal of the anti-dumping duty on Chinese rubber chemicals and tyres, reduction in the average selling price (ASP) of rubber chemicals.
Transcript
Anand Rathi Share and Stock Brokers Limited (hereinafter “ARSSBL”) is a full-service brokerage and equities-research firm and the views expressed therein are solely of ARSSBL and not of the companies which have been covered in the Research Report. This report is intended for the sole use of the Recipient. Disclosures and analyst certifications are present in the Appendix. Anand Rathi Research India Equities
India I Equities
Key f inancia ls (YE Mar) FY17 FY18 FY19e FY20e FY21e
Capacity expansions of tyre companies (demand side) and the doubling of Nocil’s production capacity (supply side) should keep volume growth steady for the company. However, auto sector sales would determine OEM demand and, growth in the logistics sector, the tyre replacement market, and in turn utilisation of tyre-companies’ new capex. This would govern realisations of rubber chemicals. Potential growth in this jamboree of binary events keeps us cautiously optimistic about Nocil. Nevertheless, we initiate coverage on it, with a Buy rating, for a target price of `210.
Capacity doubling, market leader. Nocil has captured over 50% of the rubber chemicals market in India, and nearly 5% globally. It is confident of controlling nearly 10% of the global market in rubber chemicals. It is investing `4.5bn in three phases, expected to be operational from H2 FY20.
Pricing/margins impacted by many moving parts. Indian anti-dumping duty (ADD) on Chinese rubber chemicals, Indian ADD on Chinese tyres, American ADD on Chinese tyres, growth of China’s auto industry, growth of the Indian auto industry, growth in Indian logistics (resulting in demand in the tyre-replacement market) are key moving parts which would determine growth and realisations in rubber chemicals.
Peak margins due to efficient cost control. The EBITDA margin expansion from ~10% in FY14 to ~27% in FY18 was primarily due to efficient cost-control measures since realisation per ton has not increased greatly.
Valuation. The stock trades at 13x FY19e, 12x FY20e and 10x FY21e. Expected FY19 sales growth is ~18%, and ~31% for FY20. The expected FY19 operating margin is ~29%, and ~25% for FY20. Risks: Removal of the anti-dumping duty on Chinese rubber chemicals and tyres, reduction in the average selling price (ASP) of rubber chemicals.
02 January 2019 Nocil – Ceteris Paribus; Buy
AnandRathi Research 2
Quick Glance – Financials and ValuationsFig 1 – Income statement (` m) Year-end: Mar FY17 FY18 FY19e FY20e FY21e
Net revenues (` m) 7,422 9,676 11,376 14,903 17,751 Growth (%) 3.8 30.4 17.6 31.0 19.1
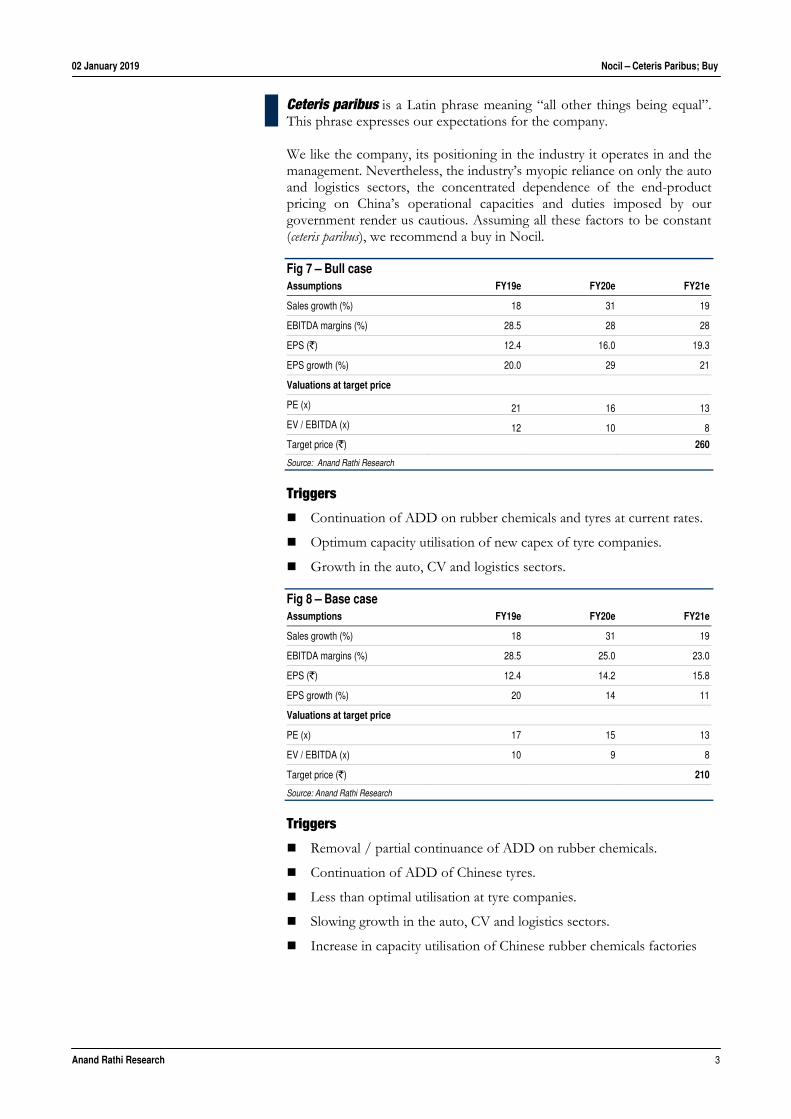
Ceteris paribus is a Latin phrase meaning “all other things being equal”. This phrase expresses our expectations for the company. We like the company, its positioning in the industry it operates in and the management. Nevertheless, the industry’s myopic reliance on only the auto and logistics sectors, the concentrated dependence of the end-product pricing on China’s operational capacities and duties imposed by our government render us cautious. Assuming all these factors to be constant (ceteris paribus), we recommend a buy in Nocil.
Fig 7 – Bull case Assumptions FY19e FY20e FY21e
Sales growth (%) 18 31 19
EBITDA margins (%) 28.5 28 28
EPS (`) 12.4 16.0 19.3
EPS growth (%) 20.0 29 21
Valuations at target price
PE (x) 21 16 13
EV / EBITDA (x) 12 10 8
Target price (`) 260
Source: Anand Rathi Research
Triggers
Continuation of ADD on rubber chemicals and tyres at current rates.
Optimum capacity utilisation of new capex of tyre companies.
Growth in the auto, CV and logistics sectors.
Fig 8 – Base case Assumptions FY19e FY20e FY21e
Sales growth (%) 18 31 19
EBITDA margins (%) 28.5 25.0 23.0
EPS (`) 12.4 14.2 15.8
EPS growth (%) 20 14 11
Valuations at target price
PE (x) 17 15 13
EV / EBITDA (x) 10 9 8
Target price (`) 210
Source: Anand Rathi Research
Triggers
Removal / partial continuance of ADD on rubber chemicals.
Continuation of ADD of Chinese tyres.
Less than optimal utilisation at tyre companies.
Slowing growth in the auto, CV and logistics sectors.
Increase in capacity utilisation of Chinese rubber chemicals factories
02 January 2019 Nocil – Ceteris Paribus; Buy
Anand Rathi Research 4
Fig 9 – Bear case Assumptions FY19e FY20e FY21e
Sales growth (%) 18 31 19
EBITDA margins (%) 28.5 22 21
EPS (`) 12.4 12.4 14.3
EPS growth (%) 20 0 16
Valuations at target price
PE (x) 15 15 13
EV / EBITDA (x) 8 9 7
Target price (`) 180
Source: Anand Rathi Research
Triggers
Removal of ADD on rubber chemicals and Chinese tyres.
Slump in the auto, CV and logistics sectors, leading to less than optimal utilisation at tyre companies.
Reduction in the ASP of rubber chemicals.
Increase in capacity and utilisation of Chinese rubber chemicals factories.
02 January 2019 Nocil – Ceteris Paribus; Buy
Anand Rathi Research 5
India’s largest rubber chemicals manufacturer
Riding on doubling capacities An Arvind Mafatlal Group enterprise, Nocil is India’s largest rubber chemicals manufacturer, with four decades’ experience and long-term business relations with major tyre companies. Its manufacturing plants are at Navi Mumbai and Dahej, with installed capacity of 55,000 tons including capacity for intermediates. Effective sales, per management, is ~35,000 tons.
The plants are fully automated through Programmable Logic Controller (PLC)/Distributed Control Systems (DCS) which ensure not only product quality and consistency but also built-in safety features in all operations. The company has adequate capacities at strategic locations, producing a broad range of products. Also, it has a wide marketing and distribution network.
Rubber chemicals are additives blended with natural or synthetic rubber in the manufacturing process.
The company’s products covers four categories:
1. Accelerators: Rubber accelerators shorten the reaction time between rubber and sulphur.
2. Anti-oxidants offer anti-oxidation and anti-degradation properties to boost the quality and extend the lifespan of the final product.
3. Pre-vulcanisation and
4. Post-vulcanisation
Fig 10 – Products and their use Source: Company
What are rubber chemicals? Based on production method and use, rubber chemicals can be classified as performance chemicals. They have to overcome stringent approval from customers, usually tyre and auto majors. They are tested for suitability and sustainability in the finished products, based on the actual performance of the finished product.
Accelerators These are added to the curing system to reduce the time taken for rubber to vulcanise, which in turn improves productivity
PILCURE range
Anti-degradants / Anti-oxidants
These help reduce the ageing of the rubber. They also help prevent degradation by oxygen. This prolongs the service life of the end-product
PILFLEX / PILNOX
Pre-vulcanisation inhibitors
These chemicals are added to prevent premature vulcanisation, which in turn helps in reducing scrap
PILGUARD
Post-vulcanisation stabilisers
These improve the thermal stability of cross links in the final product, thus making it less reactive and able to withstand heat
PILCURE DHTS
02 January 2019 Nocil – Ceteris Paribus; Buy
Anand Rathi Research 6
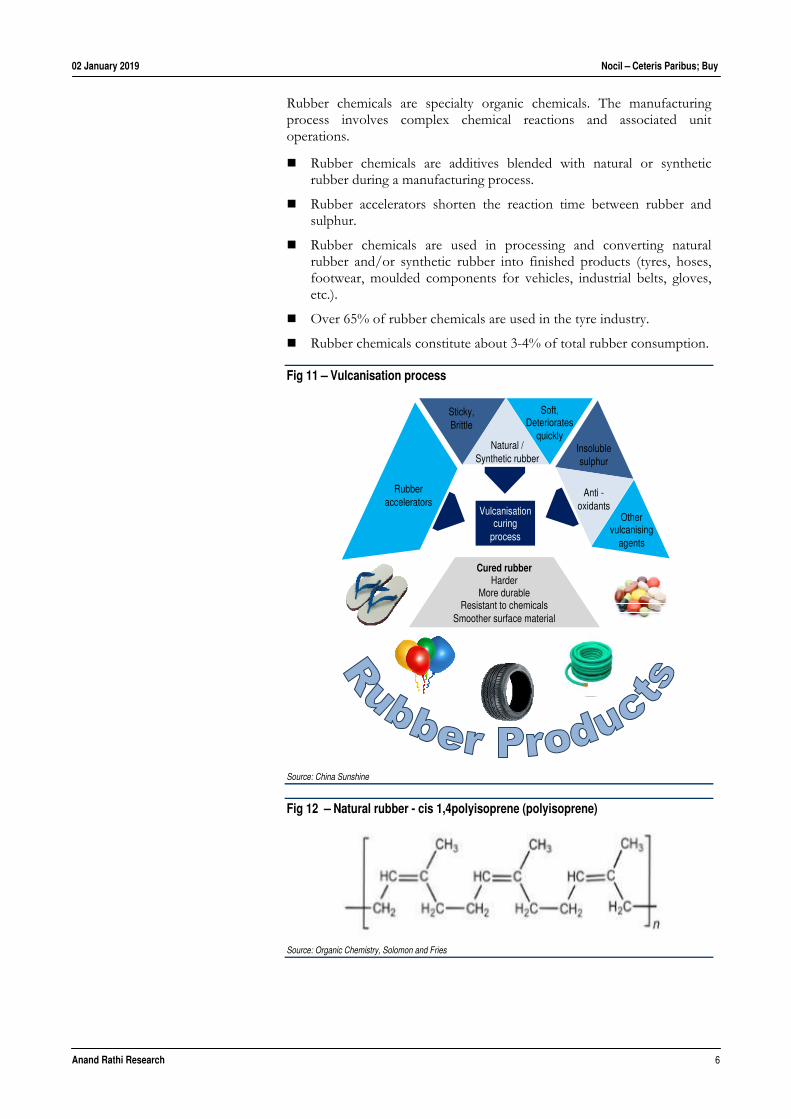
Rubber chemicals are specialty organic chemicals. The manufacturing process involves complex chemical reactions and associated unit operations.
Rubber chemicals are additives blended with natural or synthetic rubber during a manufacturing process.
Rubber accelerators shorten the reaction time between rubber and sulphur.
Rubber chemicals are used in processing and converting natural rubber and/or synthetic rubber into finished products (tyres, hoses, footwear, moulded components for vehicles, industrial belts, gloves, etc.).
Over 65% of rubber chemicals are used in the tyre industry.
Rubber chemicals constitute about 3-4% of total rubber consumption.
Fig 11 – Vulcanisation process Source: China Sunshine
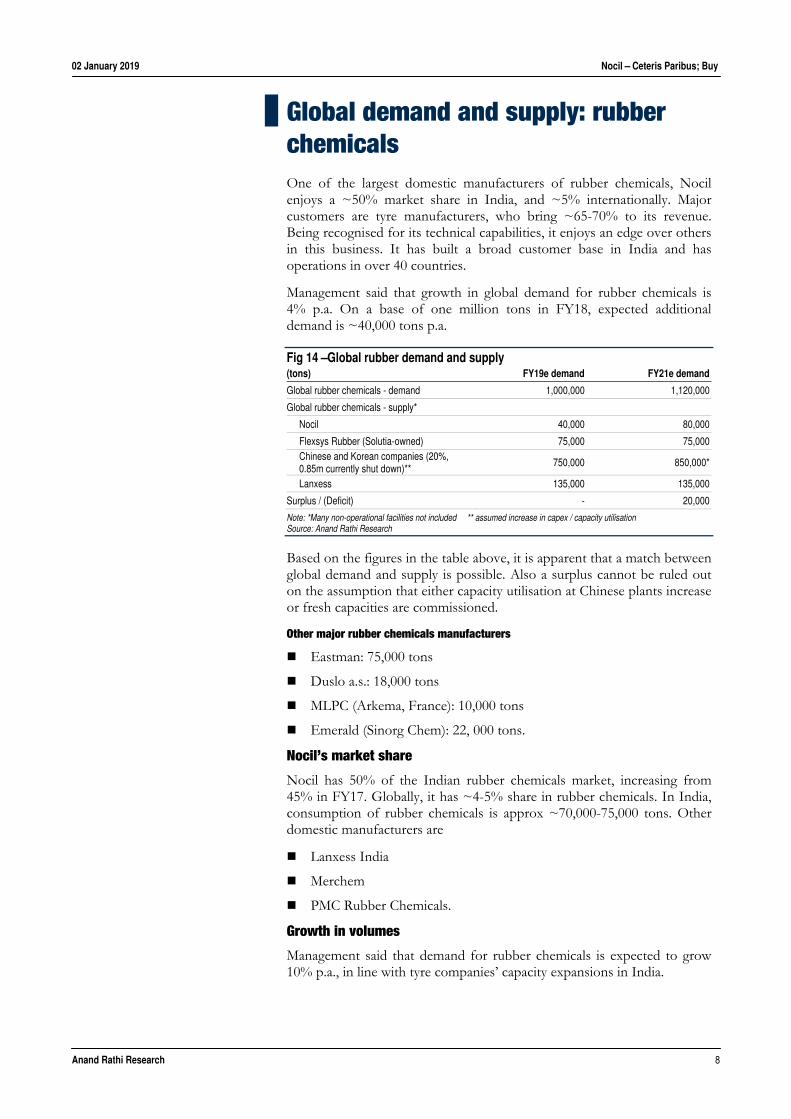
Global demand and supply: rubber chemicals One of the largest domestic manufacturers of rubber chemicals, Nocil enjoys a ~50% market share in India, and ~5% internationally. Major customers are tyre manufacturers, who bring ~65-70% to its revenue. Being recognised for its technical capabilities, it enjoys an edge over others in this business. It has built a broad customer base in India and has operations in over 40 countries.
Management said that growth in global demand for rubber chemicals is 4% p.a. On a base of one million tons in FY18, expected additional demand is ~40,000 tons p.a.
Global rubber chemicals - demand 1,000,000 1,120,000
Global rubber chemicals - supply*
Nocil 40,000 80,000
Flexsys Rubber (Solutia-owned) 75,000 75,000Chinese and Korean companies (20%, 0.85m currently shut down)**
750,000 850,000*
Lanxess 135,000 135,000
Surplus / (Deficit) - 20,000
Note: *Many non-operational facilities not included ** assumed increase in capex / capacity utilisation Source: Anand Rathi Research
Based on the figures in the table above, it is apparent that a match between global demand and supply is possible. Also a surplus cannot be ruled out on the assumption that either capacity utilisation at Chinese plants increase or fresh capacities are commissioned.
Other major rubber chemicals manufacturers
Eastman: 75,000 tons
Duslo a.s.: 18,000 tons
MLPC (Arkema, France): 10,000 tons
Emerald (Sinorg Chem): 22, 000 tons.
Nocil’s market share
Nocil has 50% of the Indian rubber chemicals market, increasing from 45% in FY17. Globally, it has ~4-5% share in rubber chemicals. In India, consumption of rubber chemicals is approx ~70,000-75,000 tons. Other domestic manufacturers are
Lanxess India
Merchem
PMC Rubber Chemicals.
Growth in volumes
Management said that demand for rubber chemicals is expected to grow 10% p.a., in line with tyre companies’ capacity expansions in India.
02 January 2019 Nocil – Ceteris Paribus; Buy
Anand Rathi Research 9
Fig 15 – Capacity expansions of tyre companies in India – comfortable double-digit volume growth expected
Source: Company, Anand Rathi Research
In line with the increase in tyre production, demand for rubber chemicals is growing at ~10,000 tons p.a. As a result, within three years, demand in India for rubber chemicals would be ~ 100,000 tons.
By then, the company is expected to have effective saleable capacity of 70,000 tons. Assuming it maintains its present export-import ratio (~30:70), 70% of full capacity utilisation would equal ~50,000 tons, which, in turn, is equal to 50% of the anticipated Indian rubber chemicals market in three years. This is in line with the company’s present market share.
The other 30% of the 70,000 tons effective saleable capacity has been assumed to be exported. Thus, exports would have to double as well. Management said it has received expressions of interest from many tyre majors from Europe. Companies there are working toward a purchase risk-diversification strategy against China. That should benefit Nocil.
Global market
Per the company, global rubber consumption has been continually increasing.
In the last six years, demand has gone to 29m tons p.a. in FY18, from 25.6m tons in FY13.
The expected annual growth is 40,000 tons for rubber chemicals.
We believe it to continue in coming years on account of further growth generated from the automotive and tyre industries, the major end-users of rubber chemicals.
Annual domestic consumption of rubber chemicals in India is estimated at 75,000 tons. Nocil has captured ~50% of the market.
Chinese rubber-chemicals manufacturers
China’s rubber-chemicals production capacity is estimated at 850,000 tons. Our interaction with the management and various Chinese companies showed that, of this, ~20% of capacity is non-functional. Also, average capacity utilisation is ~55-60%.
China Sunshine is a key manufacturer of rubber chemicals. The company is the world's largest manufacturer of rubber accelerators, with a commanding 20% global share.
15%
16%
14%
10%
6%
8%
10%
12%
14%
16%
18%
9,00,000
11,00,000
13,00,000
15,00,000
17,00,000
19,00,000
21,00,000
FY18
FY19
e
FY20
e
FY21
e
FY22
e
(%)(Nos.)
Total tyre Production CAGR (RHS) Growth (RHS)
02 January 2019 Nocil – Ceteris Paribus; Buy
Anand Rathi Research 10
Its production facilities are located at
Shanxian, western Henan province
Weifang, central Shandong province
Dingtao, Shandong province
Total annual capacity is
87,000 tons of rubber accelerators,
45,000 tons of anti-oxidants,
20,000 tons of insoluble sulphur.
It also has a central heating plant at Shanxian, generating steam and electricity.
This year, China Sunshine is slated to add a
10,000-ton high-grade TBBS rubber-accelerator production line
10,000-ton insoluble-sulphur line.
Further capacity expansion is possible since land and infrastructure are in place, along with a cash hoard of over 500m yuan.
Chinese peers in rubber accelerators are
Tianjin Kemai: 51,000 tpa
Yanggu Huatai: 30,000 tpa.
Barriers to entry are high in this industry, which is tightly governed by China's environmental-protection laws. China Sunshine has benefited from the government's enforcement action against competitors who have failed to meet strict regulatory standards.
While China Sunshine’s overall average selling price has jumped 30% in 2017, its management considered this unsustainable.
Future Market Insights, a market research firm, says that the global tyre market is estimated to expand at a 6.3% CAGR (by value) between 2017 and 2027, reaching ~$645bn.
Fig 16 – China Sunshine -- price and volume growth
Source: China Sunshine, Anand Rathi Research * China Sunshine FY=CY
The chart above shows a pricing peak for China Sunshine. This also highlights a key concern for Nocil, as the increase in margins was due to a drop in costs and not a substantial rise in realisations in the past few years.
-40
-30
-20
-10
0
10
20
30
40
50
FY09
FY10
FY11
FY12
FY13
FY14
FY15
FY16
FY17
9MFY
18
(%)
Volume Growth Price Growth
02 January 2019 Nocil – Ceteris Paribus; Buy
Anand Rathi Research 11
A decrease in the ASP of rubber chemicals would pile pressure on gross margins.
Major Chinese exporters of rubber chemicals are
China Sunshine / Shandong Sunsine Chemical Co. (formerly known as Shandong Shanxian Chemical Co. Ltd.)
Jiangsu Sinorgchem Technology Co. Ltd. Shandong Yanggu Huatai Chemical Co. Ltd. (12,000 tpa) Changde Dingyuan Chemical Industrial ltd (20,000 tpa) Dongying Bo Chen Chemical Co. Ltd. (rubber-scorching retarder
6,000 tpa).
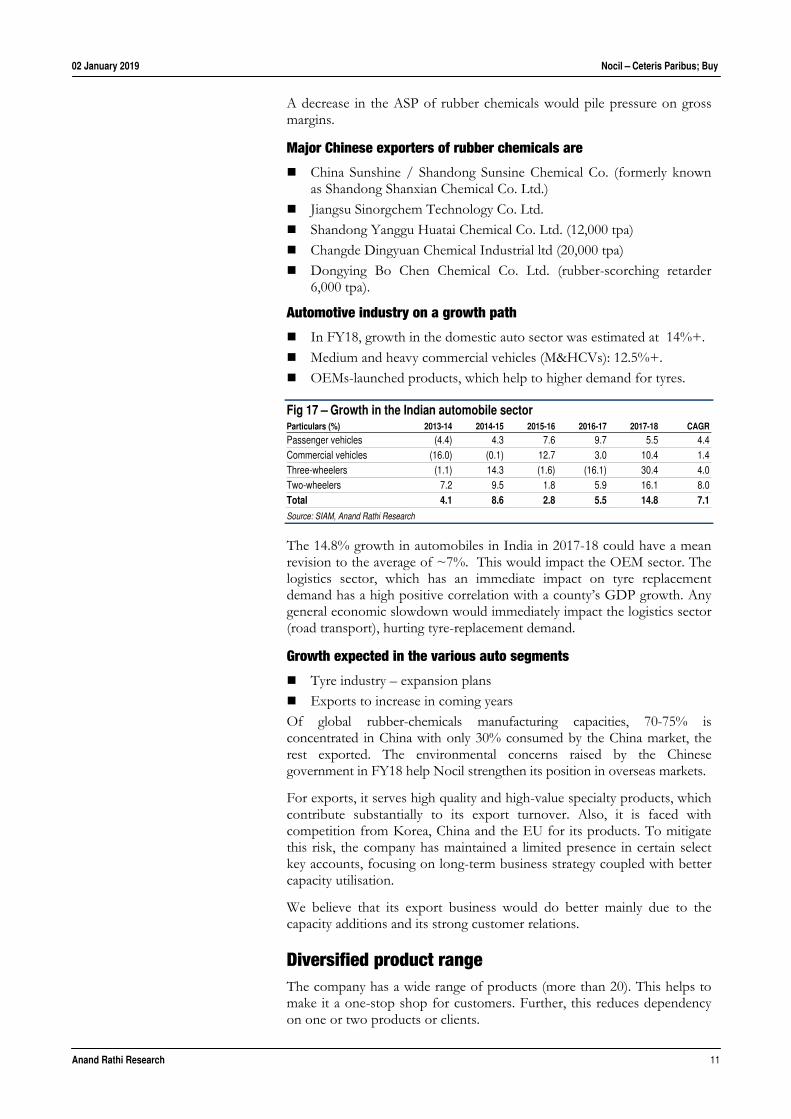
Automotive industry on a growth path
In FY18, growth in the domestic auto sector was estimated at 14%+. Medium and heavy commercial vehicles (M&HCVs): 12.5%+. OEMs-launched products, which help to higher demand for tyres.
Fig 17 – Growth in the Indian automobile sector Particulars (%) 2013-14 2014-15 2015-16 2016-17 2017-18 CAGR
The 14.8% growth in automobiles in India in 2017-18 could have a mean revision to the average of ~7%. This would impact the OEM sector. The logistics sector, which has an immediate impact on tyre replacement demand has a high positive correlation with a county’s GDP growth. Any general economic slowdown would immediately impact the logistics sector (road transport), hurting tyre-replacement demand.
Growth expected in the various auto segments
Tyre industry – expansion plans Exports to increase in coming years Of global rubber-chemicals manufacturing capacities, 70-75% is concentrated in China with only 30% consumed by the China market, the rest exported. The environmental concerns raised by the Chinese government in FY18 help Nocil strengthen its position in overseas markets.
For exports, it serves high quality and high-value specialty products, which contribute substantially to its export turnover. Also, it is faced with competition from Korea, China and the EU for its products. To mitigate this risk, the company has maintained a limited presence in certain select key accounts, focusing on long-term business strategy coupled with better capacity utilisation.
We believe that its export business would do better mainly due to the capacity additions and its strong customer relations.
Diversified product range The company has a wide range of products (more than 20). This helps to make it a one-stop shop for customers. Further, this reduces dependency on one or two products or clients.
02 January 2019 Nocil – Ceteris Paribus; Buy
Anand Rathi Research 12
Product-wise contribution
Accelerators and anti-oxidants contribute ~44- 45% each to revenue The remaining is contributed by pre- and post-vulcanisation products. Nocil’s more than 20 products enable it to serve as a one-stop shop
for customers.
Fig 19 – Acetone
Source: Bloomberg
Fig 20 – Phenol
Source: Bloomberg
500
700
900
1,100
1,300
1,500
1,700
Jan-
11
Jun-
11
Nov
-11
Apr-1
2
Sep-
12
Feb-
13
Jul-1
3
Dec
-13
May
-14
Oct
-14
Mar
-15
Aug-
15
Jan-
16
Jun-
16
Nov
-16
Apr-1
7
Sep-
17
Feb-
18
Jul-1
8
Dec
-18
($/ ton)
600
800
1,000
1,200
1,400
1,600
1,800
2,000
2,200
2,400
2,600
Jan-
11
Jun-
11
Nov
-11
Apr-1
2
Sep-
12
Feb-
13
Jul-1
3
Dec
-13
May
-14
Oct
-14
Mar
-15
Aug-
15
Jan-
16
Jun-
16
Nov
-16
Apr-1
7
Sep-
17
Feb-
18
Jul-1
8
Dec
-18
($ / ton)
Fig 21 – Aniline
Source: Bloomberg , * India WPI Aniline Including PNA ONA OCPNA
Fig 22 – Carbon disulphide
Source: China Sunshine
100
105
110
115
120
125
130
135
140
May
-12
Aug-
12N
ov-1
2Fe
b-13
May
-13
Aug-
13N
ov-1
3Fe
b-14
May
-14
Aug-
14N
ov-1
4Fe
b-15
May
-15
Aug-
15N
ov-1
5Fe
b-16
May
-16
Aug-
16N
ov-1
6Fe
b-17
May
-17
Aug-
17N
ov-1
7Fe
b-18
May
-18
Aug-
18N
ov-1
8
(Index)
25,000
30,000
35,000
40,000
45,000
50,000
55,000
1Q14
2Q14
3Q14
4Q14
1Q15
2Q15
3Q15
4Q15
1Q16
2Q16
3Q16
4Q16
1Q17
2Q17
3Q17
4Q17
1Q18
2Q18
3Q18
(` / ton)
Fig 18 – Raw material detail-product wise Product Category Brand Name Chemical Name Raw material
Capacity expansion, a growth trigger In FY18 Nocil had capacity of 55,000 tons for rubber chemicals. Its manufacturing plants are at
Navi Mumbai and
Dahej.
To cater to mounting demand it is utilising 100% of its capacity. It plans to increase capacity, at `4.25bn capex, in phases and to fund it from internal accruals.
Phase I: Expansion announced in Mar’17 at capex of `1.7bn
Part I: Navi Mumbai commissioned in Q1 FY19, on schedule.
Part II: Dahej was to be commissioned by Q3 FY19.
Phase II and III have been announced for rubber chemicals capacity and intermediates at both locations. Capex would be `2.5bn for both the phases and expected to be complete by H1 FY20.
The expansion is coming when the company is operating at full capacity and auto industry demand is growing. The expansion and consequent increased production and supply would help better serve domestic and export markets.
Set to benefit from rising demand
Due to the mounting demand from important end-user industries such as the tyre industry, the global rubber-processing-chemicals market is expected to see steady growth in future.
The major growth is coming from the automotive sector on account of various inherent advantages. Further, demand is much higher in developing countries than in developed nations. Recently, many domestic and international tyre companies have announced capex/expansion.
As per expectations, the global rubber-processing market would be $7bn in 2026, from $4.7bn in 2017, a 4.5% CARG.
Anti-degradants is the largest segment by value and is expected to reach $4.5bn by end-2026, a 4.4% CAGR over 2017-26. On the applications side, the tyre industry expects to exhibit the fastest CAGR (of 4.6%) in that period, with a likely market of nearly $5bn by 2026.
Increasing automobile production, vehicle registration in certain markets and expansion plans announced by major tyre companies would drive demand for rubber chemicals. We expect that Nocil’s capacity expansions of rubber chemicals would benefit.
02 January 2019 Nocil – Ceteris Paribus; Buy
Anand Rathi Research 14
High entry barriers: technology and a long gestation period Exceptional technical know-how and long gestation periods (two years) for manufacturers to set up a plant and gain product approval from customers are strong entry barriers.
Nocil is poised to benefit from demand from domestic and export markets as it is the leader in the manufacture of rubber chemicals domestically. Its position in an oligopoly (a ~50% market share, and only three manufacturers in the home market) and its increasing capacity (which would come up in the next two years) would lead to greater profitability due to the vast anticipated market potential. We expect over 90% capacity utilisation for the present capacity and ~75% after the new capacity is operational.
Nocil has an edge over new entrants because of the high gestation period. Besides, new manufacturers would take 2-3 years for customer approval and product validation, another huge entry barrier.
In-house technology, an added advantage
Nocil has a diversified product range and satisfies various requirements of leading tyre manufacturers.
In FY18, it received approval from The Ministry of Science and Technology, New Delhi, to extend its in-house R&D plant.
The R&D team has made significant contribution to the development of several indigenous process technologies and products. One of the major ones is the successful commercialisation of novel and greener intermediate technology and further improvements at Dahej.
These measures culminated in growth and a heftier bottom line.
Thus, the high technology barrier and exhaustive approval processes of tyre manufacturers act as deterrents to new manufacturers. Also, the company has an edge over others as it is the leader in the industry.
02 January 2019 Nocil – Ceteris Paribus; Buy
Anand Rathi Research 15
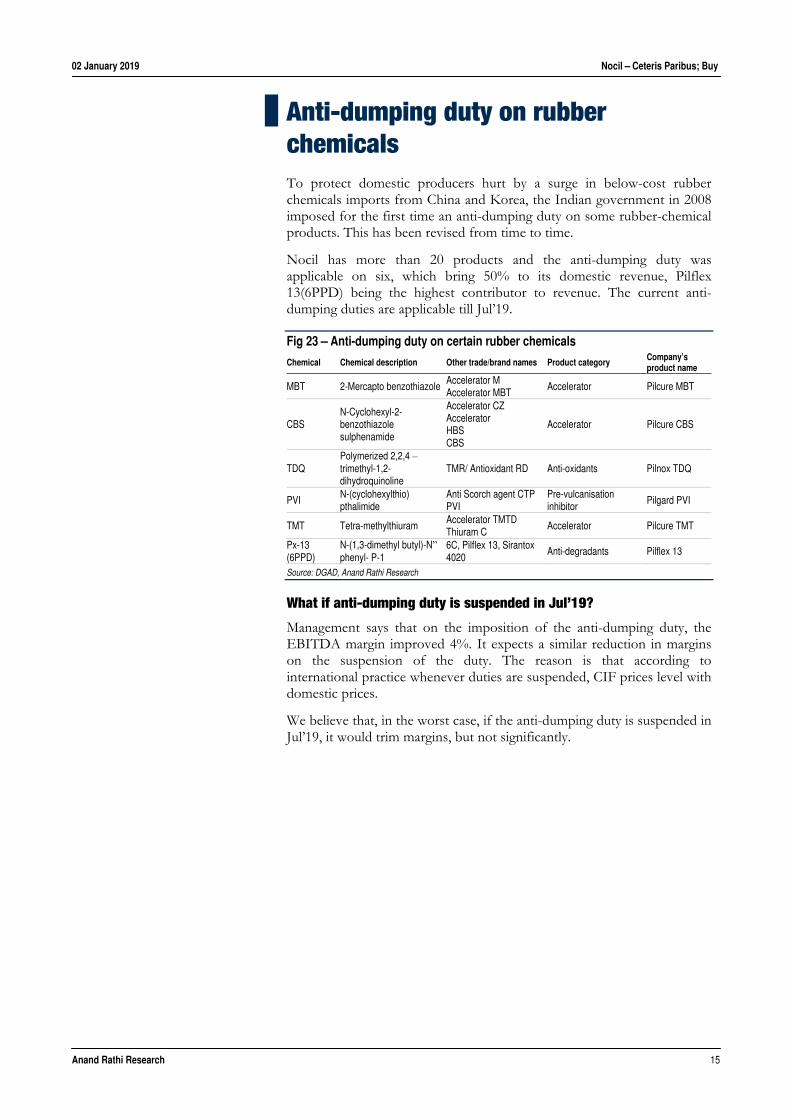
Anti-dumping duty on rubber chemicals To protect domestic producers hurt by a surge in below-cost rubber chemicals imports from China and Korea, the Indian government in 2008 imposed for the first time an anti-dumping duty on some rubber-chemical products. This has been revised from time to time.
Nocil has more than 20 products and the anti-dumping duty was applicable on six, which bring 50% to its domestic revenue, Pilflex 13(6PPD) being the highest contributor to revenue. The current anti-dumping duties are applicable till Jul’19.
Fig 23 – Anti-dumping duty on certain rubber chemicals
Chemical Chemical description Other trade/brand names Product category Company’s product name
MBT 2-Mercapto benzothiazole Accelerator M Accelerator MBT
TMT Tetra-methylthiuram Accelerator TMTD Thiuram C
Accelerator Pilcure TMT
Px-13 (6PPD)
N-(1,3-dimethyl butyl)-N”phenyl- P-1
6C, Pilflex 13, Sirantox 4020
Anti-degradants Pilflex 13
Source: DGAD, Anand Rathi Research
What if anti-dumping duty is suspended in Jul’19?
Management says that on the imposition of the anti-dumping duty, the EBITDA margin improved 4%. It expects a similar reduction in margins on the suspension of the duty. The reason is that according to international practice whenever duties are suspended, CIF prices level with domestic prices.
We believe that, in the worst case, if the anti-dumping duty is suspended in Jul’19, it would trim margins, but not significantly.
02 January 2019 Nocil – Ceteris Paribus; Buy
Anand Rathi Research 16
Financials Nocil’s capacity expansion in rubber chemicals is in sync with the rising demand for rubber chemicals. Assuming the 2x asset turn on the future capex, as guided to by management comes into play (as opposed to the 0.8x for the existing asset), we can expect further revenue growth in the coming three years. On these lines we expect the company to post a 25% revenue CAGR over FY19-21, and 13% in net profit.
A 25% CAGR in revenue over FY19-21
With the rising demand in the auto sector, coupled with capacity expansion in rubber chemicals, we believe that the company would register a 25% revenue CAGR over FY19-21. This growth would chiefly be driven by volume growth (as increase in operational capacities would lead to pricing pressure). Per management, the new capex would generate 2x asset turnover in the next 3-4 years. The company reported a 14.7% revenue CAGR over FY13-18. At present, it operates at full capacity
Rubber chemicals – realisations and margins
A reduction in the major cost constituents has helped Nocil expand margins over the years. The company has come a long way from the ~10% EBITDA in FY14 to the current ~30%.
In FY18, the EBITDA margin expanded substantially, to 27.4%, compared to 21.5% in FY17 mainly due to
a change in the product mix (more sales of higher-margin products)
greater efficiency and
better pricing for the product as well as
cost-optimisation benefits.
Figures 26 and 27 show that the higher EBITDA margin, from 4% in FY13 to 27% in FY18 stems from greater cost reduction despite the ASP being range bound between `200 and `250 a kg.
In Q1 FY19, the company reported a 29.9% EBITDA margin (29% in Q2). This can be attributed to the shutdown of plants in China.
Fig 24 – Net revenue and growth
Source: Company, Anand Rathi Research
Fig 25 – Realisation per ton
Source: Company, Anand Rathi Research *china sunshine FY=CY
-5.0
0.0
5.0
10.0
15.0
20.0
25.0
30.0
35.0
0
2,000
4,000
6,000
8,000
10,000
12,000
14,000
16,000
18,000
FY13
FY14
FY15
FY16
FY17
FY18
FY19
e
FY20
e
FY21
e
(%)(` m)
Net revenues Growth (RHS)
0.0
5.0
10.0
15.0
20.0
25.0
30.0
0
50,000
1,00,000
1,50,000
2,00,000
2,50,000
3,00,000
FY13
FY14
FY15
FY16
FY17
9MFY
18
(EBITDA margin %)(Avg rel ` / ton)
NOCIL CS (ex I. Sul) NOCIL (RHS) CS (RHS)
02 January 2019 Nocil – Ceteris Paribus; Buy
Anand Rathi Research 17
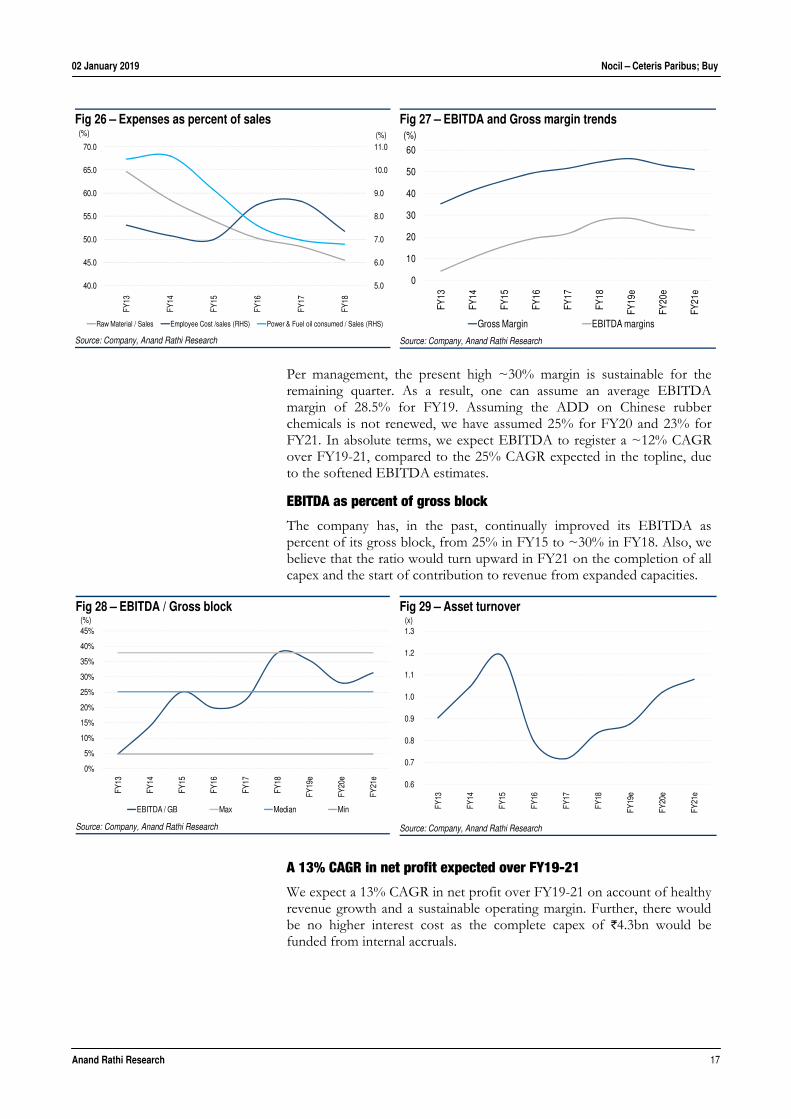
Per management, the present high ~30% margin is sustainable for the remaining quarter. As a result, one can assume an average EBITDA margin of 28.5% for FY19. Assuming the ADD on Chinese rubber chemicals is not renewed, we have assumed 25% for FY20 and 23% for FY21. In absolute terms, we expect EBITDA to register a ~12% CAGR over FY19-21, compared to the 25% CAGR expected in the topline, due to the softened EBITDA estimates.
EBITDA as percent of gross block
The company has, in the past, continually improved its EBITDA as percent of its gross block, from 25% in FY15 to ~30% in FY18. Also, we believe that the ratio would turn upward in FY21 on the completion of all capex and the start of contribution to revenue from expanded capacities.
A 13% CAGR in net profit expected over FY19-21
We expect a 13% CAGR in net profit over FY19-21 on account of healthy revenue growth and a sustainable operating margin. Further, there would be no higher interest cost as the complete capex of `4.3bn would be funded from internal accruals.
Fig 28 – EBITDA / Gross block
Source: Company, Anand Rathi Research
Fig 29 – Asset turnover
Source: Company, Anand Rathi Research
0%
5%
10%
15%
20%
25%
30%
35%
40%
45%
FY13
FY14
FY15
FY16
FY17
FY18
FY19
e
FY20
e
FY21
e
(%)
EBITDA / GB Max Median Min
0.6
0.7
0.8
0.9
1.0
1.1
1.2
1.3
FY13
FY14
FY15
FY16
FY17
FY18
FY19
e
FY20
e
FY21
e
(x)
Fig 26 – Expenses as percent of sales
Source: Company, Anand Rathi Research
Fig 27 – EBITDA and Gross margin trends
Source: Company, Anand Rathi Research
5.0
6.0
7.0
8.0
9.0
10.0
11.0
40.0
45.0
50.0
55.0
60.0
65.0
70.0
FY13
FY14
FY15
FY16
FY17
FY18
(%)(%)
Raw Material / Sales Employee Cost /sales (RHS) Power & Fuel oil consumed / Sales (RHS)
0
10
20
30
40
50
60
FY13
FY14
FY15
FY16
FY17
FY18
FY19
e
FY20
e
FY21
e
(%)
Gross Margin EBITDA margins
02 January 2019 Nocil – Ceteris Paribus; Buy
Anand Rathi Research 18
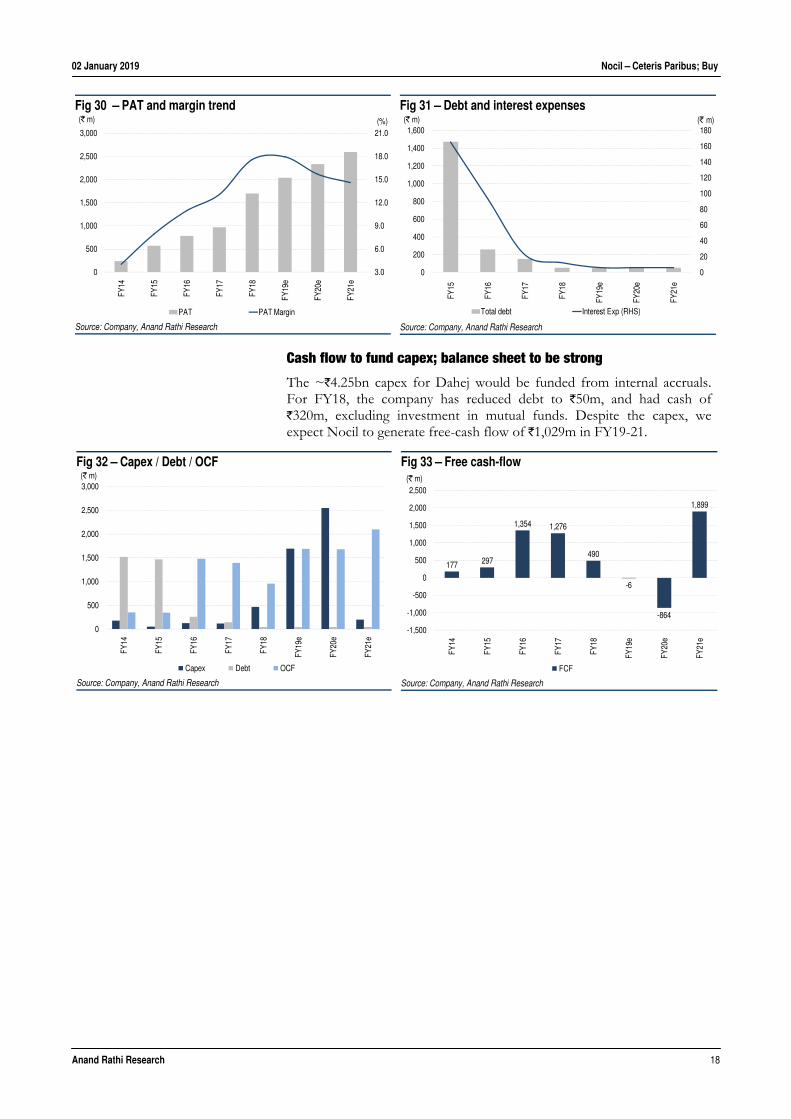
Cash flow to fund capex; balance sheet to be strong
The ~`4.25bn capex for Dahej would be funded from internal accruals. For FY18, the company has reduced debt to `50m, and had cash of `320m, excluding investment in mutual funds. Despite the capex, we expect Nocil to generate free-cash flow of `1,029m in FY19-21.
Fig 30 – PAT and margin trend
Source: Company, Anand Rathi Research
Fig 31 – Debt and interest expenses
Source: Company, Anand Rathi Research
3.0
6.0
9.0
12.0
15.0
18.0
21.0
0
500
1,000
1,500
2,000
2,500
3,000FY
14
FY15
FY16
FY17
FY18
FY19
e
FY20
e
FY21
e
(%)(` m)
PAT PAT Margin
0
20
40
60
80
100
120
140
160
180
0
200
400
600
800
1,000
1,200
1,400
1,600
FY15
FY16
FY17
FY18
FY19
e
FY20
e
FY21
e
(` m)(` m)
Total debt Interest Exp (RHS)
Fig 32 – Capex / Debt / OCF
Source: Company, Anand Rathi Research
Fig 33 – Free cash-flow
Source: Company, Anand Rathi Research
0
500
1,000
1,500
2,000
2,500
3,000
FY14
FY15
FY16
FY17
FY18
FY19
e
FY20
e
FY21
e
(` m)
Capex Debt OCF
177 297
1,354 1,276
490
-6
-864
1,899
-1,500
-1,000
-500
0
500
1,000
1,500
2,000
2,500
FY14
FY15
FY16
FY17
FY18
FY19
e
FY20
e
FY21
e
(` m)
FCF
02 January 2019 Nocil – Ceteris Paribus; Buy
Anand Rathi Research 19
Cash-conversion cycle
Nocil’s cash-conversion cycle has shortened substantially, from 181 days in FY15 to 125 in FY18. Compared, however, to FY17 (116 days) its cash-conversion cycle lengthened y/y due to the increase in inventory and debtor days, partially offset by the rise in creditor days. We expect the cash-conversion cycle ahead to be around 116 days
Return ratios to improve
With strong PAT growth and better margins in the next three years, we expect return ratios to improve. The RoCE would increase from 15.6% in FY18 to 16.7% in FY21, and the RoE to 16.9% by end-FY21.
Fig 36 – Return ratios
Source: Company, Anand Rathi Research
4
6
8
10
12
14
16
18
FY13
FY14
FY15
FY16
FY17
FY18
FY19
e
FY20
e
FY21
e
(%)
ROE ROCE
Fig 34 – Cash-conversion cycle
Source: Company, Anand Rathi Research
Fig 35 – Working capital days
Source: Company, Anand Rathi Research
100
110
120
130
140
150
160
170
180
190
FY14
FY15
FY16
FY17
FY18
FY19
e
FY20
e
FY21
e
(Days)
Cash Conversion Cycle
60
80
100
120
140
160
180
FY13
FY14
FY15
FY16
FY17
FY18
(Days)
Receivables Inventory Payables Working Capital days
02 January 2019 Nocil – Ceteris Paribus; Buy
Anand Rathi Research 20
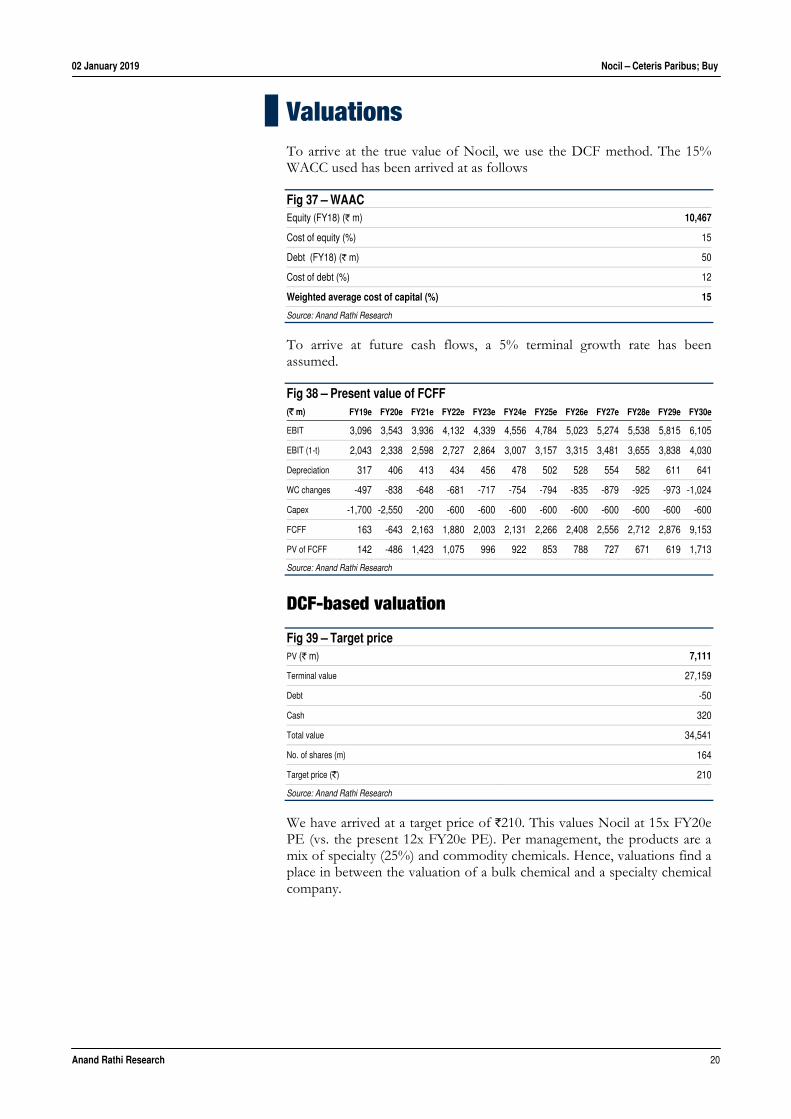
Valuations To arrive at the true value of Nocil, we use the DCF method. The 15% WACC used has been arrived at as follows
Fig 37 – WAAC Equity (FY18) (` m) 10,467
Cost of equity (%) 15
Debt (FY18) (` m) 50
Cost of debt (%) 12
Weighted average cost of capital (%) 15
Source: Anand Rathi Research
To arrive at future cash flows, a 5% terminal growth rate has been assumed.
Fig 38 – Present value of FCFF (` m) FY19e FY20e FY21e FY22e FY23e FY24e FY25e FY26e FY27e FY28e FY29e FY30e
We have arrived at a target price of `210. This values Nocil at 15x FY20e PE (vs. the present 12x FY20e PE). Per management, the products are a mix of specialty (25%) and commodity chemicals. Hence, valuations find a place in between the valuation of a bulk chemical and a specialty chemical company.
Company Background & Management Over four decades’ experience
Incorporated in 1961 as National Organic Chemical Industries Ltd. by Hrishikesh A. Mafatlal, today Nocil is the leader in rubber chemicals
Fig 44–Management Team Name Designation Description Hrishikesh A Mafatlal
Chairman, Promoter B.Com (Hons.); Advanced Management Programme at Harvard Business School, USA
S.R. Deo Managing Director M. Tech. (Chemical Engineering) IIT, Kanpur; associated with the company for nearly 39 years in various technical capacities
R.M. Gadgil President, marketing B.Tech (Chemical Engineering) IIT, Mumbai: associated with the company in various marketing capacities for nearly 36 years
P. Shrinivasan CFO C.A. Associated with the company since 2005.
Chinmoy Nandi Vice-President Post-graduate, Ph.D. in science; associated with the company for nearly 34 years in various R&D capacities
Chemical engineer, Diploma in Management Studies; associated with the company for nearly 33 years
Source: Company
Fig 45–Promoter group shareholding pattern Individuals/Hindu undivided family (%)
The Hrishikesh A. Mafatlal Family Trust 0.0
Rekha Hrishikesh Mafatlal 0.1
Hrishikesh A Mafatlal 0.1
Priyavrata H. Mafatlal 0.3
Total (A) 0.5
Others
Mafatlal Industries Ltd. 15.6
Suremi Trading Pvt Ltd 12.3
Sumil Holdings Pvt Ltd -
Shamir Texchem Pvt Lt -
Sushripada Investments Pvt Ltd 5.4
Arvi Associates Pvt Ltd -
KrishnadeepEngg Pvt Ltd 0.2
Total(B) 33.6
Total (A+B) 34.1
Source: Anand Rathi Research
Directors of Suremi Trading Pvt. Ltd.
Vipul Bhawandas Popat
Manoj Durgashankar Pandaya
Rajendra Ramakant Likhite
Dilip Vadilal Gandhi
Niraj Mankad
Bharat Rasiklal Shah
Directors of Sushripada Investments Pvt. Ltd.
Priyavrata Mafatlal
Vipul BhawandasPopat
Mayank Gunvant Dhuldhoya
Rekha Hrishikesh Mafatlal
Rajendra RamakantLikhite
Rajesh Dave Ramanlal
Pankaj Kumar Babulal Shah
Appendix Analyst Certification The views expressed in this Research Report accurately reflect the personal views of the analyst(s) about the subject securities or issuers and no part of the compensation of the research analyst(s) was, is, or will be directly or indirectly related to the specific recommendations or views expressed by the research analyst(s) in this report. The research analysts are bound by stringent internal regulations and also legal and statutory requirements of the Securities and Exchange Board of India (hereinafter “SEBI”) and the analysts’ compensation are completely delinked from all the other companies and/or entities of Anand Rathi, and have no bearing whatsoever on any recommendation that they have given in the Research Report. Anand Rathi Ratings Definitions
Analysts’ ratings and the corresponding expected returns take into account our definitions of Large Caps (>US$1bn) and Mid/Small Caps (<US$1bn) as described in the Ratings Table below:
Ratings Guide (12 months) Buy Hold Sell Large Caps (>US$1bn) >15% 5-15% <5% Mid/Small Caps (<US$1bn) >25% 5-25% <5% Research Disclaimer and Disclosure inter-alia as required under Securities and Exchange Board of India (Research Analysts) Regulations, 2014
Anand Rathi Share and Stock Brokers Ltd. (hereinafter refer as ARSSBL) (Research Entity) is a subsidiary of Anand Rathi Financial Services Ltd. ARSSBL is a corporate trading and clearing member of Bombay Stock Exchange Ltd, National Stock Exchange of India Ltd. (NSEIL), Multi Stock Exchange of India Ltd (MCX-SX) and also depository participant with National Securities Depository Ltd (NSDL) and Central Depository Services Ltd. ARSSBL is engaged in the business of Stock Broking, Depository Participant and Mutual Fund distributor.
The research analysts, strategists, or research associates principally responsible for the preparation of Anand Rathi research have received compensation based upon various factors, including quality of research, investor client feedback, stock picking, competitive factors and firm revenues.
General Disclaimer: This Research Report (hereinafter called “Report”) is meant solely for use by the recipient and is not for circulation. This Report does not constitute a personal recommendation or take into account the particular investment objectives, financial situations, or needs of individual clients. The recommendations, if any, made herein are expression of views and/or opinions and should not be deemed or construed to be neither advice for the purpose of purchase or sale of any security, derivatives or any other security through ARSSBL nor any solicitation or offering of any investment /trading opportunity on behalf of the issuer(s) of the respective security (ies) referred to herein. These information / opinions / views are not meant to serve as a professional investment guide for the readers. No action is solicited based upon the information provided herein. Recipients of this Report should rely on information/data arising out of their own investigations. Readers are advised to seek independent professional advice and arrive at an informed trading/investment decision before executing any trades or making any investments. This Report has been prepared on the basis of publicly available information, internally developed data and other sources believed by ARSSBL to be reliable. ARSSBL or its directors, employees, affiliates or representatives do not assume any responsibility for, or warrant the accuracy, completeness, adequacy and reliability of such information / opinions / views. While due care has been taken to ensure that the disclosures and opinions given are fair and reasonable, none of the directors, employees, affiliates or representatives of ARSSBL shall be liable for any direct, indirect, special, incidental, consequential, punitive or exemplary damages, including lost profits arising in any way whatsoever from the information / opinions / views contained in this Report. The price and value of the investments referred to in this Report and the income from them may go down as well as up, and investors may realize losses on any investments. Past performance is not a guide for future performance. ARSSBL does not provide tax advice to its clients, and all investors are strongly advised to consult with their tax advisers regarding taxation aspects of any potential investment.
Opinions expressed are our current opinions as of the date appearing on this Research only. We do not undertake to advise you as to any change of our views expressed in this Report. Research Report may differ between ARSSBL’s RAs and/ or ARSSBL’s associate companies on account of differences in research methodology, personal judgment and difference in time horizons for which recommendations are made. User should keep this risk in mind and not hold ARSSBL, its employees and associates responsible for any losses, damages of any type whatsoever.
ARSSBL and its associates or employees may; (a) from time to time, have long or short positions in, and buy or sell the investments in/ security of company (ies) mentioned herein or (b) be engaged in any other transaction involving such investments/ securities of company (ies) discussed herein or act as advisor or lender / borrower to such company (ies) these and other activities of ARSSBL and its associates or employees may not be construed as potential conflict of interest with respect to any recommendation and related information and opinions. Without limiting any of the foregoing, in no event shall ARSSBL and its associates or employees or any third party involved in, or related to computing or compiling the information have any liability for any damages of any kind.
Details of Associates of ARSSBL and Brief History of Disciplinary action by regulatory authorities & its associates are available on our website i.e. www.rathionline.com
Disclaimers in respect of jurisdiction: This report is not directed to, or intended for distribution to or use by, any person or entity who is a citizen or resident of or located in any locality, state, country or other jurisdiction where such distribution, publication, availability or use would be contrary to law or regulation or which would subject ARSSBL to any registration or licensing requirement within such jurisdiction(s). No action has been or will be taken by ARSSBL in any jurisdiction (other than India), where any action for such purpose(s) is required. Accordingly, this Report shall not be possessed, circulated and/or distributed in any such country or jurisdiction unless such action is in compliance with all applicable laws and regulations of such country or jurisdiction. ARSSBL requires such recipient to inform himself about and to observe any restrictions at his own expense, without any liability to ARSSBL. Any dispute arising out of this Report shall be subject to the exclusive jurisdiction of the Courts in India.
Statements on ownership and material conflicts of interest, compensation - ARSSBL and Associates
Answers to the Best of the knowledge and belief of ARSSBL/ its Associates/ Research Analyst who is preparing this report
ARSSBL/its Associates/ Research Analyst/ his Relative have actual/beneficial ownership of one per cent or more securities of the subject company, at the end of the month immediately preceding the date of publication of the research report?
No
ARSSBL/its Associates/ Research Analyst/ his Relative have actual/beneficial ownership of one per cent or more securities of the subject company No
ARSSBL/its Associates/ Research Analyst/ his Relative have any other material conflict of interest at the time of publication of the research report? No
ARSSBL/its Associates/ Research Analyst/ his Relative have received any compensation from the subject company in the past twelve months No
ARSSBL/its Associates/ Research Analyst/ his Relative have managed or co-managed public offering of securities for the subject company in the past twelve months
No
ARSSBL/its Associates/ Research Analyst/ his Relative have received any compensation for investment banking or merchant banking or brokerage services from the subject company in the past twelve months
No
ARSSBL/its Associates/ Research Analyst/ his Relative have received any compensation for products or services other than investment banking or merchant banking or brokerage services from the subject company in the past twelve months
No
ARSSBL/its Associates/ Research Analyst/ his Relative have received any compensation or other benefits from the subject company or third party in connection with the research report
No
ARSSBL/its Associates/ Research Analyst/ his Relative have served as an officer, director or employee of the subject company. No
Other Disclosures pertaining to distribution of research in the United States of America
This research report is a product of ARSSBL, which is the employer of the research analyst(s) who has prepared the research report. The research analyst(s) preparing the research report is/are resident outside the United States (U.S.) and are not associated persons of any U.S. regulated broker-dealer and therefore the analyst(s) is/are not subject to supervision by a U.S. broker-dealer, and is/are not required to satisfy the regulatory licensing requirements of FINRA or required to otherwise comply with U.S. rules or regulations regarding, among other things, communications with a subject company, public appearances and trading securities held by a research analyst account.
This report is intended for distribution by ARSSBL only to "Major Institutional Investors" as defined by Rule 15a-6(b)(4) of the U.S. Securities and Exchange Act, 1934 (the Exchange Act) and interpretations thereof by U.S. Securities and Exchange Commission (SEC) in reliance on Rule 15a 6(a)(2). If the recipient of this report is not a MajorInstitutional Investor as specified above, then it should not act upon this report and return the same to the sender. Further, this report may not be copied, duplicated and/or transmitted onward to any U.S. person, which is not the Major Institutional Investor.
In reliance on the exemption from registration provided by Rule 15a-6 of the Exchange Act and interpretations thereof by the SEC in order to conduct certain business withMajor Institutional Investors, ARSSBL has entered into an agreement with a U.S. registered broker-dealer, Cabrera Capital Markets. ("Cabrera"). Transactions in securities discussed in this research report should be effected through Cabrera or another U.S. registered broker dealer.
1. ARSSBL or its Affiliates may or may not have been beneficial owners of the securities mentioned in this report.
2. ARSSBL or its affiliates may have or not managed or co-managed a public offering of the securities mentioned in the report in the past 12 months.
3. ARSSBL or its affiliates may have or not received compensation for investment banking services from the issuer of these securities in the past 12 months and do not expect to receive compensation for investment banking services from the issuer of these securities within the next three months.
4. However, one or more of ARSSBL or its Affiliates may, from time to time, have a long or short position in any of the securities mentioned herein and may buy or sell those securities or options thereon, either on their own account or on behalf of their clients.
5. As of the publication of this report, ARSSBL does not make a market in the subject securities.
6. ARSSBL or its Affiliates may or may not, to the extent permitted by law, act upon or use the above material or the conclusions stated above, or the research or analysis on which they are based before the material is published to recipients and from time to time, provide investment banking, investment management or other services for or solicit to seek to obtain investment banking, or other securities business from, any entity referred to in this report.