Targeting Firm Births and Economic Regeneration in a Lagging Region Author(s): Peter Johnson Source: Small Business Economics, Vol. 24, No. 5 (Jun., 2005), pp. 451-464 Published by: Springer Stable URL: http://www.jstor.org/stable/40229438 . Accessed: 15/06/2014 13:04 Your use of the JSTOR archive indicates your acceptance of the Terms & Conditions of Use, available at . http://www.jstor.org/page/info/about/policies/terms.jsp . JSTOR is a not-for-profit service that helps scholars, researchers, and students discover, use, and build upon a wide range of content in a trusted digital archive. We use information technology and tools to increase productivity and facilitate new forms of scholarship. For more information about JSTOR, please contact [email protected]. . Springer is collaborating with JSTOR to digitize, preserve and extend access to Small Business Economics. http://www.jstor.org This content downloaded from 185.44.78.31 on Sun, 15 Jun 2014 13:04:54 PM All use subject to JSTOR Terms and Conditions
Transcript
Targeting Firm Births and Economic Regeneration in a Lagging RegionAuthor(s): Peter JohnsonSource: Small Business Economics, Vol. 24, No. 5 (Jun., 2005), pp. 451-464Published by: SpringerStable URL: http://www.jstor.org/stable/40229438 .
Accessed: 15/06/2014 13:04
Your use of the JSTOR archive indicates your acceptance of the Terms & Conditions of Use, available at .http://www.jstor.org/page/info/about/policies/terms.jsp
.JSTOR is a not-for-profit service that helps scholars, researchers, and students discover, use, and build upon a wide range ofcontent in a trusted digital archive. We use information technology and tools to increase productivity and facilitate new formsof scholarship. For more information about JSTOR, please contact [email protected].
.
Springer is collaborating with JSTOR to digitize, preserve and extend access to Small Business Economics.
http://www.jstor.org
This content downloaded from 185.44.78.31 on Sun, 15 Jun 2014 13:04:54 PMAll use subject to JSTOR Terms and Conditions
Targeting Firm Births and Economic Regeneration in a Lagging Region Pet er Johnson
ABSTRACT. This paper provides a critical evaluation of the practice of targeting the firm birth rate as part of a regional regeneration policy. It raises some fundamental questions about the appropriateness of such a practice and shows that different specifications of the birth rate generate very different implications for policy intervention, as measured by the number of births required. It also demonstrates that even when the specification is agreed, the translation of the target into actual numbers of births is far from straightforward, especially where the target aspires to match a region's performance with what is going on elsewhere and where the survival rate of businesses is also being targeted in parallel. The North East of England is used as the particular context for the evalua- tion, although the discussion has much wider applicability.
1. Introduction
This paper provides a critical evaluation of the practice of targeting the firm birth rate as part of a regional regeneration policy. It raises some fundamental questions about the appropriateness of such a practice and shows that different speci- fications of the birth rate generate very different implications for policy intervention, as measured by the number of births required. It also demon- strates that even when the specification is agreed, the translation of the target into actual numbers of births is far from straightforward, especially where the target aspires to match a region's per- formance with what is going on elsewhere and where the survival rate of businesses is also being targeted in parallel.
The North East (NE) of England is used as the particular context for this evaluation. This region
is an especially appropriate focus for our discussion for two reasons. First, the Regional Development Agency (RDA) for the NE, One NorthEast, hereafter ONE, has targeted the birth rate. Secondly, a top policy priority for the region is economic regeneration. The NE has had a relatively poor economic performance over the longer term (Evans et al., 1995), its economy is currently rather weak (ONE, 1999, p. 18; Fothergill, 2001) - notwithstanding the very substantial restructuring that has occurred (Hudson, 1998, ch. 3) - and question marks hang over its prospects (see for example, Cambridge Econometrics, 2000, p. 182).
Although the focus here is on the NE, the discussion has much wider applicability. The North West, Scotland and Wales for example are all regions where problems of economic decline have also been considerable. Furthermore, as indicated later, the development agencies in a number of English regions specified the birth rate as a policy objective in their initial strategy doc- uments which were published in 1999. The discussion is also directly relevant to regional agencies in other countries where regeneration policies are focused on stimulating entrepreneurial activity.
The plan for this paper is as follows. In the next section, we consider the underlying economic basis for using the birth rate as a target and point to some of the issues that such a target raises. Then in section 3, we examine the measurement of the birth rate. As we show later in the paper, how the birth rate is measured has important implications for policy. Section 4 outlines the context for ONE's birth rate policy, comparing the NE's birth rate record, both over time and across industries, with that of the Rest of the United Kingdom (RUK). In Section 5, ONE's birth rate target for the NE is considered. The development of this
Final version accepted on July 29, 2003
Barclays Centre for Entrepreneurship Durham Business School Mill Hill Lane Durham DH1 3LB U.K. E-mail: [email protected]
This content downloaded from 185.44.78.31 on Sun, 15 Jun 2014 13:04:54 PMAll use subject to JSTOR Terms and Conditions
policy is outlined and the particular way in which the target was specified by ONE in its 1999 strategy document (ONE, 1999) is examined. Section 6 then explores some key issues relating to this target and its interpretation, paying partic- ular attention to the way in which different targets may imply different numbers of births and to the interrelationship between birth and survival rates. The latter uses a simulation. Section 7 concludes the paper. Appendix I sets out, for comparative purposes, the business birth and survival objec- tives set by each RDA in their original strategy documents. Appendix II outlines the methodolog- ical basis for the simulation of the impact of different birth and survival rate policies that is presented in section 6.
2. The economic basis for targeting the birth rate
As section 5 indicates, ONE set itself the task of raising the NE birth rate to the RUK level, on the grounds that it would contribute to the elimination of the economically disadvantaged position of the region. Empirical work has highlighted the role of firm formation as a mechanism for employment generation (e.g. Ashcroft and Love, 1996; Gallagher et al., 1996; Hart and Oulton, 2001), innovation (e.g. Audretsch, 1999, esp. 8-10), economic growth (e.g. Schmitz, 1989) and the reduction in unemployment (e.g. Thurik, 1999). Central government policy statements (DTI, 1998; DTI/DfEE, 2001) have emphasised the importance of encouraging an entrepreneurial culture in which start-ups can flourish as a mechanism for main- taining competitiveness and a dynamic economy. It is therefore not surprising to find - see Appendix I- that the encouragement of business births is an objective that most of the RDAs, including ONE, set themselves in their initial strategy documents.
How far is it appropriate to target the birth rate in order to stimulate regeneration? A number of issues need to be highlighted here. The first is the potential interrelationship between birth and death rates. We know that substantial numbers of new businesses exit fairly early on in life: the evidence from VAT data for the NE suggests that about 60 per cent of new registrations in the NE exit within five years.1 Policy measures designed to encourage
births may simply raise this exit rate, if the capacity of the region, in terms of the market opportunities available for the new businesses, remains unchanged. Thus the new firms them- selves may fail earlier than previous cohorts. They may also displace (or reduce the scale of) existing businesses. There may of course be some welfare advantages from such displacement, if more efficient firms are dislodging less efficient ones. However displacement may only be occurring as the result of policy measures which happen to favour new businesses over existing ones, and not as a result of some efficiency advantage inherent in the newcomers' operations.
A second issue relates to the complex set of determinants that lie behind birth and self-employ- ment rates. There is now an extensive literature on these determinants over time (e.g. Evans and Leighton, 1989; Black et al., 1996) and across people (e.g. Blanchflower and Oswald, 1991), regions (e.g. Keeble and Walker, 1994; Johnson and Parker, 1996; Armington and Acs, 2002) and countries (e.g. Acs et al., 1992).2 Policy initiatives may succeed in compensating for factors in the economic environment that are less favourable to firm formation - although even here the evidence is mixed - but there is likely to be a limit on the extent to which such compensation can be made. ONE of course is aware of the need for an altogether broader approach to the economic needs of the NE, but there are dangers that the identifi- cation of a specific birth rate objective may potentially distort policy priorities.
Thirdly, it should be noted that while com- parability with the RUK is an understandable aim, there may be little reason to suppose that the NE's optimal rate, given its industrial structure, the available opportunities, the way those opportuni- ties are perceived and the supply of would-be founders, should all be the same as elsewhere. In the absence of this similarity, the appropriate mix of new and existing business activity is likely to vary across regions. This variation will apply to both new births generally, and to new high-tech businesses specifically.
Finally, the underlying economic or other justification for public policy designed to support business formation needs to be articulated. There are fundamental issues that need to be addressed
This content downloaded from 185.44.78.31 on Sun, 15 Jun 2014 13:04:54 PMAll use subject to JSTOR Terms and Conditions
Targeting Firm Births and Economic Regeneration in a Lagging Region 453
here: for example, Holtz-Eakin (2000) has argued that standard efficiency and equity arguments provide little foundation for small firms' policies. There are also concerns relating to the effective- ness of current policies aimed at small businesses. Again, some recent studies have raised doubts on this score: see for example Robson and Bennett (2000) and Bennett et al. (2001). Thus even if it was appropriate in principle to target the birth rate, there is no guarantee that effective policies to achieve the target could be devised and imple- mented.
3. Measuring the birth rate
Throughout this paper VAT registrations are used as proxies for the number of births and the number of "live" registrations is treated as a proxy for the business stock. These VAT statistics have some well-known limitations (Daley, 1990; Storey, 1994, pp. 50-51). In particular, it is known that registration data do not pick up all births: in 1999, the Small Business Service (2000b, p. 5) estimated that there were 3.7 m businesses in the U.K., compared with only 1.7 m VAT registrations (Small Business Service, 2000a). Given their very small average size, new firms are likely to be even more under-represented, with registration often occurring (if it happens at all) sometime after the business starts trading (Johnson and Conway, 1997). Changes in the real value of the VAT turnover threshold - below which businesses do not have to be registered - mean that time series analyses need to be approached with caution. Notwithstanding these limitations, however, the VAT figures still represent the best available data set for measuring births (Keeble and Walker, 1994), and it is not surprising to find them used by both central government and the RDAs (see section 5 below). Some of the difficulties sur- rounding the data are reduced if interest is restricted, as it mostly is in this paper, to the relative performance of the NE compared with RUK. On the other hand, any differences in regional prices levels will limit the validity of such comparisons, since ceteris paribus, the VAT threshold level will be reached more quickly in locations where prices are higher.3
Birth rates may be measured in different ways.
A common measure is the number of births as a proportion of the business stock, designated here as BRS. More formally, BRS for the NE in this case may be defined as follows (ignoring time subscripts)
BRSNE= i tfi = 1 ONE i = 1 ONE
And for the RUK as
nnn _ V* ^RVK DKdNE
_ - 2- ~W i = i oRVK
where
RlNE = the number of new registrations in sector i in the NE in the period
S'NE = the stock of registered businesses in sector i in the NE at the beginning of the period
Rruk = the number of new registrations in sector i in the RUK in the period
Pruk - the stock of registered businesses in sector i in the RUK at the beginning of the period
n = the number of sectors
In its original (1999) strategy document ONE used the BRS measure for its quantitative target. An alternative measure (here BRP) utilises population (or work force) as the denominator. BRS is par- ticularly appropriate for analysing the extent to which the business sector is being rejuvenated, while BRP, which was used by both the North West and East Midlands RDAs - the only other RDAs to set quantitative formation targets in their original strategy documents (see East Midlands Development Agency, 1999; and Northwest Development Agency, 1999, respectively)4 - is more relevant for examining how 'entrepreneurial' a region's people are. It is perhaps surprising, given its interest in stimulating the entrepreneurial culture of the region, that ONE did not make use of the BRP in its 1999 strategy, although it has since used this measure in later discussions (ONE, 2002a, p. 11). The two measures are of course related, even though their focus is different. Table I provides data on the two birth rates for the U.K. regions/countries. It is clear that the variation in BRS is much less than that in BRP. The NE has the lowest BRP in the U.K. (0.55 of
This content downloaded from 185.44.78.31 on Sun, 15 Jun 2014 13:04:54 PMAll use subject to JSTOR Terms and Conditions
NE 0.10 0.21 NW 0.11 0.33 Yorks and Humber 0.10 0.29 E. Midlands 0.10 0.34 W. Midlands 0.11 0.34 E. of England 0.10 0.40 London 0.14 0.66 SE 0.11 0.45 SW 0.10 0.38 Wales 0.08 0.26 Scotland 0.10 0.28 N. Ireland 0.07 0.28 U.K. 0.11 0.38
a Number of registrations in 1999 as a proportion of the registered stock of businesses at the beginning of 1999. b Number of registrations in 1999 per 100 of the population. Source: Small Business Service (2000a).
the U.K. figure); Wales and Northern Ireland have lower BRS scores (The NE's figure is 0.91 of the U.K.'s.)
Empirical work on the determinants of forma- tion suggests that how the birth rate is measured can have an important influence on the results. For example, Keeble and Walker (1994) show that the factors explaining variations in formation rates across the U.K. regions differ depending on how these rates are measured. In the case of some significant independent variables, the sign of the coefficient differs, depending on which birth rate measure is used.5
Death rates, based on deregistration data, can be similarly defined with respect to either the business stock (DRS) or to the population (DRP). The rest of this paper uses only BRS and DRS, as it is these measures that are the most relevant for ONE's targets.
In the next section, we examine the behaviour of the birth rate and death rate relatives over time. The Birth Rate Relative, comparing the birth rate in the NE with that in the RUK may be defined as
RRFTS - BRSNE DK&L,dNE RUK - - „
BRbRVK „
Similarly, the comparable Death Rate Relative may be defined as
DRELSNE RUK - nt??NE
4. The context for the NE's birth rate policy: the NE and RUK compared
Before the actual policy in the NE is examined, we provide the context for the birth objective by examining the behaviour of BRELSNEt RUK in the two decades up to the publication of ONE's 1999 strategy document: see Figure 1. DRELSNE RUK is also included in the figure as it is relevant for analysing the impact of BRELSNEt RUK.)
BRELSNE RUK shows a clear downward trend. In 1997, this relative was at its lowest level since 1980. Thus ONE faced a particular challenge over its region's birth rate when it drew up its strategy document in 1999. The overall trend in the Death Rate Relative is also downward but has a somewhat shallower slope. Thus the fall in the death relative has not been enough to compensate (in terms of the effect on the stock of businesses) for the fall in the birth relative. It is worth noting that the death relative has become more volatile since the beginning of the 1990s, although the reasons for this are unclear. These factors gave a further edge to the challenge faced by ONE in devising an appropriate strategy.
We now explore the behaviour of the BRELSNE RUK in more detail. From an accounting viewpoint, a distinction may be made between (i) the effects on the relatives of differences between the NE and RUK in industrial structure (the "structural effect"), and (ii) the effects of differ- ences in the NE's and RUK's formation rates in individual industries (the "formation effect"). The structural effect picks up the extent to which the NE's industrial structure is biased towards or against sectors that have higher formation rates. To identify this effect we may recalculate the relatives on the assumption that the NE has the same structure as RUK and then apply the NE's birth rate to this revised structure. Structure here is defined in terms of the distribution of the stock of businesses across sectors. In this partic- ular exercise, we are able to work with eleven sectors. The birth rate for the NE allowing for structural effects, BRSfi™, reflects the extent to which the NE has a sectoral structure which is biased towards or against sectors that have higher
This content downloaded from 185.44.78.31 on Sun, 15 Jun 2014 13:04:54 PMAll use subject to JSTOR Terms and Conditions
formation rates. More formally, and ignoring time subscripts
ill t *.«-?*-)*&] ddqstr__
^ N i = i
' _
DKONE - _
£xSm where the notation is as before.
The formation effect arises because for given sectors the NE formation rate may be higher or lower than that in the RUK. Table II shows BRELSNEi RUK by broad industrial sector for the period 1994-98. The relevant birth rates are calculated as the total number of births, 1994-1998, divided by the sum of the stock at the start of each year, 1994-1998. This procedure provides a "weighted" birth rate.
In only two sectors, "Hotels and restaurants", and "Public administration; Other community, social and personal services", is the ratio greater than one. Thus if the NE does have a relative advantage in formation terms, it is not in areas which would be generally regarded as being at the forefront of economic progress.
A birth rate for the NE allowing for formation effects, BRSSiRM may be calculated as follows (again ignoring time subscripts):
DDCF0RM_ *sl V &RUK '
i = 1
where the notation is as previously. Figure 2 recalculates the birth relatives
using BRSfi? (BRELSSJER RUK) and BRS$m (BRELSFfi£MRUK). The figure shows that allowance for different sectoral structures (BRELSSJER RUK)
TABLE II BRELSNERVK by sector, 1994-1998
Sector BRELSNERUK
Agriculture; forestry and fishing 0.77 Mining and quarrying; Electricity, gas and
water supply 0.87 Manufacturing 0.90 Construction 0.93 Wholesale, retail and repairs 0.89 Hotel s and restaurants 1.10 Transport, storage and communication 0.91 Financial intermediation 0.80 Real estate, renting and business activities 0.83 Public administration; Other community,
social and personal services 1 .08 Education, health and social work. 0.95
TOTAL 0.91
Source: Based on DTI data.
This content downloaded from 185.44.78.31 on Sun, 15 Jun 2014 13:04:54 PMAll use subject to JSTOR Terms and Conditions
makes little difference to the NE/RUK relative, except perhaps between 1989 and 1993. Thus Figure 2 indicates that the NE's relatively lower birth rate does not reflect a regional sectoral structure that is biased against sectors with low birth rates. When however allowance is made for differences between the NE and the RUK in the birth rate in individual sectors, via BRELS^RM, the change in the relative is much more noticeable. It levels out the relative, though the latter still retains a slight downward trend. It is clear from Figure 2 that the NE's relatively lower performance reflects its lower birth rate in individual sectors, rather than a sectoral structure that emphasises sectors with low birth rates. This finding is consistent with the results of earlier studies (Johnson, 1983; Storey and Johnson, 1987).
The approach adopted above has some obvious limitations. Firstly, it is essentially an accounting exercise; it tells us nothing about the causes that lie behind the trends shown in Figure 2. Secondly, it may not be appropriate to treat the effects of differences in sectoral structure and those of differences in birth rates in individual industries as independent influences. For example, the NE's lower birth rate in particular sectors may lead to a sectoral structure that is less congenial to for- mation activity. Thirdly, the results are likely to
be sensitive to the level of sectoral aggregation. Nonetheless, the approach does provide some initial pointers to the nature of the differences between the NE and the RUK. The results suggest that the region's lower birth rate does not derive so much from its structure but from a more wide- spread reluctance (for whatever reason) to set up in business that is present across the board.
5. A birth rate target for the NE
Each of the eight English RDAs established in 1999 was charged with drawing up an economic development strategy for its region.6 In its statu- tory guidance to the RDAs7 on what to include in this strategy, the then Department for the Environment, Transport and the Regions (DETR)8 asked each of them to include "business forma- tions and survival rates" as one of its core "state of the region" indicators,9 and the "number of business start-ups and survival rates" (our italics) as an indicator of its activity. It is however puzzling why numbers should be used for business start-ups and rates for measuring survival.
In its Regional Economic Strategy, ONE pointed out that in the NE The rate of new VAT registrations.. .is lower than every U.K. region except Wales and Northern Ireland . . .' (ONE,
This content downloaded from 185.44.78.31 on Sun, 15 Jun 2014 13:04:54 PMAll use subject to JSTOR Terms and Conditions
Targeting Firm Births and Economic Regeneration in a Lagging Region 457
1999, p. 19). This statement is based on the BRS measure. As we have seen however, if the BRP measure is used (see Table I), the NE is the lowest performer of all. This difference demonstrates that the precise choice of measure is important in terms of any assessment of regional ranking.
The same Strategy accepted an explicit target to "increase business start-ups to [the] U.K. average by 2010" (ONE, 1999, p. 103). Such a target, implicitly couched here by ONE in terms of numbers, is nevertheless only meaningful in terms of birth rates. In terms of the latter, the target is of course the equivalent of the NE's rate equalling the aggregate rate for the rest of the U.K. (RUK). In 1999, the base year for this study, the (percentage) rates were, respectively, 0.1007 and 0.1082 and it is these rates that are assumed in the rest of this paper.
The birth rate target for the NE was an expres- sion of the Strategy's wider commitment to building a "new entrepreneurial culture" in the region, and its assessment that
"The key to strengthening the Region's wealth creating capacity is to provide an environment in which entrepre- neurs can run successful businesses . . . New businesses will be essential elements of the Region's clusters because they are often visionary and flexible in their thinking, management and marketing. They provide the mechanisms that create whole new industries. The Region must redis- cover the spirit of enterprise . . .
To do this, we must motivate those already in the Region to start new businesses and equip them with the skills to do so. . . ."
(ONE, 1999, p. 44)
Alongside the target of raising the overall birth rate, ONE also set itself a further target of increasing the number of new high technology businesses to the U.K. average by 2010 (ONE, 1999, p. 103). It is not immediately clear what this target means - again there seems to be the potential for some confusion between numbers and rates - nor it is clear how it relates precisely to the target of creating 200 "high growth" com- panies by 2010 (ONE, 1999, p. 45). (Does high growth always mean high technology?) Furthermore no U.K wide data are cited (it is unclear whether such data are available) and there is a certain arbitrariness about the figure:10 no indication is given about how the figure of 200 was arrived at. Specific targets on high growth/
high tech companies have been set by a number of RDAs (see Appendix I). This paper however is concerned only with the overall birth rate.
When ONE's strategy for encouraging a more entrepreneurial culture was published in 2001 (ONE, 2001), it did not specify the target of reaching equivalence with the rest of the U.K. Again, in the revised overall economic strategy published a year later (2002b) the parity goal was not alluded to, although the supporting economic and technical report, supporting this revised strategy, did spell out the task in the following terms: "There is now a clear aim to generate new and growing companies [sic] by a least the same rate as other U.K. regions." (ONE, 2002a, p. 3). The report gives both BRS and BRP measures but does not say which one it would use in analysing parity.
6. The target formation rate: some issues
In this section we examine some of the detailed issues associated with the use by ONE of BRSNE as a policy target. The following may be noted. First, the choice of birth rate measure carries very different implications for the number of registra- tions required to ensure equality between the NE and RUK. For BRSNE, to equal BRSRUK, in 1999, the NE would have needed another 315 registra- tions.11 With BRP however, 3,787 additional registrations would have been required.12 Clearly the financial implications of providing support for business births is likely to vary hugely with the precise specification of the target. It so happens that ONE chose the indicator with the more modest numbers target, although there is no evidence that this was done deliberately.
Secondly, the implications of the target BRSNE for numbers of births, and hence for policy inter- vention, will be affected by other regions' policies. We have already drawn attention to the birth rate aspirations of some other RDAs (see Appendix I). Even the South East Development Agency (SEDA), the region with one of the highest for- mation rates already, sought a "step change" in that rate (SEDA, p. 15).
Finally, predictions about the future time path of BRS are complicated by the direct effect of an increase in the numerator on the denominator -
This content downloaded from 185.44.78.31 on Sun, 15 Jun 2014 13:04:54 PMAll use subject to JSTOR Terms and Conditions
more births imply an immediate increase in stock - and by any changes in the survival rate, of both new and existing firms, on the denominator. Births and deaths may not of course be independent. The former may for example stimulate deaths among the existing business stock, through a "competi- tion" effect. Alternatively, births may reduce deaths through a "multiplier" effect. Births (deaths) may also affect births (deaths) in a sub- sequent period. The evidence on these relation- ships is mixed (Johnson and Parker, 1996). It should be noted that where the DRSNE exceeds the BRSNE, a target BRSNE may be achievable without increasing the number of births, or even by letting it fall. The reason for this is that where DRSNE exceeds BRSNE the stock, the denominator for BRSNE, must be falling and hence a lower number of births may achieve the BRSNE target. This is not merely an academic point: between 1992 and 1998, DRSNE was higher than BRSNE in all but one year: see Figure 2.
Interestingly, as we have seen, ONE committed itself to raising the survival rate of new businesses to the U.K. average (ONE, 1999, p. 103). Paradoxically, an increased survival rate, which lowers the rate at which the stock is depleted, does of course make the attainment of a BRSNE target more challenging (see below).
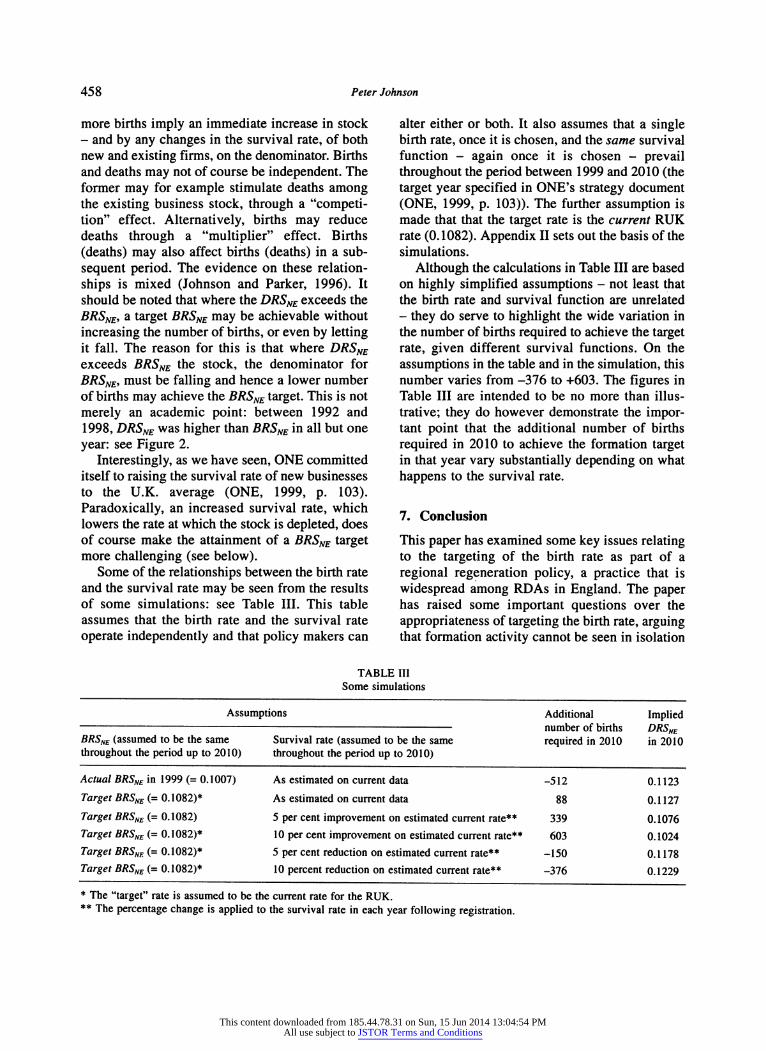
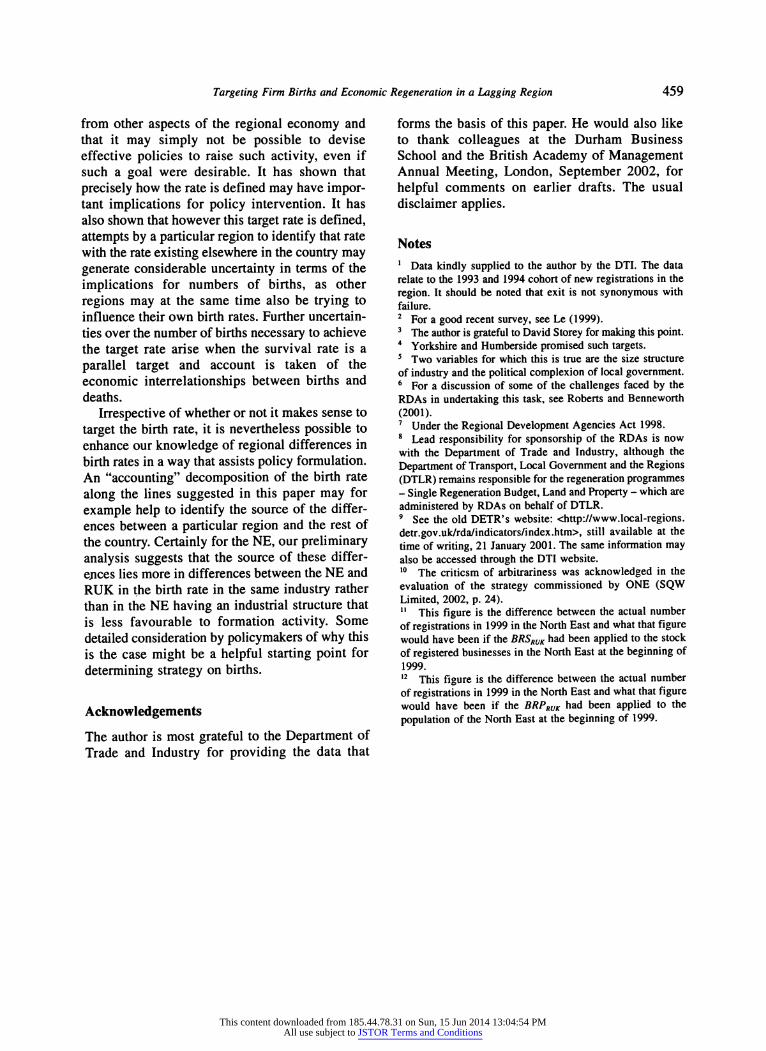
Some of the relationships between the birth rate and the survival rate may be seen from the results of some simulations: see Table III. This table assumes that the birth rate and the survival rate operate independently and that policy makers can
alter either or both. It also assumes that a single birth rate, once it is chosen, and the same survival function - again once it is chosen - prevail throughout the period between 1999 and 2010 (the target year specified in ONE's strategy document (ONE, 1999, p. 103)). The further assumption is made that that the target rate is the current RUK rate (0.1082). Appendix II sets out the basis of the simulations.
Although the calculations in Table III are based on highly simplified assumptions - not least that the birth rate and survival function are unrelated - they do serve to highlight the wide variation in the number of births required to achieve the target rate, given different survival functions. On the assumptions in the table and in the simulation, this number varies from -376 to +603. The figures in Table III are intended to be no more than illus- trative; they do however demonstrate the impor- tant point that the additional number of births required in 2010 to achieve the formation target in that year vary substantially depending on what happens to the survival rate.
7. Conclusion
This paper has examined some key issues relating to the targeting of the birth rate as part of a regional regeneration policy, a practice that is widespread among RDAs in England. The paper has raised some important questions over the appropriateness of targeting the birth rate, arguing that formation activity cannot be seen in isolation
TABLE III Some simulations
Assumptions Additional Implied - number of births DRSNE BRSNE (assumed to be the same Survival rate (assumed to be the same required in 2010 in 2010 throughout the period up to 2010) throughout the period up to 2010)
Actual BRSNE in 1999 (= 0.1007) As estimated on current data -512 0.1 123
Target BRSNE (= 0. 1 082)* As estimated on current data 88 0.11 27
Target BRSNE (= 0.1082) 5 per cent improvement on estimated current rate** 339 0.1076 Target BRSNE (= 0. 1 082)* 10 per cent improvement on estimated current rate** 603 0. 1024 Target BRSNE (= 0.1082)* 5 per cent reduction on estimated current rate** -150 0.1 178 Target BRSNE (= 0.1082)* 10 percent reduction on estimated current rate** -376 0.1229
* The "target" rate is assumed to be the current rate for the RUK. ** The percentage change is applied to the survival rate in each year following registration.
This content downloaded from 185.44.78.31 on Sun, 15 Jun 2014 13:04:54 PMAll use subject to JSTOR Terms and Conditions
Targeting Firm Births and Economic Regeneration in a Lagging Region 459
from other aspects of the regional economy and that it may simply not be possible to devise effective policies to raise such activity, even if such a goal were desirable. It has shown that precisely how the rate is defined may have impor- tant implications for policy intervention. It has also shown that however this target rate is defined, attempts by a particular region to identify that rate with the rate existing elsewhere in the country may generate considerable uncertainty in terms of the implications for numbers of births, as other regions may at the same time also be trying to influence their own birth rates. Further uncertain- ties over the number of births necessary to achieve the target rate arise when the survival rate is a parallel target and account is taken of the economic interrelationships between births and deaths.
Irrespective of whether or not it makes sense to target the birth rate, it is nevertheless possible to enhance our knowledge of regional differences in birth rates in a way that assists policy formulation. An "accounting" decomposition of the birth rate along the lines suggested in this paper may for example help to identify the source of the differ- ences between a particular region and the rest of the country. Certainly for the NE, our preliminary analysis suggests that the source of these differ- ences lies more in differences between the NE and RUK in the birth rate in the same industry rather than in the NE having an industrial structure that is less favourable to formation activity. Some detailed consideration by policymakers of why this is the case might be a helpful starting point for determining strategy on births.
Acknowledgements The author is most grateful to the Department of Trade and Industry for providing the data that
forms the basis of this paper. He would also like to thank colleagues at the Durham Business School and the British Academy of Management Annual Meeting, London, September 2002, for helpful comments on earlier drafts. The usual disclaimer applies.
Notes 1 Data kindly supplied to the author by the DTI. The data relate to the 1993 and 1994 cohort of new registrations in the region. It should be noted that exit is not synonymous with failure. 2 For a good recent survey, see Le (1999). 3 The author is grateful to David Storey for making this point. 4 Yorkshire and Humberside promised such targets. 5 Two variables for which this is true are the size structure of industry and the political complexion of local government. 6 For a discussion of some of the challenges faced by the RDAs in undertaking this task, see Roberts and Benneworth (2001). 7 Under the Regional Development Agencies Act 1998. 8 Lead responsibility for sponsorship of the RDAs is now with the Department of Trade and Industry, although the Department of Transport, Local Government and the Regions (DTLR) remains responsible for the regeneration programmes - Single Regeneration Budget, Land and Property - which are administered by RDAs on behalf of DTLR. 9 See the old DETR's website: <http://www.local-regions. detr.gov.uk/rda/indicators/index.htm>, still available at the time of writing, 21 January 2001. The same information may also be accessed through the DTI website. 10 The criticsm of arbitrariness was acknowledged in the evaluation of the strategy commissioned by ONE (SQW Limited, 2002, p. 24). 11 This figure is the difference between the actual number of registrations in 1999 in the North East and what that figure would have been if the BRSRVK had been applied to the stock of registered businesses in the North East at the beginning of 1999. 12 This figure is the difference between the actual number of registrations in 1999 in the North East and what that figure would have been if the BRPRUK had been applied to the population of the North East at the beginning of 1999.
This content downloaded from 185.44.78.31 on Sun, 15 Jun 2014 13:04:54 PMAll use subject to JSTOR Terms and Conditions
Appendix II. Formation rate simulations in the NE This appendix gives the derivation of the data in Table III. The starting point for the simulations on which that table was based was the assumption that the same birth rate, once chosen, would prevail in each of the years up to 2010. In order to examine the behaviour of the stock figure, it was necessary to estimate a survival function for registered businesses by their age from regis- tration. This survival function was then applied both to the existing stock at the beginning of 1999 and to each annual cohort of newcomers up to 2010.
The survival function was based on survival data provided to the author by the Department of Trade and Industry for each new annual cohort of registrations, 1993-1998. The relevant data are reproduced below.
TABLE Al Survival rates of new registrations, NE: 1993-1998
It should be noted that there is evidence of increasing survival rates though time. It was assumed therefore that the estimated survival function for the 1998 cohort, for whom only two periods of actual data were available, provided the most appropriate survival function post 1999 for both new registrations and for the existing stock. The survival data for cohorts registering in the five years prior to 1998 were used to estimate a function for 72 months after registration for the 1998 cohort in the following way. Let Vct be the actual survival rate at time / (measured in months) of cohort c (defined in terms of the year of registration) and VJt est an estimate of that rate. Then
V1998 V - __ / 1/1997/ V i/1997x X v 1/1998 V1998 V 18. e st - __
V 1/1997/ V 18 'M2 / X v M2
1/1998 _ /w 1997/1/1997 >V\% ) \ X Y 1/1998 V 1/1998 V24,est-\V24
_ 1997/1/1997 >V\% ) \ X Y V \Z, est
1/1998 V _ KVW /i/1996/i/1996\ >V2A ) X v 1/1998 1/1998 V 30, est~
_ KVW /i/1996/i/1996\ >V2A ) X v 1/1998 V2A> est
and so on. This procedure gives the following survival function for the 1998 cohort.
Targeting Firm Births and Economic Regeneration in a Lagging Region 463
An exponential function was then fitted to the estimated values for the 1998 cohort to provide estimates of survival rates after 72 months over the period up to 2010. This function (V)™ = 106.7e"00567r) was used to calculate the survival of the stock already existing at the beginning of 1998, and the survival of new registrations entering in each of the years up to 2010. An age breakdown of the existing stock enabled the survival function to be applied appropriately.
The assumptions on the birth and survival rates does of course automatically generate the death rate. The simulation thus assumes that policy makers can only affect the birth and survival function; they do not influence directly the death rate.
References
Acs, Z. J., D. B. Audretsch and D. S. Evans, 1992, The Determinants of Variations in Self- Employment Rates across Countries and over Time, mimeo, second draft. Cambridge, MA: National Economic Research Associates, Inc.
Armington, C. and Z. J. Acs, 2002, The Determinants of Regional Variation in New Firm Formation*, Regional Studies 36, 33-45.
Ashcroft, B. and J. H. Love, 1996, 'Employment Change and New Firm Formation in U.K. Counties, 1981-89', in M. W. Danson (ed.), Small Firm Formation and Regional Economic Development, London: Routledge, pp. 17-35.
Audretsch, D. B., 1999, 'Linking Entrepreneurship to Economic Growth', in G. D. Libecap (ed.), The Sources of Entrepreneurial Activity. Advances in the Study of Entrepreneurship and Economic Growth, Vol. 11, Stamford, CT: JAI Press, pp. 1-28.
Bennett, R. J., P. J. A. Robson and W. J. A. Bratton, 2001, 'Government Advice Networks for SMEs: an Assessment of the Influence of Local Context on Business Link Use, Impact and Satisfaction', Applied Economics 33, 871-885.
Black, J., D. de Meza and D. Jeffreys, 1996, 'House Prices, the Supply of Collateral and the Enterprise Economy', Economic Journal 106, 60-75.
Blanchflower, D. G. and A. Oswald, 1991, What Makes an Entrepreneur? National Bureau of Economic Research Working Paper 3252, revised. Cambridge, MA: NBER.
Daley. M., 1990, 'The 1980s - a Decade of Growth in Enterprise', Employment Gazette 98, 553-565.
DTI, 1998, Our Competitive Future: Building the Knowledge Driven Economy, CM 4176, London: Stationery Office.
DTI/DfEE, 2001, Opportunity for All in a World of Change: a White Paper on Skills Enterprise and Innovation, URN01/538C, London: DTI.
East Midlands Development Agency, 1999, Economic Development Strategy for the East Midlands. Regional Delivery Plan 2000-2003. Nottingham: East Midlands Development Agency.
Evans, L. E., P. S. Johnson and R. B. Thomas, 1995, The Northern Region Economy: Progress and Prospects in the North of England, London : Mansell.
Evans, D. S. and L. S. Leighton, 1989, 'The Determinants of Changes in U.S. Self-Employment, 1968-1987', Small Business Economics 1, 1 11-119.
Fothergill, S., 2001, 'The True Scale of the Regional Problem in the U.K.', Regional Studies 35, 241-246.
Gallagher, C, J. Kidd and P. Miller, 1996, 'Empirical
Research on the Role of New Firms in Scotland', in M. W. Danson (ed.), Small Firm Formation and Regional Economic Development, London: Routledge, pp. 65-80.
Hart, P. E. and N. Oulton, 2001, 'Galtonian Regression, Company Age and Job Generation 1986-95', Scottish Journal of Political Economy 48, 82-98.
Holtz-Eakin, D., 2000, 'Public Policy Towards Entrepreneurship', Small Business Economics 15, 283-291.
Hudson, R., 1998, Production, Places and Environment, Harlow: Prentice Hall.
Johnson, P. S., 1983, 'New Manufacturing Firms in the U.K. Regions', Scottish Journal of Political Economy 30, 75-79.
Johnson, P. S. and C. Conway, 1997, 'How Good are the U.K. VAT Registration Data at Measuring Firm Births?', Small Business Economics 9, 403-409.
Johnson, P. S. and S. Parker, 1996, 'Spatial Variations in the Determinants and Effects of Firm Births and Deaths', Regional Studies 30, 679-688.
Keeble, D. and S. Walker, 1994, 'New Firms, Small Firms and Dead Firms: Spatial Patterns and Determinants in the United Kingdom', Regional Studies 28, 41 1-427.
Le, A. T., 1999, 'Empirical Studies of Self-Employment', Journal of Economic Surveys 13, 381-417.
Northwest Development Agency, 1999, England's North West. A Strategy towards 2020, Warrington: Northwest Development Agency.
One NorthEast, 1999, Regional Economic Strategy for the North East. Unlocking our Potential. Newcastle: One North East.
One NorthEast, 2001, Everybody's Business. The North East of England Enterprise Strategy. Newcastle: One North East.
One NorthEast, 2002a, Realising Our Potential: Economic Anaysis and Technical Report. Newcastle: One North East.
One NorthEast, 2002b, Realising Our Potential: the Regional Economic Strategy for the North East of England. Newcastle: One North East.
Roberts, P. and P. Benneworth, 2001, 'Pathways to the Future? An Initial Assesment of RDA Srategies and their Contribution to Integrated Regional Development', Local Economy 16, 142-159.
Robson, P. J. A and R. J. Bennett, 2000, 'SME Growth: the Relationship with Business Advice and External Collaboration', Small Business Economics 15, 193-208.
Schmitz, J. A., 1989, 'Entrepreneurship, and Long-Run Growth', Journal of Political Economy 97, 721-739.
Small Business Service, 2000a, Business Start-Ups and Closures: VAT Registrations and De-registrations, 1980-99, URN00/1 11, Sheffield: Research and Evaluation Unit, Small Business Service, October.
Small Business Service, 2000b, Small and Medium Enterprise (SME) Statistics for the United Kingdom, URN00/92,
This content downloaded from 185.44.78.31 on Sun, 15 Jun 2014 13:04:54 PMAll use subject to JSTOR Terms and Conditions
Sheffield: Research and Evaluation Unit, Small Business Service, September.
South East Development Agency, 1999, Building a World Class Region. An Economic Strategy for the South East of England. Guildford: South East Development Agency.
SQW Limited, 2002, Regional Economic Strategy Evaluation Study. A Final Report to ONE NorthEasu Cambridge: SQW.
Storey, D., 1994, Understanding the Small Business Sector, London: Routledge.
Storey, D. J. and S. Johnson, 1987, 'Regional Variations in Entrepreneurship in the U.K.', Scottish Journal of Political Economy 34, 161-173.
Thurik, A. R., 1999, 'Entrepreneurship, Industrial Transformation and Growth', in G. D. Libecap (ed), The Sources of Entrepreneurial Activity. Advances in the Study of Entrepreneurship and Economic Growth, Vol. 11, Stamford, CT: JAI Press, pp. 29-65.
This content downloaded from 185.44.78.31 on Sun, 15 Jun 2014 13:04:54 PMAll use subject to JSTOR Terms and Conditions