Preliminary Comments Welcome Targeting Lead in Solid Waste Hilary Sigman 1 Department of Economics Rutgers University 75 Hamilton Street New Brunswick, NJ 089011248 [email protected]September 2003 Prepared for OECD Workshop on the Economics of Waste, October 2003. Abstract This paper explores policy options for reducing lead in municipal solid waste. It focuses on policies that rely on economic incentives, such as taxes, deposit-refunds, and recycled content standards. The paper addresses the relative cost effectiveness of these approaches and also considers the overall desirability of government intervention to reduce lead disposal. 1 I am grateful to Huiying Zhang for research assistance.
Prepared for OECD Workshop on the Economics of Waste, October 2003.
Abstract
This paper explores policy options for reducing lead in municipal solid waste. Itfocuses on policies that rely on economic incentives, such as taxes, deposit-refunds,and recycled content standards. The paper addresses the relative cost effectiveness ofthese approaches and also considers the overall desirability of government interventionto reduce lead disposal.
1I am grateful to Huiying Zhang for research assistance.
Exposure to lead may present one of the most prevalent and serious environmental threats
to human health. Recent research has shown that lead is toxic even at very low doses; indeed,
there may be no blood lead level completely without adverse effects. With levels of lead
exposure common in some U.S. cities, children and fetuses are at risk of IQ deÞcits, impaired
reaction time, and other neurological problems (Banks et al., 1997). Studies have found that
children exposed to lead have higher school drop-out rates, lower career achievement, and
higher proclivity to crime, so the range of social harms and victims from lead pollution is
great.
Many countries have made signiÞcant efforts to reduce exposure to lead, most importantly
phasing out lead additives in gasoline. Other important policies target exposures from lead
in paint, in food containers, and in drinking water from old lead-bearing pipes. There is
also interest in reducing lead in solid waste because of the concern that lead waste may
give rise to human and environmental exposure after wastes are incinerated or disposed in
landÞlls. Different policy approaches have been suggested and adopted: this paper provides
a comparison of some of the most prevalent and promising approaches.
The paper begins with background on the sources of lead in municipal solid waste and
its implications. The second section discusses policy options to reduce lead in waste. In the
third section, I quantify the effects and costs of several incentive policies for battery recycling
in the U.S. and suggest how the results might differ if the policies were extended to other
uses of lead. The empirical evidence suggests that incentive-based policies can be successful
in encouraging recycling and reducing disposal, but there are substantial differences in the
cost effectiveness of various incentive policies. The fourth section discusses earlier research
that raises questions about the desirability of any policy to reduce lead in solid waste in the
U.S. A Þnal section brießy concludes.
1 Lead in municipal solid waste
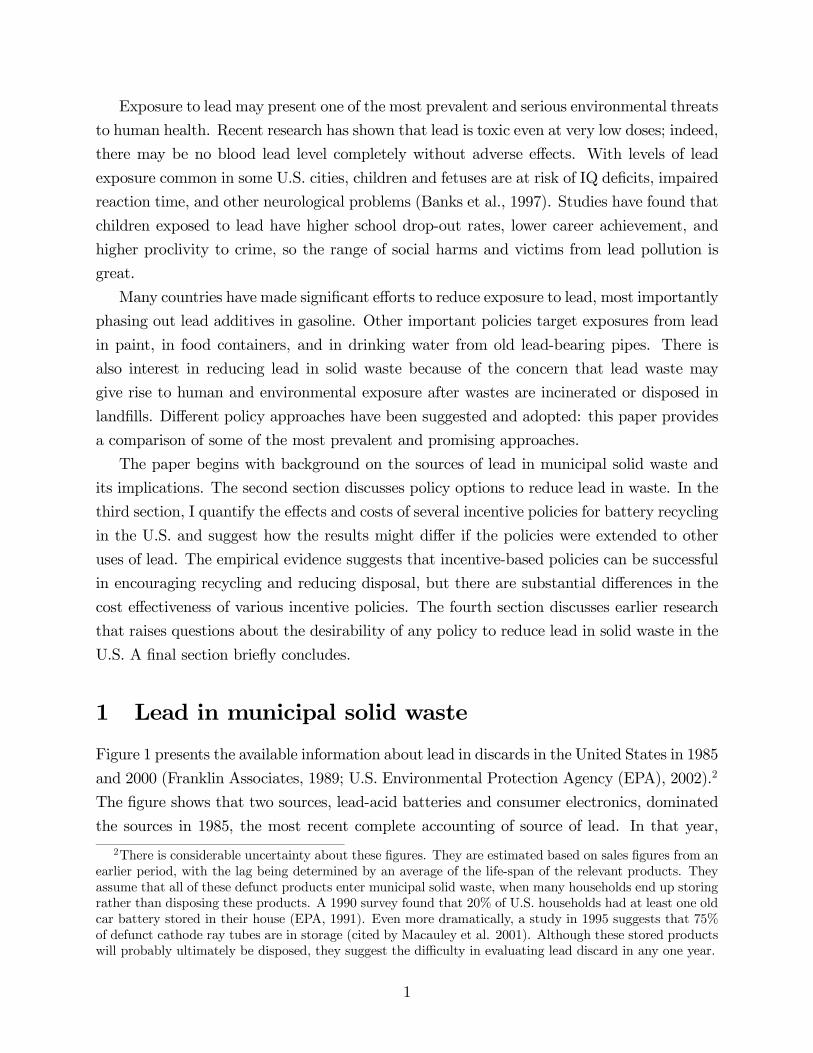
Figure 1 presents the available information about lead in discards in the United States in 1985
and 2000 (Franklin Associates, 1989; U.S. Environmental Protection Agency (EPA), 2002).2
The Þgure shows that two sources, lead-acid batteries and consumer electronics, dominated
the sources in 1985, the most recent complete accounting of source of lead. In that year,
2There is considerable uncertainty about these Þgures. They are estimated based on sales Þgures from anearlier period, with the lag being determined by an average of the life-span of the relevant products. Theyassume that all of these defunct products enter municipal solid waste, when many households end up storingrather than disposing these products. A 1990 survey found that 20% of U.S. households had at least one oldcar battery stored in their house (EPA, 1991). Even more dramatically, a study in 1995 suggests that 75%of defunct cathode ray tubes are in storage (cited by Macauley et al. 2001). Although these stored productswill probably ultimately be disposed, they suggest the difficulty in evaluating lead discard in any one year.
1
0
50,000
100,000
150,000
200,000
250,000
300,000
1985 2000
ton
s
Other
Pigments
Cans and other shipping containers
Plastics
Glass and ceramic products
Consumer electronics
Lead-acid storage batteries
Sources: Franklin Associates (1989), all sources of lead, 1985; U.S. EPA (2002), batteries and consumer electronics only, 2000.
Figure 1: Lead in municipal solid waste in the United States, 1985 and 2000
batteries composed 77% of lead in municipal solid waste and consumer electronics, 16%. A
few other sources, including principally glass, plastics, and cans represented cumulatively
about 6% of lead discarded. For a more recent perspective, Figure 1 presents data for
batteries and consumer electronics in 2000, but the 2000 values exclude smaller sources so
understate the total.
Figure 1 suggests a dramatic decline in lead in municipal solid waste during this 15 year
period. The source of this decline is an increase in the recovery of lead from batteries. As
a result, batteries have shrunk from 77% of lead discarded to less than 30%. At the same
time, there has been an increase in lead disposed in consumer electronics, in particular the
lead in cathode ray tubes (CRTs) from televisions and computer monitors. Although these
represented only 16% of lead in 1985, they now far surpass batteries as a source of lead.
These Þgures are for the U.S. which recycles more batteries and uses both more storage
batteries and electronics than most other countries; however, the relative change over time
is probably similar in other developed countries. Thus, any policy that aims to reduce lead
in municipal solid waste should focus on these two sources, which this section discusses in
more detail.
2
Alloys, 2%
Batteries, 73%
Cable sheathing, 2%
Fuel additives, 1%
Pigments, 11%
Rolled/extrusions, 7%
Other, 3%Ammunition, 2%
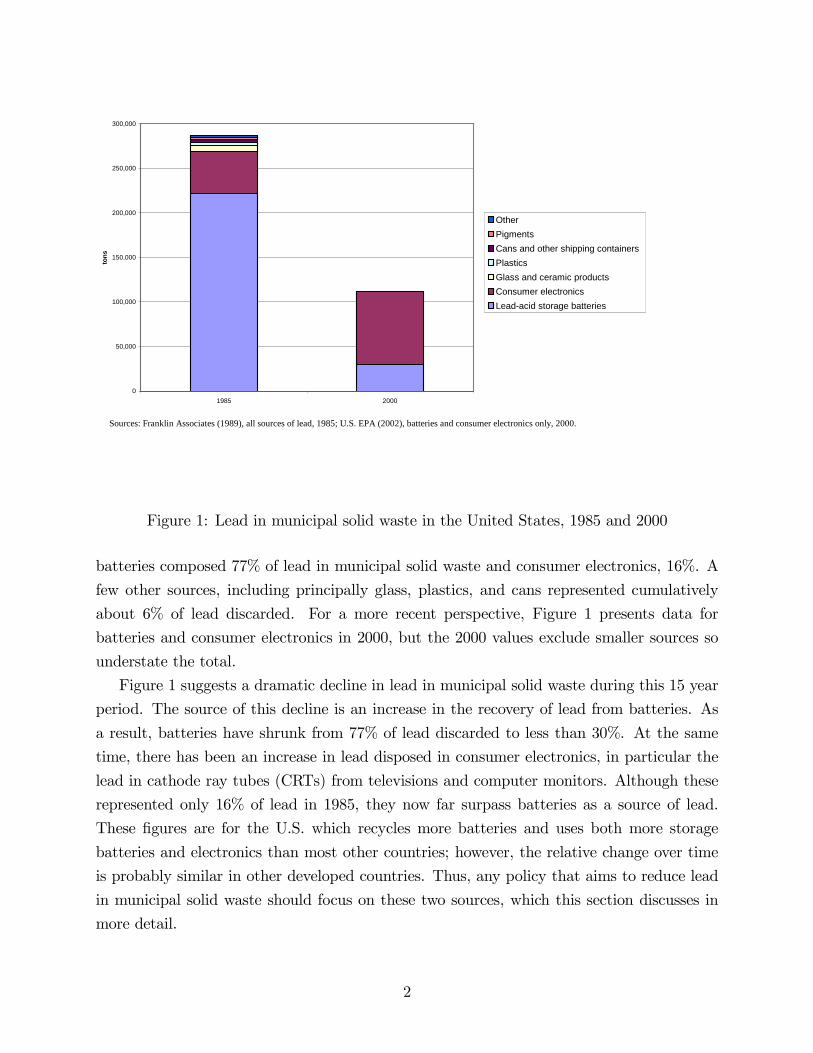
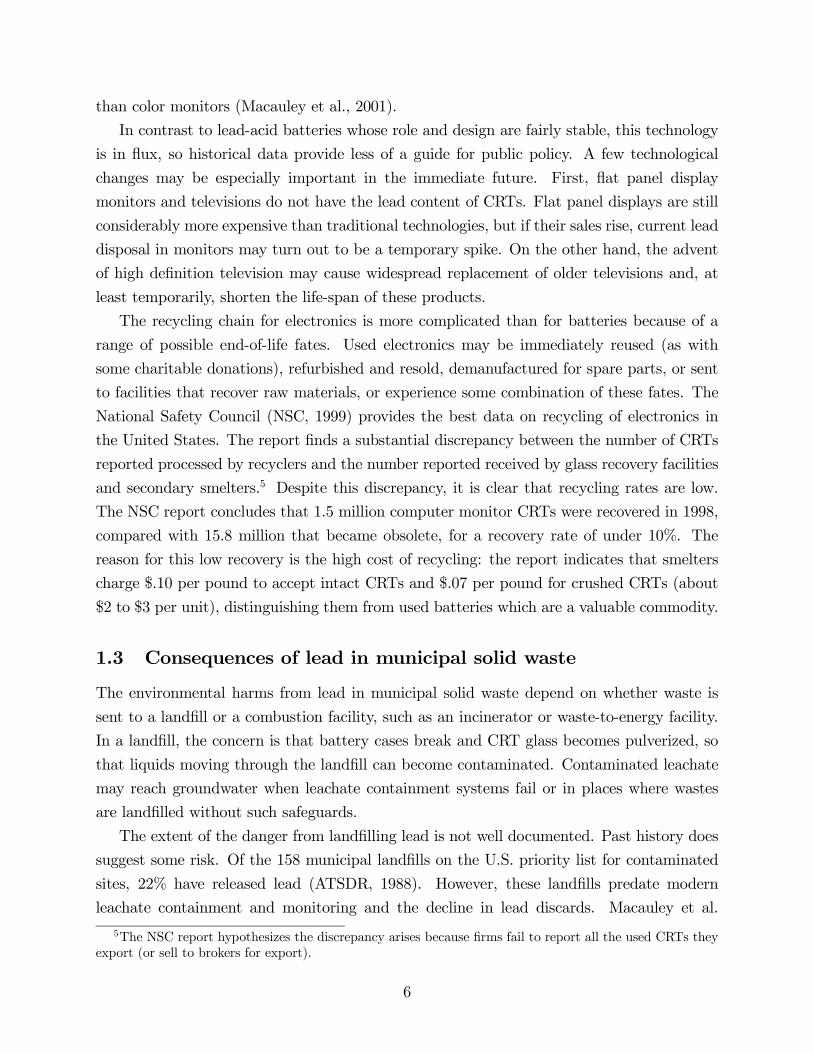
Source: Thorton et al. (2001), from ILZSG data.
Figure 2: International uses of lead, 1997
1.1 Lead-acid batteries
Lead�s primary use is for lead-acid batteries. Figure 2 shows use in 1997 of lead in countries
that are members of the International Lead and Zinc Study Group (ILZSG) and account for
about 80% of global lead consumption. The Þgure shows that batteries account for 73% of
lead use. In the U.S., batteries are even more predominant, consuming 1.4 million metric
tons in 2001, 87% of the total consumption of lead. Most lead-acid batteries are used as
starting-lighting-ignition batteries for motor vehicles (78% in 1992). The remaining batteries
are used for motive power in electric vehicles, such as in-plant fork-lifts, and other industrial
uses, such as uninterruptable power supply for large computer systems and standby power
supply for emergency lighting.
Demand for batteries will probably continue to grow for a few reasons. First, increased
vehicle use will raise demand. Second, battery lives are declining because of higher vehicle
underhood temperatures, greater use of vehicles in warmer climates where their life-span is
shorter (averaging 40 months in the U.S. South relative to 58 months in the North), and more
electrical gadgets in cars (Purchasing, 1997). Finally, storage batteries are seeing expanded
use in electric and hybrid vehicles and as backup power for computer and electrical systems.
Although batteries represent the dominant use of lead, their contribution to lead in
3
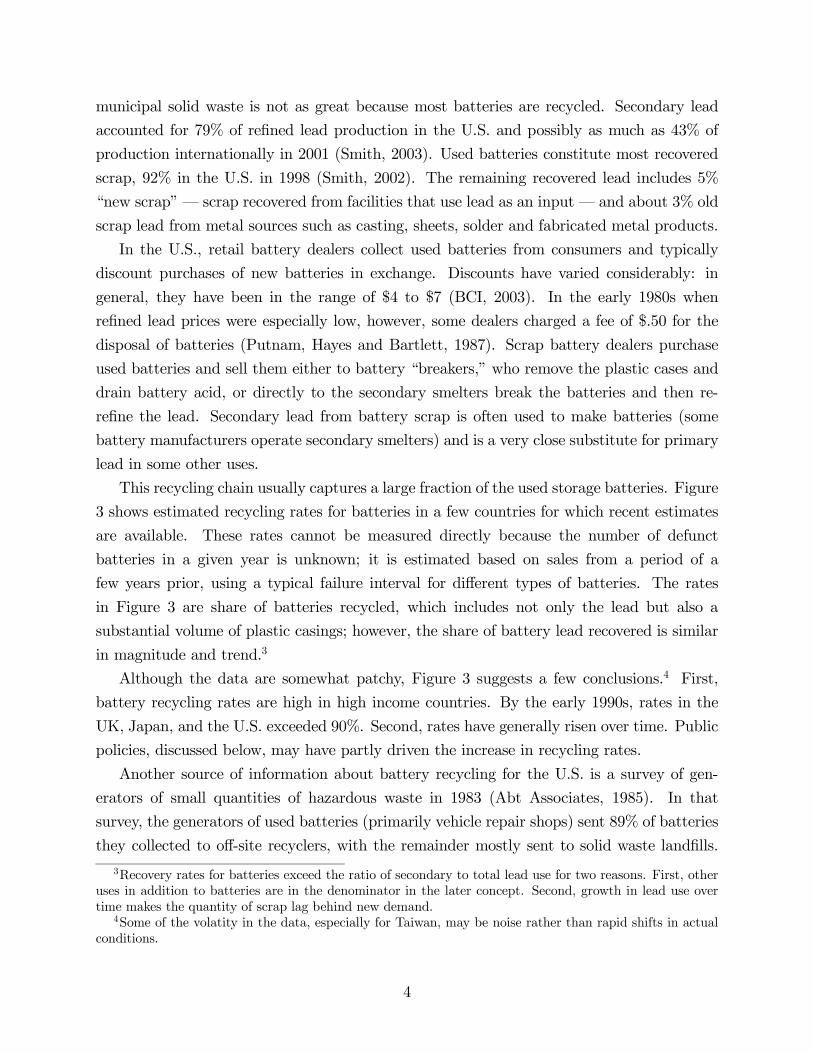
municipal solid waste is not as great because most batteries are recycled. Secondary lead
accounted for 79% of reÞned lead production in the U.S. and possibly as much as 43% of
production internationally in 2001 (Smith, 2003). Used batteries constitute most recovered
scrap, 92% in the U.S. in 1998 (Smith, 2002). The remaining recovered lead includes 5%
�new scrap� � scrap recovered from facilities that use lead as an input � and about 3% old
scrap lead from metal sources such as casting, sheets, solder and fabricated metal products.
In the U.S., retail battery dealers collect used batteries from consumers and typically
discount purchases of new batteries in exchange. Discounts have varied considerably: in
general, they have been in the range of $4 to $7 (BCI, 2003). In the early 1980s when
reÞned lead prices were especially low, however, some dealers charged a fee of $.50 for the
disposal of batteries (Putnam, Hayes and Bartlett, 1987). Scrap battery dealers purchase
used batteries and sell them either to battery �breakers,� who remove the plastic cases and
drain battery acid, or directly to the secondary smelters break the batteries and then re-
reÞne the lead. Secondary lead from battery scrap is often used to make batteries (some
battery manufacturers operate secondary smelters) and is a very close substitute for primary
lead in some other uses.
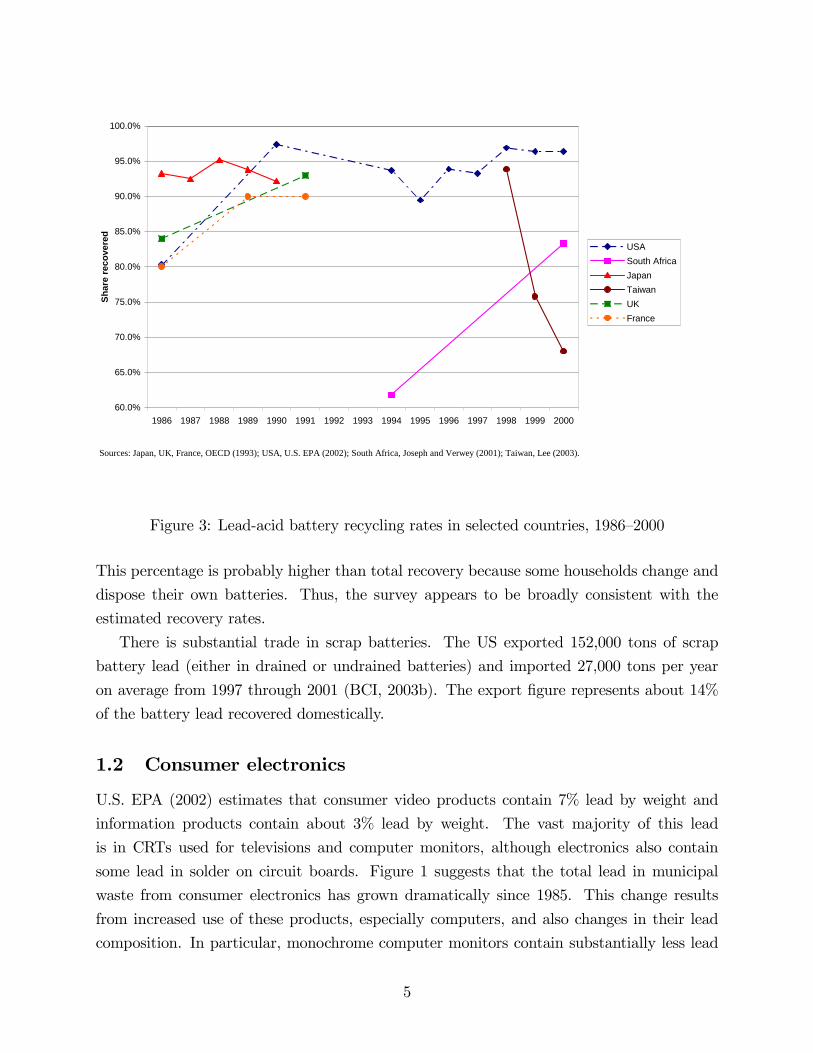
This recycling chain usually captures a large fraction of the used storage batteries. Figure
3 shows estimated recycling rates for batteries in a few countries for which recent estimates
are available. These rates cannot be measured directly because the number of defunct
batteries in a given year is unknown; it is estimated based on sales from a period of a
few years prior, using a typical failure interval for different types of batteries. The rates
in Figure 3 are share of batteries recycled, which includes not only the lead but also a
substantial volume of plastic casings; however, the share of battery lead recovered is similar
in magnitude and trend.3
Although the data are somewhat patchy, Figure 3 suggests a few conclusions.4 First,
battery recycling rates are high in high income countries. By the early 1990s, rates in the
UK, Japan, and the U.S. exceeded 90%. Second, rates have generally risen over time. Public
policies, discussed below, may have partly driven the increase in recycling rates.
Another source of information about battery recycling for the U.S. is a survey of gen-
erators of small quantities of hazardous waste in 1983 (Abt Associates, 1985). In that
survey, the generators of used batteries (primarily vehicle repair shops) sent 89% of batteries
they collected to off-site recyclers, with the remainder mostly sent to solid waste landÞlls.
3Recovery rates for batteries exceed the ratio of secondary to total lead use for two reasons. First, otheruses in addition to batteries are in the denominator in the later concept. Second, growth in lead use overtime makes the quantity of scrap lag behind new demand.
4Some of the volatity in the data, especially for Taiwan, may be noise rather than rapid shifts in actualconditions.
Sources: Japan, UK, France, OECD (1993); USA, U.S. EPA (2002); South Africa, Joseph and Verwey (2001); Taiwan, Lee (2003).
Figure 3: Lead-acid battery recycling rates in selected countries, 1986�2000
This percentage is probably higher than total recovery because some households change and
dispose their own batteries. Thus, the survey appears to be broadly consistent with the
estimated recovery rates.
There is substantial trade in scrap batteries. The US exported 152,000 tons of scrap
battery lead (either in drained or undrained batteries) and imported 27,000 tons per year
on average from 1997 through 2001 (BCI, 2003b). The export Þgure represents about 14%
of the battery lead recovered domestically.
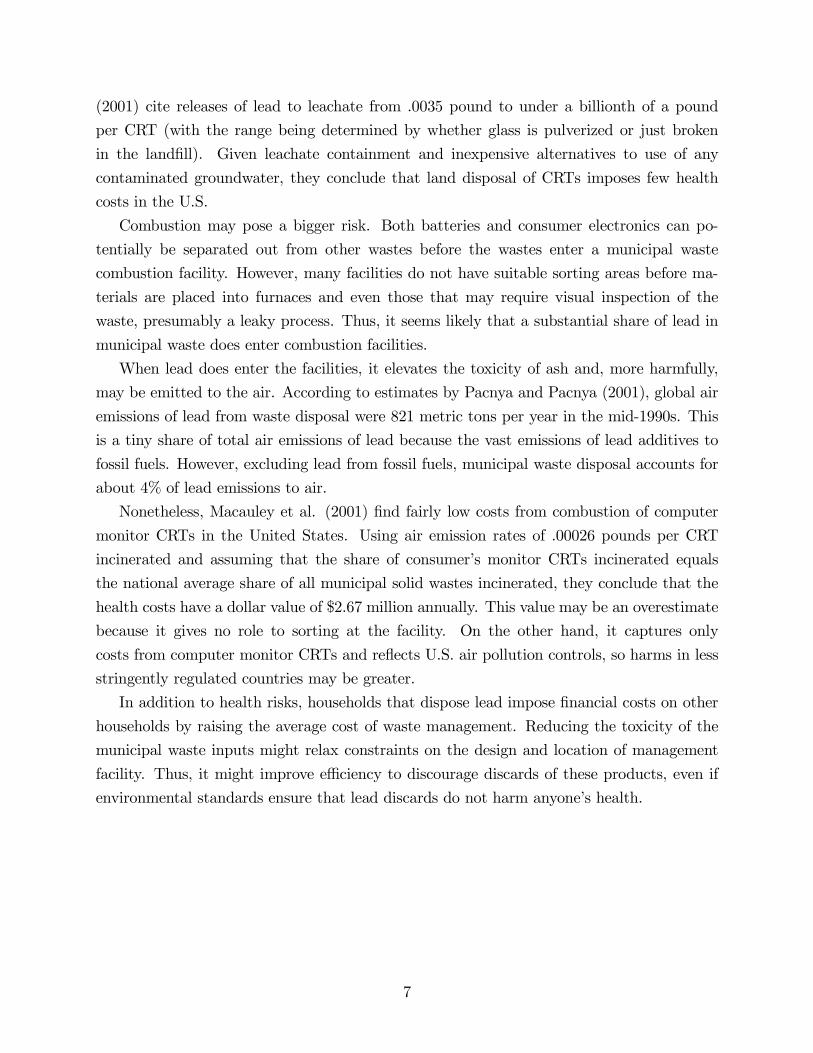
1.2 Consumer electronics
U.S. EPA (2002) estimates that consumer video products contain 7% lead by weight and
information products contain about 3% lead by weight. The vast majority of this lead
is in CRTs used for televisions and computer monitors, although electronics also contain
some lead in solder on circuit boards. Figure 1 suggests that the total lead in municipal
waste from consumer electronics has grown dramatically since 1985. This change results
from increased use of these products, especially computers, and also changes in their lead
composition. In particular, monochrome computer monitors contain substantially less lead
5
than color monitors (Macauley et al., 2001).
In contrast to lead-acid batteries whose role and design are fairly stable, this technology
is in ßux, so historical data provide less of a guide for public policy. A few technological
changes may be especially important in the immediate future. First, ßat panel display
monitors and televisions do not have the lead content of CRTs. Flat panel displays are still
considerably more expensive than traditional technologies, but if their sales rise, current lead
disposal in monitors may turn out to be a temporary spike. On the other hand, the advent
of high deÞnition television may cause widespread replacement of older televisions and, at
least temporarily, shorten the life-span of these products.
The recycling chain for electronics is more complicated than for batteries because of a
range of possible end-of-life fates. Used electronics may be immediately reused (as with
some charitable donations), refurbished and resold, demanufactured for spare parts, or sent
to facilities that recover raw materials, or experience some combination of these fates. The
National Safety Council (NSC, 1999) provides the best data on recycling of electronics in
the United States. The report Þnds a substantial discrepancy between the number of CRTs
reported processed by recyclers and the number reported received by glass recovery facilities
and secondary smelters.5 Despite this discrepancy, it is clear that recycling rates are low.
The NSC report concludes that 1.5 million computer monitor CRTs were recovered in 1998,
compared with 15.8 million that became obsolete, for a recovery rate of under 10%. The
reason for this low recovery is the high cost of recycling: the report indicates that smelters
charge $.10 per pound to accept intact CRTs and $.07 per pound for crushed CRTs (about
$2 to $3 per unit), distinguishing them from used batteries which are a valuable commodity.
1.3 Consequences of lead in municipal solid waste
The environmental harms from lead in municipal solid waste depend on whether waste is
sent to a landÞll or a combustion facility, such as an incinerator or waste-to-energy facility.
In a landÞll, the concern is that battery cases break and CRT glass becomes pulverized, so
that liquids moving through the landÞll can become contaminated. Contaminated leachate
may reach groundwater when leachate containment systems fail or in places where wastes
are landÞlled without such safeguards.
The extent of the danger from landÞlling lead is not well documented. Past history does
suggest some risk. Of the 158 municipal landÞlls on the U.S. priority list for contaminated
sites, 22% have released lead (ATSDR, 1988). However, these landÞlls predate modern
leachate containment and monitoring and the decline in lead discards. Macauley et al.
5The NSC report hypothesizes the discrepancy arises because Þrms fail to report all the used CRTs theyexport (or sell to brokers for export).
6
(2001) cite releases of lead to leachate from .0035 pound to under a billionth of a pound
per CRT (with the range being determined by whether glass is pulverized or just broken
in the landÞll). Given leachate containment and inexpensive alternatives to use of any
contaminated groundwater, they conclude that land disposal of CRTs imposes few health
costs in the U.S.
Combustion may pose a bigger risk. Both batteries and consumer electronics can po-
tentially be separated out from other wastes before the wastes enter a municipal waste
combustion facility. However, many facilities do not have suitable sorting areas before ma-
terials are placed into furnaces and even those that may require visual inspection of the
waste, presumably a leaky process. Thus, it seems likely that a substantial share of lead in
municipal waste does enter combustion facilities.
When lead does enter the facilities, it elevates the toxicity of ash and, more harmfully,
may be emitted to the air. According to estimates by Pacnya and Pacnya (2001), global air
emissions of lead from waste disposal were 821 metric tons per year in the mid-1990s. This
is a tiny share of total air emissions of lead because the vast emissions of lead additives to
fossil fuels. However, excluding lead from fossil fuels, municipal waste disposal accounts for
about 4% of lead emissions to air.
Nonetheless, Macauley et al. (2001) Þnd fairly low costs from combustion of computer
monitor CRTs in the United States. Using air emission rates of .00026 pounds per CRT
incinerated and assuming that the share of consumer�s monitor CRTs incinerated equals
the national average share of all municipal solid wastes incinerated, they conclude that the
health costs have a dollar value of $2.67 million annually. This value may be an overestimate
because it gives no role to sorting at the facility. On the other hand, it captures only
costs from computer monitor CRTs and reßects U.S. air pollution controls, so harms in less
stringently regulated countries may be greater.
In addition to health risks, households that dispose lead impose Þnancial costs on other
households by raising the average cost of waste management. Reducing the toxicity of the
municipal waste inputs might relax constraints on the design and location of management
facility. Thus, it might improve efficiency to discourage discards of these products, even if
environmental standards ensure that lead discards do not harm anyone�s health.
7
2 Analysis of public policies
In response to these costs and risks, several public policies have been proposed and imple-
mented to reduce lead disposal.6 Two general approaches can be taken, one more direct than
the other.
2.1 Direct approaches
Direct policies place restrictions on lead disposal. The most common direct response is a
ban. In the U.S., 42 states have banned lead acid-battery disposal by households (BCI,
2003). One state, Massachusetts, banned disposal of CRTs in 2000. Similarly, large business
users of batteries and CRTs may fall under hazardous waste regulations, which require that
they dispose the products in special hazardous waste landÞlls.
Another direct approach has the government charge fees for disposal of lead-containing
products that reßect its environmental costs. Unlike bans, this price-based policy would
allow some battery disposal to continue if the cost of alternatives is higher than the fee.
Such fees do not appear to have seen widespread use.
The difficulty with these direct approaches is high costs they may impose with imperfect
enforcement. If users dump wastes surreptitiously because the policy precludes legal disposal
and they wish to avoid the costs of recycling, the environmental implications of a ban may be
far worse than the harm it seeks to remedy. There are no estimates of how much dumping
occurs in response to current restrictions on auto batteries. However, I studied reported
incidents of dumping of used oil � another waste largely handled by auto repair shops � in
the United States from 1987 though 1994 (Sigman, 1998). States that banned disposal of used
oil experienced a 28% increase in the number of dumping incidents, suggests a substantial
adverse effect of disposal bans.
2.2 Indirect approaches
More indirect policy approaches may reduce disposal without these adverse consequences.
These approaches tend to discourage use of the lead in products and promote recycling. Al-
though there are a large number of possible policies, I will consider four incentive approaches
in particular: (i) deposit-refunds; (ii) taxes on lead; (iii) subsidies for recycled lead and (iv)
recycled content standards. For clarity, this section ignores nonrecyclable uses of lead; the
implications of these uses are discussed later.
6For economic comparisons of alternative waste management policies, see Dinan (1993), Fullerton andKinnaman (1995), Palmer and Walls (1997) and Porter (2002).
8
Deposit-refund. Deposit-refunds are second to disposal bans as the most common type
of public policy in place to curb lead disposal. Nine states place deposit-refunds on vehicle
batteries, at a rate of $5 or $10 per battery (BCI, 2003).7 Several countries, including
Mexico, Denmark, and South Africa, also have deposit-refunds on car or lead-acid batteries
(OECD/EEA, 2003; Johnson and Verwey, 2001).
The deposit-refund requires a fee for the initial use of the lead that is rebated when the
lead is recycled (Bohm, 1981). It raises the cost of lead to consumers and also the value
of used batteries. Thus, it provides incentives for both the reduction of lead use and for
recycling.8
A deposit-refund may be imposed at different levels. The most common approach �
placing the deposit and refund on the consumer � may help make the public aware of the
government�s interest in battery recycling, but has signiÞcant drawbacks. A better deposit-
refund would be imposed at the producer level, with a charge for lead use in production and
subsidy for recovered lead.9 Assuming well-functioning markets, the deposit would be passed
forward to consumers in the form of higher prices for goods containing lead. In addition,
because secondary lead producers receive a subsidy, they would provide higher rewards for
(or at least greater ease in) the return of scrap products.
This producer-based deposit-refund has a number of beneÞts. First, it is likely to lower
the administrative costs of the deposit-refund because the government does not need to assure
that all retail transactions have the deposit and refund properly administered. Second, it
provides greater incentives to assure that lead scrap collected from consumers is recovered
because the refund is not payable otherwise. A consumer-level deposit-refund may result
only in the collection of batteries and their subsequent disposal by retail stores or collection
centers � with some beneÞt in perhaps allowing them to be disposed as hazardous waste
rather than in general municipal waste � but without the full effect of reducing lead disposal.
Taxes on lead. An alternative policy is to tax lead. One approach applies the tax on to
lead products. By raising the cost of lead, such a tax may discourage its use, but would
not have a direct effect on recycling. Although in principle such a tax could apply to all
7The states have mandatory deposit-refunds are: Arizona, $5 per battery; Arkansas, $10 ; Connecticut$5; Idaho, $5; Maine, $10; Minnesota, $5; New York, $5; South Carolina, $5; and Washington, $5. Wisconsinand Rhode Island have voluntary charges. All these policies were implemented by 1989 and 1991.
8Not only does a deposit-refund not create incentives for illegal disposal, it may even encourage thecollection of illegal dumped and stored lead products because consumer can collect refunds by returningproducts. Collection of the illegally dumped products creates substantial environmental beneÞts; collectionof stored products, especially old computers, probably does not and may add to the cost of program byrequiring handling of products that would not face environmental release.
9See Fullerton and Wolverton (1999) for their discussion of �two-part� instruments in environmentalpolicy, of which this producer deposit-refund is an example.
9
reÞned lead or to all products containing lead, in practice most of these taxes are restricted
to batteries. Four U.S. states and several European countries have charges on batteries,
ranging in the U.S. between $1 and $3 per battery (BCI, 2003; OECD/EEA, 2003). These
charges are typically Þxed per battery and thus do not provide incentives for use of lower lead
batteries, unlike a pure lead tax which would vary with the lead content of the product.10
Another tax approach � a virgin material tax � applies only to primary lead. The U.S.
has considered such a tax (Environment Reporter, 1991). A virgin material tax raises the
price of primary lead to its users. Because primary and secondary lead are perfect substitutes,
users will purchase recycled lead at the same price, implying that the tax will also raise the
price of recycled lead. As a result, the virgin material tax is similar to a deposit-refund in its
effect. Under both programs, recycling consumers receive a rebate. The rebate is the direct
refund with a deposit-refund; with a virgin materials tax, the tax increment is returned in
the form of higher prices for lead scrap.
Subsidy to recycled lead. An alternative program would provide a direct subsidy to
recycled lead production. This exact approach does not seem to have been used in practice.
However, there are indirect subsidies to recycled lead. For example, many U.S. states provide
investment tax credits (which offset income taxes) to Þrms that produce recycled goods (U.S.
Office of Technology Assessment, 1989). Such indirect subsidies may have similar effects to
a direct subsidy in encouraging lead recovery; however, they will also have additional effects
(not analyzed here) on the recyclers� production decisions that raise the costs of these policies
relative to direct subsidies.
The effect of a subsidy is to lower the costs of recycled lead relative to virgin lead. This
should have the effect of reducing virgin lead production. However, the price of lead to
its users declines because recycled lead has become cheaper. Thus, although the recycling
subsidy may encourage recycling, it also creates an incentive for increased consumption of
the lead.
Recycled content standard. A recycled content standard stipulates a ratio of recycled
lead to total lead used. In the United States, Congress has considered a recycled content
standard for batteries before recent increases in the recovery rate. Early versions of the EU�s
Directive on Waste Electrical and Electronic Equipment (WEEE) seem to have contained a
recycled content standard that had been dropped by the time of the Þnal version.
10Texas does distinguish high and low voltage batteries, which will reßect their lead content. Below, Idiscuss whether the difference between Þxed charges per battery and charges based on the lead content ofthe battery will make much difference empirically.
10
The government may implement the recycled content standard on a variety of scales.
One approach would require that each individual product has a given recycled lead content,
for example 80%. This policy would give a Þrm no ßexibility to choose product lines for
which recycled lead was most appropriate and would require the manufacturer to engage in
costly monitoring of the use of speciÞc shipments of lead. A more ßexible approach is to
set the requirements at the Þrm level, so a Þrm would be have to assure that its products
overall contained 80% secondary lead, but some products or batches might have higher or
lower recycled content.
The most ßexible approach applies the recycled content standard not to a Þrm but to
all users of lead. The government would set a requirement that 80% of all lead consumed
be secondary lead and leave it to Þrms to assure that this level was obtained. Firms could
meet this requirement by trading recycled content: a Þrm using a larger fraction of recycled
material than the standard can trade its surplus with Þrms using too little, so the standard
applies to the industry as a whole. If the permit market operates well, this tradable recycled
content standard accomplishes the 80% level (or whatever level is chosen) at least cost.11
It turns out this tradeable recycled content standard also has an equivalent tax-subsidy
combination. Suppose that a permit entitles its holder to use one unit of virgin lead. This
permit must be traded for enough units of recycled lead that the recycled content for the
industry conforms to standard, call it r∗. This trade-off holds if a permit can be created
by the use of an additional r∗1−r∗ units of recycled lead. Thus, for example, with the 80%
standard, a Þrm could use 1 ton of virgin lead if it found other Þrms willing to use 4 tons
of recovered lead. This arrangement means there is a cost equal to the price of a permit
(whatever that turns out to be) for using virgin lead, like a tax. There is an effective
subsidy for using secondary lead, equal to the value of the permits that are created: in this
80% content standard case, the subsidy for each unit of secondary lead would be 25% of
the price for a permit to use virgin lead. Thus, it is as though the government collected
a virgin materials tax equal to the permit price and used all that the money it collected
to give a recycling subsidy. This tax/subsidy combination is revenue-neutral, unlike the
deposit-refund, which raises revenue from the government on unrecovered lead.
The effect of a recycled content standard, whether tradeable or not, is to increase the
recycling rate. The policy is also likely to increase the cost of lead overall. However, because
all the money paid by Þrms to use primary lead is returned as a subsidy to secondary lead,
the overall effect on the price of lead to users is smaller than for a deposit-refund or virgin
materials tax. As a result, the reduction in lead use will be smaller than for these other
11For more discussion of tradeable recycled content standards, see Dinan (1993) for paper and Macauleyet al. (2001) for CRTs.
11
policies.
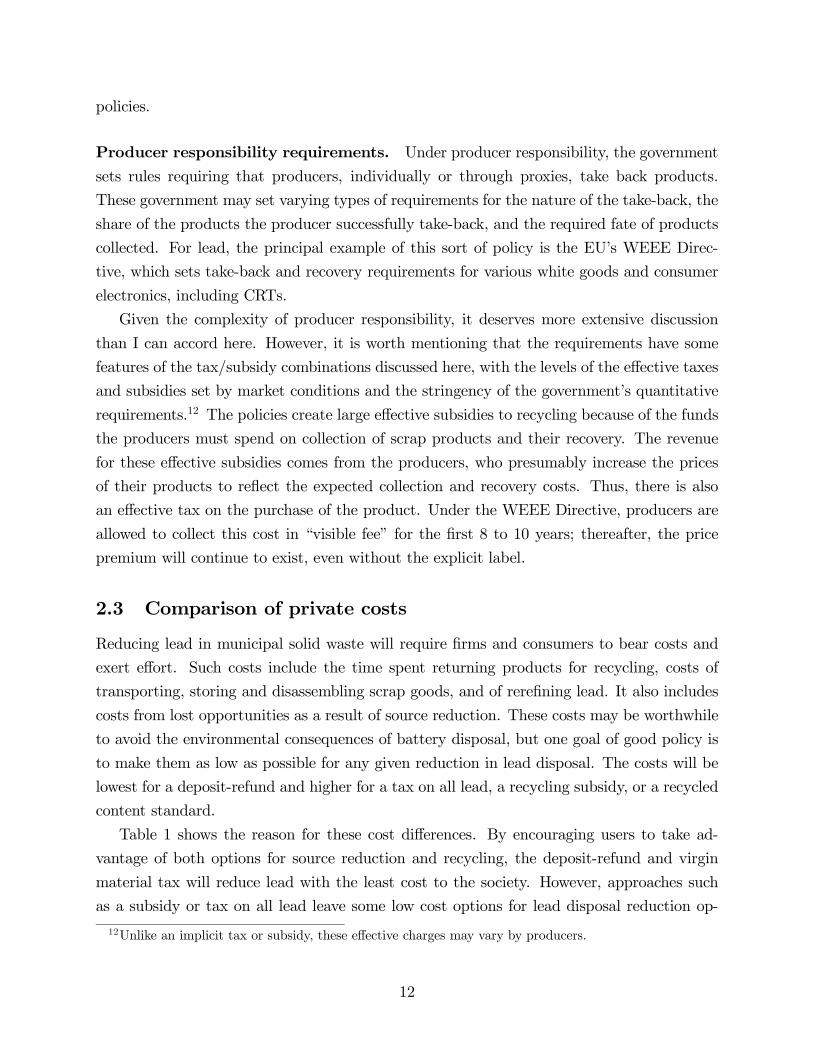
Producer responsibility requirements. Under producer responsibility, the government
sets rules requiring that producers, individually or through proxies, take back products.
These government may set varying types of requirements for the nature of the take-back, the
share of the products the producer successfully take-back, and the required fate of products
collected. For lead, the principal example of this sort of policy is the EU�s WEEE Direc-
tive, which sets take-back and recovery requirements for various white goods and consumer
electronics, including CRTs.
Given the complexity of producer responsibility, it deserves more extensive discussion
than I can accord here. However, it is worth mentioning that the requirements have some
features of the tax/subsidy combinations discussed here, with the levels of the effective taxes
and subsidies set by market conditions and the stringency of the government�s quantitative
requirements.12 The policies create large effective subsidies to recycling because of the funds
the producers must spend on collection of scrap products and their recovery. The revenue
for these effective subsidies comes from the producers, who presumably increase the prices
of their products to reßect the expected collection and recovery costs. Thus, there is also
an effective tax on the purchase of the product. Under the WEEE Directive, producers are
allowed to collect this cost in �visible fee� for the Þrst 8 to 10 years; thereafter, the price
premium will continue to exist, even without the explicit label.
2.3 Comparison of private costs
Reducing lead in municipal solid waste will require Þrms and consumers to bear costs and
exert effort. Such costs include the time spent returning products for recycling, costs of
transporting, storing and disassembling scrap goods, and of rereÞning lead. It also includes
costs from lost opportunities as a result of source reduction. These costs may be worthwhile
to avoid the environmental consequences of battery disposal, but one goal of good policy is
to make them as low as possible for any given reduction in lead disposal. The costs will be
lowest for a deposit-refund and higher for a tax on all lead, a recycling subsidy, or a recycled
content standard.
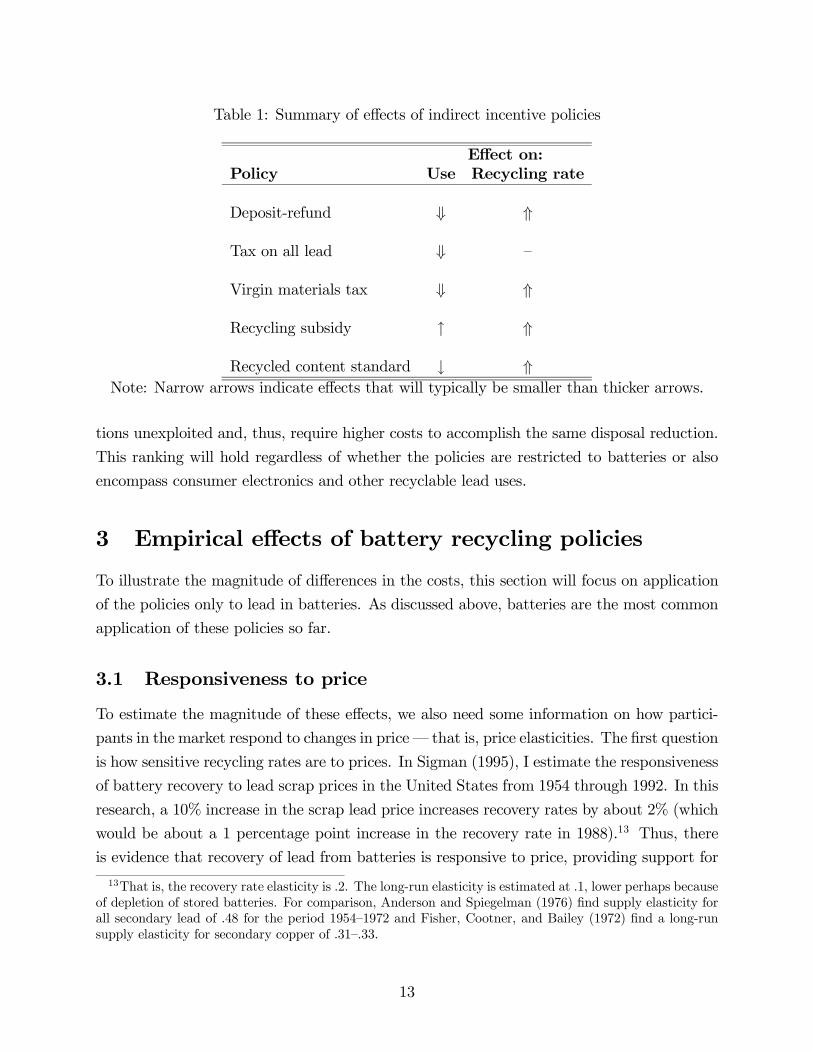
Table 1 shows the reason for these cost differences. By encouraging users to take ad-
vantage of both options for source reduction and recycling, the deposit-refund and virgin
material tax will reduce lead with the least cost to the society. However, approaches such
as a subsidy or tax on all lead leave some low cost options for lead disposal reduction op-
12Unlike an implicit tax or subsidy, these effective charges may vary by producers.
12
Table 1: Summary of effects of indirect incentive policies
Effect on:Policy Use Recycling rate
Deposit-refund ⇓ ⇑
Tax on all lead ⇓ �
Virgin materials tax ⇓ ⇑
Recycling subsidy ↑ ⇑
Recycled content standard ↓ ⇑Note: Narrow arrows indicate effects that will typically be smaller than thicker arrows.
tions unexploited and, thus, require higher costs to accomplish the same disposal reduction.
This ranking will hold regardless of whether the policies are restricted to batteries or also
encompass consumer electronics and other recyclable lead uses.
3 Empirical effects of battery recycling policies
To illustrate the magnitude of differences in the costs, this section will focus on application
of the policies only to lead in batteries. As discussed above, batteries are the most common
application of these policies so far.
3.1 Responsiveness to price
To estimate the magnitude of these effects, we also need some information on how partici-
pants in the market respond to changes in price � that is, price elasticities. The Þrst question
is how sensitive recycling rates are to prices. In Sigman (1995), I estimate the responsiveness
of battery recovery to lead scrap prices in the United States from 1954 through 1992. In this
research, a 10% increase in the scrap lead price increases recovery rates by about 2% (which
would be about a 1 percentage point increase in the recovery rate in 1988).13 Thus, there
is evidence that recovery of lead from batteries is responsive to price, providing support for
13That is, the recovery rate elasticity is .2. The long-run elasticity is estimated at .1, lower perhaps becauseof depletion of stored batteries. For comparison, Anderson and Spiegelman (1976) Þnd supply elasticity forall secondary lead of .48 for the period 1954�1972 and Fisher, Cootner, and Bailey (1972) Þnd a long-runsupply elasticity for secondary copper of .31�.33.
13
incentive-based policies as an effective approach to encourage recycling.
A second price elasticity that is important is the responsiveness of primary lead supply
to prices. In Sigman (1995), a 10% increase in reÞned lead prices increases primary lead
supply by 8% in the long run.
Finally, the calculation requires an estimate of the sensitivity of demand for lead in
batteries to price. In Sigman (1995), I did not Þnd a statistically signiÞcant elasticity of lead
in batteries to price. This insensitivity may reßect the absence of any good substitute for
lead and is consistent with the lack of attention devoted to the lead content of batteries in
engineering papers like Salkind et al. (1984). However, it also suggests that consumers do not
adjust their consumption of batteries to lead costs. One might expect more rapid replacement
of old batteries when they are cheaper. Earlier studies do estimate some sensitivity of
battery lead demand to its price. Moroney and Trapani (1981) estimate a 2% reduction in
demand for lead in batteries for a 10% increase in price and Anderson and Spiegelman (1976)
estimate 2.1% reduction in demand for all lead (not just lead in batteries) for 1949�72. The
calculations below use a 1% reduction in demand for the 10% price increase because it is
a midpoint of the studies and reßects the likelihood of at least some response in battery
demand.
Considering lead demand sensitive to price is critical to comparison of the policies. If
demand is insensitive to price, then there are no opportunities for source reduction. In this
case, the tax on lead is ineffective as a way of getting rid of lead in waste. In addition,
recycling subsidies do not have any perverse effect on lead use, thus they are not any more
costly than the other policies.
3.2 Empirical effects of the policies
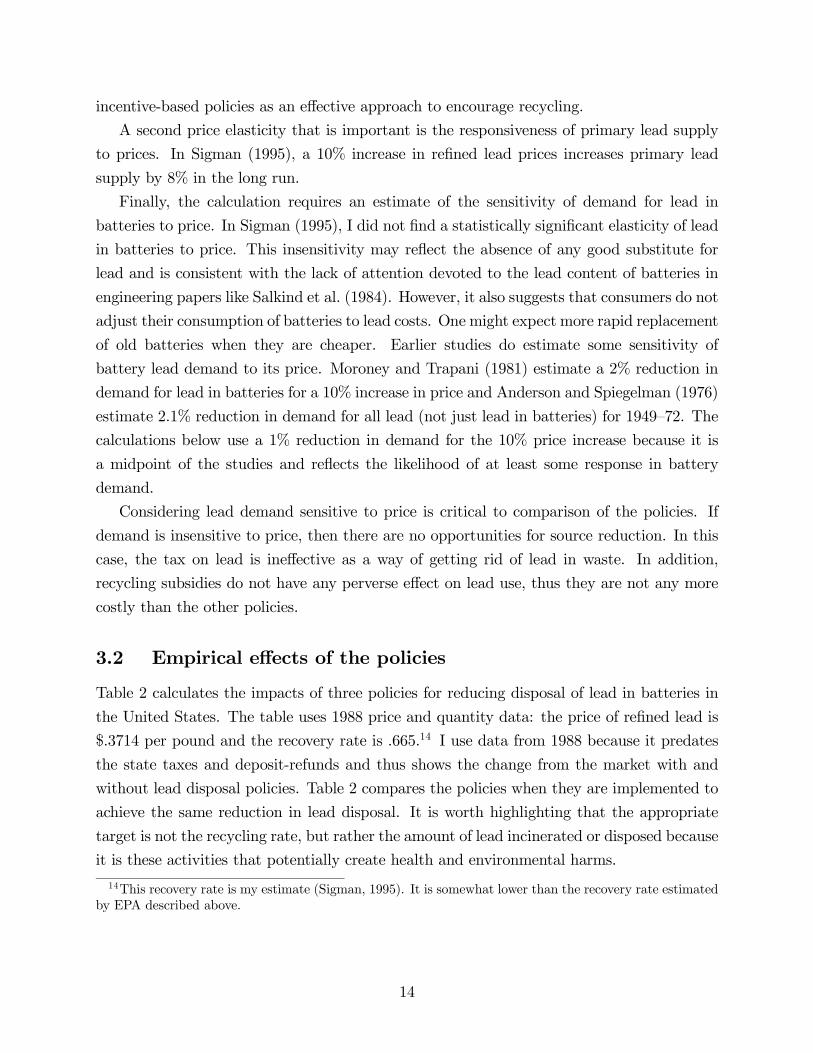
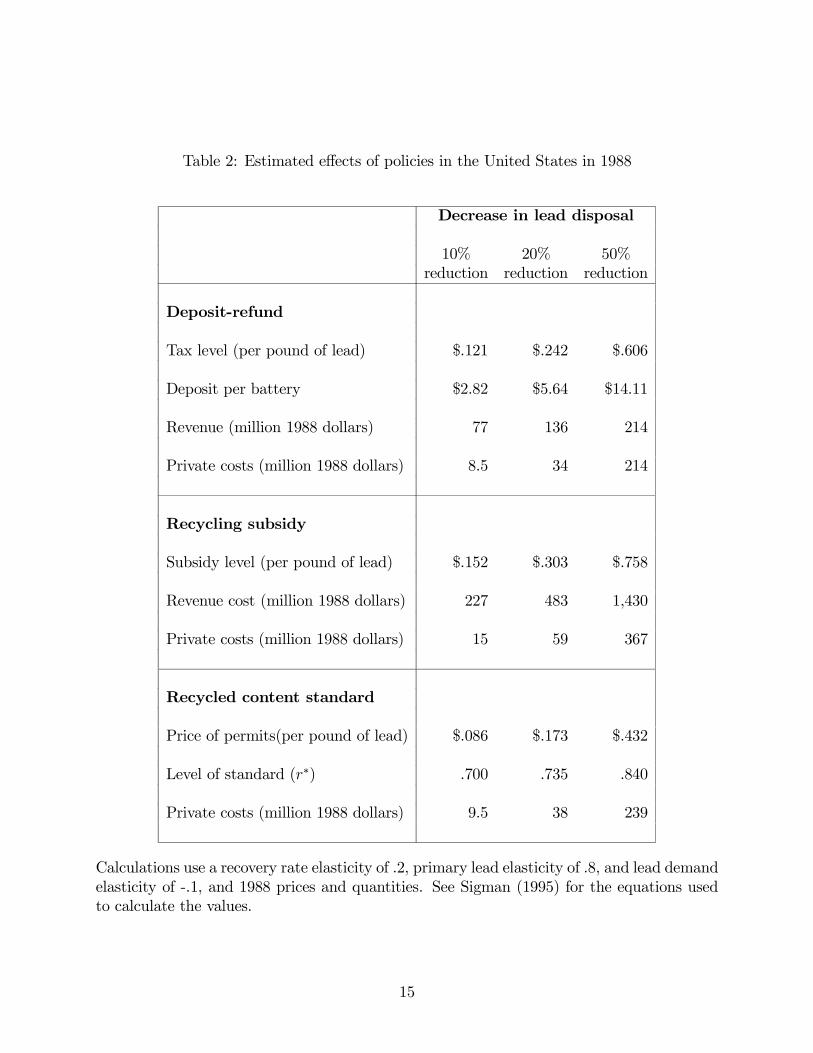
Table 2 calculates the impacts of three policies for reducing disposal of lead in batteries in
the United States. The table uses 1988 price and quantity data: the price of reÞned lead is
$.3714 per pound and the recovery rate is .665.14 I use data from 1988 because it predates
the state taxes and deposit-refunds and thus shows the change from the market with and
without lead disposal policies. Table 2 compares the policies when they are implemented to
achieve the same reduction in lead disposal. It is worth highlighting that the appropriate
target is not the recycling rate, but rather the amount of lead incinerated or disposed because
it is these activities that potentially create health and environmental harms.
14This recovery rate is my estimate (Sigman, 1995). It is somewhat lower than the recovery rate estimatedby EPA described above.
14
Table 2: Estimated effects of policies in the United States in 1988
Decrease in lead disposal
10% 20% 50%reduction reduction reduction
Deposit-refund
Tax level (per pound of lead) $.121 $.242 $.606
Deposit per battery $2.82 $5.64 $14.11
Revenue (million 1988 dollars) 77 136 214
Private costs (million 1988 dollars) 8.5 34 214
Recycling subsidy
Subsidy level (per pound of lead) $.152 $.303 $.758
Revenue cost (million 1988 dollars) 227 483 1,430
Private costs (million 1988 dollars) 15 59 367
Recycled content standard
Price of permits(per pound of lead) $.086 $.173 $.432
Level of standard (r∗) .700 .735 .840
Private costs (million 1988 dollars) 9.5 38 239
Calculations use a recovery rate elasticity of .2, primary lead elasticity of .8, and lead demandelasticity of -.1, and 1988 prices and quantities. See Sigman (1995) for the equations usedto calculate the values.
15
Deposit-refund. Table 2 indicates that the deposit-refund rates necessary to achieve mod-
erate reductions in lead disposal are consistent with those currently in use. If implemented
correctly, a $5 per battery deposit-refund could result in almost a 20% reduction in battery
lead disposal. The results suggest that the private costs of a deposit-refund to reduce lead
disposal by 20% would be about $34 million.
However, this Þgure may underestimate the true costs of accomplishing disposal reduc-
tions through these policies because of implementation issues that are omitted from the
model. First, the deposit-refunds used in the U.S. do not vary with the lead content of the
battery, unlike the deposit-refund shown here. A Þxed deposit-refund per battery provides
weaker incentives for source reduction than a variable one because the policy does not en-
courage consumers to choose lower lead batteries. Thus, the costs of achieving the reduction
may be greater. However, the discussion of price responsiveness above suggests that reducing
the lead content of batteries does not have much potential as an avenue of source reduction,
so lack of these incentives may not be that important.
Second, Table 2 fails to consider the administrative and compliance costs of the policies.
These costs may be substantial for a deposit-refund if it is administered at the retail level
because large numbers of Þrms must comply. However, administering the program at the
level of battery producers could make these costs much lower.
Recycling subsidy. Table 2 suggests that a subsidy has signiÞcant disadvantages relative
to a deposit-refund. For a reduction in disposal of 20%, a subsidy costs almost twice as
much as the least cost approach, $59 million compared to $34 million. In practical terms,
however, the revenue required to support a subsidy may present a more formidable obstacle
than this difference in private costs. While the deposit-refund would collect $136 million
in revenue for a 20% reduction, the subsidy would require expenditures of $483 million.
Subsidy expenditures are high even for small reductions because of the large amount of lead
recovered initially.
On the other hand, the administrative costs of this program are not likely to be substan-
tial. A limited number of Þrms reprocess battery lead or purchase this lead. In addition,
reported quantities of recycled lead are easily veriÞed, making this subsidy less vulnerable
to sham operations than other pollution abatement subsidies.
Recycled content standard. In Table 2, the recycled content standard costs only slightly
more than a tax or deposit program. For a 20% reduction, it costs $38 million compared
to $34 million for the best approach. The recycled content standard implies only a small
subsidy to recycled lead (because initial recovery rates are high) and therefore does not differ
16
dramatically from a deposit-refund.
However, Table 2 shows the best possible case for the recycled content standard by
allowing trading of permits.15 Costs without trading will probably be higher because Þrms
have different opportunities for substitution of recycled lead for virgin lead.
Even if the government does allow trading to meet a recycled content standard, the
costs may exceed the estimates in Table 2. Substantial transactions costs appear to have
hampered other environmental permit markets. However, recycled content permits are likely
to be subject to fewer transactions obstacles than other permit markets. Firms are already
familiar with their patterns of reliance on recycled and virgin lead, unlike pollutants to which
permits have been applied previously. In addition, there should be little need for intrusive
regulatory oversight of the market given these ease with regulators should be able to monitor
lead usage. Thus, transactions cost may not greatly elevate the costs of a tradeable recycled
content standard.
3.3 Results with other uses of lead
Although the Þgures above are designed to address policies restricted to batteries, this section
makes some qualitative observations about how the effects and comparison of the policies
would change if the policies were applied to additional uses of lead. First, I consider extending
the policies to other recyclable uses of lead, such as consumer electronics and wheel weights
in motor vehicles. The overall ranking of the policies will not change with this extension, but
the relative costs of the policies may change. Second, I discuss how the ranking may change
if policies apply to nonrecyclable uses of lead, such as gasoline additives or ammunition.
Additional recyclable uses of lead. In comparing the policies, the principal effect of
adding other recyclable uses of the lead will be to change the price elasticities of lead demand
and recycling. Demand for other uses of lead, such as consumer electronics, is likely to be
more sensitive to price because of more available substitutes. For example, higher lead costs
may raise the price of CRTs and encourage the substitution of ßat panel displays. Consumers
may also choose to extend the life of televisions and computer monitors, unlike batteries for
which replacement is usually forced by the demise of the old battery. A somewhat dated
estimate supports the notion of greater price sensitivity in other uses: Wise (1979) estimates
an reduction in demand of 3% for a 10% increase in price for lead uses other than batteries,
15The inefficiency of the tradeable permit system may come as a surprise. The result arises because ofthe speciÞc permit system analyzed, namely one based on recycled content standards. It would be possibleto design a tradeable permit system more comparable to the deposit-refund. Such a system would requirepermits for lead disposal rather than virgin lead use. It would, however, face the enforcement problems ofother direct approaches.
17
ammunition, and gasoline additives in the United States. If demand is more sensitive to
price, the relative costs of policies that do not take advantage of demand reductions will rise:
the recycling subsidy and the recycled content standard will be more costly relative to the
other policies.
In addition, there may be fewer recycling opportunities for sources of lead other than
batteries. In particular, it seems that lead prices will have to rise dramatically for recycling
of CRTs to become economical. The lack of recycling options also favors policies, such as
the deposit-refund and lead taxes, that can take advantage of source reduction relative to
recycling subsidies and recycled content standards.
Another issue that arises in considering other uses of lead is the loss from using a Þxed
deposit-refund relative to a deposit-refund that varies with the lead content of the product.
For batteries alone, this loss might not be very great because changes in product design will
account for little source reduction. However, with other products, product design changes
may be important ways to reduce lead. A deposit-refund that is invariant with the lead
content of batteries provides no incentive for this substitution and thus will be much sub-
stantially more costly for any reduction in disposal than deposit-refund that varies with lead
content.
Nonrecyclable uses of lead. Expanding the policies to encompass nonrecyclable uses of
lead complicates the policy comparison. With these other uses, we can no longer justify a
simple cost-effectiveness analysis, which compares the policies for a given reduction in lead
in municipal solid waste. To compare the broader policies, we also need an assessment of
other environmental exposures to lead.
For example, a deposit-refund for which the deposit was paid on all uses, but the refund
for recycling only, would not only decrease disposal of lead but also other releases to the
environment. This breadth could be an advantage of the policy if it reduced the air pollution
from leaded fuel or wildlife exposures to lead ammunition. However, it could also be a
disadvantage if it unnecessarily discouraged use of lead in applications, such as construction
or X-ray shielding, for which there was little risk of environmental exposure. A broad policy
could also be excessive if non�municipal solid waste releases of lead are already adequately
addressed by other environmental policies, such as policies for air pollution. For example,
a recycling subsidy could dominate an excessively broad deposit-refund because the subsidy
will affect only lead in municipal solid waste. If so, restricting the deposit-refund only to
recyclable uses of lead would reestablish its superiority.
Non-recyclable uses of lead also affect the best design of a recycled content standard.
Recycled content standards may apply only to the lead content of recyclables or to all uses
18
of lead. A standard solely for recyclable products also may be ineffective, however. It may
shift recycled lead used by other industries into manufacture of batteries and other recy-
clable products. Such a standard may not reduce disposal at all. To accomplish reductions,
therefore, it may be necessary to apply the recycled content standard to all lead.
4 Desirability of reducing lead in municipal solid waste
Finally, we should consider the overall desirability of policies to reduce lead in municipal solid
waste. Two previous studies raise questions about whether even the most cost-effective poli-
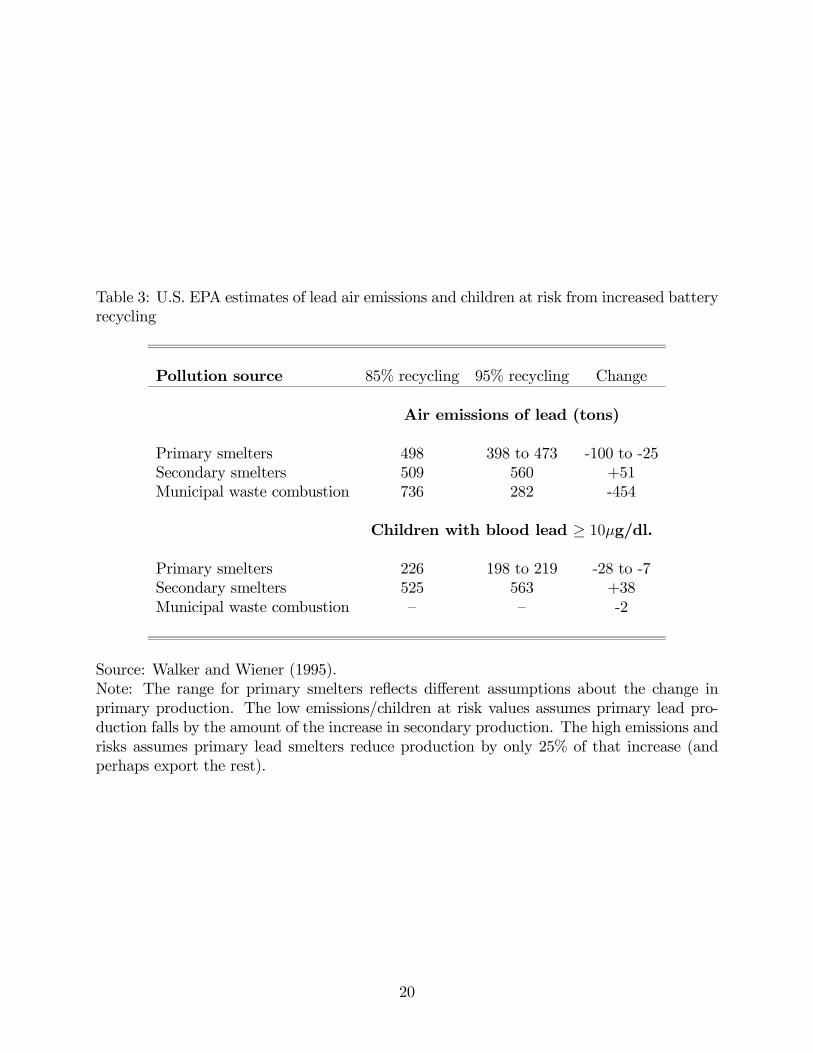
cies would have a beneÞcial effect. First, Walker and Wiener (1995) summarize a 1991 U.S.
EPA assessment of an increase in the recycling of lead-acid batteries.16 As reported in Table
3, EPA found that increasing the battery recycling rate from 85 to 95 percent dramatically
reduced air emissions of lead because a great reduction in lead emitted from municipal waste
combustion facilities and a smaller reduction in emissions at primary smelters.17 Offsetting
these gains is an increase in emissions from secondary smelters.18
When the EPA examined the number of children predicted to have high blood lead,
however, the gains from increased recycling look less clear. The reduction in lead emissions
from combustion has little effect on the number of children with high blood lead for two
reasons. First, the populations near the facilities had low levels of blood lead, making the
number of children to cross the 10 µg/dl threshold small. Second, although many tons of air
pollution are avoided, the reduction is spread over 186 facilities, so the change in exposure
at any single location is small.
In addition, the trade-off between primary and secondary smelting does not appear favor-
able. Secondary smelting puts more children over the threshold because secondary smelters
are located near people (who supply their raw materials), whereas primary smelters tend to
be located near mines and are thus more remote. As a result, increased recycling may have
negative overall implications for children�s health.19
16The documents are U.S. EPA �Lead Acid Battery Recycling Risk Assessment� and �Cost Analysis ofOptions to Enhance Lead Acid Battery Recycling,� both drafts from 1991, but my discussion is based onWalker and Wiener�s summary.17It also considered reduced exposure to contaminated groundwater from recycling more batteries. How-
ever, the EPA concluded that this pathway did not pose a signiÞcant health risk even when batteries aresent to older landÞlls.18These emissions occur despite existing U.S. air pollution regulations and might be worse in countries
with less stringent regulations. Engineering estimates suggest that all environmental regulations in effectin 1988 added $0.068 per pound (18% of its price) to the cost of secondary lead (U.S. Office of TechnologyAssessment, 1989).19The Þgures shown here presume that the increased secondary smelting occurs in the U.S. The EPA also
presented a variant in which this secondary smelting occurs abroad, in which case the Þgures look morefavorable for reducing lead, but exposures of children outside the U.S. are not counted.
19
Table 3: U.S. EPA estimates of lead air emissions and children at risk from increased batteryrecycling
Primary smelters 498 398 to 473 -100 to -25Secondary smelters 509 560 +51Municipal waste combustion 736 282 -454
Children with blood lead ≥ 10µg/dl.
Primary smelters 226 198 to 219 -28 to -7Secondary smelters 525 563 +38Municipal waste combustion � � -2
Source: Walker and Wiener (1995).Note: The range for primary smelters reßects different assumptions about the change inprimary production. The low emissions/children at risk values assumes primary lead pro-duction falls by the amount of the increase in secondary production. The high emissions andrisks assumes primary lead smelters reduce production by only 25% of that increase (andperhaps export the rest).
20
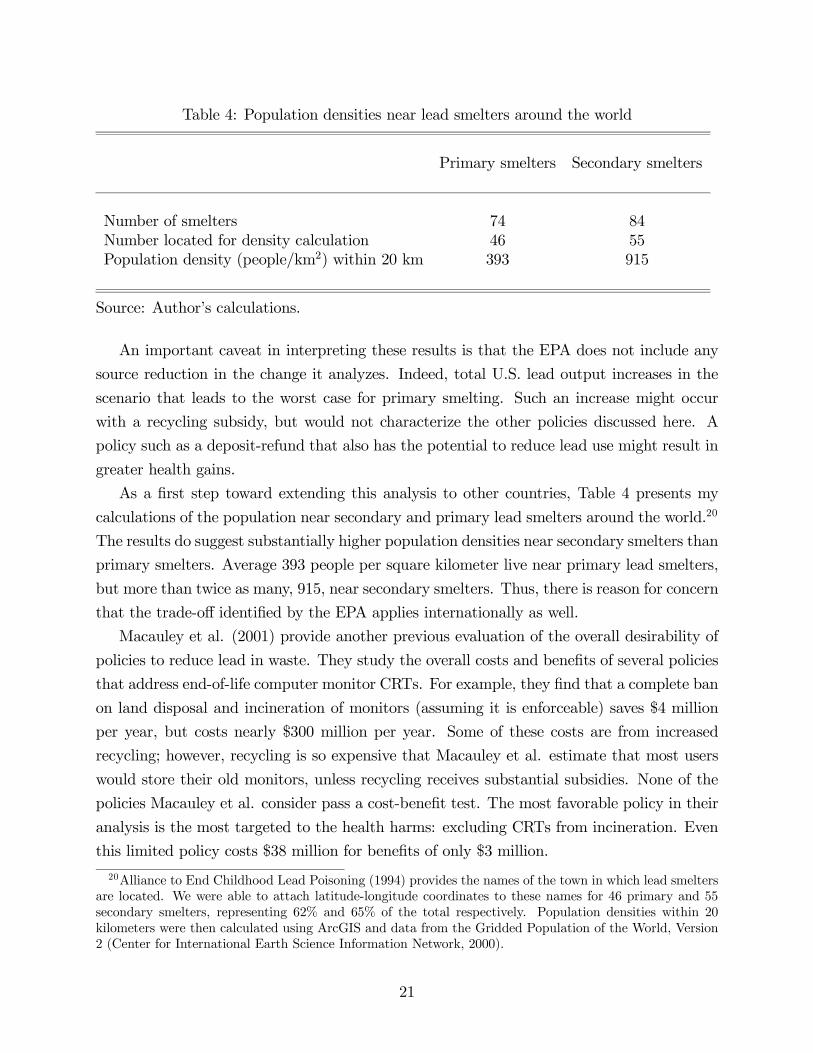
Table 4: Population densities near lead smelters around the world
Primary smelters Secondary smelters
Number of smelters 74 84Number located for density calculation 46 55Population density (people/km2) within 20 km 393 915
Source: Author�s calculations.
An important caveat in interpreting these results is that the EPA does not include any
source reduction in the change it analyzes. Indeed, total U.S. lead output increases in the
scenario that leads to the worst case for primary smelting. Such an increase might occur
with a recycling subsidy, but would not characterize the other policies discussed here. A
policy such as a deposit-refund that also has the potential to reduce lead use might result in
greater health gains.
As a Þrst step toward extending this analysis to other countries, Table 4 presents my
calculations of the population near secondary and primary lead smelters around the world.20
The results do suggest substantially higher population densities near secondary smelters than
primary smelters. Average 393 people per square kilometer live near primary lead smelters,
but more than twice as many, 915, near secondary smelters. Thus, there is reason for concern
that the trade-off identiÞed by the EPA applies internationally as well.
Macauley et al. (2001) provide another previous evaluation of the overall desirability of
policies to reduce lead in waste. They study the overall costs and beneÞts of several policies
that address end-of-life computer monitor CRTs. For example, they Þnd that a complete ban
on land disposal and incineration of monitors (assuming it is enforceable) saves $4 million
per year, but costs nearly $300 million per year. Some of these costs are from increased
recycling; however, recycling is so expensive that Macauley et al. estimate that most users
would store their old monitors, unless recycling receives substantial subsidies. None of the
policies Macauley et al. consider pass a cost-beneÞt test. The most favorable policy in their
analysis is the most targeted to the health harms: excluding CRTs from incineration. Even
this limited policy costs $38 million for beneÞts of only $3 million.
20Alliance to End Childhood Lead Poisoning (1994) provides the names of the town in which lead smeltersare located. We were able to attach latitude-longitude coordinates to these names for 46 primary and 55secondary smelters, representing 62% and 65% of the total respectively. Population densities within 20kilometers were then calculated using ArcGIS and data from the Gridded Population of the World, Version2 (Center for International Earth Science Information Network, 2000).
21
5 Conclusion
Governments wishing to reduce lead in waste have a variety of policy options. This paper
considers policies that can reduce waste disposal when direct restrictions are too difficult
to enforce. Successful policies address disposal at two levels, encouraging recovery of lead
and discouraging its consumption. The deposit-refund and virgin material tax are low cost
policies because they create both types of incentives. In contrast, a subsidy for recycling
is more costly because it decreases the price of lead to users and thus encourages lead
consumption.
The policy analysis applied to programs aimed at the recovery of lead from batteries and
used supply and demand parameters estimated from the U.S. lead market. This analysis
suggests two conclusions. First, price-based recycling policies can effectively increase lead
recycling. Second, this analysis reveals substantial empirical differences among the policies
in the costs of accomplishing the same reduction of lead in waste. A recycling subsidy
entails nearly twice the private costs of a deposit-refund. The general ranking presented also
applies to policies aimed at other sources of lead in municipal solid waste, including consumer
electronics. Indeed, expanding the sources covered probably increases the importance of
source reduction and the cost differences among the policies.
Despite the effectiveness of price-based lead reduction, earlier studies surveyed here sug-
gest the need for caution before deciding to pursue policies that reduce lead in solid waste.
For countries with already high recovery rates of lead from batteries, such as the U.S., it
may be that the environmental gains of reduced lead disposal are not high enough to merit
the cost and environmental consequences.
22
References
[1] Abt Associates. National Small Quantity Hazardous Waste Generator Survey. Wash-
ington, DC: U.S. Environmental Protection Agency, 1985.
[2] Alliance to End Childhood Lead Poisoning and Environmental Defense Fund. The
Global Dimensions of Lead Poisoing: An Initial Assessment. Washington DC: The
Alliance, 1994.
[3] Anderson, Robert C. and Richard D. Spiegelman. The Impact of the Federal Tax Code
on Resource Recovery. Washington, DC: U.S. Environmental Protection Agency, 1976.
[4] Banks, E.C., L.E. Ferretti, and D.W. Shucar.�Effects of Low Level Lead Exposure
on Cognitive Function in Children: A Review of Behavioral, Neuropsychological, and
Biological Evidence," Neurotoxicology, Vol 18 (1997), p. 237-281.
[5] Battery Council International. http://www.batterycouncil.org (Last viewed on Sep-
tember 4, 2003).
[6] Battery Council International. National Recycling Rate Study. Chicago, IL: Battery
Council International, 2003.
[7] Bingham, Tayler H., Curtis E. Youngblood, and Philip C. Cooley. �Conditionally
predictive supply elasiticity estimates: secondary materials obtained from municipal
residuals.� Journal of Environmental Economics and Management, Vol. 10 (1983), pp.
166�179.
[8] Bohm, Peter. Deposit-Refund Systems. Baltimore, MD: Resources for the Future, 1981.
[9] Center for International Earth Science Information Network (CIESIN) Gridded Popu-
lation of the World (GPW), Version 2. Palisades, NY: CIESIN, Columbia University.
2000.
[10] Dinan, Terry M. �Economic efficiency effects of alternative policies for reducing waste
disposal.� Journal of Environmental Economics and Management, Vol. 25 (1993), pp.
242�256.
[11] Dinan, Terry M. �Implementation issues for marketable permits: A case study of
newsprint.� Journal of Regulatory Economics, Vol. 4 (1992), pp. 71�87.
[12] Environment Reporter �Lead-acid battery negotiations on hold as EPA gathers data
on cost of virgin lead fee.� Vol. 22, May 11, 1991, p. 115.
23
[13] Fisher, F.M., Paul H. Cootner with Martin Neil Bailey. �An econometric analysis of
the world copper industry.� Bell Journal of Economics, Vol. 3 (1972), pp. 568�609.
[14] Franklin Associates Characterization of products containing lead and cadmium in mu-
nicipal solid waste in the United States, 1970�2000. Washington DC: U.S. Environ-
mental Protection Agency, 1989.
[15] Fullerton, Don and Thomas C. Kinnaman, �Garbage, recycling, and illicit burning or
dumping.� Journal of Environmental Economics and Management, Vol. 29 (1995), pp.
78�91.
[16] Fullerton, Don and Ann Wolverton. �The case for a two-part instrument: Presump-
tive tax and environmental subsidy.� In A. Panagariya, Paul R. Portney and Robert
M. Schwab, Eds., Environmental Economics and Public Policy: Essays in Honor of
Wallace E. Oates, , Cheltenham, UK: Edward Elgar, 1999, pp. 32�57.
[17] Joseph, Kevin and Wouter Verwey. �An overview of lead recycling in South Africa.�
Presented at UNCTAD Bangkok Conference, 2001.
[18] Lee, Shou-Chien. �Regulatory framework of municipal waste recycling.�
http://cemnt.epa.gov.tw/eng (Last viewed on September 8, 2003).
[19] Macauley, Molly, Karen Palmer, Jhih-Shyang Shih, Sarah Cline, and Heather
Holsinger. �Modeling the costs and beneÞts of Disposal options for end-of-life elec-
tronic equipment: The case of used computer monitors.� Resources for the Future
Discussion Paper 01-27, 2001.
[20] Moroney, J. R. and John M. Trapani. �Factor demand and substitution in mineral-
intensive industries.� Bell Journal of Economics, Vol. 12 (1981), pp. 272�284.
[21] National Safety Council. Electronic Product Recovery and Recycling Baseline Report:
Recycling of Selected Electronic Products in the United States. Washington, DC: Na-
tional Safety Council, 1999.
[22] Organization for Economic Cooperation and Development, Risk Reduction Monograph
No. 1: Lead � Background and National Experience with Reducing Risk Paris: OECD,
1993.
[23] Organization for Economic Cooperation and Development/European Environ-
mental Agency. Database on Economic Instruments and Voluntary Ap-
proaches Used in Environmental Policy and Natural Resources Management.
24
http://www1.oecd.org/scripts/env/ecoInst/index.htm. (Last viewed on September 8,
2003).
[24] Palmer, Karen and Margaret Walls. �Optimal policies for solid waste disposal: Taxes,
subsidies, and standards.� Journal of Public Economics, Vol. 33 (1997), pp. 193�205.
[25] Porter, Richard C. The Economics of Waste. Washington, DC: Resources for the Fu-
ture, 2002.
[26] Putnam, Hayes and Bartlett, Inc. The impacts of lead industry economics and haz-
ardous waste regulations on lead-acid battery recycling: Revision and update. Wash-
ington, DC: U.S. Environmental Protection Agency, 1987.
[27] Salkind, Alvin J., George E. Mayer and David Linden. �Lead-acid batteries.� In David
Linden, editor, Handbook of Batteries and Fuel Cells. New York, NY: MacGraw-Hill,
1984.
[28] Sigman, Hilary. �A comparison of public policies for lead recycling.� RAND Journal
of Economics, Vol. 26 (1995), pp. 452�78.
[29] Sigman, Hilary. �Midnight dumping: Public policies and illegal disposal of used oil.�
RAND Journal of Economics, Vol. 29 (1998), pp. 157�78.
[30] Smith, Gerarld R. Lead Recycling in the United States in 1998. Reston, VA: U.S.
Geological Survey, 2002.
[31] Smith, Gerarld R. �Lead.� Minerals Yearbook, 2001. Reston, VA: U.S. Geological
Survey, 2003, pp. 44.1�44.10.
[32] Thorton, Iain, Radu Rautiu, and Susan Brush. Lead: The Facts. Surrey, UK: Ian Allen
Publishing, 2001.
[33] Walker, Katherine and Jonathan Baert Wiener. �Recycling Lead.� In John D. Graham
and Jonathan Baert Wiener, Eds., Risk versus Risk: Tradeoffs in Protecting Public
Health and the Environment. Cambridge, MA: Harvard University Press, 1995, pp.149�
72.
[34] Wise, Kenneth T. The Effects of OSHA Regulations on the U.S. Lead Industry: An
Economic Impact and Econometric Modeling Analysis. Ph.D. thesis, Massachusetts
Institute of Technology, 1979.
25
[35] U.S. Environmental Protection Agency. Municipal Solid Waste in The United States:
2000 Facts and Figures Washington, DC: U.S. EPA, 2002.
[36] U.S. Office of Technology Assessment. Facing America�s Trash: What Next for Mu-
nicipal Solid Waste. Washington, DC: Government Printing Office, 1989.