22
O VERVIEW
| Date post: | 29-Aug-2019 |
| Category: |
Documents |
| Upload: | phungkhanh |
| View: | 213 times |
| Download: | 0 times |

OVERVIEW

THE WORLD BANK OFFICE JAKARTAIndonesia Stock Exchange Building Tower II/12th FloorJl. Jend. Sudirman Kav. 52-53Jakarta 12910Tel: (6221) 5299-3000Fax: (6221) 5299-3111Website: www.worldbank.org/id
THE WORLD BANK1818 H Street NWWashington, DC 20433, USATel: (202) 458-1876Fax: (202) 522-1557/1560Website: www.worldbank.org
Printed in January 2012
Cover and book design: Hasbi Akhir ([email protected])
Cover photograph and photographs on pages 13, and 18 provided by Ryca C. Rawung. Photographon page 7 provided by Guntur Sutiyono. Photograph on page 10 provided by Anne Cecile Esteve/Matahati Productions/World Bank. Photograph on page 15 provided by Hafi d Alatas. Copyrightprotection and all other rights reserved.
The Targeting Poor and Vulnerable Households in Indonesia report is a product of the staff of theWorld Bank. The fi ndings, interpretations, and conclusions expressed herein do not necessarily refl ect the views of the Board of Executive Directors of the World Bank or the Government they represent.
The World Bank does not guarantee the accuracy of the data included in this work. The boundaries,colors, denominations, and other information shown on any map in this work do not implyany judgment on the part of the World Bank concerning the legal status of any territory or theendorsement or acceptance of such boundaries.
For any questions regarding this report, please contactVivi Alatas ([email protected]), Matthew Wai-Poi ([email protected]) and RirinPurnamasari ([email protected]).

TARGETINGPOOR AND VULNERABLEHOUSEHOLDS IN INDONESIA
OVERVIEW
4
Targeting Poor and Vulnerable Households in Indonesia
Foreword
Indonesia has experienced strong economic growth over the last forty years. At the same time, the proportion of Indonesians living below the poverty line has fallen dramatically. Nonetheless, around 12 percent of Indonesians remain in poverty and another 30 percent remain highly vulnerable to falling into poverty in any given year. In addition, Indonesia has experienced a number of crises in the last two decades, and such shocks are likely to continue in the future in an increasingly integrated global economy.
Over the last fi fteen years the Government has been developing social assistance programs designed to promote the poor out of poverty and protect poor and vulnerable households from both individual and more widespread shocks. The coverage, design and implementation of these programs continues to be improved as social protection in Indonesia matures, but a number of issues remain. One of the most important, and diffi cult, is how these programs can accurately target households who need them most.
The challenge is to develop a targeting approach which includes most of the poor and vulnerable while minimizing leakage to the rich. At the same time, the system must be feasible, affordable, and accepted and used by all. Furthermore, identifying which households are poor is a diffi cult task in any developing country, but is particularly so in Indonesia, which has a very large population, a high degree of geographic dispersion, decentralization of much budgetary and operational governance, and frequent entry and exit of households into and from poverty.
Targeting Poor and Vulnerable Households in Indonesia provides the fi rst comprehensive review of targeting for social assistance programs in Indonesia. This evidence-based report builds in part on innovative research done collaboratively with the Government of Indonesia. In this respect Indonesia is contributing to the frontier of global knowledge on targeting, while also drawing on the experience of other countries.
Moving from a thorough assessment of the current effectiveness of targeting in Indonesia, the report contains practical and detailed recommendations for the future. In particular, a National Targeting System is proposed, which envisages developing a single registry of potential benefi ciaries to target social assistance to the right households, resulting in more accurate and cost-effective targeting outcomes, and ultimately stronger program impacts.
It is our sincere hope that this report will contribute to the ongoing improvements being made to Indonesia’s social assistance programs. As these reforms continue, more Indonesian households will make their way out of poverty, and many more can be protected from the reoccurring shocks making them vulnerable to falling back into poverty.
Stefan KoeberleCountry Director, Indonesia
The World Bank

5
Acknowledgements
Targeting Poor and Vulnerable Households in Indonesia is a product of the Poverty Group, a unit in the Poverty Reduction and Economic Management (PREM) team of the World Bank Offi ce Jakarta. The team, led by Vivi Alatas (Senior Economist, EASPR), provides technical and policy advice based on sound empirical research and analysis to the Government of Indonesia in support of national poverty reduction goals. Much of this report is based on work done in conjunction with the National Team for Accelerating Poverty Reduction (TNP2K), the National Development Planning Agency (Bappenas), and Statistics Indonesia (BPS). Support for this report has been generously provided by the Australian Agency for International Development.
This report was prepared by a core team led by Matthew Wai-Poi (Economist, EASPR) and Ririn Purnamasari (Economist, EASPR), overseen by Vivi Alatas. Comprehensive background papers on unifi ed registries and national targeting systems were produced by Tarsicio Casteneda. MediaTrac (led by Reza Sjarif and Imron Zuhri) produced background reports and analysis on media reporting and perceptions.
Research and data analysis was invaluably executed by Amri Ilmma in particular, with additional input being provided by Rythia Afkar, Astrid Alfi rman, Natasha Beschorner, Edgar Janz, Jon Jellema, Maria Cardenas Mendoza, Espen Pridz, and Nehru Sagena, as well as the SMERU Research Institute, and participants in the East Asia Pacifi c Regional Poverty Measurement and Targeting Workshop, overseen jointly by Andrew Mason (Lead Economist, EASPR) and Xioaqing Yu (Sector Director, EASHD).
Excellent comments were received from Peer Reviewers Margaret Grosh (Lead Economist, LCSHD), Kathy Lindert (Sector Manager, ECSH3) and Andrew Mason, as well as from Ivailo Izvorski (Lead Economist, EASPR), Julia Tobias (TNP2K), Scott Guggenheim, Lisa Hannigan and Stephen Kidd (AusAID). This report has benefi ted greatly from these.
Editing assistance was provided by Joe Cochrane, Mia Hyun and Edgar Janz. Logistical and production support was provided by Deviana Djalil and Elisabeth Ekasari, and design and layout by Aisuke Graphic House (led by Hasbi Akhir) in collaboration with Indra Irnawan (EXT).
This report was produced under the overall guidance of Vikram Nehru (Sector Director, EASPR) and Shubham Chaudhuri (Lead Economist, EASPR). Strategic guidance and key comments were also provided by Stefan Koeberle (Country Director, Indonesia).
Signifi cant contributions to this report come from work done in collaboration between TNP2K (led by Bambang Widianto, with Suahasil Nazara, Sudarno Sumarto, Julia Tobias and Ronaldo Octaviano), and a World Bank team including Nur Cahyadi, Taufi k Hidayat and Hendratno Tuhiman.
The targeting fi eld experiments were conducted in collaboration with Statistics Indonesia (in particular Rusman Heriawan, Arizal Ahnaf, Wynandin Imawan, Happy Hardjo, Hamonangan Ritonga, Uzair Suhaemi, Ano Herwana, Nurma Midayanti, Muryadi, Purwanto Ruslam, Indra Surbakti, Sodikin, Kadarmanto, Siti Muchlisoh and Tri Suryaningsih), Bappenas (in particular Endah Murniningtyas, Prasetiono Widjojo, Ceppie Kurniadi Sumadilaga, Rudy Prawiradinata, Pungky Sumadi, Dinar Kharisma and Vivi Yulaswati), and the Ministry of Social Affairs (Dwi Heru Sukoco, Akifah Elansary, Harapan Lumban Gaol and Yan Kusyanto), as well as with the Abdul Latif Jameel Poverty Action Lab (Ahbijit Banerjee, Talitha Chairunissa, Rema Hanna, Ben Olken and Jurist Tan), assisted by teams from Survey Meter (led by Bondan Sikoki) and Mitra Samya (led by Purnama Sidhi), with I Nyoman Oka.

6
Targeting Poor and Vulnerable Households in Indonesia
Table of Contents
Foreword 4Acknowledgements 5Table of Contents 6Reaching the Poor and Vulnerable with Social Assistance in Indonesia 7Current Targeting of the Poor and Vulnerable 10Improving Targeting in Indonesia 13Building a National Targeting System 15Recommendations at a Glance 18
List of Figures
Figure 1: Per Capita GDP Growth and Poverty 8Figure 2: Percentage of Population Below Multiples of the National Poverty Line 8Figure 3: New and Existing Poor Households in 2010 8Figure 4: Number of Times Poor in Last Three Years for All Households 8Figure 5: Percentage Receiving Programs by Consumption Decile in 2010 11Figure 6: Percentage of Total Benefi ts Received by Consumption Decile in 2010 11Figure 7: Targeting Gains by Program and Benchmarks, 2010 12Figure 8: Percentage of 6-18 Year Olds Receiving BSM by Consumption Decile in 2009 12Figure 9: Estimated Targeting Accuracy of PPLS08 and PPLS11 16Figure 10: Major Social Program Expenditures, and Cost of Constructing a Unifi ed Registry 17
List of Tables
Table 1: Major Household Social Assistance Programs in Indonesia (2010) 9Table 2: Recommendations at a Glance: Towards a National Targeting System 18
List of Boxes
Box 1: Measuring targeting outcomes can be done in different ways 11

7
Reaching the Poor and Vulnerable with Social Assistance in Indonesia
Indonesia has seen strong economic growth and falling poverty in the last decade. Yet half of the country gets by on relatively little, and many of these become poor each year. In the last ten years Indonesia has returned to strong economic growth. The poverty rate has fallen from 23.4 percent of all Indonesians in 1999 to 12.5 percent by 2011 (Figure 1).1 However, much of the country still has relatively low living standards (Figure 2); half of the country still lives on less than Rp 15,000 per day,2 and small shocks can drive them into poverty. Because of this, people move into and out of poverty easily in Indonesia. Of the all poor in each year, over half were not poor the year before; they are newly poor (Figure 3). Over a three year period, a quarter of all Indonesians will be in poverty at least once (Figure 4).
1 Statistics Indonesia (BPS) sets the offi cial poverty line for Indonesia, which is defi ned as the amount of money required to obtain 2,100 calories per day from local food commodities and a small amount for other basic necessities, such as clothing, housing, and transportation. In 2011, the poverty line was around Rp 233,700 per household member per month.
2 Equivalent to around PPP$2.25 a day. This is using the most recent (2005) PPP exchange rate for private consumption of Rp 4,193 per PPP$1, adjusted for CPI infl ation to 2011, resulting in an exchange rate of Rp 6,575 per PPP$1. Note that this is an informal estimate and does not represent an offi cial PPP exchange rate for 2011. The 2005 PPP exchange rate is taken from the World Bank’s World Development Indicators, and CPI data from Statistics Indonesia.

8
Targeting Poor and Vulnerable Households in Indonesia
Despite strong economic growth and falling poverty over the last decade, progress in key social indicators remains sluggish.
Figure 1: Per Capita GDP Growth and Poverty
Figure 2: Percentage of Population Below Multiples of the National Poverty Line
-2
0
2
4
6
8
0
20
40
60
80
100 GD
P per capita growth (percent)
Perc
ent
of P
opul
atio
n in
Pov
erty
GD
P per capita growth (percent)
0
10
20
30
40
50
60
70
2008 2009 2010 2011
PovertyLine (PL)
1.2 x PL
1.5 x PL
2.0 x PL
Sources: BPS. Sources: SusenasNotes: The national poverty line is around Rp 233,700 per person per month in 2011.
Social assistance, or a social safety net, is vital to protect the 40 percent of Indonesians who are highly vulnerable to poverty. There is a large group of vulnerable households in Indonesia. The poorest 40 percent of Indonesian households this year have at least a one in ten chance of being poor the following year. This chance becomes much higher the poorer they are now. In fact, over 80 percent of next year’s poor will come from this group, who live on less than Rp 12,000 per day.3 The ease of falling into poverty for this vulnerable group means social safety nets are needed protect them, in addition to programs to help the long-term poor out of poverty.
Over half of the poor each year are newly poor, and one quarter of all Indonesians were in poverty at least once in a three year period
Figure 3: New and Existing Poor Households in 2010
Figure 4: Number of Times Poor in Last Three Years for All Households
0
20
40
60
80
100
Poor in 2010
Perc
etna
ge o
f Po
pula
tion
by
Cat
egor
y
Newly Poor
Existing Poor
0
20
40
60
80
100
Number of Times Poor 2008-10
Perc
enta
ge o
f Po
pula
tion
by C
ateg
ory
Poor Three Times
Poor Twice
Poor Once
Never Poor
Sources: Susenas and World Bank calculations.
Over the last 15 years, Indonesia has established a fi rst generation of household social assistance programs. There are now a number of household social assistance programs in Indonesia to support the poor and vulnerable (Table 1). These include subsidized rice (Raskin), health fee waivers (Jamkesmas), cash transfers for poor students (BSM), a conditional cash transfer (PKH), and a temporary unconditional cash transfer (BLT). These programs are designed to promote the poor out of poverty, and protect the vulnerable from falling back in. However, the current programs are only partially effective in achieving this.
3 Approximately PPP$1.80.
9
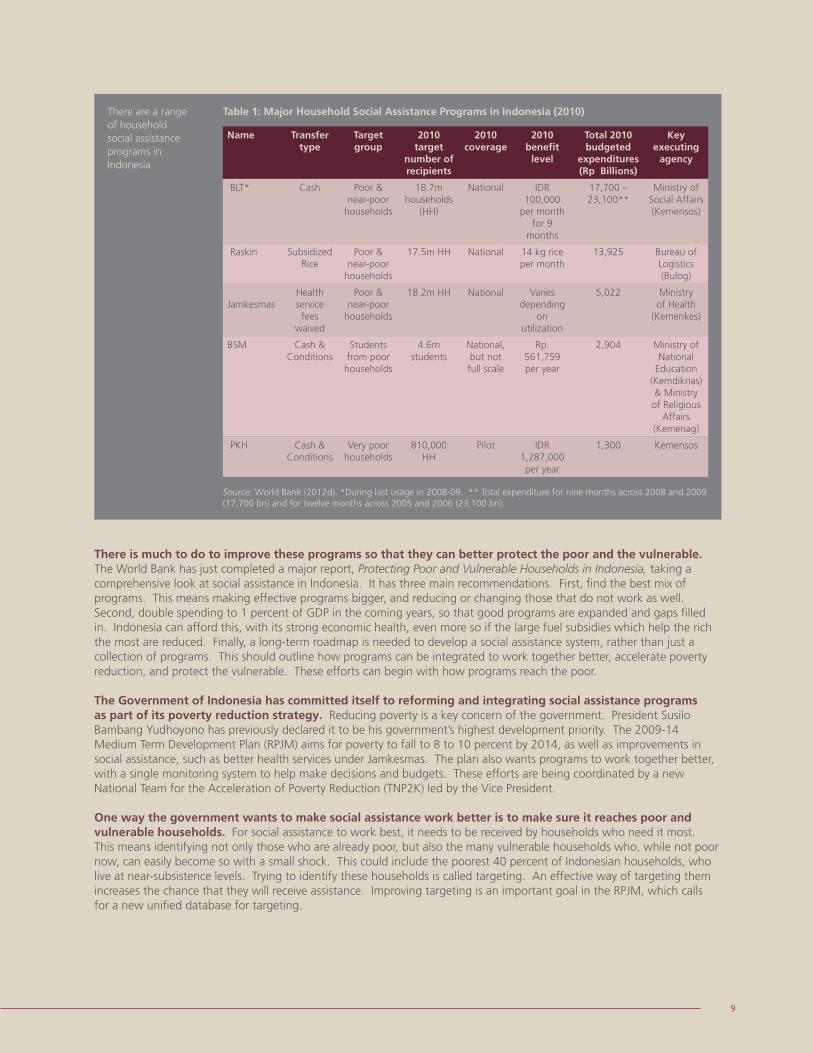
There are a range of household social assistance programs in Indonesia
Table 1: Major Household Social Assistance Programs in Indonesia (2010)
Name Transfer type
Target group
2010 target
number of recipients
2010 coverage
2010 benefi t
level
Total 2010 budgeted
expenditures (Rp Billions)
Key executing
agency
BLT* Cash Poor & near-poor
households
18.7m households
(HH)
National IDR 100,000
per month for 9
months
17,700 – 23,100**
Ministry of Social Affairs (Kemensos)
Raskin Subsidized Rice
Poor & near-poor
households
17.5m HH National 14 kg rice per month
13,925 Bureau of Logistics (Bulog)
Jamkesmas
Health service fees
waived
Poor & near-poor
households
18.2m HH National Varies depending
on utilization
5,022 Ministry of Health
(Kemenkes)
BSM Cash & Conditions
Students from poor households
4.6m students
National, but not full scale
Rp. 561,759 per year
2,904 Ministry of National
Education (Kemdiknas) & Ministry
of Religious Affairs
(Kemenag)
PKH Cash & Conditions
Very poor households
810,000 HH
Pilot IDR 1,287,000 per year
1,300 Kemensos
Source: World Bank (2012d). *During last usage in 2008-09. ** Total expenditure for nine months across 2008 and 2009 (17,700 bn) and for twelve months across 2005 and 2006 (23,100 bn).
There is much to do to improve these programs so that they can better protect the poor and the vulnerable. The World Bank has just completed a major report, Protecting Poor and Vulnerable Households in Indonesia, taking a comprehensive look at social assistance in Indonesia. It has three main recommendations. First, fi nd the best mix of programs. This means making effective programs bigger, and reducing or changing those that do not work as well. Second, double spending to 1 percent of GDP in the coming years, so that good programs are expanded and gaps fi lled in. Indonesia can afford this, with its strong economic health, even more so if the large fuel subsidies which help the rich the most are reduced. Finally, a long-term roadmap is needed to develop a social assistance system, rather than just a collection of programs. This should outline how programs can be integrated to work together better, accelerate poverty reduction, and protect the vulnerable. These efforts can begin with how programs reach the poor.
The Government of Indonesia has committed itself to reforming and integrating social assistance programs as part of its poverty reduction strategy. Reducing poverty is a key concern of the government. President Susilo Bambang Yudhoyono has previously declared it to be his government’s highest development priority. The 2009-14 Medium Term Development Plan (RPJM) aims for poverty to fall to 8 to 10 percent by 2014, as well as improvements in social assistance, such as better health services under Jamkesmas. The plan also wants programs to work together better, with a single monitoring system to help make decisions and budgets. These efforts are being coordinated by a new National Team for the Acceleration of Poverty Reduction (TNP2K) led by the Vice President.
One way the government wants to make social assistance work better is to make sure it reaches poor and vulnerable households. For social assistance to work best, it needs to be received by households who need it most. This means identifying not only those who are already poor, but also the many vulnerable households who, while not poor now, can easily become so with a small shock. This could include the poorest 40 percent of Indonesian households, who live at near-subsistence levels. Trying to identify these households is called targeting. An effective way of targeting them increases the chance that they will receive assistance. Improving targeting is an important goal in the RPJM, which calls for a new unifi ed database for targeting.

10
Targeting Poor and Vulnerable Households in Indonesia
Current Targeting of the Poor and Vulnerable
Current programs, however, target the poor using different methods. At the moment, social assistance programs in Indonesia all work separately from one another. This is also true of targeting, with each program doing it differently from the others, even when they are looking for the same people. Because different methods are used, each program has quite different benefi ciaries. Even though BLT, Jamkesmas and Raskin are aimed at the poorest 30 percent of households, less than one third of these households receives all three programs. Before targeting in Indonesia can improve, how each program is targeted now needs to be looked at, and how well it works.
Indonesia’s largest social assistance program, a temporary cash transfer called BLT, tried to compile a list of poor and vulnerable households. BLT was established in haste to protect households against rising fuel prices. As the government reduced fuel subsidies in 2005 in the face of rising fuel prices, it introduced BLT to help cushion the effects on the poor and vulnerable. Statistics Indonesia was asked to compile a list these households in a very short time. A range of methods were planned, but in practice, the potential benefi ciaries were mainly suggested by sub-village heads, without a clear basis for nomination. If a poor household was not nominated, they were not assessed, and many of them missed out on the program. When BLT was run again in 2008, largely the same households were revisited, meaning households not on the 2005 list generally missed out again in 2008.
Even though BLT has the best targeting of the major programs, over half of poor and vulnerable households were excluded. BLT aimed to fi nd the poorest 30 percent of Indonesian households. However, only 46 percent of them actually received transfers (Figure 5). At the same time, many households who are better off were included, and in fact they received half of all benefi ts (Figure 6). One way to assess targeting performance is to score it on a scale where 0 means no targeting (that is, handing out benefi ts randomly), and 100 means perfect targeting (all the benefi ts are received by the poor); see Box 1. Targeting is very hard and never perfect; 50 is a good score. On this scale, BLT scores 24. Despite being the best targeted of the major social assistance programs (Figure 7), if BLT is deployed in the future, targeting can be better.

11
Box 1: Measuring targeting outcomes can be done in different ways
A range of different measures of targeting outcomes are used in the targeting literature. No single measure is perfect. In particular, there are diffi culties comparing between programs, countries and time periods, particularly when different size programs are involved. This report introduces a new measure which compares how well a program was targeted compared to no targeting (randomly distributing benefi ts) and perfect targeting (all benefi ts received by intended households). This measure (targeting gain) is a normalization of the popular Coady-Grosh-Hoddinott measure, which compares the proportion of benefi ts received by a target population to the size of the target population. Targeting gain transforms this score to be between 0 and 100, where 0 represents the same outcome as if targeting had been random, and 100 represents perfect targeting, or the result if all the benefi ts had been received by the target population. That is, targeting gain represents how much better than random a program’s outcomes were, relative to perfect targeting. The new measure is both more intuitive to interpret and more consistent to compare across programs and periods. It is important to note that perfect targeting is impossible in practice, so a good targeting gain score is considerably less than 100.
Jamkesmas also uses a list of the poor, but actual targeting depends on local decisions. As with BLT, many poor households are not reached. Jamkesmas cards should be given to those households on Statistics Indonesia’s offi cial list of the poor, such as that for BLT. But how cards are handed out is done differently in different places. Some districts use the offi cial lists, while health offi cials in other districts select benefi ciaries themselves. Even until recently, households could receive Jamkesmas benefi ts simply with a letter from the village head. These differences in targeting mean poor households have different chances of getting a card in different parts of Indonesia. Similarly to BLT, Jamkesmas covers 45 percent of households it is trying to fi nd (Figure 5), but non-poor households make up 55 percent of all benefi ciaries (Figure 6). As a result, the Jamkesmas targeting score is only 16 out of 100, behind that of BLT (Figure 7).
Current programs are pro-poor, with poor households being more likely to receive benefi ts……but a considerable proportion of total benefi ts goes to non-poor households
Figure 5: Percentage Receiving Programs by Consumption Decile in 2010
Figure 6: Percentage of Total Benefi ts Received by Consumption Decile in 2010
0
20
40
60
80
100Non- targetTarget
0
5
10
15
20
25Non- targetTarget
Sources: Susenas and World Bank calculationsNotes: BLT results are for 2009.

12
Targeting Poor and Vulnerable Households in Indonesia
BLT is the most accurate program with the highest targeting gain, but there remains signifi cant room for improvement
Figure 7: Targeting Gains by Program and Benchmarks, 2010
0
20
40
60
Sources: Susenas and World Bank calculationsNotes: BLT data are for 2009. See Box 1 for the defi nition of targeting gain. 2008 List means revisiting 2008 list of households and conducting new PMT. All Households means applying PMT to all households.
Similarly, the targeting of Raskin rice is largely determined at the community level. Sometimes offi cial lists are used but often it is given out as the community sees fi t. Like Jamkesmas, Raskin is meant to be given to people on the offi cial lists of the poor, after being checked at a broad-based community meeting. But again, how it is really handed out varies at the local level. Often the community meetings to check the list are not held, or are not open to many members. Often the offi cial list itself is not used, and the rice is distributed as the village head thinks best. Rice is often shared equally among households, poor or non-poor, in order to avoid confl ict and tension.
The informal sharing of Raskin means benefi ts are spread widely across the community. Many poor households receive rice, but the benefi ts are diluted. Raskin is distributed to nearly twice the number of benefi ciaries as planned; 54 percent of all Indonesian households receive some rice. An advantage of this is that 71 percent of target households benefi t, which is higher than both BLT and Jamkesmas (Figure 5). However, because of this sharing, poor households get far less than the offi cial 14 kilograms of rice per month, meaning they do not get the help they need. For Raskin, nearly 70 percent of all benefi ciaries are not poor, and many are not close to being poor (Figure 6). In fact, around one in six households in the richest 20 percent of Indonesia receive Raskin rice (Figure 5). Raskin’s overall targeting score is only 13 out of 100 (Figure 7).
BSM also has poor targeting, with a non-poor student nearly as likely to get cash as a poor or vulnerable one. BSM benefi ciaries are typically nominated by schools or school committees. Students must have shown good attendance and behavior. Because of this, new students or ones who not yet started have little chance of being selected, nor do those who are not well known to the principal. Poor children who are not in school are not considered at all. Students from the poorest 40 percent of households get about half of all BSM funds, while households in the top 60 percent receive the other half (Figure 8). That is, BSM is nearly as likely to be received by a poor or vulnerable student as by a student in a richer household.
Students from households of any consumption status are nearly as likely to receive BSM as any other
Figure 8: Percentage of 6-18 Year Olds Receiving BSM by Consumption Decile in 2009
0
2
4
6
8
10
Sources: Susenas and World Bank calculations

13
Improving Targeting in Indonesia
Many poor household in Indonesia receive social assistance, but many remain excluded. Some key problems have been identifi ed. For most major programs, poor and vulnerable households are more likely to receive benefi ts than non-poor households. However, many poor still miss out, and non-poor households get around half of all benefi ts. After looking at each program’s way of targeting and how well it works, several key problems have been found. There are problems in the design, implementation and coordination of targeting.
Targeting outcomes can be improved if methods are better designed. Deciding which households to include in the selection process is very important for targeting, since a poor household who is not even considered in the fi rst place will not become a benefi ciary, no matter how well households are be assessed. In Indonesia, many poor households are not considered for social assistance. As discussed, half of the households BLT was trying to fi nd were not nominated by community leaders. Once potentially poor and vulnerable households are included in the initial targeting process, the next step is selecting the right ones. This has not always been done well in Indonesia, as with the frequent sharing of Raskin rice evenly among all households, regardless of poverty.
Targeting methods also depend on successful implementation. A major problem has been a lack of awareness. How targeting is actually done is as important as how it is designed. Well-planned targeting will not work if it is not executed successfully. In addition to offi cial targeting guidelines not being followed in the fi eld, targeting in practice has suffered from poor socialization and a lack of coordination between agencies and programs. Socialization – making all stakeholders aware of a program’s purpose and intended benefi ciaries, their rights and responsibilities – has not been done well for most programs. As a consequence, who receives benefi ts and why has not been clear and offi cial targeting processes are not followed. It increases the possibility of corruption, and can lead to confl ict and tension in communities.

14
Targeting Poor and Vulnerable Households in Indonesia
Greater coordination between programs would improve both targeting and program effectiveness. There are two ways in which programs can work together to improve the impact of social assistance. First, some functions would work better if coordinated across programs, such as handling program complaints from households in the same place and conducting program awareness campaigns together. This also applies to targeting. Programs with objectives that overlap can make sure that poor households who receive one program also receive the other. For example, PKH would be more effective if its benefi ciaries also received Jamkesmas, as the promotion of healthy behaviors would be supported by free health care. Up until now, this has not been done. One reason is that there are no clear arrangements to help programs and agencies work better together.

15
Building a National Targeting System
Targeting in Indonesia could be made more effective by building a National Targeting System. At the heart of a National Targeting System (NTS) is a unifi ed registry of poor and vulnerable households. This has already been done in other countries, including Chile, Colombia, Mexico, and the Philippines, and has several benefi ts. The unifi ed registry can be built using the best targeting methods, providing quality data for all programs, at a lower cost. From this registry, each program can use its own criteria to get benefi ciary lists which include more poor families, and less non-poor. What is more, the registry can tell any program what other social assistance a household is getting, so that programs can work together better. Having all households who receive social assistance in the same database also means that duplication, fraud and corruption can be reduced. The registry can also be used to link with other government efforts, such as trying to bring more poor families into the banking system, or teach them more about using fertilizer and newer seeds.
Deciding whether social assistance provides the right benefi ts is easier when program benefi ciaries are chosen from the same registry. When most programs are targeted with the NTS, it is natural to think about the benefi ts received as a whole. Who can get more than one program? Does the mixture of benefi ts add up to a sensible support package? Or do some programs overlap, at the same time as there are gaps in protection? These are important questions for designing an effective approach to social assistance. Building an NTS can help start discussion within government and supporting parties.
Indonesia has already made good progress on building a unifi ed registry of poor and vulnerable households. A unifi ed registry has already been mandated in the RPJM, with a Presidential Instruction outlining the steps required. Considerable progress has already been made. In 2011, Statistics Indonesia conducted PPLS11, a very large-scale updating of its list of poor households. This is a signifi cant expansion from previous lists, increasing the number of households surveyed from around 19 million in 2008 to 25 million, or just over 45 percent of the population. A broad range of

16
Targeting Poor and Vulnerable Households in Indonesia
demographic data were also collected, to help target different programs. Most importantly, in 2011 the previous list was not simply revisited, as it largely was in 2008; instead, all households in Indonesia had a chance of being assessed. This meant that new households could enter the list, and previously poor households who have exited poverty could graduate off from it. Figure 9 compares estimates of the targeting accuracy of the 2008 and 2011 lists. It is estimated that just over half of the poorest 30 percent of Indonesian households were excluded from the 2008 list. This exclusion of the poor and near-poor is expected to fall by around 20 percentage points in the 2011 list, with even larger improvements coming for the poorest households. The many strengths of PPLS11 make it a good basis for the unifi ed registry.
The accuracy of PPLS11 is estimated to be considerably better than the 2008 list
Figure 9: Estimated Targeting Accuracy of PPLS08 and PPLS11
0
10
20
30
40
50
60
Sources: Susenas and World Bank calculationsNotes: Results of simulations and analysis in Susenas. Inclusion error is the percentage of non-poor included in the list. Exclusion error is the percentage of (very poor, poor, near-poor) excluded from the list. The BPS defi nition of very poor is those below 0.8 x the poverty line, the poor below the poverty line and the near-poor below 1.2 x the poverty line.
The unifi ed registry is an important part of an NTS, but is only part of a broader system. PPLS11 is a solid start towards building a unifi ed registry and an NTS to support it. However, there is much left to do. To begin with, the unifi ed registry needs to be constructed from the PPLS11 data, which has signifi cant information technology requirements. Beyond the unifi ed registry, there are three key imperatives for the NTS. It needs to reach the right people. It needs to stay current. And it needs to be managed well.
Improving targeting in Indonesia begins by reaching the right people. Reaching the right people means three things for targeting. First, the right people means not just the poor, but also the vulnerable. Reducing poverty in Indonesia means not just helping the chronic poor, but also protecting the many vulnerable households from falling into poverty. Second, to reach these people, the right targeting methods need to be used, with attention paid to both design and implementation. Third, the unifi ed registry must be used by all programs to ensure the right people are being reached. Using the new registry will help make targeting more consistent, help programs work together better, and allow better monitoring of outcomes.
The unifi ed registry needs to stay current because of the fl uid nature of poverty in Indonesia. Household and family circumstances change frequently. There are many non-poor households in Indonesia who can easily fall into poverty if they suffer a health, employment, or of other type of shock. At the same time, economic growth, improving access to services, and hard work are lifting many poor households out of poverty. Over time, they will no longer need the long-term assistance aimed at the chronic poor. To allow social assistance adapt to this frequent entry into and exit from poverty, the NTS needs to stay current. Staying current also means adapting to non-economic changes in households, such as the birth of a child or a change of address. Consequently, updating the registry is vital. One way this can be done is by allowing households to appeal if they have not been assessed correctly or their circumstances have changed.
Recent fi eld experiments demonstrate that incorporating a well-designed and facilitated role for communities in targeting can increase both accuracy and community satisfaction, as can self-targeting. They also show that self-targeting methods – where households apply directly – can bring in those poor not currently receiving benefi ts. Using community-based methods and self-targeting are promising mechanisms for updating and appeals.

17
The NTS also needs to be managed well. The effectiveness and legitimacy of the NTS depend upon it being well managed. This means it needs to be accountable, transparent and participatory. To do this, the main long-term challenge for the NTS is deciding its institutional framework. Does the coordination role stay with TNP2K, does it become an independent agency, or is it moved to a more established central ministry? Where can complaints be fi led, and how will they be resolved? Who will conduct updating activities? Who will conduct awareness campaigns, and coordinate them across programs? Answering these questions will help with the good governance of the system. For example, to promote accountability, the NTS could report to a steering committee of relevant government ministries and agencies. Broader participation can be promoted if civil society, communities and NGOs help monitor and evaluate targeted programs at the local level, and contribute to updating and appeals. Substantial improvement in socialization to all parties will not only help improve targeting implementation and outcomes, but also transparency and legitimacy.
Building an NTS is only a small part of the cost of social assistance. About 4 percent of total government spending goes to household social assistance, or around Rp 25.2 trillion (US$ 3 billion) in 2010. This can rise as high as 7 percent in times of signifi cant crisis. An NTS can help make this spending more effective by making sure it is received by those who need it most. Furthermore, it is cost-effective to develop. The cost of building and maintaining the NTS would be only a small part of the total cost of each social assistance program. Constructing the unifi ed registry will cost about Rp 600 billion. This would be around 4 percent of Raskin’s total costs, 12 percent for Jamkesmas, or 2 percent for BLT (Figure 10). However, because the NTS can be used by all three programs, the initial costs would only be just over 1 percent of the three combined annual program costs. Ongoing costs each for maintaining the system are likely to be lower, but even at the same level, total annual targeting costs remain very low relative to the total cost of benefi ts transferred.
The initial cost of a unifi ed registry represents between 2 and 12 percent of each program’s total expenditures, but just over 1 percent of the three major programs combined, making the incremental cost of targeting very low if it can effectively direct the remaining funds to those households who need it most
Figure 10: Major Social Program Expenditures, and Cost of Constructing a Unifi ed Registry
0
2
4
6
8
10
12
14
0
10
20
30
40
50
60
BLT (12months)
Raskin 2010 Jamkesmas2010
All ThreePrograms
All 2010Spending
All 2010Spending +
BLT
Initial Database C
osts as % of Total Program
SpendingTr
illio
ns o
f Ru
piah
Total Program Spending (LHS)
Cost of Unified Registry Initial Data Collection as % Total Program Spending (RHS)
Sources: Ministry of Finance, World Bank calculations.Notes: 2010 data are based on the budget (APBN). BLT for 12 months is total cost of BLT in 2005-06. All three programs is Raskin and Jamkesmas 2010 + 12 months BLT. All 2010 is all household-targeted social spending.
Indonesia is showing global leadership in the targeting social assistance, as it tests innovative ways to involve communities and poor households. As Indonesia continues to develop as a middle income country, it has the capacity to improve social assistance, reduce poverty and protect the vulnerable. Strong economic growth in the last forty years has seen Indonesia join the ranks of middle income countries, and good progress has been made in poverty reduction. Nonetheless, improvements in social assistance are needed to protect the many vulnerable households that remain. Targeting is key to these efforts. Indonesia has the fi nancial and administrative capacity to make targeting better, both by learning from other countries and leading the way into new areas. With its innovative piloting of new ways for involving communities and poor households in the process, Indonesia is playing a global role in extending the knowledge frontier of social assistance policy. Access to social assistance through better targeting means that climbing out of poverty, and being protected from falling back in, can become a reality for the millions of Indonesians who still struggle in their daily lives. Important steps have been taken, but care must be taken not to lose focus on the considerable amount of work still to be done.

18
Targeting Poor and Vulnerable Households in Indonesia
The targeting of social assistance and protection in Indonesia can be improved signifi cantly with the development of a National Targeting System. Such a system can provide improved targeting accuracy in a cost-effective manner, while generating increased buy-in for social safety nets from politicians, ministries, local government, communities and benefi ciaries
Table 2: Recommendations at a Glance: Towards a National Targeting System
Component Recommendations
Design
Targeting Objectives
The targeting objectives of each social assistance program need to be carefully and clearly defi ned.
Legal and Institutional Framework
An institutional framework needs to be developed that clearly allocated responsibilities and authorities within an NTS, including who collects which data, who analyzes it and how, and who can use it. These arrangements should have a clear mandate in enacted legal regulations.
Initial Data Collection
Initial data collection for the unifi ed registry of potential benefi ciaries should be based on the PPLS11 carried out by Statistics Indonesia in July 2011. Data collection needs to focus on collecting the right information from the right households. Collecting the right information means coordinating with line ministries to identify the data required to target each social assistance program. Visiting the right households means including as many potentially poor and vulnerable households in the initial survey as possible. In order to reduce exclusion errors, incorporation of existing program lists should be considered.
Implementation
Building a Unifi ed Database
An initial database of potential benefi ciaries is required. Developing this database should include data integrity processes, such as checking for duplications and fraud control. Careful considerations need to be given to overall MIS design for hardware and software, based on planned use and data sharing arrangements.
Recommendations at a Glance

19
Table 2: Continued
Component Recommendations
Implementation (cont.)
Extracting Program Benefi ciary Lists
A unifi ed registry should not be seen as a single list of benefi ciaries for all programs, but as a source of high quality data on potential benefi ciaries. Separate processes should be used to identify benefi ciaries for each program. This should coordinated with line ministries, and factor in program complementarities, such as ensuring all PKH benefi ciaries also receive Jamkesmas. Data sharing arrangements should govern rights and responsibilities of the unifi ed data for each participating agency.
Socialization and Communication
A comprehensive socialization strategy should be developed. This should cover all issues, such as individual program objectives and intended benefi ciaries, and rights and benefi ts of benefi ciaries, as well as how benefi ciaries were selected and a clear process for appeals. In addition, the strategy should refl ect the different needs for all stakeholders, including central and line ministries, parliament, local government, communities and civil society, and benefi ciaries themselves. This strategy will need to be developed in coordination with line ministries and the Ministry for Communication and Information (Kemenkominfo).
Maintenance and Updating
Complaints and Grievances Protocols
A well-designed and communicated complaints and grievances redress process is critical. Such a process should specify what appeals can be made, how they should be resolved, and by whom. Strong consideration should be given to the possible inclusion of community input in this process, but such a role needs to be carefully designed and facilitated.
Updating and Recertifi cation Protocols
Clear guidelines are required as to what information can be updated in the NTS, how frequently, and how it will be verifi ed. Who will carry out household visits in the future needs to be resolved now. Statistics Indonesia continues to be exposed to reputational risk through its current involvement in benefi ciary selection, which compromises its other products such as the decennial Population Census and quarterly Susenas and Sakernas surveys. However, if another agency is to adopt this role in the future, then signifi cant investments in capacity building are required.
Monitoring and Evaluation
Regular monitoring and evaluation is required to assess targeting performance, identify areas and methods for improvement, and identify implementation issues. These efforts should be coordinated with general program effectiveness M&E activities of line ministries.
Program Exit Strategies
Coordination of program exit strategies with the NTS should be done with line ministries. Where benefi ciaries automatically graduate from programs, such as PKH or scholarship, the NTS needs to track this. Where program exit strategies are unclear, as with Jamkesmas, there exists the opportunity to align this process with the recertifi cation of the NTS’s unifi ed registry.
20
Targeting Poor and Vulnerable Households in Indonesia


THE WORLD BANK, JAKARTA OFFICEIndonesia Stock Exchange Building Tower II/12th FloorJl. Jend. Sudirman Kav. 52-53Jakarta 12910Tel: (6221) 5299-3000Fax: (6221) 5299-3111Website: www.worldbank.org/id


