ASX Release 21 July 2020 Agrimin Limited | ABN 15 122 162 396 ASX Code: AMN 2C Loch Street Nedlands, Western Australia 6009 T: +61 8 9389 5363 E: [email protected] | W: www.agrimin.com.au Page 1 of 80 TARGETING THE WORLD’S LOWEST COST SOP PRODUCTION Highlights • Outstanding DFS economics with a post-tax NPV8, real of US$655M and IRR of 21%, based on a flat Sulphate of Potash (“SOP”) price of US$500/t FOB (Wyndham Port) • Forecast to be the world’s lowest cost producer of SOP with a total cash cost of US$159/t FOB • Annual EBITDA forecast of US$145M, delivering an exceptional EBITDA margin of 66% • Maiden Ore Reserve of 20Mt of SOP, based on the 161Mt Measured and Indicated Mineral Resource (total porosity basis) • Globally significant production rate of 450ktpa of SOP and 40 year mine life, with excellent potential to scale-up further to meet the expected growth in seaborne demand for SOP • Pre-production capital cost of US$415M (includes contingency), of which US$293M is based on lump sum EPC proposals by reputable contractors and equipment suppliers • Low scope 1 and 2 emissions of 158kg CO₂-e per tonne of SOP, delivering one of the lowest carbon footprints associated with any major macro-nutrient fertiliser product • Extensive pilot testing has produced premium quality SOP which supports ongoing product marketing initiatives • Delivery of the DFS enables the advancement of off-take and project funding discussions with some of the world’s largest fertiliser companies Agrimin Limited (ASX: AMN) (“Agrimin” or “the Company”) is pleased to release a summary of the results of the Definitive Feasibility Study (“DFS”) for the flagship 100%-owned Mackay Potash Project in Western Australia. Cautionary Statement: The DFS mine plan and production target contains 93% Ore Reserve and 7% Inferred Mineral Resource. There is a low level of geological confidence associated with the Inferred Mineral Resource and there is no certainty that further exploration work will result in the conversion to an Ore Reserve or that the production target itself will be realised.
Agrimin Strategy and Key Study Outcomes ............................................................................................................ 5
Next Steps ............................................................................................................................................................... 7
Contributors to the Study ....................................................................................................................................... 8
Project Development Plan .................................................................................................................................... 10
Environmental, Social and Governance ................................................................................................................ 12
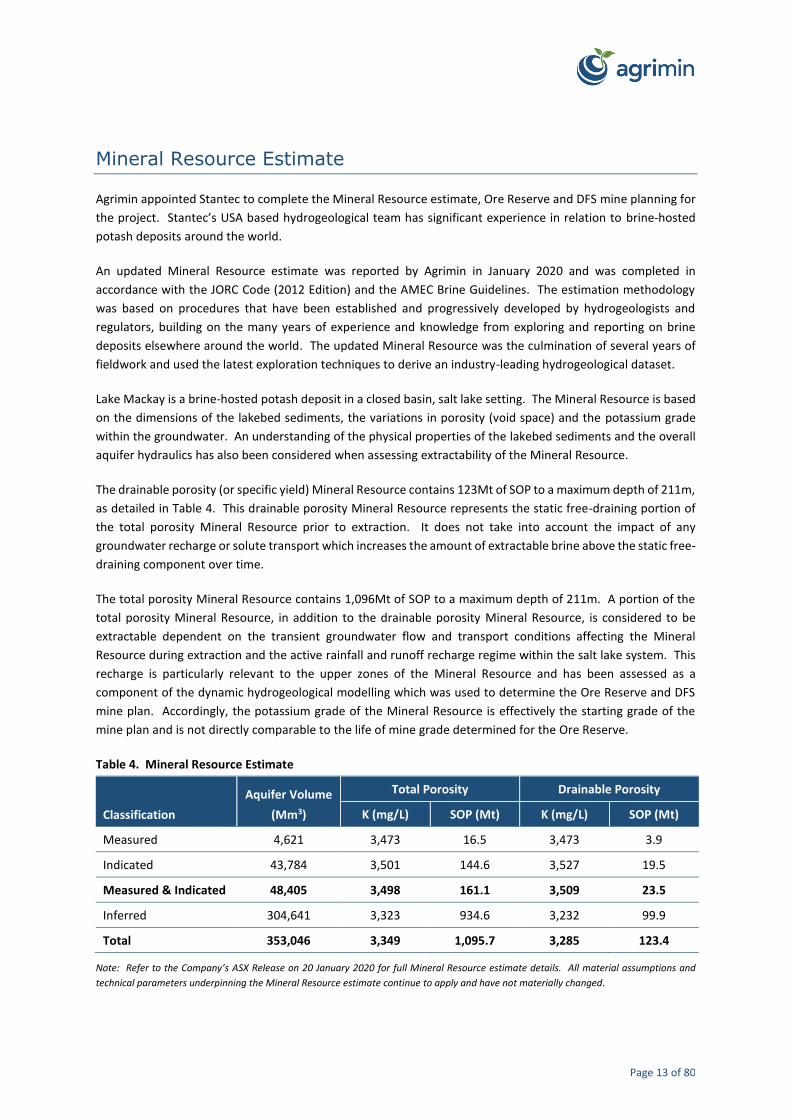
Mineral Resource Estimate ................................................................................................................................... 13
Ore Reserve and Mine Plan .................................................................................................................................. 15
Solar Evaporation Ponds ....................................................................................................................................... 19
Salt Harvesting ...................................................................................................................................................... 21
Site Infrastructure ................................................................................................................................................. 24
Power Supply ........................................................................................................................................................ 25
Water Supply ........................................................................................................................................................ 26
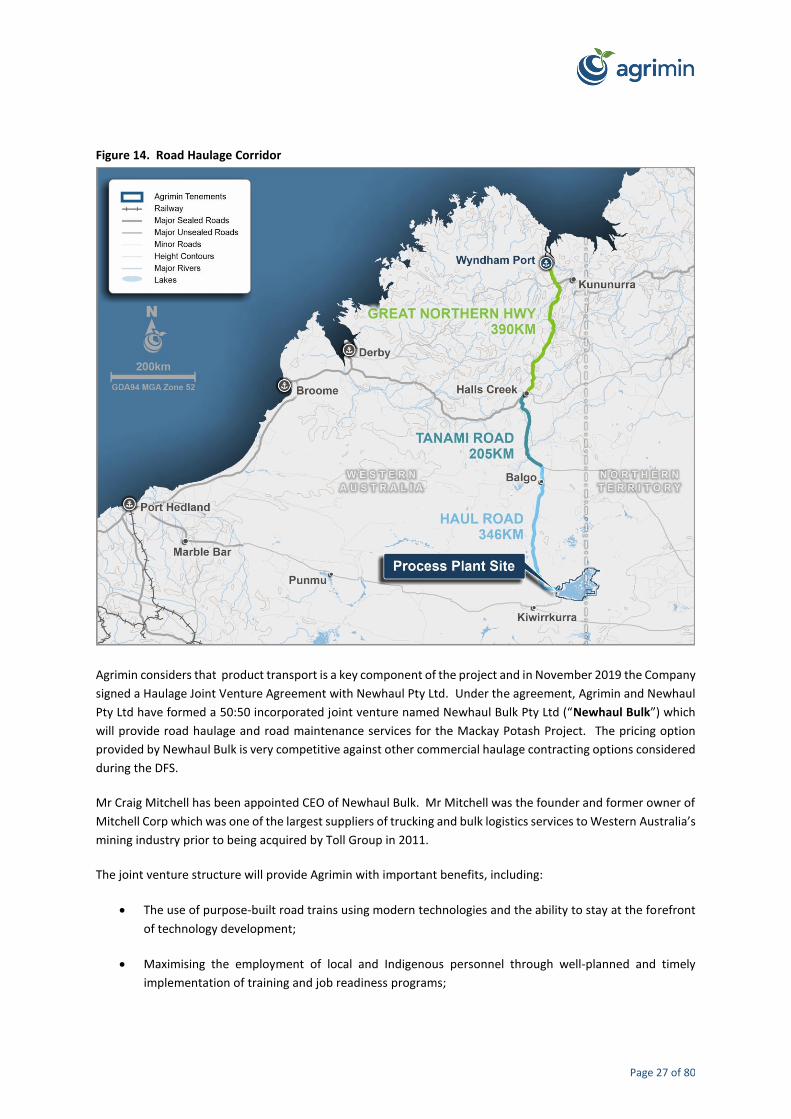
Haul Road and Product Haulage ........................................................................................................................... 26
Wyndham Port and Shiploading ........................................................................................................................... 28
Product Specification and Marketing ................................................................................................................... 29
Market Analysis and Pricing.................................................................................................................................. 30
Capital Costs ......................................................................................................................................................... 33
Environmental, Social and Permitting .................................................................................................................. 36
Native Title and Heritage ...................................................................................................................................... 38
Important Notices and Disclaimers ...................................................................................................................... 42
Summary of Ore Reserve and Reporting Criteria ................................................................................................. 43
Mineral Resource, Ore Reserve & Mine Planning Stantec
On-Lake Civil Design Stantec
Process Water Supply CDM Smith
Power Supply QGE Group
Haul Road Civil Design Coffey
Product Haulage Newhaul Bulk
Wyndham Port Storage Facility Q Design & Construct
Barge Loading Facility Transhipment Services Australia
Market Analysis CRU Group
Cost Estimation & Financial Analysis JukesTodd, Owners Team
Environmental, Social And Permitting Stantec
Risk & Project Implementation JukesTodd, Owners Team
Note: The integrated owners team was responsible for compiling the overall capital and operating cost estimates which were provided by
the various study contributors.
Page 9 of 80
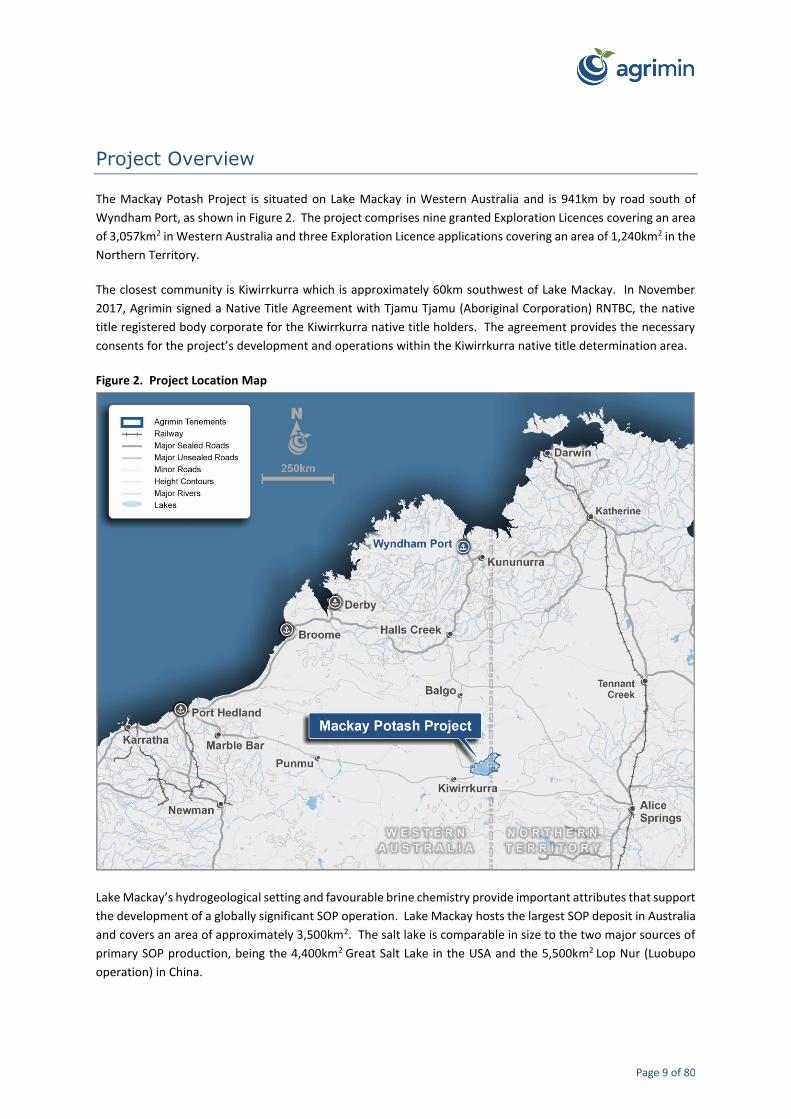
Project Overview
The Mackay Potash Project is situated on Lake Mackay in Western Australia and is 941km by road south of
Wyndham Port, as shown in Figure 2. The project comprises nine granted Exploration Licences covering an area
of 3,057km2 in Western Australia and three Exploration Licence applications covering an area of 1,240km2 in the
Northern Territory.
The closest community is Kiwirrkurra which is approximately 60km southwest of Lake Mackay. In November
2017, Agrimin signed a Native Title Agreement with Tjamu Tjamu (Aboriginal Corporation) RNTBC, the native
title registered body corporate for the Kiwirrkurra native title holders. The agreement provides the necessary
consents for the project’s development and operations within the Kiwirrkurra native title determination area.
Figure 2. Project Location Map
Lake Mackay’s hydrogeological setting and favourable brine chemistry provide important attributes that support
the development of a globally significant SOP operation. Lake Mackay hosts the largest SOP deposit in Australia
and covers an area of approximately 3,500km2. The salt lake is comparable in size to the two major sources of
primary SOP production, being the 4,400km2 Great Salt Lake in the USA and the 5,500km2 Lop Nur (Luobupo
operation) in China.
Page 10 of 80
Project Development Plan
As shown in Figure 3, the Mackay Potash Project will include the development of the following key components:
• On-lake infrastructure: brine extraction trenches, solar evaporation ponds and salt harvesters;
• Off-lake site infrastructure: processing plant, power station, process water borefield and associated site
facilities; and
• Logistics infrastructure: sealed haul road, port storage facility and barge loading facility.
The SOP production process commences with the extraction of brine from Lake Mackay using a network of
shallow trenches. The brine will be transferred along the trenches into a series of solar evaporation ponds
located on the salt lake’s surface.
Raw potash salts will crystallise on the floors of the ponds and will be collected by wet (floating) harvesters. The
salts will be pumped as a slurry to the processing plant located off the edge of the salt lake. The plant will be
operated by a fly-in fly-out workforce and powered by a hybrid gas, solar, wind and battery solution. Process
and potable water will be supplied from a borefield installed to the south of the salt lake.
The processing plant will produce finished SOP fertiliser that is ready for direct use by customers. The SOP will
be hauled by a fleet of purpose-built road trains to a dedicated storage facility at Wyndham Port. At the port,
the SOP will be loaded via an integrated barge loading facility for shipment to customers.
Figure 3. Schematic of Key Project Components
The material assumptions and outcomes of the DFS are presented in Table 3.
Page 11 of 80
Table 3. Definitive Feasibility Study – Material Assumptions and Outcomes
Variable Unit Value
Physicals:
Life of Mine SOP Extracted Mt 21.6
Life of Mine years 40
Average Brine Volume Extracted GL/a 86
Average Brine Grade Extracted mg/L K 2,820
Raw Potash Salts Harvested Mtpa 3.0
Raw Potash Salts Salt Grade K2O 14%
SOP Production Rate ktpa 450
SOP Product Grade K2O 52%
Operating Parameters:
Overall Potassium Recovery % 80
Annual Process Plant Operating Time hours 8,000
Average Process Water Demand GL/a 3.2
Average Power Demand MW 16
Scope 1 and 2 Emissions of CO2-e ktpa 71
Pre-Production Capital Costs:
Site Processing & Non-Process Infrastructure US$M 236
Off-site Logistics Infrastructure US$M 108
Indirects & Contingency US$M 71
Total Capital Cost US$M 415
Steady-State Operating Costs:
Mine Gate US$/t 84
Haulage, Handling & Shiploading US$/t 75
Total Cash Cost US$/t FOB 159
Royalties & Corporate US$/t 9
Sustaining Capital US$/t 17
All-In Sustaining Cost US$/t FOB 185
Financial Metrics (Real):
Flat SOP Price US$/t FOB 500
Exchange Rate AUD:USD 0.65
Post-Tax NPV8, real US$M 655
Post-Tax IRR % 21
Annual EBITDA US$M 145
Post-Tax Payback Period years 4.2
Page 12 of 80
Environmental, Social and Governance
Agrimin is committed to developing the Mackay Potash Project sustainably and in alignment with the United
Nations Sustainable Development Goals, as outline in Figure 4. The Company’s commitment is embodied
throughout the DFS and has been demonstrated through six years of positive stakeholder engagement.
Figure 4. Alignment with the United Nations Sustainable Development Goals
Goal Agrimin’s Alignment
Zero
Hunger
We aim to establish a globally important supply of sustainable fertiliser that can improve global agricultural productivity and assist developing countries to achieve food security.
Good Health
and Well-Being
We strive to provide a safe work place for our employees and the communities in which we operate. Their health and well-being is our paramount focus.
Quality
Education
We have a planned program of training and education opportunities within our local communities which are designed to improve accessibility to the jobs that will be created over the life of our operations.
Gender
Equality
We aspire to provide a positive and inclusive team environment. We recognise the importance of improving gender representation in the roles we create.
Decent Work
and Economic
Growth
We aim to empower local communities by creating jobs and supporting training programs throughout all phases of our operations to ensure economic benefits endure locally over the long-term.
Industry,
Innovation and
Infrastructure
We will develop important regional infrastructure that will create economic and social opportunities through better connectivity for remote communities.
Reduced
Inequalities
We seek to provide jobs and economic opportunities for Indigenous people living in our country’s most isolated communities. We firmly believe our operations can be a catalyst for an improved quality of life.
Responsible
Consumption
and Production
We have designed a sustainable and low impact production process to ensure that our operations minimise the consumption of water, energy and other materials.
Climate
Action
We aim to achieve a high penetration of renewable energy in our operations and we are proud that our fertiliser will have one of the lowest carbon footprints associated with any major macro-nutrient fertiliser.
Life on
Land
We are committed to protecting the environment and minimising the impact on the biodiversity within the ecosystems we operate. Globally, we aim for our fertiliser to reduce the environmental impact of agriculture.
Peace, Justice
and Strong
Institutions
We are committed to acting in a transparent, accountable and responsible manner throughout all of our business dealings. We operate to high levels of corporate governance and intend to grow these with our business.
Page 13 of 80
Mineral Resource Estimate
Agrimin appointed Stantec to complete the Mineral Resource estimate, Ore Reserve and DFS mine planning for
the project. Stantec’s USA based hydrogeological team has significant experience in relation to brine-hosted
potash deposits around the world.
An updated Mineral Resource estimate was reported by Agrimin in January 2020 and was completed in
accordance with the JORC Code (2012 Edition) and the AMEC Brine Guidelines. The estimation methodology
was based on procedures that have been established and progressively developed by hydrogeologists and
regulators, building on the many years of experience and knowledge from exploring and reporting on brine
deposits elsewhere around the world. The updated Mineral Resource was the culmination of several years of
fieldwork and used the latest exploration techniques to derive an industry-leading hydrogeological dataset.
Lake Mackay is a brine-hosted potash deposit in a closed basin, salt lake setting. The Mineral Resource is based
on the dimensions of the lakebed sediments, the variations in porosity (void space) and the potassium grade
within the groundwater. An understanding of the physical properties of the lakebed sediments and the overall
aquifer hydraulics has also been considered when assessing extractability of the Mineral Resource.
The drainable porosity (or specific yield) Mineral Resource contains 123Mt of SOP to a maximum depth of 211m,
as detailed in Table 4. This drainable porosity Mineral Resource represents the static free-draining portion of
the total porosity Mineral Resource prior to extraction. It does not take into account the impact of any
groundwater recharge or solute transport which increases the amount of extractable brine above the static free-
draining component over time.
The total porosity Mineral Resource contains 1,096Mt of SOP to a maximum depth of 211m. A portion of the
total porosity Mineral Resource, in addition to the drainable porosity Mineral Resource, is considered to be
extractable dependent on the transient groundwater flow and transport conditions affecting the Mineral
Resource during extraction and the active rainfall and runoff recharge regime within the salt lake system. This
recharge is particularly relevant to the upper zones of the Mineral Resource and has been assessed as a
component of the dynamic hydrogeological modelling which was used to determine the Ore Reserve and DFS
mine plan. Accordingly, the potassium grade of the Mineral Resource is effectively the starting grade of the
mine plan and is not directly comparable to the life of mine grade determined for the Ore Reserve.
Dual-Domain Mass Transfer Coefficient (1/day) 0.01 0.01 0.01 0.01 0.01
The extraction trench network applied to the mine plan balances the goal of achieving the target annual mass
of SOP to the evaporation ponds with maintaining higher brine potassium grades to limit total flow to the ponds.
This is achieved by implementing the trenching network across 17 BMU’s, which are based primarily on similar
hydraulic and recharge properties. The brine extraction will include gravity drainage of brine into east-west
orientated infiltration trenches which will flow into larger north-south orientated second order trenches that
will gravity feed brine into the main feed canal that will be used to transfer brine to the evaporation ponds.
Brine extraction is achieved by the construction of trenches into the UZT and UZB horizons. The trenches are
designed with an average depth of 4.5m below ground surface, to facilitate flow from the surrounding UZ
horizon. Brine extraction levels are assumed to be limited to 3.0m below ground surface, or the base of the
UZT, throughout the simulated life of mine.
Brine extraction from a BMU is at the initial average potassium concentration (K+) adjacent to the extraction
trenches within the BMU during the period when mobile-phase brine is extracted. The potassium concentration
of the extracted brine decreases over time, as the drainable porosity in the BMU is mined out and replaced by
freshwater recharge from infiltration of precipitation. This creates a concentration gradient between the native
brine in the non-drainable porosity (capillary brine) and the relatively fresher recharged porosity. Transfer of
potassium from the non-drainable porosity into the drainable porosity occurs via mass transfer due to this
concentration gradient and via mixing of recharge water with capillary brine. The processes of mass transfer
and mixing of the capillary and non-capillary brine, allows for production of ions from the non-drainable fraction
over the duration of the mine plan. As potassium concentrations extracted from a BMU decrease, subsequent
BMUs are constructed to maintain higher potassium concentrations.
The mine plan schedule has BMUs starting in the higher hydraulic conductivity areas in the eastern portion of
the lakebed. BMUs that are depleted over time due to brine production and dilution from freshwater recharge
are sequentially closed and new BMUs are opened. The sequencing of the BMU’s has been designed to achieve
brine flows and potassium concentrations that meet the constant mass target of 540ktpa of SOP.
Page 48 of 80
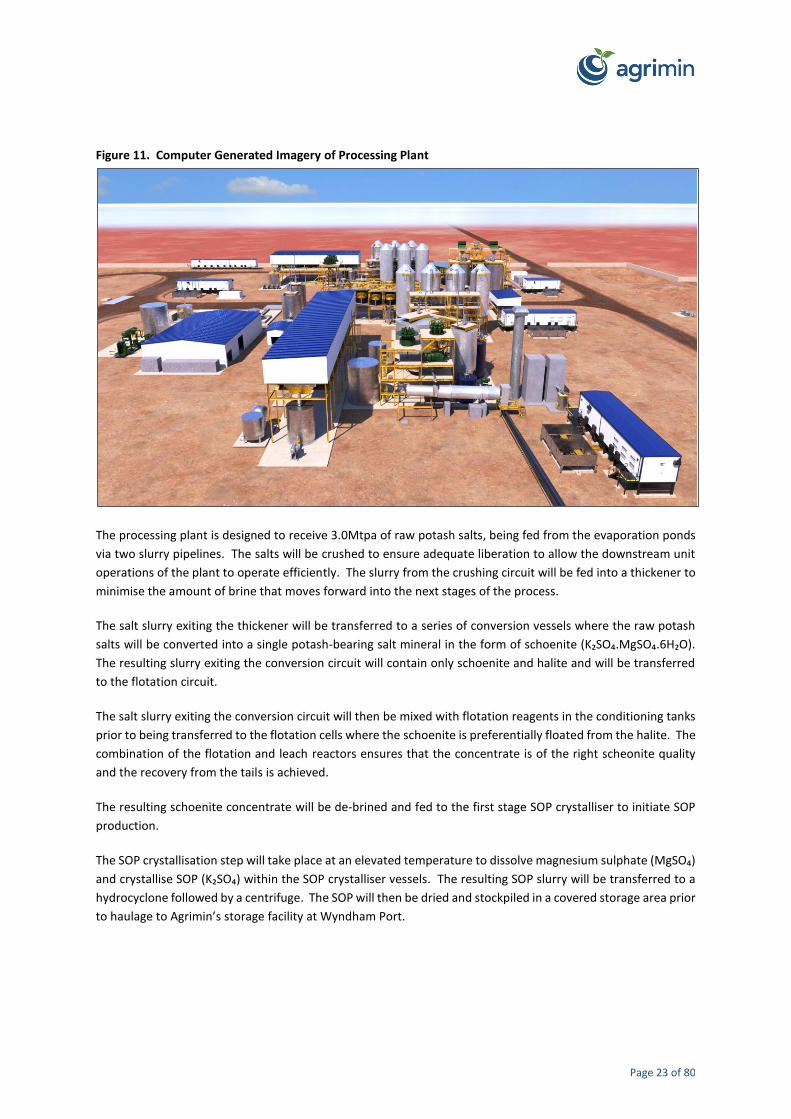
Processing (including Metallurgical) – Refer to the sections entitled “Solar Evaporation Ponds”, “Salt Harvesting”
and “Processing Plant” in this ASX Release
Agrimin engaged Novopro to complete the process design for the evaporation ponds and processing plant.
Stantec was engaged to complete the geotechnical assessment and civil engineering design of the ponds.
Primero was engaged to complete the DFS engineering design for the processing plant based on the process
design work completed by Novopro.
Agrimin completed an on-site evaporation pan test program at Lake Mackay between November 2018 and June
2020. This trial involved a set of five class A evaporation pans which contained brines at defined compositions
matching the future commercial scale ponds. The pan evaporation rates were measured on a daily basis for the
20 month duration of the program. The recorded evaporation rates during the pan test program were adjusted
based on long-term weather trends from the nearest meteorological weather station at the Giles Meteorological
Office. This extensive dataset was used for the DFS pond design.
Agrimin also completed an industry-leading continuous-flow pilot pond evaporation trial on Lake Mackay
between October 2018 and June 2020. The trial utilised a 3,000m2 pond system with brines being transferred
through the ponds under a daily transfer regime. The trial successfully demonstrated brine chemistry trends in
the pilot ponds that closely tracked the DFS pond model assumptions. Figure 22 presents the comparison of
analysed steady-state brine concentration recorded during the trial with modelled pond brine concentration
and salt precipitation.
Figure 22. Brine Concentration Curve – Pilot Trial Actual vs DFS Pond Model
The raw potash salts generated from the pilot ponds have undergone pilot processing tests at Bureau Veritas’
laboratory in Perth to produce both SOP and SOPM samples. The product samples produced are very high-
quality with an average SOP grade of 53% K₂O and average SOPM grade of 24% K₂O plus 11% MgO, both with
low-levels of impurities. Chemical assays for heavy metals, particle size distributions, angles of repose, density
and solubility tests have all been conducted on the products. In addition, during both the PFS and DFS phases
extensive evaporation and process testwork was completed by Saskatchewan Research Council at its laboratory
in Saskatoon, Canada.
Page 49 of 80
Novopro completed the process design work which has estimated an overall process recovery in excess of 80%
from brine extraction to SOP production at steady-state, with the value of 80% adopted for the DFS.
The evaporation pond system has been designed to produce raw potash that will be collected by wet harvesters
and pumped to the processing plant. Agrimin engaged multiple equipment manufacturers to provide
engineering designs and cost estimates for the harvesters and associated pipelines. Harvesters are not a
commonly manufactured machine for the denser potassium-bearing salts, namely kainite and schoenite. As
such and in order to better understand the salt properties and forces required to crush the salt into a pumpable
slurry, raw potash salt samples were collected from Agrimin’s pilot evaporation ponds on Lake Mackay and
physical testing was performed in order to understand the cutting forces for the auger design.
Infrastructure – Refer to the sections entitled “Site Infrastructure”, “Water Supply”, “Power Supply”, “Haul Road
and Product Haulage” and “Wyndham Port and Shiploading” in this ASX Release
Agrimin is well advanced in respect of securing the project’s key infrastructure requirements including water,
power, roads and port.
The project’s process and potable water requirement of 3.2GL/a is proposed to be abstracted from a borefield
located 45km south-east of the processing plant. During the DFS, the Company completed a program of water
bore drilling, airlifting and downhole geophysical surveying (Nuclear Magnetic Resonance) at four sites within
the proposed borefield area. The program successfully intersected two extensive aquifer units consisting of
alluvium and unconsolidated to consolidated sands to a depth of 110m, with typical airlift yields of seven litres
per second. The raw water quality ranged from fresh to brackish, averaging 2,600mg/L of total dissolved solids
across the four sites. This data was used by CDM Smith Inc. to develop the numerical groundwater model that
supported the project’s water supply requirements.
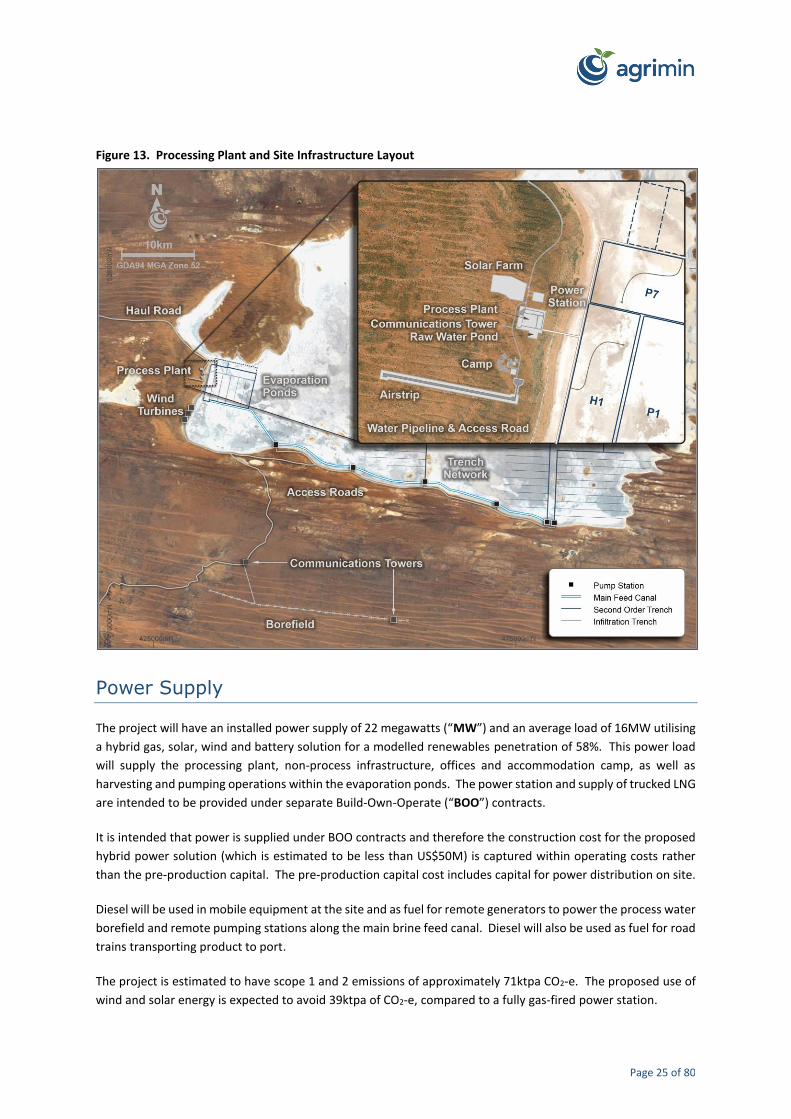
The project’s installed power requirement of 22MW, with an average load of 16MW, is proposed to be
generated using a hybrid gas, solar, wind and battery solution for a modelled renewables penetration of 58%.
This power load will supply the processing plant, non-process infrastructure, offices and accommodation camp,
as well as harvesting and pumping operations within the evaporation ponds. Agrimin has received an indicative
proposal from a well-recognised service power provider to deliver the project’s power station under a BOO
arrangement. Additionally, an indicative proposal for LNG fuel has been supplied by the Woodside Energy (LNG
Fuels and Power) Pty Ltd and EDL LNG Fuel to Power Pty Ltd Joint Venture, for the delivery and storage of LNG
at the project site under a BOO arrangement.
The project’s SOP is proposed to be transported via a 941km haulage corridor to Wyndham Port. This corridor
will involve the construction of a new 346km sealed haul road to connect the processing plant to the existing
public road network. During the DFS, Agrimin completed an a 1km spaced geotechnical sampling program,
LiDAR topography survey, borrow pit and water bore investigations, environmental surveys and heritage
surveys. This extensive dataset was used by Coffey to complete the engineering design for the haul road. Road
haulage and road maintenance services for the project’s SOP production are proposed to be provided via a
Haulage Joint Venture Agreement with Newhaul Pty Ltd. In December 2019, Agrimin and Newhaul Pty Ltd
formed a 50:50 incorporated joint venture named Newhaul Bulk Pty Ltd.
The project’s SOP is proposed to be shipped from Wyndham Port. Agrimin has executed an Option Agreement
to purchase Lot 701 Barytes Road at Wyndham Port, Western Australia. Lot 701 is a freehold property and
represents a 17 hectare waterfront site that will host the Company’s proposed SOP storage facility at the port.
The project will also involve a conveyor and jetty (i.e. the barge loading facility) to be constructed adjacent to
Page 50 of 80
Lot 701. During the DFS, the Company completed geotechnical and topographic work programs across Lot 701
and this data was used by Q Design & Construct for the engineering design of the storage facility and by TSA for
the engineering design of the barge loading facility. Agrimin has signed a Memorandum of Understanding with
TSA in relation to the provision of barge loading services for the project’s SOP production. The barge loading
facility has been designed to provide a bulk shiploading solution that is specifically tailored to the Company’s
SOP fertiliser products.
Economic – Refer to the sections entitled “Capital Costs”, “Operating Costs” and “Financial Analysis” in this ASX
Release
The DFS capital cost estimate was compiled by Agrimin’s owners team using a combination of cost estimates
from contractors and suppliers, historical data, reference to recent comparable projects and benchmarked
construction costs for Western Australia. The costs are presented in real terms as at Q1 2020. The cost
estimates have been prepared to AACE Class 3 standard and have a -15% to +20% level of accuracy. The capital
cost estimate includes the cost of all services, direct costs, contractor indirect, owners costs, site non-process
infrastructure, off-site logistics infrastructure and other facilities used to support the operation.
The DFS operating cost estimate was also compiled by Agrimin’s owners team using a combination of direct
contractor and supplier quotes, first principles build-up and benchmarked unit rates applicable for Western
Australia. The cost estimates have been prepared to AACE Class 3 standard and have a -15% to +20% level of
accuracy.
The financial analysis includes costs in relation to corporate overheads, taxation, government and native title
royalties, sustaining capital works and rehabilitation and mine closure.
Agrimin has formed the view that there is a reasonable basis to believe that requisite future funding for
development of the Mackay Potash Project will be available when required. There are a number of grounds on
which this reasonable basis is established, including:
• There is currently a trend of large integrated fertiliser companies seeking a reliable and conscionable
supply of SOP and alternative sources from the environmentally unfriendly Mannheim.
• The technical and financial parameters detailed in the DFS are highly robust and economically
attractive. The project is also located in the highly established and low-risk mining jurisdiction of
Western Australia.
• Agrimin is debt free and owns 100% of the Mackay Potash Project. The Company has an uncomplicated,
clean corporate and capital structure. The project also has support from Australia’s largest
superannuation fund, AustralianSuper, which is Agrimin’s largest shareholder.
• The Northern Australia Infrastructure Facility (“NAIF”) Board has previously expressed its interest in
investigating the potential for NAIF support for the Mackay Potash Project with particular reference to
Agrimin’s proposed infrastructure. The NAIF could potentially provide concessional longer term debt
finance for the project. The NAIF is a corporate Commonwealth entity with the objective to provide
financial assistance for the construction of infrastructure to benefit northern Australia. The NAIF is an
integral part of the Australian Government's strategy to develop northern Australia.
Page 51 of 80
• The project’s forecast SOP production remains 100% uncontracted with no private royalties (other than
native title), encumbrances or other claims. These are all factors that are expected to be highly
attractive to potential off-takers and strategic investors.
• Agrimin’s Board and management team is highly experienced in the broader resources industry. The
directors of Agrimin have a track record of creating S&P/ASX 200 resource companies and successfully
developing large-scale mining projects, including brine operations.
Marketing – Refer to the section entitled “Product Specifications and Marketing” and “Market Analysis and
Pricing” in this ASX Release
The project’s off-take remains 100% uncontracted and following the completion of this DFS the Company has a
view to committing the majority of the project’s planned production under binding off-take agreements.
Independent SOP market forecasts and assessments were provided by CRU Group. These forecasts support
Agrimin’s view of the demand and supply fundamentals and indicate that the Mackay Potash Project will
contribute approximately 7% of global SOP supply at its full production rate.
The DFS has assessed the economics of producing only a standard SOP product, although the project’s product
mix will ultimately be determined by off-takers and customers. The Company’s price and volume forecasts for
standard SOP products around the world are based on analysis by CRU Group, as well as private information
gathered from meetings with fertiliser producers, distributors, traders and end-users.
The development of Agrimin’s SOP product specification sheets is supported by process testing undertaken at
Saskatchewan Research Council’s laboratory in Saskatoon, Canada and at Bureau Veritas’ laboratory in Perth.
These testing programs have produced large quantities of SOP samples with an average grade of 53% K₂O and
low-levels of impurities.
Agrimin has been actively marketing its SOP products to interested parties and multiple batches of product
samples have been distributed internationally. Chemical analysis undertaken by these parties has confirmed
that Agrimin’s SOP product specifications compare extremely well against existing SOP products in the market.
Legal, Environmental, Social and Governmental – Refer to the sections entitled “Environmental, Social and
Permitting”, “Native Title and Heritage” and “Mining Tenements” in this ASX Release
Agrimin holds a 100% interest in the Mackay Potash Project under a simple and clean ownership structure, with
no private royalties (excluding the native title royalty), encumbrances or other claims.
The project development area comprises nine granted Exploration Licences and various Miscellaneous Licences
in Western Australia. Agrimin intends to lodge a Mining Lease application in-line with its proposed development
schedule for the project. The Company has signed a Native Title Agreement with the Kiwirrkurra native title
holders which provides the necessary consents for DMIRS to grant the Mining Lease. Additionally, Agrimin
intends to apply for Miscellaneous Licences covering the haul road alignment and will be required to sign Native
Title Agreements with the Ngururrpa and Tjurabalan native title holders prior to the Miscellaneous Licences
being granted by DMIRS.
Any development proposals in Western Australian that are likely to have a significant impact on the environment
are required to be referred to the Western Australian EPA for assessment. In January 2019, Agrimin referred
Page 52 of 80
the project to the EPA which set the level of assessment was set at a Public Environmental Review. In addition,
a person must not take an action that has, will have, or is likely to have a significant impact on any of the Matters
of National Environmental Significance. Therefore in January 2019, Agrimin also referred the project to the
Commonwealth DAWE which determined the project is a controlled action and will be assessed by an accredited
assessment under the EP Act. The formal Environmental Impact Assessment process is currently underway for
the Mackay Potash Project.
Environmental surveys and studies completed by Agrimin have not identified any environmental factors that
could constitute insurmountable obstacles in obtaining necessary statutory approvals within the timeframes
anticipated in the DFS. Agrimin has engaged extensively with local communities, government agencies (Local,
State and Federal), special interest groups and the national mainstream media. The project has not encountered
any opposition or significant concerns from these parties.
JORC Code, 2012 Edition – Table 1
Section 1 Sampling Techniques and Data
(Criteria in this section apply to all succeeding sections.)
Criteria JORC Code explanation Commentary
Sampling techniques
• Nature and quality of sampling (eg cut channels, random chips, or specific specialised industry standard measurement tools appropriate to the minerals under investigation, such as down hole gamma sondes, or handheld XRF instruments, etc). These examples should not be taken as limiting the broad meaning of sampling.
• Include reference to measures taken to ensure sample representivity and the appropriate calibration of any measurement tools or systems used.
• Aspects of the determination of mineralisation that are Material to the Public Report.
• In cases where ‘industry standard’ work has been done this would be relatively simple (eg ‘reverse circulation drilling was used to obtain 1 m samples from which 3 kg was pulverised to produce a 30 g charge for fire assay’). In other cases more explanation may be required, such as where there is coarse gold that has inherent sampling problems. Unusual commodities or mineralisation types (eg submarine nodules) may warrant disclosure of detailed information.
• Brine samples were collected over the various field programs by airlifting with the drilling rig or by pumping or bailer samples from the drill holes. The results of the sample populations from each sampling technique have been compared statistically.
• Brine samples from aircore drilling were taken from the cyclone during airlifting the hole, and from bailed (tube with a non-return valve to prevent brine escape) or pumped samples when monitoring bores were installed in the holes.
• Brine samples taken by airlift, bailing and pumping are considered composite samples from the phreatic surface, as brine from all levels of the stratigraphic sequence contributes to the brine sample composition. These samples are considered representative of brine that will flow into trenches or bores during brine extraction from the resource.
• Samples of brine extracted from sediment core samples provide information on potassium, magnesium and sulphate concentrations in the sediments and were used as a check on brine grades from the other sampling methods.
• A significant number of the drill holes
Page 53 of 80
Criteria JORC Code explanation Commentary
completed across the project area had 50mm monitoring bores installed for future monitoring and brine sampling.
• The core samples were retrieved in plastic tubes (in the place of triple tubes) or Shelby tubes and sealed to ensure the unconsolidated sediments and entrained brine were recovered.
• During trench excavations, sediment samples were collected from the excavator bucket at regular intervals to assess the lithology of the trenches at different depths.
• During pumping tests, brine samples were collected into clean sample bottles from discharge hosing on the pump units at regular intervals, representing a composite brine sample from the trench or bore.
• A number of 2015 and 2016 holes were twinned and sampled. In addition, a transect of holes with a closer spacing than the 5km grid drilling, were drilled with a spacing from 200m to 800m and sampled to evaluate short range variability in brine concentration and lithology. Additional close spaced drilling around trenches was completed in the 2019 sonic drilling program.
• Brine samples were generally taken in 1L bottles directly from the bailer, pump or cyclone, so no sub-sampling was carried out. These were filtered in the laboratory prior to analysis, with the measurement of physical parameters and analysis by industry standard techniques that are applicable to brine analysis.
Drilling techniques
• Drill type (eg core, reverse circulation, open-hole hammer, rotary air blast, auger, Bangka, sonic, etc) and details (eg core diameter, triple or standard tube, depth of diamond tails, face-sampling bit or other type, whether core is oriented and if so, by what method, etc).
• The project area has been subject to several drilling techniques over different field campaigns. Drilling campaigns required the use of small purpose-built auger core, aircore, diamond core and sonic core drilling rigs transported by helicopter sling loading or ATV between the drill sites.
• Excavation of the trenches was completed by a 25t amphibious excavator with an arm to excavate up to 12m deep. Monitoring bores were drilled using an auger attachment to the excavator to depths up to 6m.
Page 54 of 80
Criteria JORC Code explanation Commentary
• Auger core drilling was undertaken with a hollow stem auger in which the core was collected in plastic (triple) tubes in the centre of the augers, with the core barrel recovered with wireline and overshot.
• Aircore drilling used an aircore blade bit to cut through the sediments and the compressed air supply transported sediment samples to the surface with minimal injection of water into the holes.
• Most drill holes have been completed as 50mm monitoring bores or other variable diameter bores.
• Shelby tube and shallow auger samples were generally collected by hand or pneumatic hammer.
• The core was not orientated, and all holes were drilled vertically.
Drill sample recovery
• Method of recording and assessing core and chip sample recoveries and results assessed.
• Measures taken to maximise sample recovery and ensure representative nature of the samples.
• Whether a relationship exists between sample recovery and grade and whether sample bias may have occurred due to preferential loss/gain of fine/coarse material.
• The key sample material collected during and following drilling of holes is brine, in addition to the core samples. Lithological samples are important to provide an understanding of the sediment characteristics and to provide samples for physical properties measurements.
• There is not a relationship between the sediment sample recovery and brine grade and sediment core recovery was sufficient that it is unlikely to be biased for reasons of variable sediment sample recovery during aircore (or core) drilling.
• Auger core samples were recovered and measured for comparison to the length drilled (0.75m long core tubes). Core recovery was then calculated for each core tube. The plastic tubes act like triple tubes to maximise sample recovery, but allow the cores to be sealed immediately following recovery to prevent brine loss. Cores were cut to the length of recovered core if less than 0.75m.
• Overall core recovery from the auger core drilling was 88%, mostly influenced by the presence of gypsum bands which caused cores to collar off in the tubes, with core below the gypsum bands lost by washing during drilling of the remaining part of the core run.
Page 55 of 80
Criteria JORC Code explanation Commentary
• Core recovery was not applicable to aircore drilling. It is unknown whether core recovery was measured by Toro Energy Ltd as part of vibracore sampling conducted in the south of the lake.
• Aircore brine samples were recovered via air pressure forcing water up the drill rods, through the cyclone or outside return, with samples collected in buckets and transferred into 1L bottles.
• Aircore brine samples were only obtained when water was free flowing after a rod change and composite samples were only obtained at the bottom of the hole in many cases.
• Aircore sediment samples were collected from the cyclone and logged and placed in chip trays and sealed bags on 3m intervals, with increased detail in the upper 2m.
• Due to the wet and sometimes sticky, plastic nature of the sediments it was not practical to weigh sample buckets for 3m intervals.
• Diamond core recovered PQ3 and HQ drill core via wireline core barrel and contained within core trays. Core recovery was observed to be adequate for characterisation of lakebed sediments.
• Sonic drilling samples were retrieved directly from the rod string. Only 3 of the 22 drill holes did not retrieve core. For holes that did retrieve core the recovery was good at greater than 80%, though some swelling of the clay after retrieval was observed.
• Column test holes samples were retrieved from Shelby tubes. Core recovery was adequate for column tests.
• Not applicable to trenching.
Logging • Whether core and chip samples have been geologically and geotechnically logged to a level of detail to support appropriate Mineral Resource estimation, mining studies and metallurgical studies.
• Whether logging is qualitative or quantitative in nature. Core (or costean, channel, etc) photography.
• All trenches and drill holes were logged for hydrogeological characteristics, including descriptions of lithology, sediment grain size, colour, general observations and flow rates.
• A qualified hydrogeologist/geologist logged all samples.
• All core trays were photographed for comparison purposes.
Page 56 of 80
Criteria JORC Code explanation Commentary
• The total length and percentage of the relevant intersections logged.
• During aircore drilling snap top sample bags and chip trays were photographed as a permanent record of sample intervals.
• Because clays can cause some smearing in the core tubes during drilling a number of core holes were frozen in a Perth laboratory and split to allow more detailed logging and evaluation of small-scale structures in the core.
Sub-sampling techniques and sample preparation
• If core, whether cut or sawn and whether quarter, half or all core taken.
• If non-core, whether riffled, tube sampled, rotary split, etc and whether sampled wet or dry.
• For all sample types, the nature, quality and appropriateness of the sample preparation technique.
• Quality control procedures adopted for all sub-sampling stages to maximise representivity of samples.
• Measures taken to ensure that the sampling is representative of the in situ material collected, including for instance results for field duplicate/second-half sampling.
• Whether sample sizes are appropriate to the grain size of the material being sampled.
• Cores were collected for the purposes of lithological logging and physical properties testing. The cores were systematically sampled for a suite of properties including total porosity, specific yield, density, permeability and grain size data using systematic (non-selective) intervals of full core.
• Brine samples were collected by airlifting with the drilling rig or by pumping or bailer sampling. The brine was mixed during the sampling process. Due to the helicopter supported nature of much of the drilling campaigns it was necessary to sample bores during and immediately following drilling and bore installation. It was not always possible to purge 3 bore volumes of brine from the holes prior to sampling, with the exception of airlifting of a limited number of aircore holes.
• Representative brine samples are taken from the trenches by pumping, with a surface mounted pump.
• The brine sampling methods are considered appropriate for the circumstances. As a quality control procedure, the auger core samples have been validated by the collection of brine extracted from the cores.
• Field duplicates of brine samples were taken during pumping, bailing or airlifting of samples.
• 10cm core sub-samples are considered appropriate for the laboratory test work, as are 1L brine samples for the brine analyses.
Quality of assay data and laboratory tests
• The nature, quality and appropriateness of the assaying and laboratory procedures used and whether the technique is considered partial or total.
• Nature of quality control procedures
• The samples collected were analysed for elemental assay at the Intertek Genalysis or Bureau Veritas laboratories in Perth, both of which are reputable independent laboratories.
Page 57 of 80
Criteria JORC Code explanation Commentary
adopted (eg standards, blanks, duplicates, external laboratory checks) and whether acceptable levels of accuracy (ie lack of bias) and precision have been established.
• The technique of analysis used is Inductively Coupled Plasma Optical (Atomic) Emission Spectrometry for cations and sulphur, UV visible spectrometry for chloride, gravimetric analysis for Total Dissolved Solids. Sulphate concentration was calculated from the sulphur analysis.
• Quality control procedures were in place throughout the analyses process, including the use of blanks, duplicates and laboratory certified standards.
• Check samples were analysed at another independent laboratory for the various field programs as an independent check on the results, acting as triplicate analyses. See this ASX Release for further details of laboratories used.
• Quality control data indicates the brine results are acceptable for resource estimation.
Verification of sampling and assaying
• The verification of significant intersections by either independent or alternative company personnel.
• The use of twinned holes.
• Documentation of primary data, data entry procedures, data verification, data storage (physical and electronic) protocols.
• Discuss any adjustment to assay data.
• Qualified hydrogeologists and geologists have carried out the field programs.
• Results have been verified by independent consulting hydrogeologists and geologists.
• There are 22 duplicate pairs in sampling across the lake where brine samples from different drilling techniques have been compared, with both Agrimin and Verdant Resources Ltd data. The Verdant Resources Ltd twin holes show a higher level of variation, which is likely to be in part related to the aircore drilling following a period of heavy rain.
• Twinned hole transects of auger core holes and power auger holes were used to evaluate variability in brine concentration over shorter distances.
• In 2019, an additional 11 infill holes were completed surrounding Trench 20, and 11 holes surrounding Trench 22. These infill holes varied in spacing from 0.5km to 1.5km to assess short range variability.
• Brine analytical results are received from the laboratory in digital format to prevent transposition errors.
• Analysis of brine from pump tests on select holes provides a check on the analyses of the composite sample taken
Page 58 of 80
Criteria JORC Code explanation Commentary
during drilling and trenching.
• Data is stored in Excel format with regular backups/copies created.
• The concentrated nature of the brines requires the laboratory to dilute sub-samples to allow analysis. The results are then corrected for dilution factors by the laboratory before results are reported.
Location of data points
• Accuracy and quality of surveys used to locate drill holes (collar and down-hole surveys), trenches, mine workings and other locations used in Mineral Resource estimation.
• Specification of the grid system used.
• Quality and adequacy of topographic control.
• Drilling, trenching and sampling locations were surveyed using a handheld GPS system, with accuracy of +/- 5m.
• The grid system used was GDA94 in MGA Zone 52.
• The Company has acquired high resolution topographic data from the LiDAR survey that has vertical accuracy of +/-10cm. Sampling locations have been fixed to this surface as part of the resource modelling.
• The salt lake surface is generally flat lying so topographic control is not considered a critical point.
Data spacing and distribution
• Data spacing for reporting of Exploration Results.
• Whether the data spacing and distribution is sufficient to establish the degree of geological and grade continuity appropriate for the Mineral Resource and Ore Reserve estimation procedure(s) and classifications applied.
• Whether sample compositing has been applied.
• Drilling has been completed on an approximate 5km spacing or closer spacing across the salt lake.
• Trenches are broadly spaced at differing distances apart (generally 10km to 15km) to evaluate different geomorphological areas of the salt lake.
• Prior to 2019, most drilling was completed on a 5km grid, with some holes moved to avoid drilling on islands. In 2019, an additional 11 infill holes were completed surrounding Trench 20, and 11 holes surrounding Trench 22. These infill holes varied in spacing from 0.5km to 1.5km.
• No drilling has been conducted north of 7,540,000m North or east of the Western Australian border.
• The correlation of lithological and brine concentration data suggests drilling completed in the 5km grid and infill programs is sufficient to demonstrate the continuity of both lithology/geology and brine grades to estimate a resource for the project.
• All brine samples, from both drilling and trenching, are considered a composite from the water table to the depth they
Page 59 of 80
Criteria JORC Code explanation Commentary
are taken from i.e. a sample taken at the bottom of the hole is representative of the whole hole. The only exception is the brine extraction analyses from the auger core holes.
• The results from incremental brine extraction analyses from auger core holes validated the representivity of the composite sampling described above.
Orientation of data in relation to geological structure
• Whether the orientation of sampling achieves unbiased sampling of possible structures and the extent to which this is known, considering the deposit type.
• If the relationship between the drilling orientation and the orientation of key mineralised structures is considered to have introduced a sampling bias, this should be assessed and reported if material.
• The distribution of drilling, trenching and sampling locations is considered representative of the broad lakebed sediment deposit and profile.
• The lake sediments are a horizontally lying sequence and the sampling is perpendicular to this. Any structures of importance in the sediments are considered to be sub-horizonal.
• Some anisotropy in hydraulic parameters of the sediments is noted from the installation of monitoring bores on different sides of the trenches.
• No orientation or structural information was obtained, as the target is brine in the pores of unconsolidated lake sediments.
Sample security
• The measures taken to ensure sample security.
• All samples were clearly labelled and kept onsite prior to being transported to Perth or directly to laboratories located elsewhere, via secured freight or by company personnel, for analysis.
• Samples for assaying were submitted to an independent laboratory, with a chain of custody system maintained.
• Photographs of samples were maintained as a control in addition to copies of the Chain of Custody forms.
Audits or reviews
• The results of any audits or reviews of sampling techniques and data.
• No audits or reviews were conducted.
Section 2 Reporting of Exploration Results
(Criteria listed in the preceding section also apply to this section.)
Criteria JORC Code explanation Commentary
Mineral tenement and land tenure status
• Type, reference name/number, location and ownership including agreements or material issues with third parties such as joint ventures, partnerships, overriding royalties, native title interests, historical sites, wilderness or national park and environmental settings.
• The security of the tenure held at the
• The project is 100% owned by Agrimin Limited.
• The project tenure is held under granted Exploration Licences and Miscellaneous Licences in Western Australia: E80/4887, E80/4888, E80/4889, E80/4890, E80/4893, E80/4995, E80/5055, E80/5124,
Page 60 of 80
Criteria JORC Code explanation Commentary
time of reporting along with any known impediments to obtaining a licence to operate in the area.
E80/5172, L80/87, L80/88, L80/96 and L80/98 (application).
• The project tenements also include the following Exploration Licence applications in the Northern Territory: EL30651, EL31780 and EL31781.
• The project area lies within the Kiwirrkurra native title determination area. Tjamu Tjamu (Aboriginal Corporation) RNTBC is the native title registered body corporate for the Kiwirrkurra native title holders. Agrimin and Tjamu Tjamu have signed a Native Title Agreement which provides the necessary consents for the project’s development and operation within the Kiwirrkurra native title determination area.
• The project area is also subject to the Use and Benefit Aboriginal Reserves 24923 and 40783. The Company has been granted Mining Entry Permits from the Department of Aboriginal Affairs in order to access the Reserves for the purpose of the project’s development and operation.
Exploration done by other parties
• Acknowledgment and appraisal of exploration by other parties.
• Holocene Pty Ltd, Verdant Resources Ltd and Toro Energy Ltd have previously conducted exploration activities in the project area.
• Verdant Resources Ltd and Toro Energy Ltd conducted drilling programs in the southern tenements now held by Agrimin. A total of 22 vibracore holes were drilled in 2011 and a further 11 aircore holes were drilled in 2014. These results have now been incorporated into the Mineral Resource. Refer to the details in this ASX Release.
Geology • Deposit type, geological setting and style of mineralisation.
• The deposit type is brine-hosted potash within flat lying salt lake sediments.
Drill hole Information
• A summary of all information material to the understanding of the exploration results including a tabulation of the following information for all Material drill holes: o easting and northing of the drill hole
collar o elevation or RL (Reduced Level –
elevation above sea level in metres) of the drill hole collar
o dip and azimuth of the hole
• Refer to the various drilling, trenching and sampling tables in this ASX Release.
• Approximate RL of the lake is 360m. Refer to this ASX Release and tables.
Page 61 of 80
Criteria JORC Code explanation Commentary
o down hole length and interception depth
o hole length.
• If the exclusion of this information is justified on the basis that the information is not Material and this exclusion does not detract from the understanding of the report, the Competent Person should clearly explain why this is the case.
Data aggregation methods
• In reporting Exploration Results, weighting averaging techniques, maximum and/or minimum grade truncations (eg cutting of high grades) and cut-off grades are usually Material and should be stated.
• Where aggregate intercepts incorporate short lengths of high grade results and longer lengths of low grade results, the procedure used for such aggregation should be stated and some typical examples of such aggregations should be shown in detail.
• The assumptions used for any reporting of metal equivalent values should be clearly stated.
• Brine samples used in the Mineral Resource are all of hole composites obtained from sampling in open holes or installed bores, if a corresponding sample interval is not referred to.
• Brine samples from the trenches are the composite samples from inflow in the 100m long trenches.
• Results are reported as K2SO4, which is the combination of the available potassium with the available sulphate. The conversion factor from potassium is x 2.2285.
• Brine grades within lakebed lithologies outside of islands were applied a bottom cut of 1,500mg/l. Grades less that this 1,500mg/l were identified as anomalous, local and not representative of natural conditions. No top cut was applied.
Relationship between mineralisation widths and intercept lengths
• These relationships are particularly important in the reporting of Exploration Results.
• If the geometry of the mineralisation with respect to the drill hole angle is known, its nature should be reported.
• If it is not known and only the down hole lengths are reported, there should be a clear statement to this effect (eg ‘down hole length, true width not known’).
• Exploration drilling shows the brine aquifer to be continuous throughout the sediment profile to depth of 11m below the lakebed surface, defining the upper resource zone. Below 11m, the lower resource zone, targeted drilling and geophysical programs have identified a basement surface that truncates the sediment profile at depth.
• The lake sediment units are flat lying above the basement surface and all holes have been drilled vertically so it is assumed that the true width of mineralisation has been intersected in each hole/trench.
Diagrams • Appropriate maps and sections (with scales) and tabulations of intercepts should be included for any significant discovery being reported. These should include, but not be limited to a plan view of drill hole collar locations and appropriate sectional views.
• Refer to figures within this ASX Release.
Page 62 of 80
Criteria JORC Code explanation Commentary
Balanced reporting
• Where comprehensive reporting of all Exploration Results is not practicable, representative reporting of both low and high grades and/or widths should be practiced to avoid misleading reporting of Exploration Results.
• Results considered relevant have been reported.
Other substantive exploration data
• Other exploration data, if meaningful and material, should be reported including (but not limited to): geological observations; geophysical survey results; geochemical survey results; bulk samples – size and method of treatment; metallurgical test results; bulk density, groundwater, geotechnical and rock characteristics; potential deleterious or contaminating substances.
• Between 2017 to 2019 the Company completed airborne electromagnetic, ground gravity and 2D passive seismic survey transects across Lake Mackay and in the immediate surrounding area. These surveys have assisted in defining the basement topography of the lake and its surrounds.
• Indirect measurement of total porosity and specific yield were obtained from downhole geophysical NMR logs taken from Agrimin’s diamond and sonic drilling programs. The NMR log data is best suited to understanding of vertical trends in porosity and reflected observations of the lakebed lithology in drill cores.
Further work • The nature and scale of planned further work (eg tests for lateral extensions or depth extensions or large-scale step-out drilling).
• Diagrams clearly highlighting the areas of possible extensions, including the main geological interpretations and future drilling areas, provided this information is not commercially sensitive.
• Work associated with the Ore Reserve determination and the DFS for the project has been completed however ongoing monitoring of regional on-lake and off lake water levels and chemistry will continue for the foreseeable future.
Section 3 Estimation and Reporting of Mineral Resources (Criteria listed in section 1, and where relevant in section 2, also apply to this section.)
Criteria JORC Code explanation Commentary
Database integrity
• Measures taken to ensure that data has not been corrupted by, for example, transcription or keying errors, between its initial collection and its use for Mineral Resource estimation purposes.
• Data validation procedures used.
• Data was transferred directly from laboratory spreadsheets to the database.
• Data was checked for transcription errors once in the database, to ensure coordinates, assay values and lithological codes were correct.
• Drop down tables were used for spreadsheet entry, to minimise potential for data entry errors.
• Data was plotted to check the spatial location and relationship to adjoining sample points.
• Brine assays and porosity data have
Page 63 of 80
Criteria JORC Code explanation Commentary
been analysed and compared with other publicly available information for reasonableness.
• Comparisons of original and current datasets were made to ensure no lack of integrity.
Site visits • Comment on any site visits undertaken by the Competent Person and the outcome of those visits.
• If no site visits have been undertaken indicate why this is the case.
• The Competent Person has not conducted a site inspection of the property, however other qualified geologists and hydrogeologists who are members of Stantec have visited the site.
• The Competent Person has personally inspected and logged drill core samples from the 2019 field programs.
• A site visit was not deemed necessary by the Competent Person having observed drill cores from the 2019 program and experience on similar deposit types.
Geological interpretation
• Confidence in (or conversely, the uncertainty of) the geological interpretation of the mineral deposit.
• Nature of the data used and of any assumptions made.
• The effect, if any, of alternative interpretations on Mineral Resource estimation.
• The use of geology in guiding and controlling Mineral Resource estimation.
• The factors affecting continuity both of grade and geology.
• There is a high level of confidence in the geological model for the project. The geology is simple, with brine-hosted in flat lying, relatively uniform, lakebed sediments.
• Any alternative interpretations are restricted to smaller scale variations in sedimentology, principally in the upper unit.
• Similar sediments are reported in previously adjoining properties (that have now been incorporated into this Mineral Resource estimate) and other Australian salt lakes.
• Geology has been used to separate the deposit into different layers for the resource estimate. The upper sandy layer is more porous, beneath which there is a less porous unit overlying the lower clays that are again less porous, prior to reaching the coarser LZ3 sediments.
• Within the upper zone (UZ) the lakebed sediments are further separated into top and bottom sub-horizons labelled as UZT and UZB respectively in the figures in this ASX Release.
• The lower zone (LZ) sediments are separated into three sub-horizons labelled as LZ1, LZ2 and LZ3 in the figures in this ASX Release.
• These sub-horizon divisions were
Page 64 of 80
Criteria JORC Code explanation Commentary
introduced on account of subtle changes in lithostratigraphy with increasing depth from surface.
• Lake sediments are saturated in brine below 0.5m depth from surface which represents the average brine level during the dry season across the lakebed.
• A basement surface has been identified from drilling and geophysics, limiting the vertical extent of the lake sediments above. Lakebed sediments extend to a drilling depth of 150m where a basal paleochannel unit has been identified.
• The paleochannel is incised into the basement to a maximum depth of 211m. Beyond the extents of the paleochannel the basement surface rises gently towards the east to a depth of between 11m and 25m below surface in the shallowest parts.
• Islands are situated on the lakebed surface. These low relief islands (elevation from 362m to 370m) are interpreted to be aeolian in origin and are not included as part of the Mineral Resource estimate.
• Sedimentary processes affect the continuity of geology, whereas the concentration of potassium and other elements in the brine is related to water inflows, evaporation and brine evolution in the salt lake.
Dimensions • The extent and variability of the Mineral Resource expressed as length (along strike or otherwise), plan width, and depth below surface to the upper and lower limits of the Mineral Resource.
• The lateral extent of the resource has been defined by the boundary of the Company’s tenements, which have been trimmed to fit within the margins of the salt lake. Refer to the figures in this ASX Release.
• The top of the resource is defined by the surface of the lakebed and extends below islands at the same elevation between 361m and 362m (AMSL). The base of the resource is defined by the basements surface that varies in depth from 211m maximum to between 11m and 25m below lakebed surface. The resource remains open laterally outside of the Company’s tenements off the lake (where it is covered by sand dunes) and at depth.
• Agrimin’s current granted Exploration
Page 65 of 80
Criteria JORC Code explanation Commentary
Licences in Western Australia cover an area of: o 71.9km E-W. o 73.8km N-S. o Surface area of 3,120km2 in total. o Surface area of 2,701km2 on-lake
(including islands).
• Agrimin’s current Exploration Licences (all applications) in Northern Territory cover an area of: o 66.4km N-S o 32.6km E-W o Surface area of 1,236km2 in total. o Surface area of 646km2 on-lake.
• There is currently an approximate 100m gap between the Western Australia and Northern Territory tenements (on the Northern Territory side of the border) which is an artificial feature with tenements extending to the borders.
Estimation and modelling techniques
• The nature and appropriateness of the estimation technique(s) applied and key assumptions, including treatment of extreme grade values, domaining, interpolation parameters and maximum distance of extrapolation from data points. If a computer assisted estimation method was chosen include a description of computer software and parameters used.
• The availability of check estimates, previous estimates and/or mine production records and whether the Mineral Resource estimate takes appropriate account of such data.
• The assumptions made regarding recovery of by-products.
• Estimation of deleterious elements or other non-grade variables of economic significance (eg sulphur for acid mine drainage characterisation).
• In the case of block model interpolation, the block size in relation to the average sample spacing and the search employed.
• Any assumptions behind modelling of selective mining units.
• Any assumptions about correlation between variables.
• Description of how the geological interpretation was used to control the resource estimates.
• The estimates are generated from a layered grid model of the Lake Mackay lakebed sediments. The grid model was constructed using MineSight™ software (v15.60-1).
• The model covers the entire footprint of Lake Mackay. A grid node spacing of 200m by 200m was selected to capture the necessary topographic and grade resolution, plus other physical parameters, that would support a DFS level brine extraction study for SOP production.
• A surface topography grid was generated from LiDAR topography survey data and digital elevation model data using a triangulation algorithm.
• A separate lakebed-only topographic grid was developed that projected the lakebed surface horizontally beneath islands. This lakebed surface grid was used as a reference surface to project upper and lower zone horizon boundaries from surface to a solid basement below using software macros.
• The basement surface grid was developed from exploration data. The resource zone boundaries were truncated by the basement surface.
• Modelled physical parameters include surface precipitated salts, total porosity and specific yield. These parameters
Page 66 of 80
Criteria JORC Code explanation Commentary
• Discussion of basis for using or not using grade cutting or capping.
• The process of validation, the checking process used, the comparison of model data to drill hole data, and use of reconciliation data if available.
were assigned as fixed parameters within each horizontal resource horizon (zone). The assigned parameters per zone were determined using averages of the data sets and applications of appropriate top and bottom cuts.
• Within the saturated zones the potassium concentrations in the brine (mg/l) were estimated from composite sample intervals of respective lithostratigraphic zones as described in the geological interpretation. An inverse distance squared algorithm was used for the estimation using isotropic search ranges covering the extent of the model grid (105km by 84km).
• Under islands the upper zone brine grades were diluted using an island area-weighting formula developed from sample records.
• For the unsaturated zone at surface the ratio of potassium to total salts in the underlying saturated zone was used to estimate the potassium that would go into solution from the precipitated salt mass on surface.
• A number of additional elements or compounds were estimated, including Ca, Mg, Na, SO4, Cl and brine specific gravity.
• No assumptions were made regarding recovery of by-products.
• No assumptions were made regarding selective mining units.
• No assumptions were made about correlation between variables.
• The geological interpretation was used to define the thickness of the orebody and the lake outline was used to limit the reported resources, although mineralisation most likely extends beyond the lake boundary.
• The new model was compared visually and statistically to the drill hole data and found to reasonably represent the underlying data. There has been no production from the project, so no reconciliation data is available.
• The new model was also compared to the previous estimate and found to be compatible, taking into account the new data and differences in the geological
Page 67 of 80
Criteria JORC Code explanation Commentary
interpretation and estimation methodology.
Moisture • Whether the tonnages are estimated on a dry basis or with natural moisture, and the method of determination of the moisture content.
• Moisture content of the cores was measured, but as brine will be extracted this is not relevant for the Mineral Resource.
Cut-off parameters
• The basis of the adopted cut-off grade(s) or quality parameters applied.
• Brine grades within lakebed lithologies outside of islands were applied a bottom cut of 1,500mg/L. Grades less that this 1,500mg/L were identified as anomalous, local and not representative of natural conditions.
Mining factors or assumptions
• Assumptions made regarding possible mining methods, minimum mining dimensions and internal (or, if applicable, external) mining dilution. It is always necessary as part of the process of determining reasonable prospects for eventual economic extraction to consider potential mining methods, but the assumptions made regarding mining methods and parameters when estimating Mineral Resources may not always be rigorous. Where this is the case, this should be reported with an explanation of the basis of the mining assumptions made.
• The Mineral Resource has been quoted in terms of brine volume, grade and tonnage.
• No mining or recovery factors have been applied.
• The conceptual mining method is recovering brine from the salt lake via extraction trenches cut into the lakebed sediments.
• Mining recovery is expected to be significantly higher using trenches compared to bores.
• Detailed hydrogeological studies have been undertaken to define the extractable resources and extraction rates possible for the project.
Metallurgical factors or assumptions
• The basis for assumptions or predictions regarding metallurgical amenability. It is always necessary as part of the process of determining reasonable prospects for eventual economic extraction to consider potential metallurgical methods, but the assumptions regarding metallurgical treatment processes and parameters made when reporting Mineral Resources may not always be rigorous. Where this is the case, this should be reported with an explanation of the basis of the metallurgical assumptions made.
• Evaporation trials and process testwork have been undertaken using bulk samples of the project’s brine with representative chemistry.
• The testwork results demonstrated that the Lake Mackay brine is suitable for the production of commercial grade SOP using conventional processing techniques.
• The testwork produced SOP samples ranging from 52% to 54% K₂O, exceeding the typical grades for SOP products sold in global markets.
Environmental factors or assumptions
• Assumptions made regarding possible waste and process residue disposal options. It is always necessary as part of the process of determining reasonable prospects for eventual economic extraction to consider the potential environmental impacts of the mining and processing operation. While at this stage the determination of potential environmental impacts, particularly for
• The main environmental impacts expected to be incurred relating directly to the extraction of the Mineral Resource includes the drawn-down of the shallow brine aquifer, surface disturbance from the respective trench and pond networks, deposition of waste salts, and disruption to surface water flows. Other impacts will be associated with the broader project components
Page 68 of 80
Criteria JORC Code explanation Commentary
a greenfields project, may not always be well advanced, the status of early consideration of these potential environmental impacts should be reported. Where these aspects have not been considered this should be reported with an explanation of the environmental assumptions made.
and infrastructure.
• Agrimin’s Environmental Impact Assessment has identified the Preliminary Environmental Factors relevant to the project as Social Surroundings, Flora and Vegetation, Terrestrial Fauna, Subterranean Fauna and Inland Waters. Studies have been completed in relation to each of these factors with sufficient detail and certainty to support the submission of a Referral to the Western Australian EPA under Part IV of the Environmental Protection Act 1986.
• Environmental assessments to date suggest that the potential impacts to the relevant environmental factors can be managed to meet the EPA Objectives.
Bulk density • Whether assumed or determined. If assumed, the basis for the assumptions. If determined, the method used, whether wet or dry, the frequency of the measurements, the nature, size and representativeness of the samples.
• The bulk density for bulk material must have been measured by methods that adequately account for void spaces (vugs, porosity, etc), moisture and differences between rock and alteration zones within the deposit.
• Discuss assumptions for bulk density estimates used in the evaluation process of the different materials.
• Density measurements were taken as part of the drill core assessment process described in section 1. This included wet core density, brine density and dry solids density.
• However, no bulk density was applied to the estimates because resources are defined by volume.
Classification • The basis for the classification of the Mineral Resources into varying confidence categories.
• Whether appropriate account has been taken of all relevant factors (ie relative confidence in tonnage/grade estimations, reliability of input data, confidence in continuity of geology and metal values, quality, quantity and distribution of the data).
• Whether the result appropriately reflects the Competent Person’s view of the deposit.
• Semi-variograms generated from potassium concentration test results indicate that there is a statistical relationship between sample pairs at distance of up 10km. Using these observations as a guide, the Measured Mineral Resource was considered for ranges of up to approximately 2,500m from the nearest sample site and the Indicated Mineral Resource up to approximately 5,000km. The quantity, quality and distribution physical parameters plus overall geologic complexity were also used to guide resource confidence.
• The Mineral Resource directly below islands are classified as Inferred based on the quantity of data associated with
Page 69 of 80
Criteria JORC Code explanation Commentary
these areas.
• The potassium Mineral Resource exploration at Lake Mackay has focused on the upper zone located in Western Australia and this area contains the Measured and Indicated Mineral Resource within Agrimin’s tenements.
• The above scheme is considered to take appropriate account of all relevant factors, including the relative confidence in the volume and grade estimates, confidence in the continuity of geology and brine concentrations values, and the quality, quantity and distribution of the data.
• The classification appropriately reflects the Competent Person’s view of the deposit.
Audits or reviews
• The results of any audits or reviews of Mineral Resource estimates.
• The Mineral Resource was estimated by the Competent Person who is a full-time employee of Stantec. The Mineral Resource has been reviewed by other consultants employed at Stantec.
Discussion of relative accuracy/ confidence
• Where appropriate a statement of the relative accuracy and confidence level in the Mineral Resource estimate using an approach or procedure deemed appropriate by the Competent Person. For example, the application of statistical or geostatistical procedures to quantify the relative accuracy of the resource within stated confidence limits, or, if such an approach is not deemed appropriate, a qualitative discussion of the factors that could affect the relative accuracy and confidence of the estimate.
• The statement should specify whether it relates to global or local estimates, and, if local, state the relevant tonnages, which should be relevant to technical and economic evaluation. Documentation should include assumptions made and the procedures used.
• These statements of relative accuracy and confidence of the estimate should be compared with production data, where available.
• The relative accuracy of the Mineral Resource is reflected in the reporting of the Mineral Resources as per the guidelines of the JORC Code (2012).
• The statement relates to global estimates of volume, tonnages and grades.
• No production data is available for this resource.
Page 70 of 80
Section 4 Estimation and Reporting of Ore Reserves (Criteria listed in section 1, and where relevant in sections 2 and 3, also apply to this section.)
Criteria JORC Code explanation Commentary
Mineral Resource estimate for conversion to Ore Reserves
• Description of the Mineral Resource estimate used as a basis for the conversion to an Ore Reserve.
• Clear statement as to whether the Mineral Resources are reported additional to, or inclusive of, the Ore Reserves.
• Only the in-place Measured and Indicated Mineral Resource was used as the basis for the Ore Reserve.
• The Mineral Resource is inclusive of the Ore Reserve.
Site visits • Comment on any site visits undertaken by the Competent Person and the outcome of those visits.
• If no site visits have been undertaken indicate why this is the case.
• The Competent Person for the Ore Reserve undertook a site visit between 7-10th August 2018
• A comprehensive field work program was planned and compiled based on the observations obtained during the site visit.
• The competent person personally inspected the long-term trench pump testing during the site visit.
Study status • The type and level of study undertaken to enable Mineral Resources to be converted to Ore Reserves.
• The Code requires that a study to at least Pre-Feasibility Study level has been undertaken to convert Mineral Resources to Ore Reserves. Such studies will have been carried out and will have determined a mine plan that is technically achievable and economically viable, and that material Modifying Factors have been considered.
• The DFS has been completed over a three year period in order to report a Mineral Resource and to then convert the Mineral Resource to the Ore Reserve.
• Output from the mine plan production simulations using numerical models were tabulated and analysed to calculate the quantity of potassium and SOP Ore Reserves to the end of the 40 year production period.
• Only the in-place Measured and Indicated Mineral Resource was used in the determination of the Ore Reserve.
• These values were calculated using the numerical model outputs from the mine plan simulation and categorized by level of assurance into Proved and Probable Ore Reserves of K+ and equivalent SOP tonnages.
• A mine plan has been developed over a 40 year period, with an extraction brine volume ranging from 74 to 94GL/a of brine.
Cut-off parameters
• The basis of the cut-off grade(s) or quality parameters applied.
• No cut-off grades have been applied due to the homogeneity of the chemistry data and the proposed extraction method of brine from trenches.
• Brine grade depletion over a 40 year life of mine has been addressed in the mine plan by staggering excavation and
Page 71 of 80
Criteria JORC Code explanation Commentary
implementation of BMU’s over an 18 year period.
Mining factors or assumptions
• The method and assumptions used as reported in the Pre-Feasibility or Feasibility Study to convert the Mineral Resource to an Ore Reserve (i.e. either by application of appropriate factors by optimisation or by preliminary or detailed design).
• The choice, nature and appropriateness of the selected mining method(s) and other mining parameters including associated design issues such as pre-strip, access, etc.
• The assumptions made regarding geotechnical parameters (eg pit slopes, stope sizes, etc), grade control and pre-production drilling.
• The major assumptions made and Mineral Resource model used for pit and stope optimisation (if appropriate).
• The mining dilution factors used.
• The mining recovery factors used.
• Any minimum mining widths used.
• The manner in which Inferred Mineral Resources are utilised in mining studies and the sensitivity of the outcome to their inclusion.
• The infrastructure requirements of the selected mining methods.
• The Ore Reserve from trench production was calculated using the outputs from the groundwater flow model. Outputs from the model were used to tabulate the annual flows and potassium concentration of the produced brine. The flow and brine grade relates to a contained SOP tonnage produced from the trenches over the area encompassing the Measured and Indicated Mineral Resource.
• Brine mineralisation is hosted by shallow lakebed sediments (surficial aquifer) within the deposit and commences at approximately 50cm below ground surface across the deposit. This style of mineralisation and shallow depth lends itself to extraction via trenches.
• The hydrogeological model was calibrated in steady-state to static water levels and transient mode to the hydrographs and brine inflow rates measured during the Company’s long-term pumping tests undertaken on pilot trenches across the deposit.
• Brine flow and mass transport implemented within the hydrogeological model have been used to determine the contributing brine distance inflow and the appropriate spacing for trenches.
• Recharge to the surficial aquifer was modelled with the assistance of an infiltration/evaporation model (HYDRUS) and based on long-term climatic data, various field and laboratory analyses from across the deposit.
• A flow and mass transport model was derived to assess potential changes in brine grades over the life of mine. An active recharge regime of rainfall and runoff is predicted to result in gradual grade dilution over the life of mine (refer to the mine plan).
• The trench system has been designed to utilise gravity drainage for moving much of the brine, however pumping stations
Page 72 of 80
Criteria JORC Code explanation Commentary
are required to assist the transfer of brine along the main feed canal to the evaporation ponds.
Metallurgical factors or assumptions
• The metallurgical process proposed and the appropriateness of that process to the style of mineralisation.
• Whether the metallurgical process is well-tested technology or novel in nature.
• The nature, amount and representativeness of metallurgical test work undertaken, the nature of the metallurgical domaining applied and the corresponding metallurgical recovery factors applied.
• Any assumptions or allowances made for deleterious elements.
• The existence of any bulk sample or pilot scale test work and the degree to which such samples are considered representative of the orebody as a whole.
• For minerals that are defined by a specification, has the ore reserve estimation been based on the appropriate mineralogy to meet the specifications?
• Brine will be pumped into evaporation ponds to precipitate potassium-bearing salts which are planned to be harvested and fed to a processing plant.
• Process flowsheets are based on the completion of several comprehensive programs of brine evaporation and process testwork. Both programs involved a strict regime of daily monitoring and sampling to ensure a full suite of data was captured.
• The first phase used a 460L brine sample collected from project with chemistry representative of the overall Mineral Resource. The testwork was completed by Independent Metallurgical Operations Pty Ltd in Perth.
• The second phase used a 10,000L brine sample collected from project with chemistry representative of the overall Mineral Resource. The testwork was completed by the Saskatchewan Research Council under the directive of Global Potash Solutions. Both groups are based in Saskatoon, Canada, and are globally recognised experts in the field of potash processing.
• A continuous flow pilot evaporation trial was commissioned in October 2018 and operated until June 2020. The trial utilised a 3,000m2 pond system that was run as a constant flow operation with brines being transferred through the ponds under a daily transfer regime. The trial successfully demonstrated the commercial scale operation and provided a full annual cycle of operating data with seasonal variation.
• Subsequent process testing on the potassium salts generated from the pilot trial demonstrated that commercial grade SOP could be produced using conventional processing techniques.
• Detailed process engineering studies and mass balance were developed from the testwork findings and support an overall potassium recovery rate of 80%.
Page 73 of 80
Criteria JORC Code explanation Commentary
• The overall recovery is defined as the amount of potassium reporting to SOP product divided by the amount of potassium fed into the pond system. The loss locations are as follows: o Seepage of potassium-bearing
brine into the ground from the ponds;
o Entrainment of potassium-bearing brine within solid waste salts retained in the ponds;
o Potassium solids entrained in the halite tails;
o Precipitation of potassium solids along with solid waste salts; and
o Minor allowances for drying, handling, spills and transport losses.
• The testwork produced SOP samples ranging from 52% to 54% K₂O, exceeding the typical grades for SOP products sold in global markets. SOP samples produced by the Company have undergone preliminary analysis by potential off-take parties which has confirmed the SOP produced to date meets customer specifications.
Environmental • The status of studies of potential environmental impacts of the mining and processing operation. Details of waste rock characterisation and the consideration of potential sites, status of design options considered and, where applicable, the status of approvals for process residue storage and waste dumps should be reported.
• The Company commenced detailed baseline environmental assessments in 2016 including flora and vegetation, terrestrial vertebrate fauna, waterbirds, subterranean fauna, aquatic macroinvertebrates, short range endemic fauna, hydrological and acid sulphate soils.
• The Company’s Preliminary Environmental Impact Assessment has identified the Preliminary Environmental Factors relevant to the project as Flora and Vegetation, Terrestrial Fauna, Subterranean Fauna and Hydrological Processes. Studies have been completed in relation to each of these factors with sufficient detail and certainty to support the submission of a Referral to the Western Australian EPA under Part IV of the Environmental Protection Act 1986.
• The Company submitted an Environmental Scoping Document to the EPA for comment on 7th May 2020.
• The project’s Disturbance Footprint is
Page 74 of 80
Criteria JORC Code explanation Commentary
proposed to cover an area of up to 16,500ha. The off-lake Disturbance Footprint has a proposed disturbance area of up to 1,500ha and consists of a process plant and related infrastructure, accommodation units, access roads and a borefield. The on-lake Disturbance Footprint has a proposed disturbance area of up to 15,000ha and predominantly consists of trenches and solar evaporation ponds.
• The majority of the project’s Disturbance Footprint relates to the solar evaporation ponds and these have been designed to be located on Lake Mackay’s surface in order to minimise environmental impacts such as vegetation clearing during construction and storage of waste salt.
• The Disturbance Footprint will be finalised based on further environmental studies aimed at avoiding or minimising, in particular, potential impacts to conservation significant flora, vegetation and fauna.
• The project is estimated to have scope 1 and 2 emissions of 71ktpa of carbon dioxide equivalent. This represents a low value per unit of SOP production. Emissions have been calculated on an operational control basis in line with the GHG Protocol Corporate Accounting and Reporting Standard.
• Environmental assessments to date suggest that the potential impacts to the relevant environmental factors can be managed to meet the EPA Objectives.
Infrastructure • The existence of appropriate infrastructure: availability of land for plant development, power, water, transportation (particularly for bulk commodities), labour, accommodation; or the ease with which the infrastructure can be provided, or accessed.
• The Company’s existing mining tenements and ancillary titles cover the area for the processing plant, process water borefield, accommodation camp, office buildings, workshops, airstrip, power generation plant, fuel storage and communications facilities.
• Areas for the haul road and port infrastructure will be determined through ongoing studies and ancillary titles will be applied for at the appropriate times.
• The project requires 3.2GL/a of process and 0.1GL/a of potable water. The raw
Page 75 of 80
Criteria JORC Code explanation Commentary
water will be drawn from the borefield located south-east of the processing plant.
• The project site requires an installed power supply of 22MW and will have an average load of 16MW. The project will use a hybrid gas, solar, wind and battery solution. It is contemplated that power generation will be provided under a BOO contract. A proposed has been supplied by the Woodside Energy (LNG Fuels and Power) Pty Ltd and EDL LNG Fuel to Power Pty Ltd Joint Venture, for the delivery and storage of LNG at the project site. The LNG transport and storage infrastructure is also intended to be provided under a BOO contract. The Company has received indicative non-binding proposals from power providers.
• Diesel will be used in mobile equipment and as fuel for remote diesel-fired generators to power the process water borefield and remote pumping stations along the brine feed canal.
• The on-site workforce during operations will include 80 personnel. The accommodation camp at the project site will have 100 rooms. The construction of a sealed airstrip has been planned to allow a fly-in, fly-out air service operating from Perth.
• The communication system will involve a long-haul microwave network to connect to the fibre backhaul. This is expected to provide the most stable and effective communications solution. Vendor consultation has been sought and indicative budget costings obtained.
• The Company received independent haulage proposals from some of Australia’s largest trucking operators. The Company has also established an in-house haulage capability through its joint venture, named Newhaul Bulk Ltd Pty. Newhaul Bulk has completed a detailed logistics study and cost model for transporting SOP from the processing plant to Wyndham Port.
• Road haulage operations from the processing plant to the port will be via road trains. This assumes that road
Page 76 of 80
Criteria JORC Code explanation Commentary
infrastructure meets the standards needed to achieve Road Access Vehicle 10 network certification. Accordingly, the project is planned to involve the construction of a new 346km unsealed haul road to connect the project site to the existing RAV 10 network. The Company has received indicative proposals from experienced civil construction contractors in respect of this haul road.
• The Company plans to ship its SOP via Wyndham Port using a newly constructed barge loading facility. The SOP will be transported from the processing plant at Lake Mackay to a storage facility located on freehold land at Wyndham Port held by the Company under an option to purchase agreement. The Company has received a proposal from TSA, one of Australia’s largest barge loading operators, for the provision of barge loading services for Agrimin’s SOP.
Costs • The derivation of, or assumptions made, regarding projected capital costs in the study.
• The methodology used to estimate operating costs.
• Allowances made for the content of deleterious elements.
• The source of exchange rates used in the study.
• Derivation of transportation charges.
• The basis for forecasting or source of treatment and refining charges, penalties for failure to meet specification, etc.
• The allowances made for royalties payable, both Government and private.
• The capital cost estimate is in accordance with AACE Class 3 requirements with an expected accuracy of -15% to +20%. The estimate is as at Q1 2020.
• The operating cost estimate has been developed with an expected accuracy of -15% to +20%. The estimate is based on the designed capacity of 450ktpa of SOP as dry standard product.
• No allowance has been made for deleterious elements since the testwork to date has not shown the presence of any.
• An AUD:USD exchange rate of 0.65 has been used for foreign currency conversions.
• Transportation costs are included in the operating cost estimates, which are presented on an FOB basis. The cost includes road haulage and shiploading costs.
• A State Government royalty of A$0.73/t of SOP and a confidential Native Title royalty has been included. The Company remains in consultations with the State Government regarding the SOP royalty rate for SOP which may change in the
Page 77 of 80
Criteria JORC Code explanation Commentary
future.
Revenue factors
• The derivation of, or assumptions made regarding revenue factors including head grade, metal or commodity price(s) exchange rates, transportation and treatment charges, penalties, net smelter returns, etc.
• The derivation of assumptions made of metal or commodity price(s), for the principal metals, minerals and co-products.
• A flat long-term real SOP price of US$500/t FOB Wyndham has been assumed. This price is in-line with current SOP prices according to CRU Group and based on the product mix and geographical markets that the Company is targeting.
• An AUD:USD exchange rate of 0.65 has been used for foreign currency conversions.
• The project’s operating costs have been presented on an FOB Wyndham basis, which includes all transportation and loading costs.
Market assessment
• The demand, supply and stock situation for the particular commodity, consumption trends and factors likely to affect supply and demand into the future.
• A customer and competitor analysis along with the identification of likely market windows for the product.
• Price and volume forecasts and the basis for these forecasts.
• For industrial minerals the customer specification, testing and acceptance requirements prior to a supply contract.
• SOP is an important fertiliser product for the cultivation of many crops. Demand has grown at approximately 5% per annum since 2000 and ongoing strong demand growth is expected to be supported by an increasing global population and decreasing arable land.
• Independent SOP market analysis prepared by CRU Group in 2019 supports the Company’s view of the demand and supply fundamentals.
• SOP is a traded commodity and sold under contracts. The Company is engaged in discussions with potential off-takers and customers and the Company has received interest in off-take for its future production.
• The Company’s price and volume forecasts are predominantly based on private information gathered from meetings with fertiliser producers, distributors, traders and end-users.
• SOP samples produced by the Company have undergone preliminary analysis by potential off-takers which has confirmed the SOP produced to date meets customer specifications.
• Targeted product specifications include >52% K2O.
Economic • The inputs to the economic analysis to produce the net present value (NPV) in the study, the source and confidence of these economic inputs including estimated inflation, discount rate, etc.
• NPV ranges and sensitivity to variations in the significant assumptions and inputs.
• The post-tax NPV of the project was calculated based on the discounted cash flows over the project’s initial 40 year life of mine. The post-tax NPV is based on an 8% real discount rate and a 30% company tax rate.
• NPV is mainly sensitive to assumptions for SOP prices and AUD:USD exchange
Page 78 of 80
Criteria JORC Code explanation Commentary
rates.
Social • The status of agreements with key stakeholders and matters leading to social licence to operate.
• The project’s Ore Reserve is situated within a native title determination area (Determination Number: WCD2001/002). The Kiwirrkurra native title holders received rights and interests on 19 October 2001. Tjamu Tjamu (Aboriginal Corporation) RNTBC is the native title registered body corporate for the Kiwirrkurra native title holders. The Company and Tjamu Tjamu have signed a Native Title Agreement which provides the necessary consents for the project’s development and operation within the Kiwirrkurra native title determination area.
• The determination area is also subject to the Use and Benefit Aboriginal Reserves 24923 and 40783. The Company has been granted Mining Entry Permits from the Department of Aboriginal Affairs in order to access the Reserves for the purpose of the project’s development and operation.
• The project’s proposed 346km haul road alignment passes through two other native title determination areas, which includes Parna Ngururrpa (Aboriginal Corporation) RNTBC and Tjurabalan Native Title Land Aboriginal Corporation RNTBC. Agrimin anticipates reaching Native Title Agreements for the haul road with these two parties.
• The project is located within the Shire of East Pilbara. The project’s nearest township is Kiwirrkurra. Both the Shire of East Pilbara and Kiwirrkurra community have been supportive of the Company’s development plans.
• The Shire of Halls Creek and the Shire of Wyndham-East Kimberley have been supportive of the Company’s plans to transport SOP in road trains to Wyndham Port via Halls Creek.
Other • To the extent relevant, the impact of the following on the project and/or on the estimation and classification of the Ore Reserves:
• Any identified material naturally occurring risks.
• The status of material legal agreements and marketing arrangements.
• No material naturally occurring risks have been identified and the project is not subject to any material legal agreements and/or binding marketing arrangements.
• The Company has consulted extensively with government departments (Local, State and Federal). All project approvals
Page 79 of 80
Criteria JORC Code explanation Commentary
• The status of governmental agreements and approvals critical to the viability of the project, such as mineral tenement status, and government and statutory approvals. There must be reasonable grounds to expect that all necessary Government approvals will be received within the timeframes anticipated in the Pre-Feasibility or Feasibility study. Highlight and discuss the materiality of any unresolved matter that is dependent on a third party on which extraction of the reserve is contingent.
required to date have been received within expected timeframes. The Company has reasonable grounds to expect that all necessary future government approvals will also be received within the timeframes anticipated in the DFS.
Classification • The basis for the classification of the Ore Reserves into varying confidence categories.
• Whether the result appropriately reflects the Competent Person’s view of the deposit.
• The proportion of Probable Ore Reserves that have been derived from Measured Mineral Resources (if any).
• Only the in-place Measured and Indicated Mineral Resource was used as the basis for the Ore Reserve.
• The available Ore Reserve is defined as the quantity of potassium and associated SOP contained in brine that is technically extractable from Lake Mackay and able to be delivered to the evaporation ponds. These values were calculated using the numerical model outputs from the mine plan simulation described previously and categorised by level of assurance into Proved and Probable Ore Reserves of potassium and equivalent SOP tonnages.
• The Mineral Resource produced from model layer 1 within the Measured Mineral Resource in the UZT is categorised as a Proved Ore Reserve.
• The Mineral Resource produced from model layers 1, 2, 3, and 4 within the Indicated Mineral Resource in the UZT, UZB and LZ1 resource layers, is categorised as a Probable Ore Reserve.
• See the Ore Reserve table in the body of this ASX Release for full Ore Reserve details.
• The results of the Ore Reserve reflect the view of the Competent Person.
Audits or reviews
• The results of any audits or reviews of Ore Reserve estimates.
• The hydrogeological groundwater model underwent detailed internal review within Stantec USA and counterparts in Stantec Australia contributed towards certain areas of the assessment.
• A third-party external hydrogeologist consultant, Mr Robert Sterrett (PhD) was utilised as a reviewer on an ongoing basis for the hydrogeological model and
Page 80 of 80
Criteria JORC Code explanation Commentary
specialist reports and studies that contributed to the model.
Discussion of relative accuracy/ confidence
• Where appropriate a statement of the relative accuracy and confidence level in the Ore Reserve estimate using an approach or procedure deemed appropriate by the Competent Person. For example, the application of statistical or geostatistical procedures to quantify the relative accuracy of the reserve within stated confidence limits, or, if such an approach is not deemed appropriate, a qualitative discussion of the factors which could affect the relative accuracy and confidence of the estimate.
• The statement should specify whether it relates to global or local estimates, and, if local, state the relevant tonnages, which should be relevant to technical and economic evaluation. Documentation should include assumptions made and the procedures used.
• Accuracy and confidence discussions should extend to specific discussions of any applied Modifying Factors that may have a material impact on Ore Reserve viability, or for which there are remaining areas of uncertainty at the current study stage.
• It is recognised that this may not be possible or appropriate in all circumstances. These statements of relative accuracy and confidence of the estimate should be compared with production data, where available.
• The accuracy of the Mineral Resource and Ore Reserve is, in part, a function of the quality and quantity of available data and of engineering and geological interpretation and judgment. Elements of the study that form the basis of the Ore Reserve include sampling and analytical methodology, the hydrostratigraphic Mineral Resource model construction and understanding of brine and sediment properties and variability, and the construction and calibration of the integrated groundwater flow and mass transport numerical models. These tasks were performed in succession, with standard validation and calibration exercises performed throughout each stage, culminating in the integrated numerical models from which the Ore Reserve has been sourced. This has led to a reasonable level of confidence that Lake Mackay will be able to produce the quantities and grade of brine presented as Ore Reserves in this ASX Release. Given the data available at the time this Competent Persons Statement was prepared, the estimates presented herein are considered reasonable. However, they should be accepted with the understanding that additional data and analysis available subsequent to the date of the estimates may necessitate revision.
• The DFS cost estimates were developed in accordance with an AACE Class 3 standard with an expected accuracy of -15% to +20%.