Tariff Scares: Trade policy information and the extensive margin of Chinese exporting firms Meredith Crowley * , Huasheng Song † , & Ning Meng † * University of Cambridge, * CEPR and † Zhejiang University June 2016 Crowley, Song & Meng June 2016 1 / 51
Transcript
Tariff Scares: Trade policy informationand the extensive margin of Chinese exporting firms
Meredith Crowley∗, Huasheng Song†, & Ning Meng†
∗University of Cambridge, ∗CEPR and †Zhejiang University
June 2016
Crowley, Song & Meng June 2016 1 / 51
Motivation I: Cross-country differences in trade growth
Does trade policy uncertainty matter for a country’s import or exportgrowth?
Consider the trade growth of China and India since 2001 when Chinajoined the WTO.
Crowley, Song & Meng June 2016 2 / 51
Trade in all goods, 2000: US current dollars
Crowley, Song & Meng June 2016 3 / 51
Trade in all goods, 2002: US current dollars
Crowley, Song & Meng June 2016 4 / 51
Trade in all goods, 2004: US current dollars
Crowley, Song & Meng June 2016 5 / 51
Trade in all goods, 2006: US current dollars
Crowley, Song & Meng June 2016 6 / 51
Trade in all goods, 2008: US current dollars
Crowley, Song & Meng June 2016 7 / 51
Trade in all goods, 2010: US current dollars
Crowley, Song & Meng June 2016 8 / 51
Trade in all goods, 2012: US current dollars
Crowley, Song & Meng June 2016 9 / 51
Trade in all goods, 2014: US current dollars
Crowley, Song & Meng June 2016 10 / 51
Motivation II: Cross-country differences in trade policy
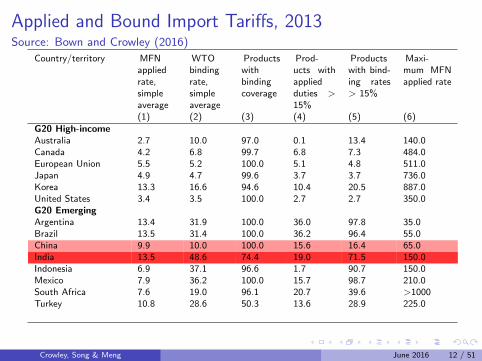
Consider the differences in the import policies between China and Indiasince 2001 when China joined the WTO.
1 The simple average import tariff of the two countries is similar(China’s is slightly lower).
2 China is bound or required to maintain low tariffs under the WTOagreement. India is not.
3 India uses contingency tariffs - special high tariffs permitted by theWTO - more often than China.
It appears that an exporting firm in some third country faces considerablymore trade policy uncertainty in exporting to India.
Crowley, Song & Meng June 2016 11 / 51
Applied and Bound Import Tariffs, 2013Source: Bown and Crowley (2016)
Special import restrictions, 1990-2013Percentage of 5200 importable products subject to a high tariff, Bown and Crowley (2016)
Crowley, Song & Meng June 2016 13 / 51
The Big Picture
1 Does uncertainty over future trade policy deter firm entry into exportmarkets?
2 How do firms learn about risks and opportunities in foreign markets?
Under the sequential exporting model (Albornoz, et. al.)
demand for firm f ’s output in one market is hypothesized to bepositively correlated with demand in other markets,
a firm that observes a positive realization of demand for its goods inmarket j at t − 1 is more likely to enter a second market at t.
We examine product-level changes in trade policy that are correlatedacross markets.
We examine how changes in trade policy in market j impact firm entryinto and exit from other markets.
Crowley, Song & Meng June 2016 14 / 51
Literature I
Models of Trade Policy Uncertainty
1 Handley and Limao (AEJ: Policy, 2015) on Portugal’s EEC accession
2 Limao and Maggi (AEJ: Micro, 2015)
3 Handley (JIE, 2014) on Australian textile imports
Papers on Contingent Tariffs (Antidumping)
1 Tabakis and Zanardi (EI, forthcoming)correlation in new policies at product level across markets
2 Vandenbussche and Zanardi (EER, 2010)on ”chilling effect” of law on agg imports
3 Bown and Crowley (AER, 2013)tariff increase caused by import surges
4 Bown and Crowley (JIE, 2013 and JDE, 2014)tariff increases correlated with GDP and RER
Crowley, Song & Meng June 2016 15 / 51
Literature II
Few firms in an economy engage in export behavior.
Bernard, Eaton, Redding and Schott (JEP, 2007)18% of US manufacturing firms exported in 2002.Eaton, Kortum, Kramarz (Ec’a, 2011)15% of French firms exported in 1986.
Analyze barriers to foreign market entry by focusing on the dynamicpattern of entry.
Albornoz, Calvo Pardo, Corcos and Ornelas (JIE, 2012). Many firmstry to export, but exit foreign markets quickly. Other firms aresuccessful in market 1, and then expand to second and third markets.(Firms learn about foreign demand for their product).Chaney (AER, 2014). The more countries a firm exports to, the morelikely it is to enter new markets. The geographic distribution of entryfavors new markets that are ‘close’ to existing markets.Timoshenko (JIE, 2015). New exporters engage in more productswitching than established exporters. (Firms learn about demand).
Crowley, Song & Meng June 2016 16 / 51
Firm responses to trade policy uncertainty
First, we examine the extensive margin of firms that face one foreign tariffhike and thus, know that the likelihood of a second foreign tariff hike hasincreased.
How does a firm exporting a product that experiences a tariff hikerespond along the foreign market extensive margin?
Second, we examine learning about trade policy uncertainty external to thefirm.
If a firm didn’t face a foreign tariff increase, does it respond along theforeign market extensive margin if its near neighbors were directlyimpacted by the tariff hike?
Crowley, Song & Meng June 2016 17 / 51
Trade policy changes
Antidumping duties are product and country-specific tariffs put inplace by any WTO member for a duration of up to five years.
Zanardi and Tabakis (forthcoming) look at the correlation in newtariffs at the HS04 level among 15 importers and 39 exporters from1980-2005.
Prob(ADijkt) = 0.024%Prob(ADijkt |new tariff in product k in one country at t-1) = 0.721%Prob(ADijkt |new tariff in product k in two countries at t-1) = 1.639%
China has become the biggest antidumping target in the world byexport value. In 2013, 7.1% of China’s exports to the G20 (over US$100 billion) were impacted by antidumping.1
1Source: Bown and Crowley, 2016Crowley, Song & Meng June 2016 18 / 51
Entry into foreign markets (Handley and Limao, 2015)
Consider the problem of a firm, f , that must decide at time t whether ornot to enter a foreign market i with its product h under certainty aboutthe future tariff.
The per-period operating profits are: π(τih).
A firm will enter market j with product h if π(τih)1−β ≥ K .
The value of being an exporter is Πe(τ).
The option value of waiting to enter is Πw (τ).
This implies a threshold tariff τ such that:
Πe(τ)−K = Πw (τ)
Crowley, Song & Meng June 2016 19 / 51
Entry into foreign markets (Handley and Limao, 2015)
Let τt be the current tariff.
If no policy change occurs in country j , then τt+1 = τt .
The probability of a policy change at t+1 is γ.
Let τ′ denote the tariff if a policy change occurs.
The value of starting to export at time t is then
Πe(τt) = π(τt) + β[(1− γ)Πe(τt) + γEt Πe(τ′)]
From Tabakis and Zanardi (forthcoming), we know that the probability ofa tariff hike for ih in t + 1 increases if another country j imposes a tariff inh at t.
Crowley, Song & Meng June 2016 20 / 51
Empirical modelExtensive margin entry for firms experiencing tariff increases for one product
Our analysis uses multi-product firms from China. We look at theextensive margin of entry into new foreign markets.
1 Extensive margin of the firm within a product: Firm-product entryand exit into foreign markets with no trade policy change for theHS06 product that experienced a tariff hike in market j .
2 Extensive margin of the firm within closely-related products:Firm-product entry and exit into foreign markets with no trade policychange for a set of HS06 products that experienced NO tariff increasein market j , but are within the same HS04 group as the product thatexperienced a tariff hike.
Crowley, Song & Meng June 2016 21 / 51
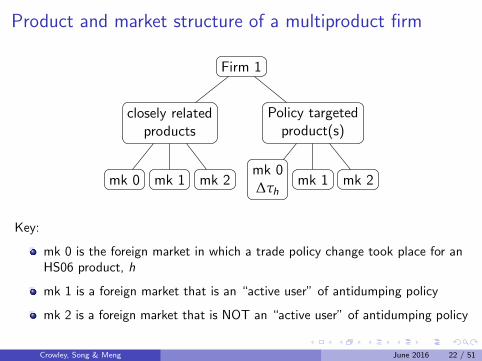
Product and market structure of a multiproduct firm
Firm 1
closely relatedproducts
mk 0 mk 1 mk 2
Policy targetedproduct(s)
mk 0∆τh
mk 1 mk 2
Key:
mk 0 is the foreign market in which a trade policy change took place for anHS06 product, h
mk 1 is a foreign market that is an “active user” of antidumping policy
mk 2 is a foreign market that is NOT an “active user” of antidumping policy
Crowley, Song & Meng June 2016 22 / 51
Entry and exit for targeted products in a multiproduct firm
Firm 1
closely relatedproducts
mk 0 mk 1 mk 2
Policy targetedproduct(s)
mk 0∆τh
mk 1 mk 2
Key:
mk 0 is the foreign market in which a trade policy change took place for anHS06 product, h
mk 1 is a foreign market that is an “active user” of antidumping policy
mk 2 is a foreign market that is NOT an “active user” of antidumping policy
yfiHt is a dummy variable equal to one if firm f enters foreign marketi with HS06 product H in the same HS04 group as the targetedproduct h in year t and zero otherwise,
αi , γf , and ηHS02 are fixed effects,
AD fhjt equals 1 if foreign market j imposed a tariff increase on h att − 1 AND firm f exported that product to j at t − 1,
∆ln(GDP)it−1 is the growth rate of GDP in country i , and
ln(rxr)it−1 is the real exchange rate between China and country i(foreign currency/RMB)
Crowley, Song & Meng June 2016 26 / 51
Learning about trade policy uncertainty external to the firm
We next examine how industrial agglomeration impacts learning abouttrade policy uncertainty across firms in areas of high export concentration.
External to the firm information spillovers: Consider a firm f whichsells an HS06 product or closely related products which experienced atariff increase in market j , but DID NOT export the targeted productto the market with the tariff change. How does prefecture-level exportagglomeration impact the extensive margin of this firm?
Crowley, Song & Meng June 2016 27 / 51
External trade policy information spillovers:Information spillovers for targeted products
Area of highexport concentration
for product hFirm 1
closely relatedproducts
mk 0 mk 1 mk 2
Policy targetedproduct(s)
mk 0∆τh
mk 1 mk 2
Firm 2
closely relatedproducts
mk 0 mk 1 mk 2
Policy targetedproduct(s)
mk 1 mk 2
Firm 3
closely relatedproducts
mk 0 mk 1 mk 2
Policy targetedproduct(s)
mk 1 mk 2
Crowley, Song & Meng June 2016 28 / 51
External trade policy information spillovers:Information spillovers for closely-related products
Area of highexport concentration
for product hFirm 1
closely relatedproducts
mk 0 mk 1 mk 2
Policy targetedproduct(s)
mk 0∆τh
mk 1 mk 2
Firm 2
closely relatedproducts
mk 0 mk 1 mk 2
Policy targetedproduct(s)
mk 1 mk 2
Firm 3
closely relatedproducts
mk 0 mk 1 mk 2
Policy targetedproduct(s)
mk 1 mk 2
Crowley, Song & Meng June 2016 29 / 51
Dataset: Chinese firm-level exports 2000-2009
Data sources:
Firm-level data: the Chinese Annual Survey of Manufacturing Firms(CASMF)
Transaction-level data: the Chinese Customs Database (CCD)
Antidumping data: the Global Antidumping Database (GAD)
We aggregate the monthly customs transactions data to annual values,then match the universe of annual customs transactions from the CCDdata to the CASMF data. 60% of firms in the survey of manufacturingfirms (CASMF) can be matched to customs transactions. (The remainingfirms are purely domestic firms).
Crowley, Song & Meng June 2016 30 / 51
Dataset: Chinese firm-level exports 2000-2009
Figure 1: Flow chart of the matching data
CCD(Unmatched)
Small exportingmanufacturing firms
(Matched)Above-scale exportingmanufacturing firms
(Unmatched)Trading firms
Name list ofChinese characters
indicating trade
CASMF
(Unmatched)Above-scale
non-exportingmanufacturing firms
(Matched)Above-scale exportingmanufacturing firms
(Unmatched)Above-scale
manufacturing firmsexporting via agents
Crowley, Song & Meng June 2016 31 / 51
Dataset: Chinese firm-level exports 2000-2009
Within the annual customs dataset of 11.9 million observations,approximately
46% of observations come from trading (export/import) firms,
25% of firm-year-HS06 product observations can be matched to largemanufacturing firms in the manufacturing survery, and
the remaining 29% of observations are thought to be small tomedium sized enterprises that export directly, but are too small toreport data to the annual survey of manufacturing firms and,
the fraction by trade value for trading firms, large and smallmanufacturing firms is 20%, 56% and 24%, respectively.
Crowley, Song & Meng June 2016 32 / 51
Dataset: Chinese firm-level exports 2000-2009
In the Global Antidumping Database, there have been a total of 514AD investigations against China during 2000-2009.
There are approximately 813 products at the HS-6 level involved inAD cases during 2000-2009 (≈ 15% of HS06 products).
Crowley, Song & Meng June 2016 33 / 51
Dataset: Chinese firm-level exports 2000-2009
Table 1: Country list in the sample
Country Cumulative coverage Active user Country Cumulative coverage Active user Country Cumulative coverage Active userby AD 1995-2013 by AD 1995-2013 by AD 1995-2013
Argentina 4.6 Yes Jamaica - No Singapore - NoAustralia 2.5 Yes Japan 0.1 No South Africa 2.1 Yes
Brazil 2.4 Yes Malaysia - No South Korea 1.4 NoCanada 3.4 Yes Mexico 22.8 Yes Trinidad and Tobago - No
Colombia 1.2 No New Zealand - No Taiwan - NoEuropean Union 6.6 Yes Pakistan 0.4 No Thailand 0.6 No
Hong Kong - No Peru - No Turkey 2.5 YesIndia 7.6 Yes Philippines 0.3 No United Arab Emirates - No
Indonesia 1.1 No Romania - No United States 9 YesIran - No Russia - No Vietnam - No
Israel - No Saudi Arabia - No Hungary - No
The sample includes countries initiating AD targeting China, as well as China’s top 20 exporting countries.
Crowley, Song & Meng June 2016 34 / 51
Dataset: Chinese firm-level exportsLong run changes in the distribution of foreign market scope: 2001 versus 2009
0.0
1.0
2.0
3.0
4D
ensi
ty
0 50 100 150Total market scope
year=2001 year=2009
(a) All manufacturers0
.005
.01
.015
Den
sity
0 50 100 150Total market scope
year=2001 year=2009
(b) All trading firms
Figure 2: Distribution of firms’ total market scope 2001 vs. 2009
Crowley, Song & Meng June 2016 35 / 51
Results: Information spillovers internal to the firmEntry and exit for targeted products in a multiproduct firm
Firm 1
closely relatedproducts
mk 0 mk 1 mk 2
Policy targetedproduct(s)
mk 0∆τh
mk 1 mk 2
Key:
mk 0 is the foreign market in which a trade policy change took place for anHS06 product, h
mk 1 is a foreign market that is an “active user” of antidumping policy
mk 2 is a foreign market that is NOT an “active user” of antidumping policy
Crowley, Song & Meng June 2016 36 / 51
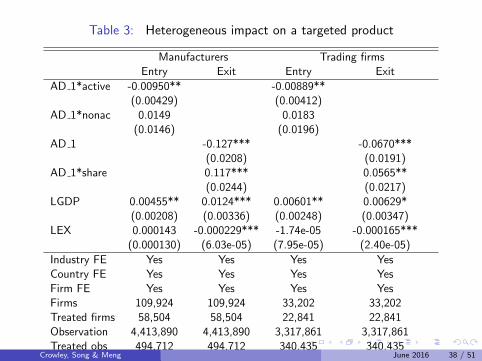
Table 2: Impact on a product targeted by trade policy in a third market
Manufacturers Trading firmsEntry Exit Entry Exit
AD 1 -0.00589* -0.0127* -0.00534* -0.0111**(0.00313) (0.00746) (0.00285) (0.00535)
Industry FE Yes Yes Yes YesCountry FE Yes Yes Yes YesFirm FE Yes Yes Yes YesFirms 109,924 109,924 33,202 33,202Treated firms 58,504 58,504 22,841 22,841Observation 4,413,890 4,413,890 3,317,861 3,317,861Treated obs 494,712 494,712 340,435 340,435R-squared 0.250 0.350 0.300 0.467Notes: Robust standard error in parentheses, clustering atindustry and country level; ***, **, * denote significance at 1%, 5% and 10%.
Crowley, Song & Meng June 2016 38 / 51
Table 4: Interpretation of entry for a product targeted by trade policy in a thirdmarket
Manufacturers Trading firmsEntry Exit Entry Exit
Predicted probability of market entry expressed in percent:at means 16.34 18.08 10.21 15.27at means given AD=0 16.40 18.21 10.26 15.38at means given AD=1 15.81 16.94 9.73 14.27for an antidumping duty applied to AD active country 15.39 – 9.32 –
Crowley, Song & Meng June 2016 39 / 51
Table 5: Interpretation of exit for a product targeted by trade policy in a thirdmarket
Manufacturers Trading firmsEntry Exit Entry Exit
Predicted probability of market entry expressed in percent:at means 16.34 18.08 10.21 15.27at means given AD=0 16.40 18.21 10.26 15.38at means given AD=1 15.81 16.94 9.73 14.27for an antidumping duty applied to – 18.10 – 15.27a firm with 1th market sharefor an antidumping duty applied to – 18.10 – 15.27a firm with 50th market sharefor an antidumping duty applied to – 17.28 – 15.07a firm with 99th market share
Crowley, Song & Meng June 2016 40 / 51
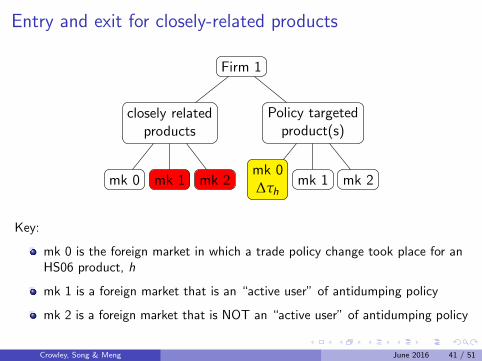
Entry and exit for closely-related products
Firm 1
closely relatedproducts
mk 0 mk 1 mk 2
Policy targetedproduct(s)
mk 0∆τh
mk 1 mk 2
Key:
mk 0 is the foreign market in which a trade policy change took place for anHS06 product, h
mk 1 is a foreign market that is an “active user” of antidumping policy
mk 2 is a foreign market that is NOT an “active user” of antidumping policy
Crowley, Song & Meng June 2016 41 / 51
Table 6: Impact on closely-related products in third markets
Manufacturers Trading firmsEntry Exit Entry Exit
AD 1 -0.00585* -0.0104** -0.00473 -0.00912*(0.00306) (0.00413) (0.00296) (0.00484)
Industry FE Yes Yes Yes YesCountry FE Yes Yes Yes YesFirm FE Yes Yes Yes YesFirms 106,836 106,836 32,364 32,364Treated firms 12,913 12,913 7,956 7,956Observation 3,983,716 3,983,716 3,019,730 3,019,730Treated obs 291,059 291,059 320,243 320,243R-squared 0.253 0.353 0.301 0.469
Notes: Robust standard error in parentheses, clustering atindustry and country level; ***, **, * denote significance at 1%, 5% and 10%.
Crowley, Song & Meng June 2016 43 / 51
Table 8: Interpretation of entry for closely-related products in a third market
Manufacturers Trading firmsEntry Exit Entry Exit
Predicted probability of market entry expressed in percent:at means 16.09 18.14 10.05 15.41at means given AD=0 16.13 18.21 10.10 15.51at means given AD=1 15.55 17.18 9.62 14.59for an antidumping duty applied to AD active country 15.20 – n/a –
Crowley, Song & Meng June 2016 44 / 51
Table 9: Interpretation of exit for closely-related products in a third market
Manufacturers Trading firmsEntry Exit Entry Exit
Predicted probability of market entry expressed in percent:at means 16.09 18.14 10.05 15.41at means given AD=0 16.13 18.21 10.10 15.51at means given AD=1 15.55 17.18 9.62 14.59for an antidumping duty applied to – 18.15 – 15.41a firm with 1th market sharefor an antidumping duty applied to – 18.15 – 15.41a firm with 50th market sharefor an antidumping duty applied to – 17.92 – 15.41a firm with 99th market share
Crowley, Song & Meng June 2016 45 / 51
External trade policy information spillovers:Information spillovers for targeted products
Area of highexport concentration
for product hFirm 1
closely relatedproducts
mk 0 mk 1 mk 2
Policy targetedproduct(s)
mk 0∆τh
mk 1 mk 2
Firm 2
closely relatedproducts
mk 0 mk 1 mk 2
Policy targetedproduct(s)
mk 1 mk 2
Firm 3
closely relatedproducts
mk 0 mk 1 mk 2
Policy targetedproduct(s)
mk 1 mk 2
Crowley, Song & Meng June 2016 46 / 51
Table 10: Impact on targeted products in third markets
Manufacturers Trading firmsEntry Exit Entry Exit
AD 1 -0.0112*** -0.0185* -0.00923** -0.0223**(0.00361) (0.00977) (0.00417) (0.00866)
Industry FE Yes Yes Yes YesCountry FE Yes Yes Yes YesFirm FE Yes Yes Yes YesFirms 92,917 92,917 87,476 87,476Treated firms 43,020 43,020 46,606 46,606Observation 2,157,466 2,157,466 1,792,530 1,792,530Treated obs 210,369 210,369 266,244 266,244R-squared 0.235 0.354 0.245 0.357
Notes: Robust standard error in parentheses, clustering atindustry and country level; ***, **, * denote significance at 1%, 5% and 10%.Crowley, Song & Meng June 2016 50 / 51
Conclusions
1 Extensive market entry under increased uncertainty about future tariffrates.
Chinese firms are less likely to enter new foreign markets when anycountry in the world raises its tariff on the relevant product.Chinese firms are less likely to enter new foreign markets with relatedproducts when any country in the world raises its tariff on the relevantproduct.This decline in the probability of entry is larger for countries with ahistory of frequently raising tariffs under antidumping policy.
2 Learning about trade policy changes from neighboring firms.
We uncover some evidence that firms learn about foreign trade policychanges from neighbors in their geographic area that were impacted bya foreign trade policy change.A firm located in an area with a high concentration of producers whowere directly impacted by the policy change is less likely to enter newforeign markets with other products.