1 Task C: Sample Design Task C: Sample Design Final: December 31, 2016 Revised March 9, 2017 Submitted to: Federal Highway Administration Office of Policy Information 1200 New Jersey Avenue, SE Washington, DC 20590 Contract # GS23F8144H Order # DTFH6114F00113 Submitted by: Westat 1600 Research Boulevard Rockville, Maryland 20850-3129 (301) 251-1500 Edited by: Adella Santos, FHWA and Stacey Bricka, Macrosys
Transcript
1 Task C: Sample Design
Task C: Sample Design
Final: December 31, 2016 Revised March 9, 2017
Submitted to:
Federal Highway Administration
Office of Policy Information
1200 New Jersey Avenue, SE
Washington, DC 20590 Contract # GS23F8144H Order # DTFH6114F00113
Submitted by:
Westat
1600 Research Boulevard
Rockville, Maryland 20850-3129
(301) 251-1500
Edited by: Adella Santos, FHWA and Stacey
Bricka, Macrosys
2 Task C: Sample Design
Table of Contents Sample Design: National Sample (Task C)........................................................................................ 3
The National Household Travel Survey for 2016 will be conducted at the National level and in 13 specific study areas (referred to as Add-on areas) listed in Table 1-1. As described in detail below, the design will use a two-stage survey process, with an address-based sampling (ABS) frame. The two-stage process will include a mailout/mail back recruitment stage, and a primarily web-based travel day retrieval with telephone option. The study will use multiple modes for reminders at key points and cash incentives at key stages.
Table 1-1 summarizes the target sample sizes (completed household retrievals) specified for each study area where a household retrieval is considered to be complete if all of the eligible household members, (i.e., persons age 5 and older) complete the retrieval survey. An enumeration of all household members will be conducted1 for participation in the survey.
Section 2 provides details of the ABS design for the National and Add-on samples. Section 3 discusses details of the sample design specific to each particular study area. Section 4 provides a preliminary overview of weighting and estimation procedures. The appendix includes tables that support the discussion of expected precision in section 2.4.
1 The recruitment survey instrument will have space for up to nine household members. Respondents will be asked to provide
information for any additional household members on a separate page.
4 Task C: Sample Design
Table 1-1 Study areas and target sample sizes
Study Area Sample Size 1
National 26,000
Arizona DOT 2,444
California DOT 24,000
Des Moines Area MPO 1,200
Georgia DOT 8,000
Indian Nations Council of Governments 1,000
Iowa Northland Regional Council of Governments 1,200
Maryland DOT 1,000
New York State DOT 15,851
North Carolina DOT 8,000
South Carolina DOT 6,500
Wisconsin DOT 11,000
Texas DOT 20,000
North Central Texas Council of Governments 2,917
TOTAL 129,112
1These are households for which all of the household members ages 5 and older complete the retrieval survey.
2. The ABS Sample Design
The National and Add-on samples will be selected using a single, unified design with a single selection (i.e., the Add-on samples will be embedded in the National sample design). Using a single selection avoids the complexities and reduction in precision that would result from separate, independent selections for the National and Add-on samples. In another major design difference from both the 2001 and 2009 NHTS, the National and 13 Add-on areas for the 2016 NHTS will comprise a sample of addresses that will be selected from the ABS frame maintained by Marketing Systems Group (MSG). MSG has a decades-long history of providing sampling frames to Westat, including both random digit dial (RDD) and ABS sampling frames, and we have collaborated with them extensively on research and enhancements to their frames. MSG‟s
ABS frame originates from the U.S. Postal Service (USPS) Computerized Delivery Sequence file (CDS), and is updated on a monthly basis. Although several vendors license the CDS, Westat recognizes that MSG has taken great strides to evaluate and enhance the standard CDS-based list. One example is the work that MSG has done to augment simplified addresses (addresses with no specific street address, e.g., John Doe, Newtown, ST 12345). Section 2.2 discusses the coverage of the ABS frame. Sampled addresses will be assigned a day of the week for which to log all travel. Section 2.5 below gives details on this assignment of travel days, for both the National sample and the Add-on areas.
5 Task C: Sample Design
2.1 Stratification of the ABS Sample
For the National study, because of the need to produce state-level estimates with adequate precision, state will be used for stratification. However, in order to support estimates for Add-on areas in states containing Add-ons, separate strata will be formed using the Add-on area(s) and the balance of the state. Thus the primary strata will consist of: (1) each Add-on area; (2) the balance of the state, for states with sub-state Add-ons; and (3) the state, for states without sub-state Add-ons. Additionally, the following four groups will be used to sub-stratify within each primary stratum:
Counties in Metropolitan Statistical Areas (MSAs) of at least1 million people and containing heavy rail for transit use (14 such MSAs exist in the U.S.);
Counties in MSAs of at least1 million people and not containing heavy rail for transit use;
Counties in MSAs of less than 1 million people; and Counties not in MSAs.
The National sample size (specified in terms of responding households) will then be initially allocated among the strata according to the proportion of addresses falling in the stratum (determined by the counts of addresses from the ABS frame). A minimum allocation of 250 responding households per state will be used; states with initial allocations of fewer than 250 households will be increased to 250, and the remainder of the National sample will be re-allocated proportionally to the strata associated with the remaining states. For the Add-on areas, the Add-on sample size (as specified by memoranda of understanding (MOU) with the Add-on sponsor) will also be allocated among the four substrata above with potential additional substratification, with the allocation based on designated targets for each final substratum as specified in the Add-on MOU.
Once the sample of responding households has been allocated in the manner described above, these sample sizes will be inflated to account for expected losses due to ineligible addresses (an assumed rate of 11 percent of addresses, based on other National ABS mail studies conducted by Westat), non-response to the recruitment effort (an assumed non-response rate of 70 percent of eligible addresses), and non-response to the retrieval effort (an assumed non-response rate of 35 percent of recruited households). The departures from proportional allocation of responding households in the National sample and the supplementation of the sample for Add-ons will result in a sample of addresses selected with variable sampling rates. These variations in sampling rates will be properly accounted for in the computation of the survey weights, as discussed in section 4.
6 Task C: Sample Design
Within each substratum, the ABS frame will be sorted in a prescribed manner prior to sample selection. The sort used by MSG is geographic in nature, and addresses are sampled systematically using the geographic sort.
2.2 Coverage
Most studies of coverage of ABS frames have focused on in-person surveys that require locating the physical address in a specific geography (giving rise to problems with rural route addresses and PO boxes, as well as coverage issues resulting from geocoding errors). For a mail survey the household coverage rates are much higher, since the USPS delivers mail to almost all households, and households with mailing addresses that do not correspond to a physical location are covered. As reported by Iannacchione (2011), ABS frames that are derived from the USPS CDS file and its associated No-Stat file offer nearly complete coverage of households; however, since including the No-Stat file (a file of mostly inactive addresses) is estimated to increase the coverage by less than one percentage point (Shook-Sa et al.), the sampling frame for the 2016 NHTS will be derived from only the CDS file. Thus, the ABS sample used for the 2016 NHTS is expected to have substantially higher coverage than the 2009 NHTS landline RDD sample. (In 2009, about one-fourth of households did not have landline telephones, and it has been estimated that an additional 5 to 20 percent of landline households were excluded from landline RDD frames; see Blumberg and Luke (2009) for telephone service statistics, and Boyle et al. (2009), Fahimi, Kulp, and Brick (2009), Barron and Zhao (2010), and Barron et al. (2013) for discussion of landline RDD frame coverage of landline households.)
With the ABS approach, identifying targeted areas (e.g., states) that correspond to those for which estimates can be developed from the NHTS data is straightforward. Addresses are definitively linked to states, so state-level estimation is facilitated (unlike the situation with a random digit dial sample of telephone numbers such as that used for the 2009 NHTS). Geocoding and Geographic Information System (GIS) processing can be used to link addresses to counties in a highly reliable fashion. There can be some ambiguity for addresses that are P.O. Boxes or are listed as rural route addresses, since these addresses do not correspond to the physical location of the household. These types of addresses, while representing only a small proportion of a state‟s population, will be handled appropriately in a routine manner with a set of well-defined rules. For example, for sampling purposes, when Add-on areas are defined based on county or census tract boundaries, P.O. Box and rural route addresses will be associated with the census tract associated with the centroid of the ZIP or ZIP +4 code, whichever is available. Thus, no important issues arise in the definition of areas with an ABS sample design that relies on mail for data collection.
7 Task C: Sample Design
2.3. Two Part Sample Selection
The ABS samples described in Section 2 will be selected in two parts. In each sampling stratum, half the target number of sampled addresses will be selected prior to the start of fieldwork; the other half will be selected approximately 6 months later. This will allow the sample to reflect updates to the ABS frame after the original selection, and will also allow adjustment to the sampling rates as needed (e.g., to account for response rates that differ from prior expectations). Sample monitoring will be performed throughout the data collection period in order to identify and try to address any potentially significant issues with response. To the extent possible, we will try to minimize the variance in each half sample‟s final yield, as an imbalance will mean that particular half of the year is over- or under-sampled, while still achieving the overall target annual yield.
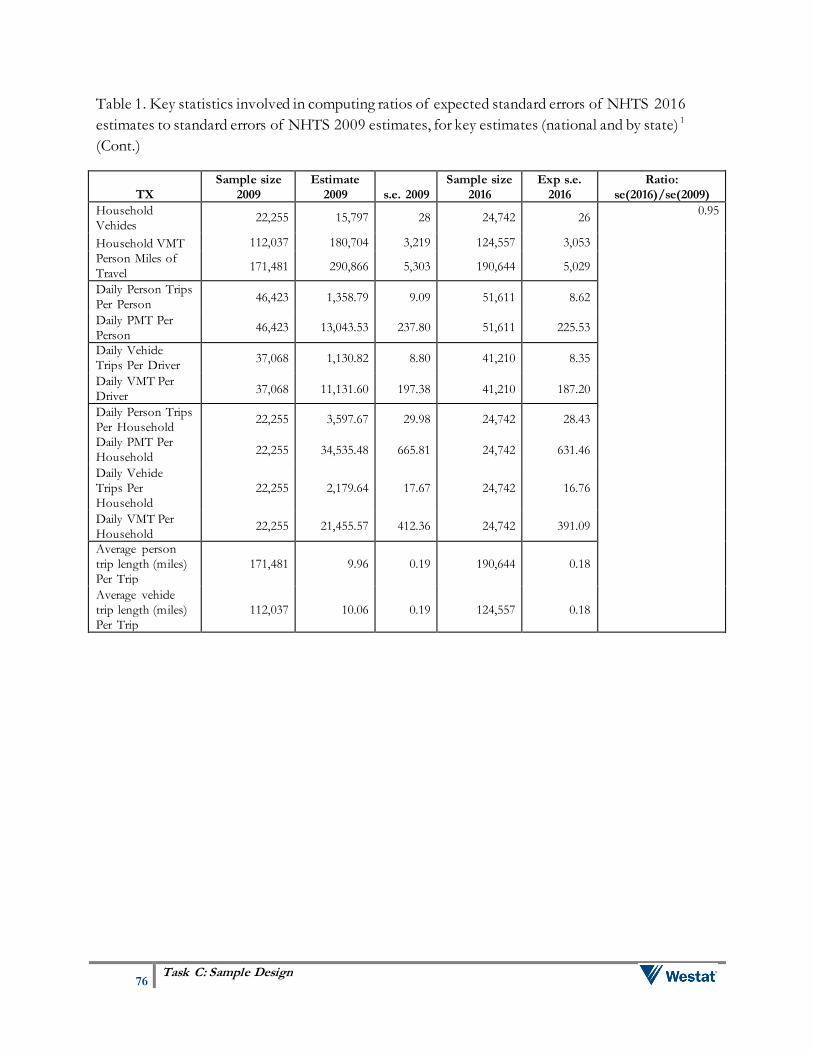
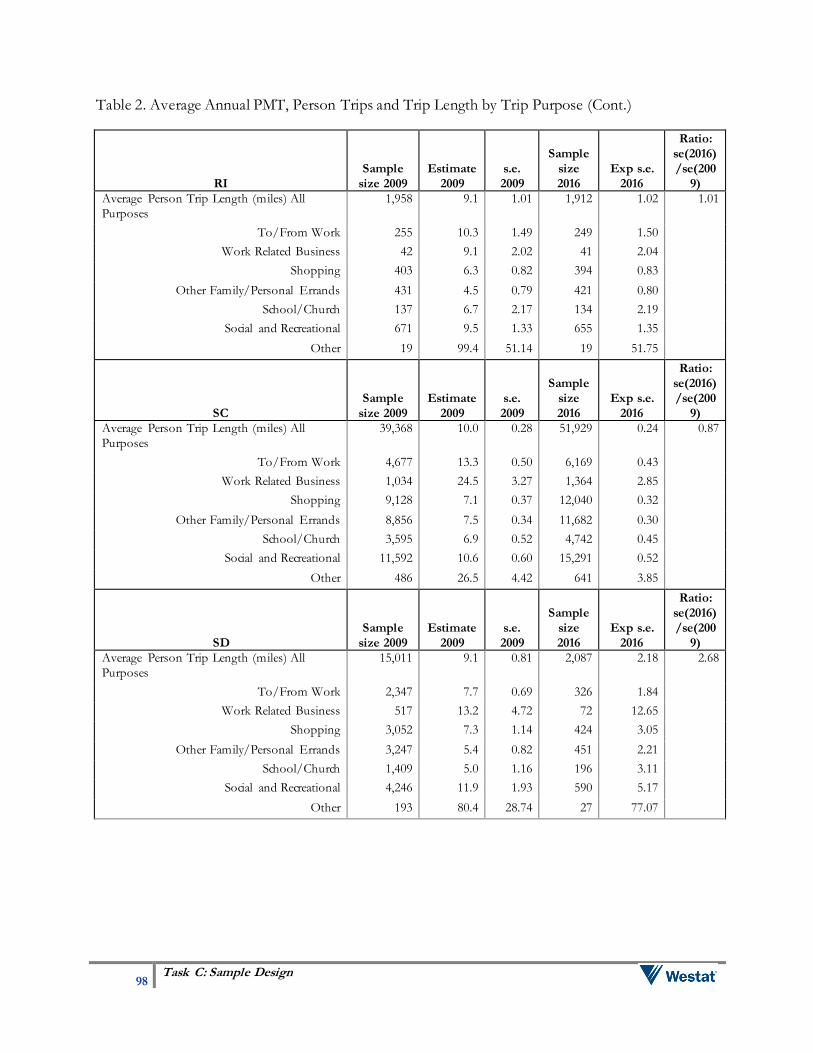
2.4 Expected Precision
State and national level 2009 NHTS key estimates along with their standard errors, design effects and effective sample sizes were used in order to estimate the expected precision of estimates for the 2016 NHTS. For each estimate considered, the square root of the ratio of the 2009 NHTS effective sample size to the expected 2016 NHTS effective sample sizes was applied to the 2009 standard error to obtain an approximation of the expected standard error for the 2016 estimate. The final column of the table shows the ratio of the expected standard error of the 2016 estimate to the standard error of the 2009 estimate. For this exercise, key estimates were taken from Tables 1, 3, and 5 of the Summary of Travel Trends Report from the 2009 NHTS2. From Table 1, they include:
Total number of household vehicles; Total number of household vehicle miles traveled; and Total number of person miles traveled.
From Table 3, they include:
Daily person trips per person; Daily person miles traveled per person; Daily vehicle trips per driver; Daily vehicle miles traveled per driver; Daily person trips per household; Daily person miles traveled per household;
2 The 2009 NHTS Summary of Travel Trends report is available at http://nhts.ornl.gov/publications.shtml
Daily vehicle trips per household; Daily vehicle miles traveled per household; Average person trip length (miles) per trip; and Average vehicle trip length (miles) per trip.
From Table 5, they include the average person trip length (miles) for:
All purposes; To/from work; Work-related business; Shopping; Other family/personal errands; School/church; Social and recreational; and Other.
2.5. Assignment of Travel Day
The sample release process will control the balance of travel days by month. For the National sample, sampled addresses will be assigned a day of the week equally distributed across all days to ensure a balanced day of week distribution. This is a proven approach that has been used in all of our travel surveys. The following Add-on areas will also use this approach: California, Des Moines MPO, Iowa Northland Council of Governments, Maryland, and New York. In the remaining Add-on areas, for Add-on sample cases only in the Add-on areas (i.e., not the National sample cases in the Add-on areas), weekend travel days (Saturday and Sunday) will be sampled at a rate of 7 percent each and weekdays (Monday through Friday) will be sampled at a rate of about 17 percent each. The areas include: Arizona, Georgia, Indian Nations Council of Governments, North Carolina, North Central Texas Council of Governments, South Carolina, Texas, and Wisconsin.
3. The National Sample Design
There will be a National sample with a target of 26,000 responding households. The National sample will have a total of 55 primary strata defined and described in Section 2: one for each Add-on area, one for the balance of the state (for each state with sub-state Add-ons), and one for each remaining state and the District of Columbia. Table 3-1 below presents the estimated sample sizes needed by stratum for the National sample to yield 26,000 completed household interviews. The assumptions given in the table are consistent with recent experience and include an estimated recruitment response rate of 30%, an estimated retrieval response rate of 65%
9 Task C: Sample Design
defining responding households as those that complete retrieval interviews for all of the recruited household members ages 5 and older, and an expected residency rate of 89%. Table 3-2 presents the estimated sample sizes aggregated to the primary strata described in section 2.1. Table 3-1 Expected sample sizes for the national sample by state
STATE
ABS 12/14
occupied housing
units*
Retrieval completes
assuming 65%
response
Recruitment
completes
assuming 30%
response
ABS address sample
needed assuming
89% residency rate
Alabama 2,099,930 382 587 2,198
Alaska 245,754 250 385 1,441
Arizona 2,704,563 491 756 2,831
Arkansas 1,235,085 250 385 1,441
California 13,315,204 2,419 3,722 13,939
Colorado 2,104,380 382 588 2,203
Connecticut 1,459,660 265 408 1,528
Delaware 387,757 250 385 1,441
District of Columbia 301,320 250 385 1,441
Florida 8,797,039 1,598 2,459 9,209
Georgia 3,959,849 719 1,107 4,145
Hawaii 466,121 250 385 1,441
Idaho 598,298 250 385 1,441
Illinois 5,176,017 940 1,447 5,419
Indiana 2,761,832 502 772 2,891
Iowa 1,252,609 250 385 1,441
Kansas 1,175,772 250 385 1,441
Kentucky 1,843,639 335 515 1,930
Louisiana 1,931,525 351 540 2,022
Maine 575,676 250 385 1,441
Maryland 2,349,233 427 657 2,459
Massachusetts 2,774,255 504 775 2,904
Michigan 4,263,440 775 1,192 4,463
Minnesota 2,210,703 402 618 2,314
Mississippi 1,236,148 250 385 1,441
Missouri 2,575,052 468 720 2,696
Montana 389,691 250 385 1,441
Nebraska 743,212 250 385 1,441
Nevada 1,115,129 250 385 1,441
New Hampshire 530,210 250 385 1,441
New Jersey 3,514,537 639 982 3,679
New Mexico 775,084 250 385 1,441
New York 7,798,454 1,417 2,180 8,164
North Carolina 4,130,585 750 1,155 4,324
North Dakota 286,886 250 385 1,441
Ohio 5,082,240 923 1,421 5,320
Oklahoma 1,579,355 287 441 1,653
Oregon 1,576,258 286 441 1,650
Pennsylvania 5,425,758 986 1,517 5,680
Rhode Island 458,760 250 385 1,441
10 Task C: Sample Design
STATE
ABS 12/14
occupied housing
units*
Retrieval completes
assuming 65%
response
Recruitment
completes
assuming 30%
response
ABS address sample
needed assuming
89% residency rate
South Carolina 2,044,349 371 571 2,140
South Dakota 316,742 250 385 1,441
Tennessee 2,769,775 503 774 2,900
Texas 10,058,020 1,827 2,811 10,529
Utah 945,196 250 385 1,441
Vermont 250,552 250 385 1,441
Virginia 3,286,115 597 919 3,440
Washington 2,785,131 506 778 2,916
West Virginia 780,380 250 385 1,441
Wisconsin 2,457,776 447 687 2,573
Wyoming 214,990 250 385 1,441
TOTAL 127,116,046 26,000 40,000 149,821 *Includes all address types except for augmented P.O. boxes.
Table 3-2 Expected sample sizes for the national sample by primary stratum
National sample stratum
ABS 12/14 occupied
housing units Proportion
Stratum
sample size
Counties within MSAs > 1 million and heavy rail 31,070,705 24.4% 5,966
Counties within MSAs > 1 million and not heavy rail 38,036,786 29.9% 7,157
Counties within MSAs < 1 million 39,573,540 31.1% 8,509
Not in an MSA 18,435,015 14.5% 4,338
TOTAL 127,116,046 26,000 NOTE: The stratum sample size column indicates the expected number of completed household surveys.
3.1 Arizona DOT Study Area
The target number of completed household surveys is 2,444 for the Arizona Add-on area, with
representation for the entire state. Maintaining the four main MSA/heavy rail sampling strata,
twenty percent of the Add-on sample will be allocated to the three Sun Corridor counties, Maricopa,
Pima, and Pinal, proportionally according to the number of households in each county. The
remaining 80 percent of the Add-on sample will be allocated to the other 12 counties (not in the Sun
corridor), proportional to the number of households in each county. A minimum Add-on sample
size of 30 will be set for all counties and the remaining sample distributed within the Sun Corridor
or not county groups. Table 3-3 shows the allocation of the National sample for Arizona within the
main MSA/heavy rail sampling strata, the allocation for the Arizona DOT Add-on sample, and the
total sample allocation.
11 Task C: Sample Design
Table 3-3 Arizona national sample and add-on allocation
County National sample stratum
ABS 12/14
occupied
housing units
National
sample
allocation
Add-on
allocation
TOTAL
sample
Maricopa County Counties within MSAs > 1 million 1,636,725 297 361 658
Pinal County Counties within MSAs > 1 million 131,974 24 30 54
Cochise County Counties within MSAs < 1 million 52,369 10 205 215
Coconino County Counties within MSAs < 1 million 46,776 8 184 192
Mohave County Counties within MSAs < 1 million 99,046 18 388 406
Pima County Counties within MSAs < 1 million 442,472 80 98 178
Yavapai County Counties within MSAs < 1 million 96,328 17 378 395
Yuma County Counties within MSAs < 1 million 86,222 16 337 353
Apache County Not in an MSA 13,131 2 52 54
Gila County Not in an MSA 23,767 4 93 97
Graham County Not in an MSA 11,727 2 46 48
Greenlee County Not in an MSA 1,915 0 30 30
La Paz County Not in an MSA 9,615 2 37 39
Navajo County Not in an MSA 38,084 7 149 156
Santa Cruz
County Not in an MSA 14,412 3 56 59
TOTAL 2,704,563 491 2,444 2,935 NOTE: The total sample column indicates the expected number of completed household surveys.
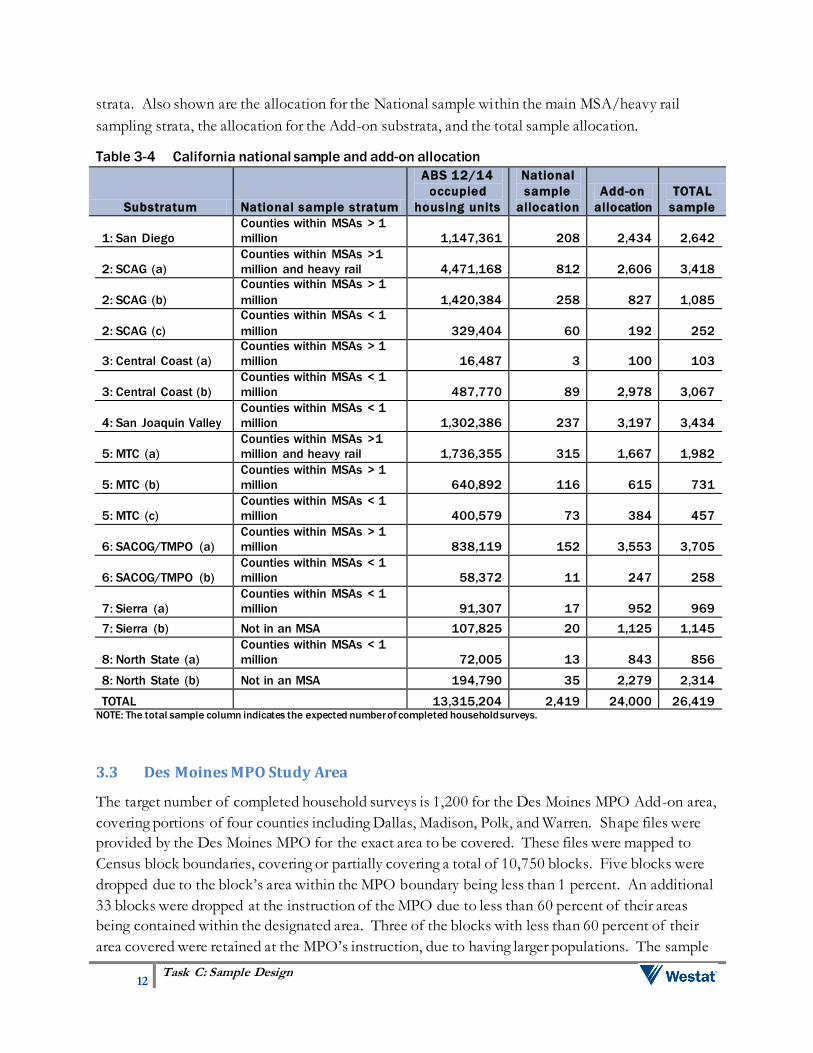
3.2 California DOT Study Area
The target number of completed household surveys is 24,000 for the California Add-on area, with
representation for the entire state. Households will be selected from each of eight county groups,
proportional to the number of households in each group. These groups are further subdivided to
maintain the structure of the four main MSA/heavy rail sampling strata that will be used for the
National sample as well. These groups are:
San Diego
SCAG (divided into a), b), and c))
Central Coast (divided into a) and b))
San Joaquin Valley
MTC (divided into a), b), and c))
SACOG/TMPO (divided into a) and b))
Sierra (divided into a) and b))
North State (divided into a) and b))
The Add-on sample has been distributed among these substrata to ensure that 20 percent of the
sample is coming from rural areas and the remaining 80 percent from non-rural areas. Table 3-4
shows the definitions of the California Add-on substrata and the corresponding National sample
12 Task C: Sample Design
strata. Also shown are the allocation for the National sample within the main MSA/heavy rail
sampling strata, the allocation for the Add-on substrata, and the total sample allocation.
Table 3-4 California national sample and add-on allocation
Substratum National sample stratum
ABS 12/14
occupied
housing units
National
sample
allocation
Add-on
allocation
TOTAL
sample
1: San Diego
Counties within MSAs > 1
million 1,147,361 208 2,434 2,642
2: SCAG (a)
Counties within MSAs >1
million and heavy rail 4,471,168 812 2,606 3,418
2: SCAG (b)
Counties within MSAs > 1
million 1,420,384 258 827 1,085
2: SCAG (c)
Counties within MSAs < 1
million 329,404 60 192 252
3: Central Coast (a)
Counties within MSAs > 1
million 16,487 3 100 103
3: Central Coast (b)
Counties within MSAs < 1
million 487,770 89 2,978 3,067
4: San Joaquin Valley
Counties within MSAs < 1
million 1,302,386 237 3,197 3,434
5: MTC (a)
Counties within MSAs >1
million and heavy rail 1,736,355 315 1,667 1,982
5: MTC (b)
Counties within MSAs > 1
million 640,892 116 615 731
5: MTC (c)
Counties within MSAs < 1
million 400,579 73 384 457
6: SACOG/TMPO (a)
Counties within MSAs > 1
million 838,119 152 3,553 3,705
6: SACOG/TMPO (b)
Counties within MSAs < 1
million 58,372 11 247 258
7: Sierra (a)
Counties within MSAs < 1
million 91,307 17 952 969
7: Sierra (b) Not in an MSA 107,825 20 1,125 1,145
8: North State (a)
Counties within MSAs < 1
million 72,005 13 843 856
8: North State (b) Not in an MSA 194,790 35 2,279 2,314
TOTAL 13,315,204 2,419 24,000 26,419 NOTE: The total sample column indicates the expected number of completed household surveys.
3.3 Des Moines MPO Study Area
The target number of completed household surveys is 1,200 for the Des Moines MPO Add-on area,
covering portions of four counties including Dallas, Madison, Polk, and Warren. Shape files were
provided by the Des Moines MPO for the exact area to be covered. These files were mapped to
Census block boundaries, covering or partially covering a total of 10,750 blocks. Five blocks were
dropped due to the block’s area within the MPO boundary being less than 1 percent. An additional
33 blocks were dropped at the instruction of the MPO due to less than 60 percent of their areas
being contained within the designated area. Three of the blocks with less than 60 percent of their
area covered were retained at the MPO’s instruction, due to having larger populations. The sample
13 Task C: Sample Design
of 1,200 will be distributed proportionally to the number of occupied housing units within each of
the four county areas in those 10,712 Census blocks.
Table 3-5 shows the allocation of the National sample for Iowa for the four counties in the Des
Moines MPO and the rest of Iowa, the allocation for the Des Moines MPO Add-on sample, and the
total sample allocation.
Table 3-5. Des Moines MPO national sample and add-on allocation
County
National sample
stratum
ABS 12/14
occupied
housing
units
ABS 12/14
occupied HUs
for included
Census blocks
National
sample
allocation
Add-on
allocation
TOTAL
sample
Dallas
Counties within MSAs <
1 million 29,066 19,259 6 108 114
Madison
Counties within MSAs <
1 million 5,914 79 1 1 2
Polk
Counties within MSAs <
1 million 190,344 187,949 38 1,053 1,091
Warren
Counties within MSAs <
1 million 18,097 6,833 4 38 42
Rest of Iowa
Counties within MSAs <
1 million 497,062
99 0 99
Rest of Iowa Not in an MSA 512,126
102 0 102
TOTAL 1,252,609 250 1,200 1,450 NOTE: The total sample column indicates the expected number of completed household surveys.
3.4 Georgia DOT Study Area
The target number of completed household surveys is 8,000 for the Georgia Add-on area, covering
14 of the 16 MPOs in the state. The Chattanooga and Atlanta MPOs will be excluded as a specific
MPO strata but will be included in the “other counties in the state” stratum. The Columbus MPO is
also covered by Russell and Lee Counties in Alabama, and the Augusta MPO is covered by Aiken
and Edgefield Counties in South Carolina.
Two groups of counties will be defined: one containing all counties in the 14 MPOs of interest and
one containing all other counties in Georgia. Maintaining the bounds of the four main study strata,
sixty-four percent of the sample of households will be allocated proportionally by county to the first
group (n=5,120) and the remaining sample will be allocated proportionally by county to the second
group (n=2,880). Table 3-6 shows the allocation of the National sample for Georgia, the allocation
for the 14 MPOs of interest for the Add-on sample, and the total sample allocation.
14 Task C: Sample Design
Table 3-6 Georgia national sample and add-on allocation
Substrata defined
by GA Add-on:
MPOs National sample stratum
ABS 12/14
occupied
housing
units
National
sample
allocation*
Add-on
allocation*
TOTAL
sample
Albany Counties within MSAs < 1 million 51,455 9 235 245
Athens Counties within MSAs < 1 million 81,223 15 371 386
Augusta Counties within MSAs < 1 million 137,832 25 630 655
Brunswick Counties within MSAs < 1 million 38,306 7 175 182
Cartersville
Counties within MSAs > 1 million
and heavy rail 38,559 7 176 183
Columbus* Counties within MSAs < 1 million 101,217 18 885 904
Dalton Counties within MSAs < 1 million 53,274 10 244 253
Gainesville (a) Counties within MSAs < 1 million 66,740 12 305 317
Gainesville (b) Not in an MSA 22,851 4 104 109
Hinesville Counties within MSAs < 1 million 29,478 5 135 140
Macon Counties within MSAs < 1 million 91,113 17 417 433
Rome Counties within MSAs < 1 million 39,831 7 182 189
Savannah Counties within MSAs < 1 million 152,793 28 699 726
Valdosta Counties within MSAs < 1 million 51,596 9 236 245
Warner Robins Counties within MSAs < 1 million 71,164 13 325 338
All other areas (a)
Counties within MSAs > 1 million
and heavy rail 2,143,587 389 2,105 2,494
All other areas (b) Counties within MSAs < 1 million 124,329 23 122 145
All other areas (c) Not in an MSA 664,501 121 653 773
TOTAL 3,959,849 719 8,000 8,719 NOTE: The total sample column indicates the expected number of completed household surveys.
*The Columbus MPO contains two counties from Alabama. The National sample allocation total for this MPO includes only Georgia county estimates. The Add-on allocation total for this MPO includes the AL county estimates and the GA county estimates, but the surveys are only being collected in the GA counties.
3.5 Indian Nations Council of Governments Study Area
The target number of completed household surveys is 1,000 for the Indian Nations Council of
Governments Add-on area, covering portions of five counties in Oklahoma including Creek, Osage,
Rogers, Tulsa, and Wagoner. Shape files were provided by the study area for the exact area to be
covered. These files were mapped to Census block boundaries, covering or partially covering a total
of 21,803 blocks. Seven blocks were dropped due to the block’s area within the MPO boundary
being less than 1 percent. One additional block was dropped due to less than 60 percent of its area
being contained within the designated area. The sample of 1,000 will be distributed as follows to
households in the 21,795 Census blocks within the five county areas as follows:
Creek County: 12 percent
Osage County: 10 percent
Rogers County: 16 percent
15 Task C: Sample Design
Tulsa County: 50 percent
Wagoner County: 12 percent
Table 3-7 shows the allocation of the National sample for INCOG for the five included counties
and the rest of Oklahoma, the allocation for the INCOG MPO Add-on sample, and the total sample
allocation.
Table 3-7. Indian Nations Council of Governments (Oklahoma) national sample and add-on
allocation
County National sample stratum
ABS 12/14
occupied
housing
units
ABS 12/14
occupied HUs
for included
Census blocks
National
sample
allocation
Add-on
allocation
TOTAL
sample
Creek
Counties within MSAs < 1
million 26,570 15,732 5 120 125
Osage
Counties within MSAs < 1
million 17,148 9,291 3 100 103
Rogers
Counties within MSAs < 1
million 34,038 23,012 6 160 166
Tulsa
Counties within MSAs < 1
million 278,896 278,896 51 500 551
Wagoner
Counties within MSAs < 1
million 28,858 20,581 5 120 125
Rest of
Oklahoma
Counties within MSAs > 1
million 557,801
101 0 101
Rest of
Oklahoma
Counties within MSAs < 1
million 108,617
20 0 20
Rest of
Oklahoma Not in an MSA 527,427
96 0 96
TOTAL 1,579,355 287 1,000 1,287 NOTE: The total sample column indicates the expected number of completed household surveys.
3.6 Iowa Northland Regional Council of Governments Study Area
The target number of completed household surveys is 1,200 for the Iowa Northland Regional
Council of Governments Add-on area, covering a portion of Black Hawk County. Shape files were
provided by the INRCOG for the exact Black Hawk MPO area to be covered. These files were
mapped to Census block boundaries, covering or partially covering a total of 3,724 blocks. Thirty-
six blocks were dropped due to less than 60 percent of their area being contained within the
designated MPO. The sample of 1,200 will be distributed proportional to the size of the places
designated by the Add-on area in the remaining 3,688 blocks. Table 3-8 shows the allocation of the
National sample for INRCOG for the Add-on places and the rest of Iowa, the allocation for the
INRCOG Add-on sample, and the total sample allocation.
16 Task C: Sample Design
Table 3-8. Iowa Northland Regional Council of Governments national sample and add-on
allocation
Place
National sample
stratum
ABS 12/14
occupied
housing units
National
sample
allocation
Add-on
allocation
TOTAL
sample
Cedar Falls
Counties within
MSAs < 1 million 16,144 3 370 373
Elk Run
Heights
Counties within
MSAs < 1 million 449 0 10 10
Evansdale
Counties within
MSAs < 1 million 2,107 0 48 49
Gilbertville
Counties within
MSAs < 1 million 410 0 9 9
Hudson
Counties within
MSAs < 1 million 562 0 13 13
Raymond
Counties within
MSAs < 1 million 150 0 3 3
Waterloo
Counties within
MSAs < 1 million 31,105 6 712 719
Rest of Black
Hawk in MPO
Counties within
MSAs < 1 million 1,463 0 34 34
Rest of Black
Hawk not in
MPO
Counties within
MSAs < 1 million 4,032 1 0 1
Rest of Iowa
Counties within
MSAs < 1 million 684,061 137 0 137
Rest of Iowa Not in an MSA 512,126 102 0 102
TOTAL 1,252,609 250 1,200 1,450 NOTE: The total sample column indicates the expected number of completed household surveys.
3.7 Maryland DOT Study Area
The target number of completed household surveys is 1,000 for the Maryland Add-on area, with
representation for the entire state. Households will be selected from each of three substrata: Central
MD, Eastern Shore, and Western MD. Twenty percent of the sample will be allocated to the
Western MD and Central MD substrata, and the remaining 60 percent will be allocated to the
Eastern Shore substratum. The three substrata have been split where necessary to maintain the four
main MSA/heavy rail sampling strata that will be used for the National Sample. (Note: Maryland
does not contain any counties with more than 1 million people and no heavy rail.)
Table 3-9 shows the definitions of the Maryland Add-on substrata and the corresponding National
sample strata. Also shown are the allocation for the National sample within the main MSA/heavy
rail sampling strata, the allocation for the Add-on substrata, and the total sample allocation.
17 Task C: Sample Design
Table 3-9 Maryland national sample and add-on allocation
Substrata defined by
MD Add-on
National sample
stratum
ABS 12/14
occupied housing
units
National
sample
allocation
Add-on
allocation
TOTAL
sample
Central MD (a)
Counties within MSAs >
1 million and heavy rail 2,007,631 365 196 561
Central MD (b)
Counties within MSAs <
1 million 38,790 7 4 11
Eastern Shore (a)
Counties within MSAs >
1 million and heavy rail 59,376 11 181 192
Eastern Shore (b)
Counties within MSAs <
1 million 86,016 16 262 278
Eastern Shore (c ) Not in an MSA 51,623 9 157 166
Western MD (a)
Counties within MSAs <
1 million 92,930 17 176 193
Western MD (b) Not in an MSA 12,867 2 24 26
TOTAL 2,349,233 427 1,000 1,427 NOTE: The total sample column indicates the expected number of completed household surveys.
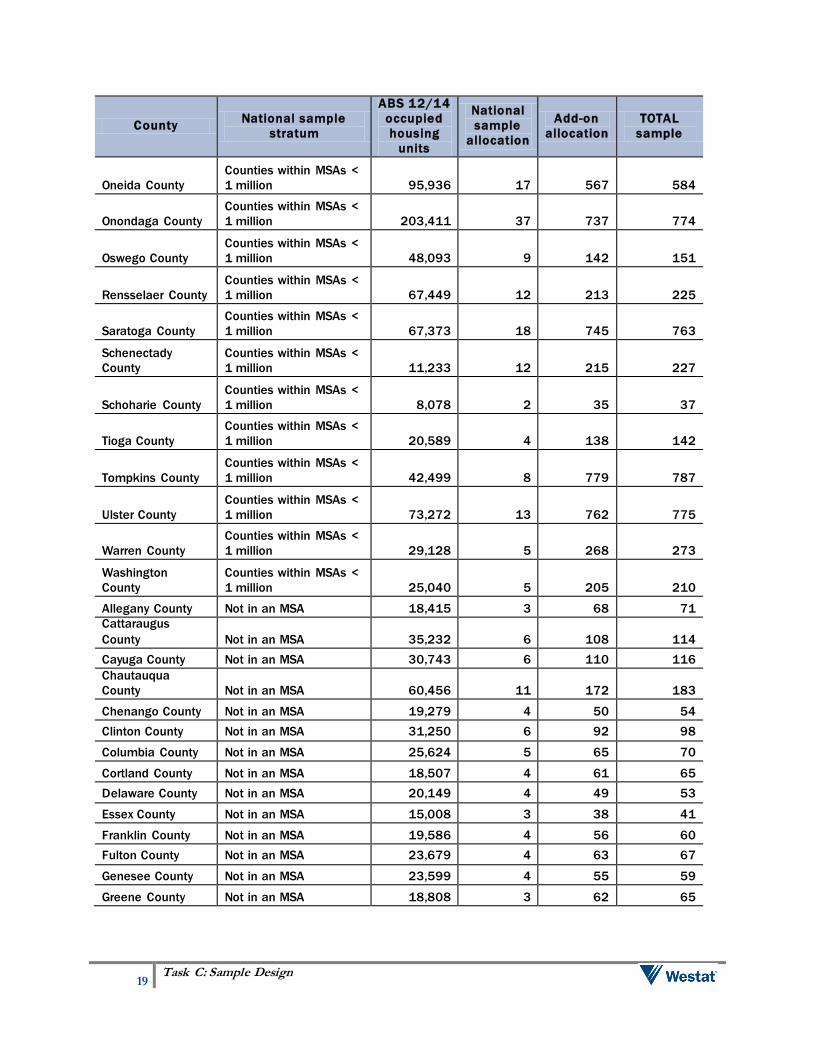
3.8 New York State DOT Study Area
The target number of completed household surveys is 15,851 for the New York Add-on area, with
representation for the entire state. The four main MSA/heavy rail strata will be used to allocate the
sample, proportionally to the number of households in each stratum for the National sample, and as
specified by the New York DOT for the Add-on area. The allocation for the National sample, the
Add-on area allocation, and the total sample allocation are given in table 3-10.3
Table 3-10 New York national sample and add-on allocation
County National sample
stratum
ABS 12/14
occupied
housing
units
National
sample
allocation
Add-on
allocation
TOTAL
sample
Bronx County
Counties within MSAs >
1 million and heavy rail 499,129 90 279 369
Dutchess County
Counties within MSAs >
1 million and heavy rail 112,161 20 800 820
Kings County
Counties within MSAs >
1 million and heavy rail 996,134 181 165 346
Nassau County
Counties within MSAs >
1 million and heavy rail 457,911 83 363 446
New York County
Counties within MSAs >
1 million and heavy rail 877,262 159 269 428
3 The original table in this document incorrectly reflected a total add-on sample of 15,718 HH, which did not match the actual
purchase of 15,851 HH as was correctly indicated in the text above. This table was updated by the editors to reflect the final distribution of the 15,851 HH purchased as documented by NYSDOT. Westat sampled using the outdated 15,718 distribution, which resulted in four counties being improperly sampled (Saratoga, Schenectady, St. Lawrence, and Seneca). The error was caused by multiple simultaneous factors and has been confirmed to only impact this portion of the sample.
18 Task C: Sample Design
County National sample
stratum
ABS 12/14
occupied
housing
units
National
sample
allocation
Add-on
allocation
TOTAL
sample
Orange County
Counties within MSAs >
1 million and heavy rail 135,030 25 767 792
Putnam County
Counties within MSAs >
1 million and heavy rail 36,046 7 733 740
Queens County
Counties within MSAs >
1 million and heavy rail 829,143 151 226 377
Richmond County
Counties within MSAs >
1 million and heavy rail 172,663 31 589 620
Rockland County
Counties within MSAs >
1 million and heavy rail 102,742 19 773 792
Suffolk County
Counties within MSAs >
1 million and heavy rail 529,440 96 355 451
Westchester
County
Counties within MSAs >
1 million and heavy rail 365,069 66 381 447
Erie County
Counties within MSAs >
1 million 414,237 75 468 543
Livingston County
Counties within MSAs >
1 million 25,167 5 56 61
Monroe County
Counties within MSAs >
1 million 328,367 60 418 478
Niagara County
Counties within MSAs >
1 million 98,504 18 135 153
Ontario County
Counties within MSAs >
1 million 47,729 9 82 91
Orleans County
Counties within MSAs >
1 million 16,415 3 53 56
Wayne County
Counties within MSAs >
1 million 38,561 7 70 77
Yates County
Counties within MSAs >
1 million 10,485 2 25 27
Albany County
Counties within MSAs <
1 million 134,372 24 416 440
Broome County
Counties within MSAs <
1 million 86,523 16 504 520
Chemung County
Counties within MSAs <
1 million 37,647 6 750 756
Herkimer County
Counties within MSAs <
1 million 26,016 5 168 173
Jefferson County
Counties within MSAs <
1 million 47,457 9 473 482
Madison County
Counties within MSAs <
1 million 27,116 5 80 85
19 Task C: Sample Design
County National sample
stratum
ABS 12/14
occupied
housing
units
National
sample
allocation
Add-on
allocation
TOTAL
sample
Oneida County
Counties within MSAs <
1 million 95,936 17 567 584
Onondaga County
Counties within MSAs <
1 million 203,411 37 737 774
Oswego County
Counties within MSAs <
1 million 48,093 9 142 151
Rensselaer County
Counties within MSAs <
1 million 67,449 12 213 225
Saratoga County
Counties within MSAs <
1 million 67,373 18 745 763
Schenectady
County
Counties within MSAs <
1 million 11,233 12 215 227
Schoharie County
Counties within MSAs <
1 million 8,078 2 35 37
Tioga County
Counties within MSAs <
1 million 20,589 4 138 142
Tompkins County
Counties within MSAs <
1 million 42,499 8 779 787
Ulster County
Counties within MSAs <
1 million 73,272 13 762 775
Warren County
Counties within MSAs <
1 million 29,128 5 268 273
Washington
County
Counties within MSAs <
1 million 25,040 5 205 210
Allegany County Not in an MSA 18,415 3 68 71
Cattaraugus
County Not in an MSA 35,232 6 108 114
Cayuga County Not in an MSA 30,743 6 110 116
Chautauqua
County Not in an MSA 60,456 11 172 183
Chenango County Not in an MSA 19,279 4 50 54
Clinton County Not in an MSA 31,250 6 92 98
Columbia County Not in an MSA 25,624 5 65 70
Cortland County Not in an MSA 18,507 4 61 65
Delaware County Not in an MSA 20,149 4 49 53
Essex County Not in an MSA 15,008 3 38 41
Franklin County Not in an MSA 19,586 4 56 60
Fulton County Not in an MSA 23,679 4 63 67
Genesee County Not in an MSA 23,599 4 55 59
Greene County Not in an MSA 18,808 3 62 65
20 Task C: Sample Design
Table 3-10 New York national sample and add-on allocation (Cont.)
County National sample
stratum
ABS 12/14
occupied
housing
units
National
sample
allocation
Add-on
allocation
TOTAL
sample
Hamilton County Not in an MSA 1,087 0 8 8
Lewis County Not in an MSA 9,108 2 42 44
Montgomery
County Not in an MSA 20,998 4 35 39
Otsego County Not in an MSA 22,116 4 94 98
Schuyler County Not in an MSA 14,090 1 24 25
Seneca County Not in an MSA 44,274 3 25 28
St. Lawrence
County Not in an MSA 96,401 8 141 149
Steuben County Not in an MSA 42,009 8 121 129
Sullivan County Not in an MSA 29,046 5 76 81
Wyoming County Not in an MSA 15,563 3 32 35
TOTAL 7,798,454 1,417 15,851 17,268 NOTE: The total sample column indicates the expected number of completed household surveys.
3.9 North Carolina DOT Study Area
The target number of completed household surveys is 8,000 for the North Carolina Add-on area,
with representation for the entire state. Households will be selected from each of 18 substrata. The
NC DOT originally specified ten substrata, some of which had to be split to account for the hard
boundaries of the four primary sampling strata. These splits are designated by (a), (b), or (c),
following the original substratum description, resulting in a total of 18 substrata. The Triangle (c),
Triad, and both Central Non-MPO (a) and (b) substrata all contain block-level portions of several
counties. The other substrata contain full counties. The allocation for the National sample, the Add-
on area allocation, and the total sample allocation are given in table 3-11.
Table 3-11 North Carolina national sample and add-on allocation
Substrata
defined by NC
Add-on National sample stratum
ABS 12/14
occupied
housing units
National
sample
allocation
Add-on
allocation
TOTAL
sample
1: Triangle (a) Counties within MSAs > 1 million 489,808 89 336 425
1: Triangle (b) Counties within MSAs < 1 million 231,517 42 159 201
1: Triangle (c) Not in an MSA 6,615 1 5 6
2: Triad Counties within MSAs < 1 million 541,666 98 500 598
3: Metrolina (a) Counties within MSAs > 1 million 818,072 149 461 610
3: Metrolina (b) Not in an MSA 68,668 12 39 51
4: MPO Group 1 Counties within MSAs < 1 million 266,000 48 1,200 1,248
5: MPO Group 2 Counties within MSAs < 1 million 274,318 62 700 762
6: MPO Group 3 Counties within MSAs < 1 million 203,866 3 900 903
21 Task C: Sample Design
Table 3-11 North Carolina national sample and add-on allocation (Cont.)
Substrata
defined by NC
Add-on National sample stratum
ABS 12/14
occupied
housing units
National
sample
allocation
Add-on
allocation
TOTAL
sample
7: Eastern Non-
MPO (a) Counties within MSAs > 1 million
14,500 5 51 56
7: Eastern Non-
MPO (b) Counties within MSAs < 1 million
30,660 7 108 115
7: Eastern Non-
MPO (c) Not in an MSA
310,294 61 1,091 1,153
8: Central Non-
MPO (a) Counties within MSAs < 1 million
127,274 18 411 429
8: Central Non-
MPO (b) Not in an MSA
259,835 45 839 884
9: Western Non-
MPO (a) Counties within MSAs < 1 million
29,380 4 52 56
9: Western Non-
MPO (b) Not in an MSA
240,724 74 848 921
10: FBRMPO (a) Counties within MSAs < 1 million 202,833 28 288 316
10: FBRMPO (b) Not in an MSA 14,555 3 12 14
TOTAL 4,130,585 750 8,000 8,750 NOTE: The total sample column indicates the expected number of completed household surveys.
3.10 South Carolina DOT Study Area
The target number of completed household surveys is 6,500 for the South Carolina Add-on area,
covering substrata defined by rural and non-rural components of several Councils of Government
(COGs) and MPOs. Sample sizes within each area were specifically defined by the Add-on area.
Shape files were provided by the SCDOT for the exact areas to be covered. These files were
mapped to Census block boundaries, such that the entire state was partitioned into the requested
substrata. Some of the substrata had to be split further to account for the hard boundaries of the
four primary sampling strata. These splits are designated by (a) or (b), following the original
substratum description, resulting in a total of 31 substrata. The allocation for the National sample,
the Add-on area allocation, and the total sample allocation are given in table 3-12.
Table 3-12 South Carolina national sample and add-on allocation
Substrata defined by
SC Add-on: MPOs National sample stratum
ABS 12/14
occupied
housing units
National
sample
allocation
Add-on
allocation
TOTAL
sample
1: ACOG Rural (a) Counties within MSAs < 1
million 32,882 6 79 85
1: ACOG Rural (b) Not in an MSA 58,017 11 139 150
2: ACOG MPO Counties within MSAs < 1
million 341,526 62 72 134
22 Task C: Sample Design
Table 3-12 South Carolina national sample and add-on allocation (Cont.)
Substrata defined by
SC Add-on: MPOs National sample stratum
ABS 12/14
occupied
housing units
National
sample
allocation
Add-on
allocation
TOTAL
sample
3: ANATS Counties within MSAs < 1
million 81,632 15 500 515
4: BCDCOG Counties within MSAs < 1
million 27,156 5 200 205
5: CHATS Counties within MSAs < 1
million 275,797 50 1,000 1,050
6: CRCP Rural (a) Counties within MSAs > 1
million 54,857 10 158 168
6: CRCP Rural (b) Counties within MSAs < 1
million 12,682 2 37 39
7: CRCP MPO Counties within MSAs > 1
million 90,170 16 65 81
8: CMRCP (a) Counties within MSAs < 1
million 23,428 4 118 122
8: CMRCP (b) Not in an MSA 16,510 3 83 86
9: COATS (a) Counties within MSAs < 1
million 287,801 52 1,200 1,252
9: COATS (b) Not in an MSA 68 0 0 0
10: LCOG Rural (a) Counties within MSAs < 1
million 11,820 2 75 77
10: LCOG Rural (b) Not in an MSA 22,914 4 146 150
11: LCOG MPO Counties within MSAs < 1
million 79,705 14 39 53
12: LSCOG (a) Counties within MSAs < 1
million 5,388 1 18 19
12: LSCOG (b) Not in an MSA 54,242 10 182 192
13: PDRCOG (a) Counties within MSAs < 1
million 31,583 6 84 90
13: PDRCOG (b) Not in an MSA 54,495 10 145 155
14: FLATS Counties within MSAs < 1
million 52,785 10 470 480
15: SLCOG Rural (a) Counties within MSAs < 1
million 14,183 3 45 48
15: SLCOG Rural (b) Not in an MSA 20,929 4 65 69
16: SLCOG MPO Counties within MSAs < 1
million 38,577 7 120 127
17: USCOG (a) Counties within MSAs < 1
million 35,009 6 90 96
17: USCOG (b) Not in an MSA 42,877 8 110 118
18: WRPDC Rural (a) Counties within MSAs < 1
million 22,689 4 30 34
18: WRPDC Rural (b) Not in an MSA 21,765 4 30 34
23 Task C: Sample Design
Table 3-12 South Carolina national sample and add-on allocation (Cont.)
Substrata defined by
SC Add-on: MPOs National sample stratum
ABS 12/14
occupied
housing units
National
sample
allocation
Add-on
allocation
TOTAL
sample
19: WRPDC MPO (a) Counties within MSAs < 1
million 131,036 24 174 198
19: WRPDC MPO (b) Not in an MSA 19,862 4 26 30
20: ARTS Counties within MSAs < 1
million 81,964 15 1,000 1,015
TOTAL 2,044,349 371 6,500 6,871
NOTE: The total sample column indicates the expected number of completed household surveys.
3.11 Wisconsin DOT Study Area
The target number of completed household surveys is 11,000 for the Wisconsin Add-on area, with
representation for the entire state. Households will be selected from each of 16 substrata. The
Wisconsin DOT originally specified nine substrata, some of which had to be split to account for the
hard boundaries of the four primary sampling strata. These splits are designated by (a), (b), (c), or
(d) following the original substratum description, resulting in a total of 16 substrata. The allocations
for the National sample, the final substrata, and the total sample are given in table 3-13.
Table 3-13 Wisconsin national sample and add-on allocation
Substrata defined by
WI Add-on National sample stratum
ABS 12/14
occupied
housing units
National
sample
allocation
Add-on
allocation
TOTAL
sample
St. Croix County
Counties within MSAs > 1
million and not heavy rail 33,574 6 150 156
Eau Claire MPO
Counties within MSAs < 1
million 67,891 12 304 316
Wausau, Stevens
Point, and Wisconsin
Rapids (a)
Counties within MSAs < 1
million 57,050 10 255 266
Wausau, Stevens
Point, and Wisconsin
Rapids (b) Not in an MSA 64,382 12 288 300
Northeast Region (a)
Counties within MSAs < 1
million 395,350 72 1,769 1,841
Northeast Region (b) Not in an MSA 91,517 17 410 426
Dane County
Counties within MSAs < 1
million 226,080 41 1,012 1,053
La Crosse County
Counties within MSAs < 1
million 50,414 9 226 235
Rock County
Counties within MSAs < 1
million 67,682 12 303 315
Southeast Region (a)
Counties within MSAs > 1
million and heavy rail 68,557 12 307 319
24 Task C: Sample Design
Substrata defined by
WI Add-on National sample stratum
ABS 12/14
occupied
housing units
National
sample
allocation
Add-on
allocation
TOTAL
sample
Southeast Region (b)
Counties within MSAs > 1
million and not heavy rail 672,728 122 3,011 3,133
Southeast Region (c)
Counties within MSAs < 1
million 82,462 15 369 384
Southeast Region (d) Not in an MSA 45,504 8 204 212
All other areas (a)
Counties within MSAs > 1
million and not heavy rail 15,289 3 68 71
All other areas (b)
Counties within MSAs < 1
million 67,829 12 304 316
All other areas(c) Not in an MSA 451,467 82 2,021 2,103
TOTAL 2,457,776 447 11,000 11,447 NOTE: The total sample column indicates the expected number of completed household surveys.
3.12 Texas DOT and North Central Texas Council of Governments Study Areas
The target number of completed household surveys is 20,000 for the Texas DOT Add-on area, with
representation for the entire state. Households will be selected from all Texas counties proportional
to the number of households in each county.
The target number of completed household surveys is 2,917 for the North Central Texas Council of
Governments Add-on area, with representation for twelve counties in the state: Collin, Dallas,
Households will be selected from these Texas counties proportional to the number of households in
each county. The allocations for the National sample, the Texas DOT sample, the NCTCOG
sample, and the total sample are given in table 3-14.
Table 3-14 Texas national sample, Texas DOT add-on allocation, and NCTCOG add-on allocation
Place
National sample
stratum
ABS 12/14
occupied
housing
units
National
sample
allocation
TXDOT Add-
on allocation
NCTCOG
Add-on
allocation
TOTAL
sample
Collin
Counties within
MSAs > 1 million
and not heavy rail
325,795 59 648 365 1,072
Dallas
Counties within
MSAs > 1 million
and not heavy rail
954,979 173 1,899 1,069 3,142
Denton
Counties within
MSAs > 1 million
and not heavy rail
277,877 50 553 311 914
Ellis
Counties within
MSAs > 1 million
and not heavy rail
55,197 10 110 62 182
Hood
Counties within
MSAs > 1 million
and not heavy rail
23,949 4 48 27 79
25 Task C: Sample Design
Hunt
Counties within
MSAs > 1 million
and not heavy rail
34,869 6 69 39 115
Johnson
Counties within
MSAs > 1 million
and not heavy rail
56,789 10 113 64 187
Kaufman
Counties within
MSAs > 1 million
and not heavy rail
39,692 7 79 44 131
Parker
Counties within
MSAs > 1 million
and not heavy rail
47,414 9 94 53 156
Rockwall
Counties within
MSAs > 1 million
and not heavy rail
30,932 6 62 35 102
Tarrant
Counties within
MSAs > 1 million
and not heavy rail
736,253 134 1,464 824 2,422
Wise
Counties within
MSAs > 1 million
and not heavy rail
21,518 4 43 24 71
Rest of
Texas
Counties within
MSAs > 1 million
and not heavy rail
4,044,041 735 8,041 0 8,776
Rest of
Texas Counties within
MSAs < 1 million 2,297,085 417 4,568 0 4,985
Rest of
Texas Not in an MSA 1,111,630 202 2,210 0 2,412
TOTAL
10,058,020 1,827 20,000 2,917 24,744
NOTE: The total sample column indicates the expected number of completed household surveys.
4. Weighting, Estimation, and Variance Estimation
Estimates will be generated at the National level and for each specified Add-on area separately. In general, the estimation procedure consists of taking appropriately weighted totals or averages of the sample data. These weights are designed to provide approximately unbiased estimators at the National level, the state level, and for each Add-on area. Several stages of non-response adjustment and poststratification will be done to reduce sampling error and bias. Separate sets of weights will be generated for the Add-on areas and for the National sample. The primary set of household weights is for completed households. Households are defined as completed when a retrieval survey is completed for all eligible persons age 5 and older in the household. Vehicle-level weights, person-level weights and travel-day trip-level weights will also be produced. The household- level weights are designed to represent all households in the study area. The vehicle-level weights are designed to represent all vehicles in the study area. The person-level weights are designed to represent all persons in the study area. The travel-day trip-level weights are designed to represent all trips in the designated time period in the study area.
26 Task C: Sample Design
An overview of the weighting methodology is given in the following sections. Additional details will be provided in the final weighting plan to be prepared at the conclusion of the study.
4.1 Initial Household Weight
Since addresses will be sampled simultaneously (i.e., in a single selection) for the National study and the Add-on areas, the base weight for all sampled addresses is simply the reciprocal of the probability of selection of each address. Weighting each sample unit by its base weight results in the traditional Horvitz-Thompson estimator, which is unbiased across all possible samples (see for example Cochran, 1977, Section 9A.7). The sampling rate for the address sample may vary considerably across strata4.
4.2 Adjustments for Non-response
Non-response unfortunately is a major and continuously growing problem with every survey. Extensive work will be done to analyze non-response, and the potential for bias, and build in adjustments based on this analysis. Part of this analysis will be a non-response analysis similar to that done for NHTS 2009. This analysis will be commenced before the end of the study based on three quarters of data, and then revised with the final results. This will allow us to have the analysis completed in time to inform our non-response adjustment process. The non-response adjustments are based on a paradigm generally used in survey research (see for example Oh and Scheuren, 1983). Under this paradigm, non-response is treated as a subsampling process within carefully specified non-response-adjustment cells. The non-response-adjustment cells are specified to be heterogeneous in response propensity (the probability of responding) across cells, and homogeneous in response propensity within cells, and the variables considered in forming the cells are variables associated with key survey outcomes. The non-response bias analysis to be conducted will inform this cell selection process by finding characteristics which are related to response propensity (propensity to be successfully contacted, propensity to cooperate at the recruitment level, propensity to cooperate at the retrieval interview level). The final non-response adjustments are equal to the inverse of the base-weighted response rates within the selected non-response cells. For each of the two phases of non-response, the final selection of non-response cells will utilize a categorical search algorithm. The algorithm efficiently captures the complex interaction of factors associated with response propensity. These non-response cells will nest within the primary strata utilized in sample selection. The cells will not be smaller than 30 sample units, as
4 It should be noted that this sampling rate is the „final‟ sampling rate, including any reserve samples finally included with the
original sample.
27 Task C: Sample Design
cells with limited numbers of sample units generate unreliable (highly variable) non-response adjustments. In addition, cells with very low weighted response rates will be collapsed with other cells to avoid extreme weighting adjustments which can increase variability to a greater extent. Non-response adjustment will be done separately for non-response to the recruitment phase (recruitment non-response) and the retrieval phase (retrieval survey non-response among recruited households). In particular, the final non-response adjustments for recruitment non-response will include an adjustment reflecting estimated percentages of eligible addresses (i.e., addresses corresponding to households) among those with unknown eligibility status5. The variables considered in forming the cells for recruitment non-response include those available from the American Community Survey (ACS) at the tract level and data available from the ABS frame. The following are examples of variables that may be included in the weight ing process:
Type of location (central city, urban fringe, towns, rural) Whether or not a telephone number could be matched to the address; Tract-level percent Black, White, Hispanic, Asian; Tract-level median household income; Tract-level median years of education; Tract-level percent owner occupied housing; Tract-level percent college graduates; Tract-level percent in age groups (25-34, 35-64, 65 and over);
For the retrieval phase non-response-adjustment cells, we can also include information from the recruitment questionnaire, such as household size, race/ethnicity, age, gender, and level of education of the reference person, home ownership, location, home type, and number of vehicles in household.
4.3 Non-response Bias Analysis
Non-response may bias survey estimates if the characteristics of respondents differ from those of non-respondents. Traditionally, the size of the bias has been viewed as a deterministic function of the extent and size of the response difference and the response rate (see, for example, Sarndal& Lundström, 2005, for discussion). More recently, the emphasis has shifted toward a stochastic perspective that characterizes non-response bias by examining the relationship between the key variable and the response propensity (Groves et al., 2007; Montaquila et al., 2007). Adjustments to the survey weights (discussed in section 4.2) aim to reduce bias due to
5 This needs to be estimated as we do not know whether postmaster returned mail is coming from eligible households or not, and
can only estimate a percentage of eligibility for these outcomes.
28 Task C: Sample Design
non-response. However, even with such adjustments, it is important to have a plan to evaluate the potential for non-response bias. A variety of methods are available to assess non-response bias. Previous research has suggested that each of these methods has strengths and weaknesses, thus a multi-method approach is recommended for a comprehensive evaluation of non-response bias. With respect to non-response, the largest concern for the NHTS is non-response in the recruitment phase. The recruitment phase is the phase that historically has yielded the bulk of the non-response, and that is expected to be the case for the 2016 survey as well, even with the shift to a mail-based ABS approach. The ABS approach affords the opportunity to link in covariates at both aggregate (e.g., tract-level characteristics from the American Community Survey) and address-level, for use in non-response adjustment and in bias analyses. The recruitment survey will contain several variables (e.g., number of household members) that may be associated with non-response to the retrieval phase and are associated with key survey outcome variables. Having this rich set of variables will be very useful for non-response adjustment and non-response bias analysis at the retrieval phase. Our non-response bias analysis will incorporate techniques from a variety of approaches to study non-response at both the recruitment and retrieval phases.
4.4 Adjustments for Under- and Overcoverage
Nationally, ABS frames have been estimated to yield very high coverage (estimated at around 97-98 percent) when the survey mode(s) permit the inclusion of virtually all types of mailable household addresses, as is the case with mail as the primary mode for recruitment in the 2016 NHTS. The potential for undercoverage on the ABS frame lies mostly with housing units that cannot be associated with a mailable address. However, for sub-National estimates (e.g., estimates for Add-on areas), under- or over-coverage may occur due to households being linked to the wrong areas, either due to geocoding error or due to having a P.O. Box address located in an area that is different from their area of residence. It is possible to adjust for under- or overccoverage through a poststratification weighting process called “raking,” where the weights
are iteratively adjusted to independent control totals6 for various demographic categories. The process has the effect of differentially adjusting the weights of the sampled households within groups of demographically similar households, so that the total sum of weights for the sampled households equals the corresponding independent control totals for all households (including those not covered by the ABS sample). The raking process has a number of “dimensions.” The weights are adjusted to equal the totals
within the cells for each dimension in an iterative process, until the process converges, and every 6 The independent control totals for households and persons will come from the most recent American Community Survey.
29 Task C: Sample Design
dimension‟s cell totals equal the independent control totals7. The dimensions at the household weighting level will include geography, race/ethnic percentages, household size, and household ownership (renter or owner). The dimensions for person-level weighting will also include sex, age categories, and personal race/ethnicity. Raking to socioeconomic Census control totals is standard practice for large-scale surveys. This survey in particular also includes dimensions such as day of the week and month of the year. Each day of the week will be one level, and pairs of months of the year (Jan-Feb, Mar-Apr, etc.) will be levels. This helps ensure that each day is represented at its correct traffic level and each pair of months is represented at its correct traffic level, so that for example weekends or the winter are not over or under represented in the estimator. These control totals will be applied to the travel-day weights. The raking procedure will be done for the National sample (either “stand-alone” or combined
with the Add-on samples), and will also be done for each Add-on area separately. The procedure for each Add-on will be done entirely within the particular Add-on area to avoid altering the weights to satisfy a constraint across areas. The raking procedure for each Add-on area will have fewer dimensions and levels than the National sample as the samples in the Add-on areas are smaller than the full National sample plus the Add-on areas.
4.5 Variance Estimation
Variance estimation will be done by the generation of jackknife replicate weights (see, for example, Wolter, 2007, Section 4 for a general discussion of the jackknife method). For each jackknife replicate in each primary stratum a portion of the sample is deleted, with the remaining sample in the stratum reweighted8, to generate a replicate estimate of the characteristic of interest. The squared differences between the replicate estimates and the full-sample estimates provide a consistent estimator of the variance9. For the Add-on studies, the jackknife strata will generally be the same as the sampling strata. There should be enough jackknife replicates to estimate variance reliably (with enough precision), but not so many that the data set acquires too many fields. Usually 100 jackknife replicates is a good balance. The “portion of the sample”
deleted will roughly correspond to 10 interviewed households, or roughly 35 sampled households. For example, an Add-on stratum with a target of 600 interviewed households will roughly have 60 replicate weights. Of course, samples of size larger than 1,000 interviewed households will require more than 100 replicate weights by this criterion, but our maximum for
7 In some cases, the process may not converge if there are „irreconcilable contradictions‟ between adjusting for the various
dimensions. This may happen if the cross-cells across dimension levels have too small a sample size. If convergence does not occur, then levels will be collapsed within dimensions, or dimensions could be dropped all together.
8 By increasing the weights by a factor 1ss nn , where ns is the number of replicates for the stratum.
9 The sum of squares needs to be multiplied by the factor ss nn 1
30 Task C: Sample Design
operational reasons is 100. In this case we will combine sample portions so that the final replicate count is no larger than 10010. If the optimal replicate set is less than 100, then 100 replicate weights will be produced so that all of the delivery files have the same number of replicate weights (the extra replicate weights in this case will all be equal to the final weight, contributing zero sums of squares).
References
Barron, M., Barron, M., Kelly, J., Montgomery, R., Singleton, J., Shin, H. C., Skalland, B., Tao, X., and Wolter, K. (2013). More on the extent of undercoverage in RDD telephone surveys due to the omission of 0- banks. Survey Practice, 3(2).
Barron, M. and Zhao, Z. (2010). Measuring undercoverage of landline telephone population in
1+ 100 bank surveys. Presented at the 65th Annual Conference of the American Association for Public Opinion Research.
Blumberg SJ, and Luke JV. Wireless substitution: Early release of estimates from the National
Health Interview Survey, July-December 2009. National Center for Health Statistics. May 2010. Available from: /nchs/nhis.htm.
Boyle, J., Bucuvalas, M., Piekarski, L., and Weiss, A. (2009). Zero banks: Coverage error and
bias in RDD samples based on hundred banks with listed numbers. Public Opinion Quarterly, 73(4), 729-750.
Cochran, William G. Sampling techniques. John Wiley & Sons, 1977. Fahimi, M., Kulp, D., and Brick, J.M. (2009). A reassessment of list-assisted RDD methodology.
Public Opinion Quarterly, 73(4), 751- 760. Groves, R. M., Couper, M. P., Presser, S., Singer, E., Tourangeau, R., Acosta, G. P., and Nelson,
L. (2006). Experiments in producing non-response bias. Public Opinion Quarterly, 70(5), 720-736.
Iannacchione, Vincent G. The changing role of address-based sampling in survey
research. Public Opinion Quarterly 75.3 (2011): 556-575. Montaquila, J. M., Brick, J. M., Hagedorn, M. C., Kennedy, C., and Keeter, S. (2007). Aspects of
non-response bias in RDD telephone surveys. In Advances in telephone survey methodology (pp. 561-586). NJ: Wiley & Sons.
10 The combinations introduce unwanted cross-product terms (with expected value 0), which introduce no bias but do reduce the