Tassal Group Limited Tassal Group Limited Results Presentation Financial Year Ended 30 June 2008 27 August 2008 The following slides should be read in conjunction with Tassal Group Limited’s Appendix 4E: Preliminary Final Report for the Year Ended 30 June 2008 lodged with the Australian Securities Exchange on 27 August 2008 1 Australian Securities Exchange on 27 August 2008
Transcript
Tassal Group LimitedTassal Group Limited
Results Presentation
Financial Year Ended 30 June 2008
27 August 2008
The following slides should be read in conjunction with Tassal Group Limited’s Appendix 4E: Preliminary Final Report for the Year Ended 30 June 2008 lodged with the
Australian Securities Exchange on 27 August 2008
1
Australian Securities Exchange on 27 August 2008
AgendaAgenda
• Executive Summary
• Historical Performance • Historical Performance
• Financial Detail
• Superior Gold Update
• Priorities
• Outlook
2
Executive SummaryExecutive Summary
Tassal is pleased to announce a strong Full Year Normalised result for 2008 1Tassal is pleased to announce a strong Full Year Normalised result for 2008 1
Revenue of $167.3m (+16% on pcp)
EBITDA of $34.7m (+22% on pcp)
NPAT of $21.2m (+33% on pcp)
Basic EPS 17.1 cps (+22% on pcp)
Net Debt reduced to $32 6m (from $52 1m at 30 June 2007)Net Debt reduced to $32.6m (from $52.1m at 30 June 2007)
Final dividend of 3.5c per share (+27% on pcp)
30-June-2008 30-June-2007 Change ChangeU d l i ti l lt $’000 $’000 $’000 %Underlying operational result $’000 $’000 $’000 %Revenue (from all sources) 167,266$ 144,001$ 23,265$ 16.16%EBITDA 34,661$ 28,431$ 6,230$ 21.91%Depreciation (2,457)$ (1,623)$ (834)$ 51.39%EBIT 32,204$ 26,808$ 5,396$ 20.13%Borrowing Costs (4 114)$ (4 590)$ 476$ (10 37)%Borrowing Costs (4,114)$ (4,590)$ 476$ (10.37)%Profit before income tax expense 28,090$ 22,218$ 5,872$ 26.43%Tax expense (6,890)$ (6,230)$ (660)$ 10.59%NPAT 21,200$ 15,988$ 5,212$ 32.60%EPS 0.171$ 0.140$ 0.031$ 21.83%
31. Underlying operational earnings (i.e. normalised earnings) have been adjusted for the impact of AASB141 and non-recurring items to reflect the underlying financial performance of the Group
Executive SummaryExecutive Summary
Key Highlights:y g g
Strong growth in salmon demand – overall sales volume growth of 14.3%
Improved operating metrics – increase in harvested fish size, reduced cost of production and higher effective price for domestic and export
The underlying finished goods cost (i.e. cost of fish, processing, third party contractors and packaging) was reduced to $6.54 kg hog [FY2007: $6.91kg hog]
Proceeds from capital raising employed towards acquisition of Superior Gold, pursuing growth opportunities, accelerating capital investment and reducing debt
Superior Gold performing to plan with $8.3m revenue contribution for the period –achieving synergies on supply and trading terms
Accelerated capital investment focused on growth, efficiency and risk mitigation Accelerated capital investment focused on growth, efficiency and risk mitigation
Continued research & development with focus on fish husbandry and selective breeding program
4
Strong cash generation and reduction in net debt
Historical Performance Historical Performance
Growth in domestic demand for Salmon + trout leading to strong volume growth g g g
16,000 16,000
10 000
12,000
14,000
'000
)
10 000
12,000
14,000
'000
)
6,000
8,000
10,000
og kgs sold (
Export
Domestic6,000
8,000
10,000
og kgs sold (
Export
Domestic
‐
2,000
4,000 Ho Domestic
‐
2,000
4,000 Ho Domestic
2004 2005 2006 2007 2008
Year ended 30 June
2004 2005 2006 2007 2008
Year ended 30 June
5
Historical Performance Historical Performance
Tassal continues to consistently deliver a reducing cost base Cost improvement of 37% over period
Fish growing costs on track to deliver FY2015 global best practice target of $3 50 kg
$‐
$2.00
2004 2005 2006 2007 2008
Finishe
$‐
$2.00
2004 2005 2006 2007 2008
Finishe
$3.50 kg
(nb: Data not broken down due to competitor sensitivities)
2004 2005 2006 2007 2008
Year ended 30 June
2004 2005 2006 2007 2008
Year ended 30 June
6* Underlying finished goods cost = cost of fish, processing, third party contractors, and packaging expressed as a cost per head on gutted equivalent kilogram
Historical Performance Historical Performance
Strong growth in underlying NPAT and EPSStrong growth in underlying NPAT and EPS
$0 16
$0.18 $25,000
$0 16
$0.18 $25,000
$0 10
$0.12
$0.14
$0.16
$15,000
$20,000
ing EPS
g NPA
T
$0 10
$0.12
$0.14
$0.16
$15,000
$20,000
ing EPS
g NPA
T
EPS CAGR: FY2004 – FY2008 37.6%
$0.06
$0.08
$0.10
$10,000 Und
erlyi
Und
erlyin
$0.06
$0.08
$0.10
$10,000 Und
erlyi
Und
erlyin
$‐
$0.02
$0.04
$0
$5,000
2004 2005 2006 2007 2008
$‐
$0.02
$0.04
$0
$5,000
2004 2005 2006 2007 20082004 2005 2006 2007 2008
Year ended 30 June
Underlying NPAT Underlying EPS
2004 2005 2006 2007 2008
Year ended 30 June
Underlying NPAT Underlying EPS
7
Historical Performance Historical Performance
Continuing to return an increasing dividend payment Continuing to return an increasing dividend payment to shareholders – payout ratio circa 40%
7 00$10 000 7 00$10 000
DRP active - cash saved is being 5.00
6.00
7.00
$8,000
$10,000
000) 5.00
6.00
7.00
$8,000
$10,000
000)
utilised to grow the business from both an operational and infrastructure
3.00
4.00
$4,000
$6,000
ts per sh
are
ividen
d paid ($'0
3.00
4.00
$4,000
$6,000
ts per sh
are
ividen
d paid ($'0
perspective, as well as reducing gearing
‐
1.00
2.00
$0
$2,000
CentDi
‐
1.00
2.00
$0
$2,000
CentDi
2004 2005 2006 2007 2008
Year ended 30 June
Quantum ($'000) CPS
2004 2005 2006 2007 2008
Year ended 30 June
Quantum ($'000) CPS
8
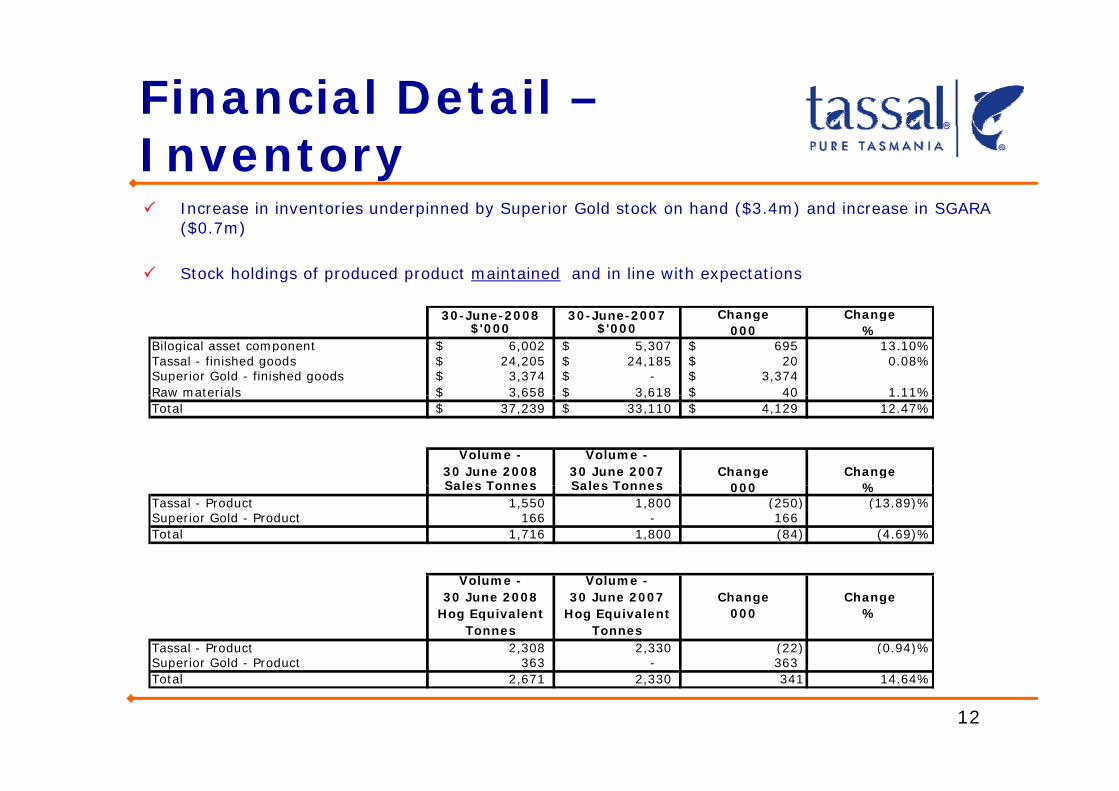
Financial DetailFinancial Detail
Strong underlying (“Normalised”) NPAT $21.2 million (+33% compared to pcp)Strong underlying ( Normalised ) NPAT $21.2 million (+33% compared to pcp)
Strong growth in sales revenue (16.1%) and sales volume (14.3%)
Strong growth in EBITDA (21 9%) underpinned by strong domestic salmon sales and Strong growth in EBITDA (21.9%) underpinned by strong domestic salmon sales and reduction in cost of growing and processing
“Normalised” results remove the impact of AASB 141 “Agriculture” and add FY2008
Superior Gold Product 363 363 Total 2,671 2,330 341 14.64%
Financial Detail – Net Debt Bridge
Strong cash generation and reduction in net debtStrong cash generation and reduction in net debt
Proceeds from capital raising employed towards acquisition of Superior Gold, pursuing growth opportunities, accelerating capital investment and reducing debt
$65.6m$3.0m$29.1m
$m
Strong underlying
$52.1m
$25.4m Strong underlying cash flow from operations
Utilised to underpin growth in inventory$5
$11.4m
$32.6m
growth in inventory
Net debt Superior Gold Capital Net Capital OperatingDividend / Net debt
Gearing 17.2%Gearing 49.7%
13
Net debt 30 June 2007
Superior GoldBrand & Inventory
Capital Investment
Net CapitalRaising
Operating Cash Flow
Dividend /Other
Net debt 30 June 2008
Financial Detail – Cash “drill down”
Strong operating cash flow supporting growth in working
Significant cash profit
Strong operating cash flow supporting growth in working capital and capital investment and reducing net debt
Movement Movement12 Months 12 Months Period
Ended Ended Movement Significant cash profit uplift from operations
2008 focus on targeted and planned investment in live fish growth
ded ded o e e t30/06/2008 30/06/2007 Differential
Profit after tax add back non-cash items $34,979 $28,363 $6,616
(Increase) / decrease in assets:
Inventories (net of AASB 141 Impact) ($3 434) ($17 884) $14 450 in live fish growth
2007 focus on processed stock build to the required level to meet both future demand
Inventories (net of AASB 141 Impact) ($3,434) ($17,884) $14,450Biological assets (net of AASB 141 Impact)) ($16,341) ($5,104) ($11,237)
Combined inventory category movement ($19,775) ($22,988) $3,213
Current trade and other receivables ($9,580) ($1,702) ($7,878)Other ($311) ($474) $163
requirements and accompanying sales lead times
Debtors increase reflects
Total (Increase) / decrease in assets: ($29,666) ($25,164) ($4,502)
Increase / (decrease) in liabilities
Current trade and other payables $3,360 $6,091 ($2,731)Other $354 $96 $258
increased retail sales and Petuna sales commencement in H2 FY2008.
Total Increase / (decrease) in liabilities $3,714 $6,187 ($2,473)
Net cash from operating activities for the period $9,027 $9,386 ($359)
Adjustment for Superior Gold inventory acquired at brand purchase date $2,366
14
Underlying net cash from operating activities for the period $11,393 $9,386 $2,007
Financial Detail –Capital Investment Tassal’s accelerated capital investment plan is focused on growth, efficiency and p p g , yrisk mitigation capital items
Efficiency related items target pay back less than 2 years and IRR + 30%.
Hatchery
Automatic feeders
Harvest vessels
Margate expansiong p
Processing automation
Product innovationProduct innovation
15
HatcheryHatchery
Rookwood Hatchery - on stream Q4 FY2009 4 million SmoltCost – circa $15m -$18m Funding via debt /
Rookwood Hatchery - on stream Q4 FY2009
Funding via debt / operating cash flowWill allow significant improvement in smolt size and smolt size and reduction of late smoltsLow water requirement -q209,500,000 fewer litres water per dayControlled environment
OxygenTemperature
Easier to staffCloser to farms = Closer to farms lower transport cost
16
Automatic FeedersAutomatic Feeders
All stock now fed via automatic feedersNo missed feeding No missed feeding opportunitiesScale down marine labour force numbersScale down vessel Scale down vessel fleetMaximise technologyMaximise our Feed Conversion Ratio Conversion Ratio –i.e. “kgs of feed in for a kg of growth out”:Cost (3 units) -$2.5m - $3.0m$2.5m $3.0mPayback < 1 yearIRR + 50%
17
Harvest Vessels Harvest Vessels
“Tassal 1” in useArctic Bear en routeReduced risk
EscapementEscapementMortalitySpread of disease
QualityS i ld h iSuperior cold chain managementLower stress
Margate facility to be upgraded to be primary fresh primary fresh processing siteInfrastructure investment as part of FY2015 t t i Pl FY2015 strategic Plan and 30,000 tonnes platformUnlikely to materially impact FY2009
20
Product InnovationProduct Innovation
21
Superior Gold UpdateSuperior Gold Update
Superior Gold made a positive EBIT contribution for the 4.5 months to 30 June p p2008 in line with expectations.
Completed acquisition on 15 February 2008
Acquisition price $25.4m, comprising brand value ($23.1m), inventory ($2.3m)
Superior Gold achieved sales of $8.3m for the 4.5 months to 30 June 2008
Sales comprise Salmon $6.8m and Trout $1.5m.
Planning for annualised revenue, net of discontinued lines, of $25m.
22
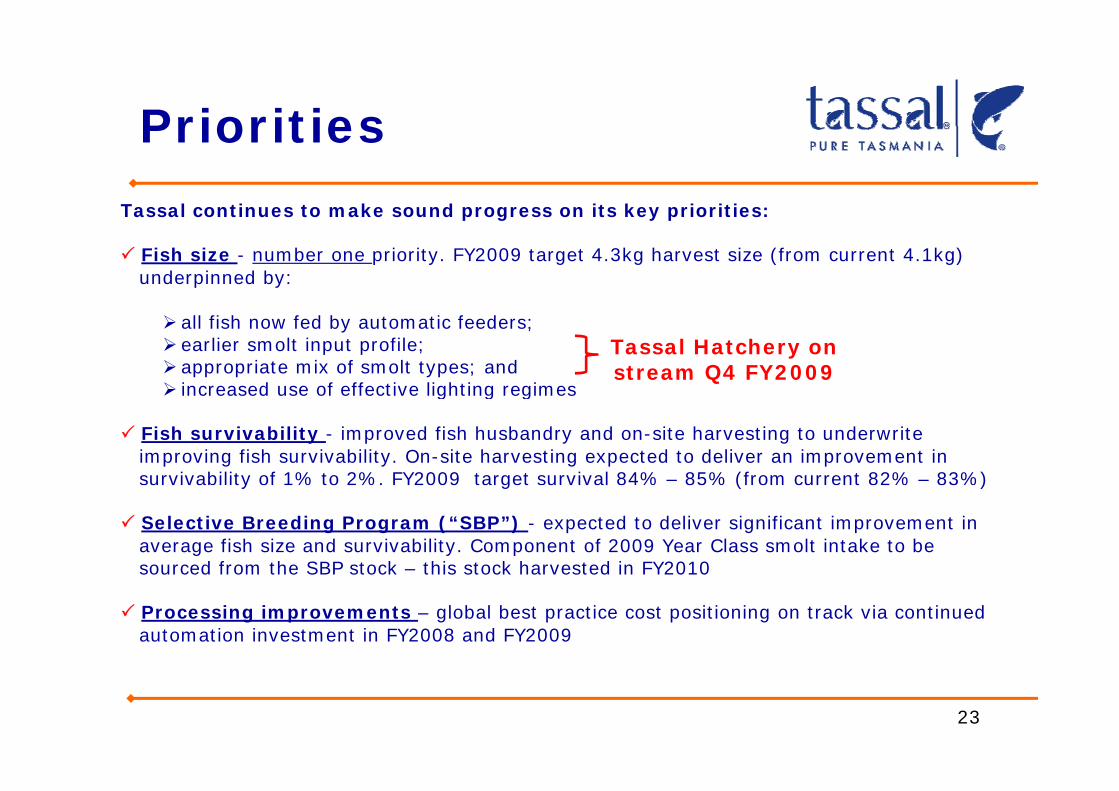
PrioritiesPriorities
Tassal continues to make sound progress on its key priorities:Tassal continues to make sound progress on its key priorities:
Fish size - number one priority. FY2009 target 4.3kg harvest size (from current 4.1kg) underpinned by:
all fish now fed by automatic feeders; earlier smolt input profile; appropriate mix of smolt types; andincreased use of effective lighting regimes
Tassal Hatchery on stream Q4 FY2009
increased use of effective lighting regimes
Fish survivability - improved fish husbandry and on-site harvesting to underwrite improving fish survivability. On-site harvesting expected to deliver an improvement in survivability of 1% to 2%. FY2009 target survival 84% – 85% (from current 82% – 83%)y g ( )
Selective Breeding Program (“SBP”) - expected to deliver significant improvement in average fish size and survivability. Component of 2009 Year Class smolt intake to be sourced from the SBP stock – this stock harvested in FY2010
Processing improvements – global best practice cost positioning on track via continued automation investment in FY2008 and FY2009
23
PrioritiesPriorities
Branding opportunities - essential that Tassal has a strong Tassal “Pure Tasmania” brand. Creating a strong brand:
strengthens product range positioning; strengthens product range positioning; provides innovation delivery conduit to consumers; builds on existing customer loyalty; andprovides imported products protection
Imported Product – must maintain vigilance and not become complacent - we have strong competition from both our local competitor (from a fresh Salmon perspective) and imports (from a smoked and frozen Salmon perspective). The Superior Gold acquisition was an important strategic acquisition in this contextp g q
Revenue Initiatives - Tassal continues to seek out new profitable markets and products both from a domestic and export sales perspective. With limited global supply and an ever increasing demand, we remain confident of strong growth in the 2009 financial year and g , g g ybeyond
24
Outlook Outlook
Tassal is well positioned to deliver continued earnings momentum in 2009 p g
Tassal will continue to implement the financial and operational strategies underpinning the Strategic Plan to FY2015
Will continue to fast track push to become globally cost competitive
Expect global supply will grow by a nominal 1% p.a. which should translate into an improved export price in 2009
Disease issues in Chile remain a significant constraint to global supply
Expect to benefit from lower AUD exchange rate
Tassal is well positioned to benefit from the investments made in 2008. Tassal is experiencing strong earnings momentum and expects to achieve an p g g g punderlying NPAT of $30 million for FY2009, in line with its previous guidance
25
Questions Questions
Have fun,
work hard,
stay healthystay healthy,
eat salmoneat salmon
26
DisclaimerDisclaimer
This presentation has been prepared by Tassal Group Limited for professional investors The information This presentation has been prepared by Tassal Group Limited for professional investors. The information contained in this presentation is for information purposes only and does not constitute an offer to issue, or arrange to issue, securities or other financial products. The information contained in this presentation is not investment or financial product advice and is not intended to be used as the basis for making an investment decision. The presentation has been prepared without taking into account the investment objectives, financial situation or particular need of any particular person.
No representation or warranty, express or implied, is made as to the fairness, accuracy, completeness or correctness of the information, opinions and conclusions contained in the presentation. To the maximum extent permitted by law, none of Tassal Group Limited, its directors, employees or agents, nor any other extent permitted by law, none of Tassal Group Limited, its directors, employees or agents, nor any other person accepts any liability, including, without limitation, any liability arising out of fault or particular, no representation or warranty, express or implied is given as to the accuracy, completeness or correctness, likelihood of achievement or reasonableness of any forecasts, prospects or returns contained in this presentation nor is any obligation assumed to update such information. Such forecasts, prospects or returns are by their nature subject to significant uncertainties and contingenciesare by their nature subject to significant uncertainties and contingencies.
Before making an investment decision, you should consider, with or without the assistance of a financial adviser, whether an investment is appropriate in light of your particular investment needs, objectives and financial circumstances. Past performance is no guarantee of future performance.
The distribution of this document is jurisdictions outside Australia may be restricted by law. Any recipient of this document outside Australia must seek advice on and observe such restrictions.