28
ANAL YST MEET FY – 2012-13 14 th MAY 2013 1
| Date post: | 02-Jun-2018 |
| Category: |
Documents |
| Upload: | rudra-goud |
| View: | 217 times |
| Download: | 0 times |
8/10/2019 Tata Coffee Analyst Presentation 13may2013
http://slidepdf.com/reader/full/tata-coffee-analyst-presentation-13may2013 1/28
ANALYST MEET
FY – 2012-13
14th MAY 2013
1

8/10/2019 Tata Coffee Analyst Presentation 13may2013
http://slidepdf.com/reader/full/tata-coffee-analyst-presentation-13may2013 2/28
AGENDA
2
FY 2012-13 Highlights
Q4 Highlights
Business Outlook
Financial Review

8/10/2019 Tata Coffee Analyst Presentation 13may2013
http://slidepdf.com/reader/full/tata-coffee-analyst-presentation-13may2013 3/28
3
FULL YEAR
HIGHLIGHTS

8/10/2019 Tata Coffee Analyst Presentation 13may2013
http://slidepdf.com/reader/full/tata-coffee-analyst-presentation-13may2013 4/28
FULL YEAR HIGHLIGHTS
4
Turnover
Profit (Before
Exceptional) PBT PAT
2011/12 509 96 104 79
2012/13 598 141 131 94
17%
47% 26%19%
0
100
200
300
400
500
600
R s .
C r o r e s

8/10/2019 Tata Coffee Analyst Presentation 13may2013
http://slidepdf.com/reader/full/tata-coffee-analyst-presentation-13may2013 5/28
FULL YEAR HIGHLIGHTS CONTD…
5
Turnover, PBT and PAT at all time high.
EPS Rs 50.16 (P.Yr Rs42.22) ; Dividend 125% P.Yr 110%)
Turnover at Rs. 598 Cr up by 17%.
PBT (Before Exceptional items) at Rs.141 Cr up by
47%.
Exceptional Expenses for 2012-13 represents Post
Retirement Benefits of Rs. 959 L ;
Exceptional Income for 2011-12 represents Sale of
Shares Rs.1,113 L and Exceptional Expensesrepresents Post Retirement Benefit of Rs. 274 L.
PBT at Rs. 131 Cr higher by 26% and
PAT at Rs. 94 Cr higher by 19%.

8/10/2019 Tata Coffee Analyst Presentation 13may2013
http://slidepdf.com/reader/full/tata-coffee-analyst-presentation-13may2013 6/28
FY 2012-13 HIGHLIGHTS – INSTANT COFFEE DIVISION
6
Main Profit contributor for the year.
Higher proportion of Non-Russia Sales – 40%.
100% Capacity Utilization at all units. Better Price Pass through and Green Coffee Management.
Significant Margin improvement on all products.
Higher Freeze Dried Coffee Sales by 13%.
Operating Efficiencies - Usage of Spent Coffee for Boiler.
8/10/2019 Tata Coffee Analyst Presentation 13may2013
http://slidepdf.com/reader/full/tata-coffee-analyst-presentation-13may2013 7/28
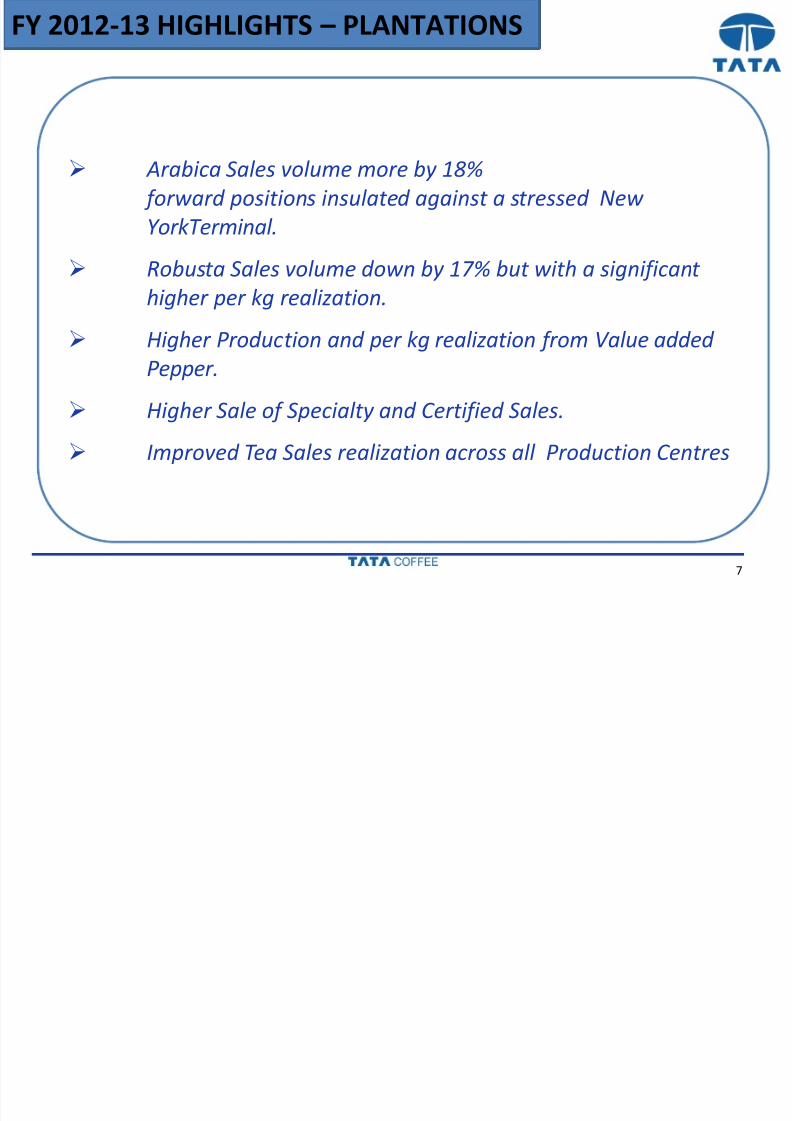
FY 2012-13 HIGHLIGHTS – PLANTATIONS
7
Arabica Sales volume more by 18%
forward positions insulated against a stressed New
YorkTerminal.
Robusta Sales volume down by 17% but with a significanthigher per kg realization.
Higher Production and per kg realization from Value added
Pepper.
Higher Sale of Specialty and Certified Sales. Improved Tea Sales realization across all Production Centres

8/10/2019 Tata Coffee Analyst Presentation 13may2013
http://slidepdf.com/reader/full/tata-coffee-analyst-presentation-13may2013 8/288
Q4 - HIGHLIGHTS

8/10/2019 Tata Coffee Analyst Presentation 13may2013
http://slidepdf.com/reader/full/tata-coffee-analyst-presentation-13may2013 9/28
Q4 HIGHLIGHTS
9
TurnoverPBT (Before
Exceptional)PAT
Q4 2011/12 (YOY) 133 33 28
Q4 2012/13 124 16 12
0
25
50
75
100
125
150
R s . C r o r e s

8/10/2019 Tata Coffee Analyst Presentation 13may2013
http://slidepdf.com/reader/full/tata-coffee-analyst-presentation-13may2013 10/28
Q4 HIGHLIGHTS CONTD…
10
Turnover, PBT and PAT dropped as compared to Q4 of last year.
Drop in Sales mainly on account of lower Sales volume of
Arabica and Pepper. Impact of Non-perennial Crop.
Reduction in PBT (Rs.6.70 Cr) on account of provision for
Disputed Tax liability - Rs. 3.45 Cr.
Additional Gratuity - Rs. 3.25 Cr.
On a like-to-like basis, the Operating Profit is in line with
Previous Year. Previous Year : Sale of Investment Rs 11.13 Cr &
Tax Write back had a bearing on the PAT
8/10/2019 Tata Coffee Analyst Presentation 13may2013
http://slidepdf.com/reader/full/tata-coffee-analyst-presentation-13may2013 11/2811
BUSINESS OUTLOOK

8/10/2019 Tata Coffee Analyst Presentation 13may2013
http://slidepdf.com/reader/full/tata-coffee-analyst-presentation-13may2013 12/28
BUSINESS OUTLOOK – INSTANT COFFEE
12
Enhancement of Extraction Capacity.
New Product Development.
Focus on New and Premium Markets.
Comfortable Order Book for Q1.
Operating Excellence in Production.
Optimization of Capacity Utilization.
Gearing facilities for 2014-15 targets

8/10/2019 Tata Coffee Analyst Presentation 13may2013
http://slidepdf.com/reader/full/tata-coffee-analyst-presentation-13may2013 13/28
BUSINESS OUTLOOK – PLANTATIONS
13
Focus on Specialty / Certified Coffee.
Modern Roaster for supply of Roasted Beans to Tata – Starbucks JV and progressively to other markets.
2012-13 Crop - “Off” Year for Arabica.
Focus on Re-planting.

8/10/2019 Tata Coffee Analyst Presentation 13may2013
http://slidepdf.com/reader/full/tata-coffee-analyst-presentation-13may2013 14/28
BUSINESS OUTLOOK – PLANTATIONS
14
Growing demand in developed countries for sustainably grown
coffees. ONLY Coffee Plantation Company with comprehensive Triple
Certification leading to differentiation.
Utz - Efficient Farm Management Practices.
Rainforest Alliance - Bio-diversity (For Environment Protection)
SA8000 - Labour standard certification High degree of focus on Quality leading to well-established reputation
in the premium markets. Large number of National & International
Awards year-on-year for quality.
Good premium paying niche market segments for Certified and
Specialty coffees.
Supplies to Starbucks amongst others.

8/10/2019 Tata Coffee Analyst Presentation 13may2013
http://slidepdf.com/reader/full/tata-coffee-analyst-presentation-13may2013 15/28
GLOBAL COFFEE SCENARIO
15
12/13 was a surplus year and this reflected as a downward trend on
the terminal prices from October’ 12 onwards. Both Brazil andVietnam have held back stocks.
Arabica prices which have been low have since started firming up.
Robusta prices also were below 2000 levels till January’ 13 but have
been steady from February above $2000 albeit a spike in March.
Coffee is a biennial crop with alternating years of high and low
production, also known as ‘ON’ and ‘OFF’ years leading to cyclic
supply trends. 13/14 is a off year , however record production is
forecasted.
As per current consumption trend and leaf rust issue in Central
America the industry expects a slight deficit in Arabica and surplus in
Robusta.

8/10/2019 Tata Coffee Analyst Presentation 13may2013
http://slidepdf.com/reader/full/tata-coffee-analyst-presentation-13may2013 16/28
ARABICA / ROBUSTA TERMINAL
16
120
140
160
180
200
220
240
260
3-Oct-11 2-Dec-11 31-Jan-12 31-Mar-12 30-May-12 29-Jul-12 27-Sep-12 26-Nov-12 25-Jan-13 26-Mar-13
U S c / l b
NY - Arabica 18 months
1500
1600
1700
1800
1900
2000
2100
2200
2300
3-Oct-11 2-Dec-11 31-Jan-12 31-Mar-12 30-May-12 29-Jul-12 27-Sep-12 26-Nov-12 25-Jan-13 26-Mar-13
U S $ / M T
London - Robusta 18 months

8/10/2019 Tata Coffee Analyst Presentation 13may2013
http://slidepdf.com/reader/full/tata-coffee-analyst-presentation-13may2013 17/28
17
TCL STANDALONE
FINANCIALS

8/10/2019 Tata Coffee Analyst Presentation 13may2013
http://slidepdf.com/reader/full/tata-coffee-analyst-presentation-13may2013 18/28
18
PARTICULARS FULL YEAR Variance
2012-13 2011-12 Rs. Lakhs %
Total Operating Income 59,808 50,852 8,956 18%
Profit before Other Income , Interest,
Exceptional Items and Tax 12308 9,504 2,804 29%
Other Income 2,221 805 1,415 176%
Profit before Interest & Tax 14529 10,309 4,220 41%Interest (455) (732) 277
Exceptional Income/ (Expense) (959) 839 (1,798)
PBT 13,115 10,416 2,699 26%
Tax (3,746) (2,531) (1,215)
PAT 9,369 7,885 1,484 19%
PERFORMANCE HIGHLIGHTS –
FULL YEAR 2012-13IN LAKHS
Operating Income up by 18%
Operating Profit up by 29%.
Profit Before Interest up by 41%, PBT up by 26% and PAT by 19%.

8/10/2019 Tata Coffee Analyst Presentation 13may2013
http://slidepdf.com/reader/full/tata-coffee-analyst-presentation-13may2013 19/28
PROFITABILITY ANALYSIS – 2012-13
19
Increase in Total Income by 18% mainly driven by Instant Coffee
and Arabica Volume and Higher Price on all products.
Higher Operating Profit of 29% mainly due to Instant Coffee,
Coffee, Tea and Pepper Prices.
Increase in Other Income through $ 2mn EOC Dividend and
Higher Interest Income.
Lower Interest cost on account of cash management benefits.
Higher incidence of Tax
PERFORMANCE HIGHLIGHTS
8/10/2019 Tata Coffee Analyst Presentation 13may2013
http://slidepdf.com/reader/full/tata-coffee-analyst-presentation-13may2013 20/28
20
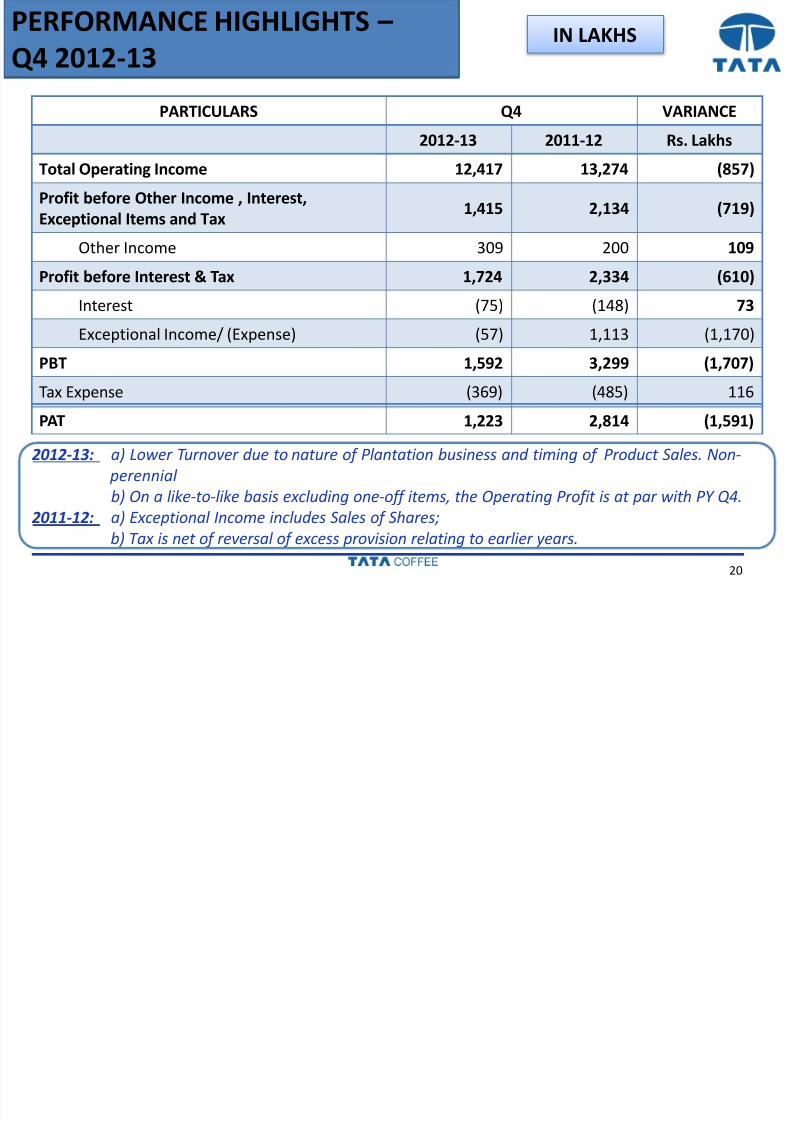
PARTICULARS Q4 VARIANCE
2012-13 2011-12 Rs. Lakhs
Total Operating Income 12,417 13,274 (857)
Profit before Other Income , Interest,
Exceptional Items and Tax 1,415 2,134 (719)
Other Income 309 200 109
Profit before Interest & Tax 1,724 2,334 (610)Interest (75) (148) 73
Exceptional Income/ (Expense) (57) 1,113 (1,170)
PBT 1,592 3,299 (1,707)
Tax Expense (369) (485) 116
PAT 1,223 2,814 (1,591)
PERFORMANCE HIGHLIGHTS –
Q4 2012-13IN LAKHS
2012-13: a) Lower Turnover due to nature of Plantation business and timing of Product Sales. Non-
perennial
b) On a like-to-like basis excluding one-off items, the Operating Profit is at par with PY Q4.
2011-12: a) Exceptional Income includes Sales of Shares;
b) Tax is net of reversal of excess provision relating to earlier years.

8/10/2019 Tata Coffee Analyst Presentation 13may2013
http://slidepdf.com/reader/full/tata-coffee-analyst-presentation-13may2013 21/28
21
TCL – BALANCE SHEET
IN LAKHS
31 Mar 2013 31 Mar 2012
Sources of Funds
Shareholders’ Funds 52,446 45,726
Loans & Provisions
6,970 4,088
Deferred Tax (Net)
722 1,056
Total 60,138 50,869
Application of Funds
Net Fixed Assets 29,597 23,142
Investments 14,563 14,564
Long Term Loans and Advances
2,009 4,200
Net Working Capital 13,969 8,963
Total 60,138 50,869

8/10/2019 Tata Coffee Analyst Presentation 13may2013
http://slidepdf.com/reader/full/tata-coffee-analyst-presentation-13may2013 22/28
BALANCE SHEET ANALYSIS
22
Shareholders’ Fund - Substantial increase Rs. 84.28 Crores.
Long Term Borrowing – $ 10 Mn ECB Loan for Freeze Dried
Extract Project.
Net Fixed Asset – Increase mainly due to New Freeze Dried Unit.
Long Term Loans and Advances – Reduced as Capital Advances
moved to Fixed Assets.
Net Working Capital – Increase in Raw Material Inventory in
Instant Coffee Division for the New Project and Finished Goodsinventory increase in Plantations.

8/10/2019 Tata Coffee Analyst Presentation 13may2013
http://slidepdf.com/reader/full/tata-coffee-analyst-presentation-13may2013 23/28
RATIOS
23
March 2013 March 2012
ROCE % 24% 20%
Debt Equity Ratio 0.21 0.16
E.P.S. (Rs.) 50.16 42.22
PE Multiple (10.05.2013) (Rs.) 32.67 19.82
Market Capitalization (as of date )
(Rs. Cr.) 2930 1,563
EOC BALANCE SHEET

8/10/2019 Tata Coffee Analyst Presentation 13may2013
http://slidepdf.com/reader/full/tata-coffee-analyst-presentation-13may2013 24/28
24
EOC – BALANCE SHEET
In $ mn
31 Mar 2013 31 Mar 2012
Sources of Funds
Shareholders’ Funds 87.78 76.69
Loans 148.37 130.97
Deferred Tax Liability 17.07 17.77
Total 253.22 225.43
Application of Funds
Net Fixed Assets 216.95 220.42
Investments 20.80 -
Net Working Capital 15.47 5.01
Total 253.22 225.43
TCL GROUP FULL YEAR HIGHLIGHTS

8/10/2019 Tata Coffee Analyst Presentation 13may2013
http://slidepdf.com/reader/full/tata-coffee-analyst-presentation-13may2013 25/28
TCL GROUP - FULL YEAR HIGHLIGHTS
25
2011-12 2012-13Turnover 1549 1697
PAT 81 116
1549
1697
81
116
60
80
100
120
140
500
800
1100
1400
1700
2000
Group Sales up by 10%
Group Profit up by 44%
IN CRORES
TCL GROUP RESULTS

8/10/2019 Tata Coffee Analyst Presentation 13may2013
http://slidepdf.com/reader/full/tata-coffee-analyst-presentation-13may2013 26/28
26
TCL GROUP RESULTSIN LAKHS
March 2013 March 2012 Variance
TCL PAT **
(Net of Inter Company Dividend)8,273 7,884 389
EOC PAT 6,689 470 6,219
MINORITY INTEREST (3,339) (235) 3,104
GROUP PAT 11,622 8,119 3,503
** TCL ‘s Profit after Tax :-
2012-13 includes Exceptional Expenses on account of Post Retirement Benefits ofRs. 959 L ;
2011-12 includes Exceptional Income on account of Sales of Shares of Rs. 839 L;
Net impact on 2012-13 (-) Rs 1798 L
TCL GROUP RESULTS

8/10/2019 Tata Coffee Analyst Presentation 13may2013
http://slidepdf.com/reader/full/tata-coffee-analyst-presentation-13may2013 27/28
27
TCL GROUP RESULTS
IN LAKHS
Q42012/13
Q42011/12
March2013
March2012
Variance %
38,783 38,201 Total Income 169,735 154,900 14,835 10%
(32,390) (34,277) Operating Expenditure (142,160) (139,421) (2739)
(1,361) (1,322) Interest (5,291) (4,622) (669)
170 (268) Investment, Exceptional
Income / (Expense)(123) (864) 741
5,272 2,334 PBT 22,232 9,993 12,239 122%
4,666 2,953 PAT 15,881 8,354 7,527 90%
(2144) (70) Minority Interest (4,189) (235) (3,954)
2,522 2,883 Group Consolidated Net
Profit 11,623 8,119 3,504 43%
13.50 15.44 EPS (Rs.) 62.23 43.47 18.76 43%

8/10/2019 Tata Coffee Analyst Presentation 13may2013
http://slidepdf.com/reader/full/tata-coffee-analyst-presentation-13may2013 28/28
28
THANK YOU


