15
COMPANY ANALYSIS (FY 2014-2015) ANKITA KUMARI HASHREET DHILLON KISHAN KUMAR ANURAG GADI NISHA AGRAWAL KIRAN DAS Financial Accounting - I
| Date post: | 14-Jan-2017 |
| Category: |
Education |
| Upload: | n-v-jagadeesh-kumar |
| View: | 242 times |
| Download: | 3 times |

COMPANY ANALYSIS
(FY 2014-2015)
ANKITA KUMARIHASHREET DHILLONKISHAN KUMAR
ANURAG GADI NISHA AGRAWALKIRAN DAS
Financial Accounting - I

2 2
Basis of choosing
ROE using DU-PONT Tata motors- 55.7 Eicher motors – 30.7 Tata steel – 18.87 HDFC- 2.98 Bharti Infratel – 15.17 ACC - 9.35

3 3
ABOUT THE COMPANY
Type: Public. Industry: Automotive. Founded: 1945, J. R. D. Tata. Headquarters: Mumbai, Maharashtra, India. Chairman: Cyrus Pallonji Mistry.

4 4
PRODUCTS
• Small Commercial Vehicles(SCVs) – 1 ton
• Pickups – 2 ton• Light Commercial Vehicles(LCVs)
– 2.25-7 ton• Utility Vehicles• Premium and Luxury SUVs• Medium & Heavy Commercial
Vehicle (M&HCV) – 15-42 ton• Vans• Buses and Coaches
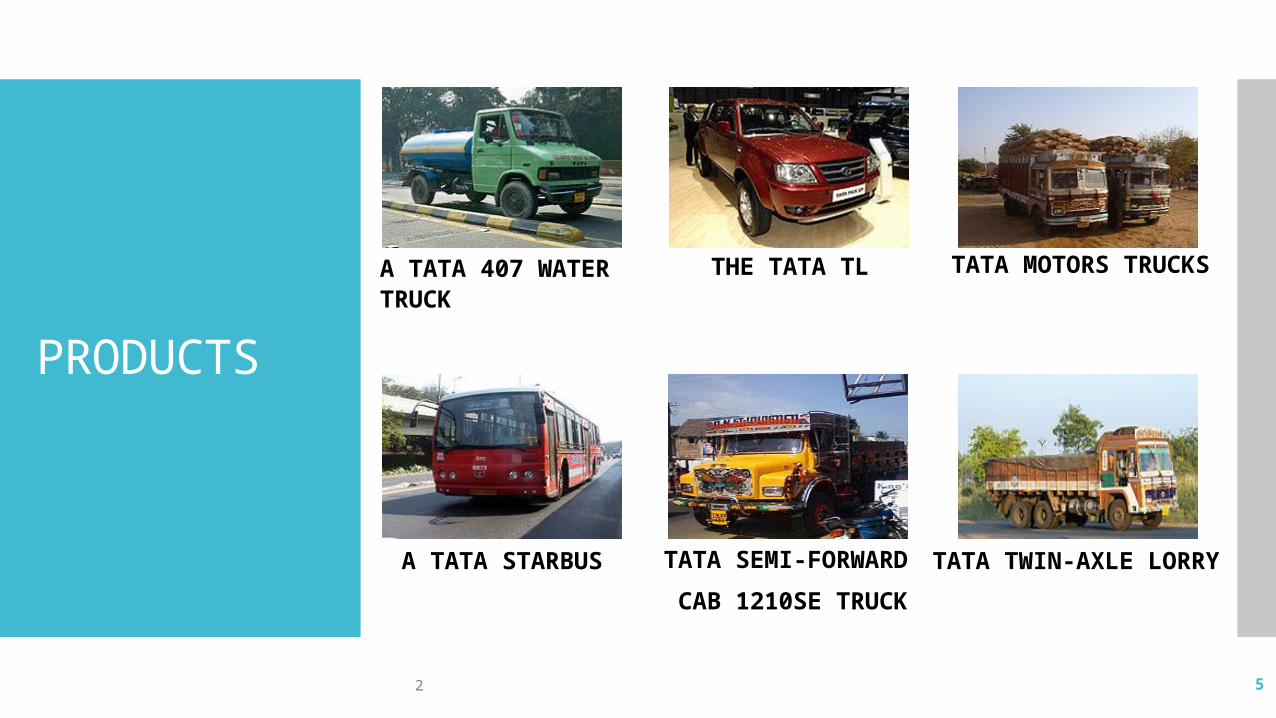
2 5
THE TATA TLA TATA 407 WATER TRUCK TATA MOTORS TRUCKS
A TATA STARBUS TATA SEMI-FORWARD
CAB 1210SE TRUCK
TATA TWIN-AXLE LORRY
PRODUCTS

2 6
INDUSTRY ANALYSIS
Although the economic growth vulnerability and lower sentiment resulted in market slowdown in 2012 and 2013, India is expected to regain strong growth trend 2014 onward.
Strong growth in demand due to rising income, rise of the middle class, and an expanding young population is likely to make India the third largest automotive market in the world by 2016, ahead of Japan, Germany, and Brazil.
Apart from supportive government policies, India has significant cost advantages in terms of manufacturing, along with availability of a large pool of skilled manpower and a growing technology base, to attract greater investments.
2 7
Position of the company in its industry
Tata Motors Limited is India's largest automobile company, with consolidated revenues of INR 2, 62,796 crores (USD 42.04 billion) in 2014-15. It is the leader in commercial vehicles in each segment, and among the top in passenger vehicles with winning products in the compact, midsize car and utility vehicle segments.

2 8
GROWTH PROSPECTS
With its global growth strategy in place and strong cash flows, future prospects hinge purely on sales volumes, which will drive revenue and profit margins
The September-quarter performance of Tata Motors Ltd may have initially unsettled investors as the consolidated revenue and net profit fell widely short of expectations.
According to a report by Religare Capital Markets, the answer to higher profitability lies in JLR’s product and geographical mix. JLR’s September-quarter net sales rose by a marginal 4%.
Still, what is keeping the street upbeat on growth prospects is higher sales volume expected from fiscal 2016 both at JLR and the domestic entity. JLR will clock higher sales as new products are launched and the China facility starts spewing volumes. Higher volumes will, therefore, sustain profit margins, though some quarters may see moderation on account of marketing spends.
JLR’s meteoric performance has translated into strong returns for the investor. From last April till date, the stock has returned nearly 25%, although it has lagged the BSE Auto index.

2 9
RATIO ANALYSIS
1. EPS = (Earnings Available for Common Stockholder’s / Number of Shares of Common Stock Outstanding)
= (1398629 / 32196.80)
= 43.44
2. P/E =(Market Price per Share of Common Stock / Earnings per Share)
= (544.12 / 43.44)
= 12.52
3. NP= (Net Profit after Taxes / Sales) * 100
= ((13986.29/266345.25)*100)
= 5.25

2 10
RATIO ANALYSIS
4. Debt equity ratio = (Long-Term Debt / Stockholders’ Equity)
= (14709.95/14862.59)
= 0.9897
5. DuPont = Net Profit Ratio * Assets Turnover Ratio * [ 1+ Debt Equity Ratio]
= (Net Profit after Tax/ Sales) * 100 *Sales / Assets* [1+Long-Term Debt / Stockholders’ Equity]
= (28.004)*(1.9897)
= 55.7195588
2 11
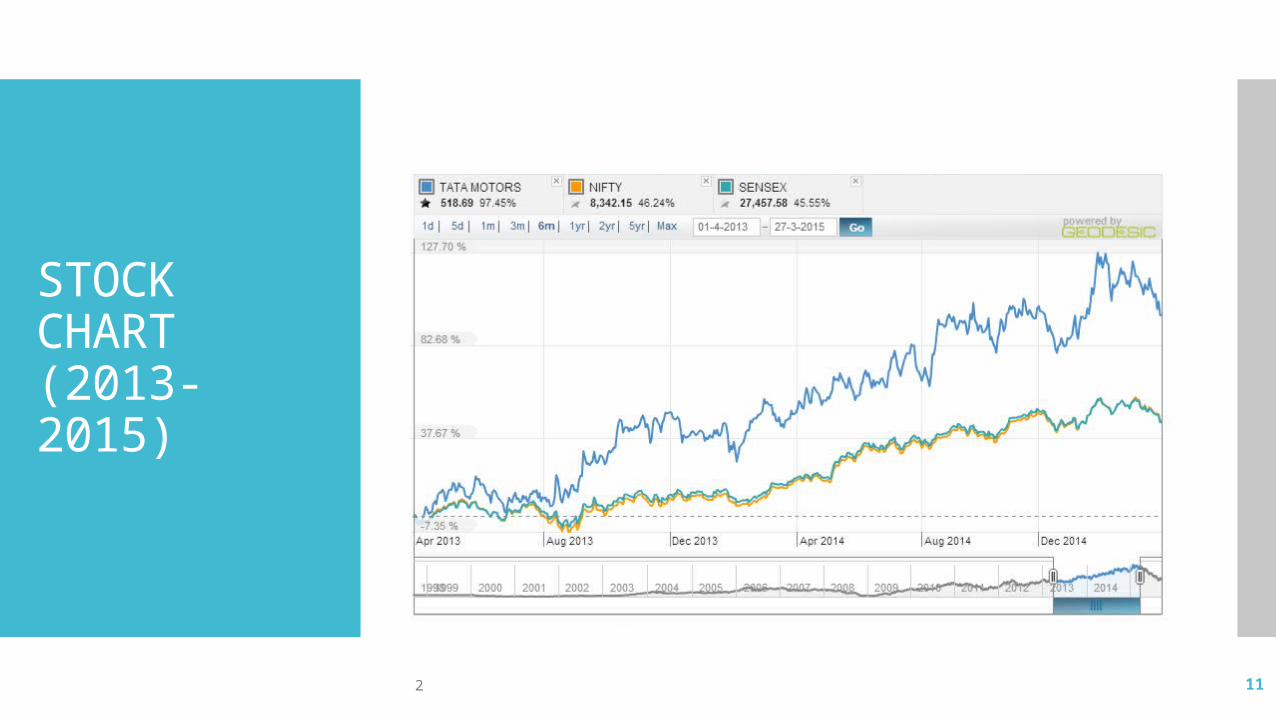
STOCK CHART(2013-2015)

2 12
Stock chart analysis
Tata Motors gained 0.18% to Rs 586 at 12:35 IST on BSE after total sales rose 5% to 42,582 vehicles in January 2015 over January 2014.
Meanwhile, the S&P BSE Sensex was down 206.02 points or 0.71% at 28,976.93.
On BSE, so far 1.19 lakh shares were traded in the counter as against average daily volume of 4.39 lakh shares in the past one quarter.
The stock hit a high of Rs 589.50 and a low of Rs 581.65 so far during the day. The stock had hit a record high of Rs 608.40 on 27 January 2015. The stock had hit a 52-week low of Rs 331.05 on 4 February 2014.
The company's domestic sales of commercial vehicles remained flat. Light commercial vehicles (LCV) sales fell 18% 14,301 units, while medium and heavy commercial vehicles (M&HCV) sales continued to show growth with sales growth of 38% at 11,273 units in January 2015 over January 2014.
Tata Motors' consolidated net profit fell 7.1% to Rs 3290.86 crore on 6.5% rise in total income to Rs 60809.13 crore in Q2 September 2014 over Q2 September 2013.

2 13
Stock chart analysis
The stock had outperformed the market over the past one month till 30 January 2015, gaining 18.43% compared with Sensex's 6.49% rise. The scrip had also outperformed the market in past one quarter, rising 11.12% as against Sensex's 6.72% rise.
The large-cap automobile manufacturer has equity capital of Rs 547.34 crore. Face value per share is Rs 2.
Tata Motors' domestic sales of Tata commercial and passenger vehicles rose 5% to 36,657 vehicles in January 2015 over January 2014. While market continues to remain challenged by macroeconomic trends, besides positive growth in segments such as M&HCV and passenger cars, exports have grown by 4% in January 2015 over January 2014. Exports rose 4% to 3,961 units in January 2015 over January 2014.
Tata Motors' passenger vehicles recorded sales growth of 19% to 13,047 units in January 2015 over January 2014. The trend of growth in passenger vehicles continued - with the strong Zest sales and the good response to the all-new Bolt. While the sales of the passenger cars rose 38% at 11,637 units, the utility vehicles (UV) sales declined by 44% at 1,410 units in January 2015 over January 2014.
2 14
SOURCES Tata Motors official website. (www.tatamotors.com) Tata Motors – Money control. (
http://www.moneycontrol.com/india/stockpricequote/auto-lcvs-hcvs/tatamotors/TM03)
Tata Motors - Wikipedia, the free encyclopedia. (https://en.wikipedia.org/wiki/Tata_Motors)

2 15
THANK YOU!


