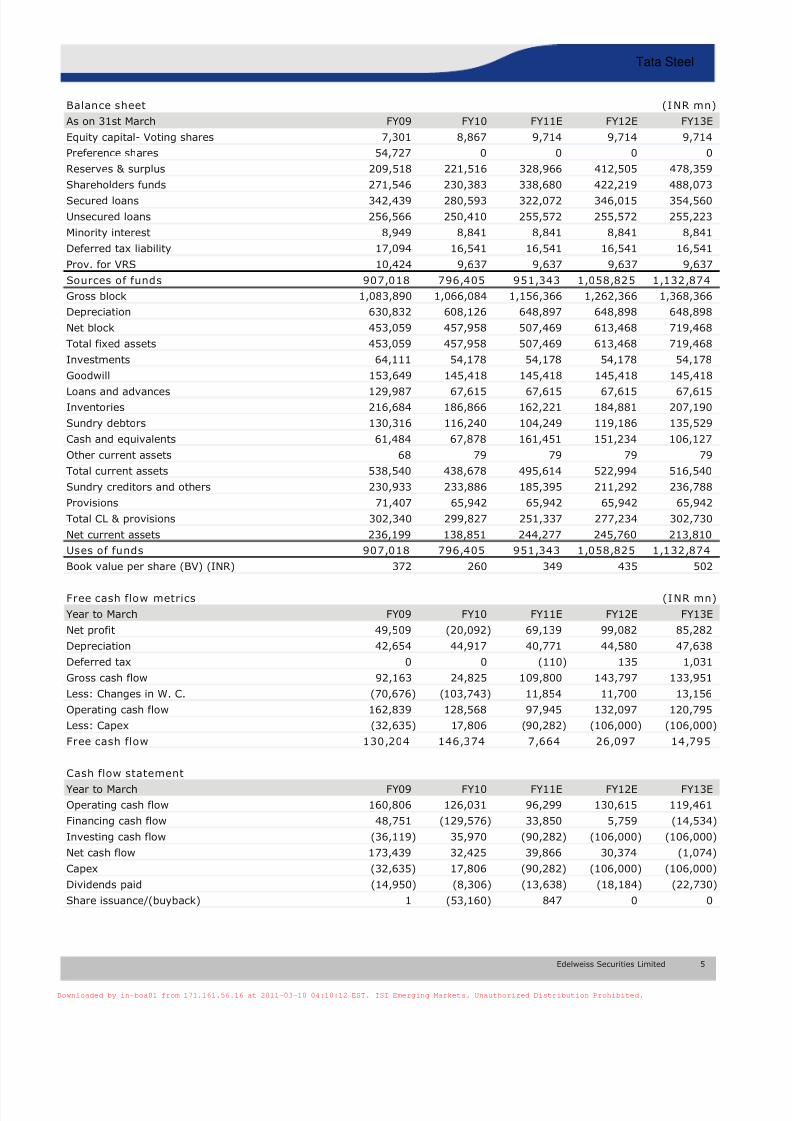
Edelweiss Research is also available on www.edelresearch.com, Bloomberg EDEL <GO>, Thomson First Call, Reuters and Factset. Edelweiss Securities Limited •Tata Steel signs agreement to develop Taconite iron ore project Tata Steel has signed an agreement with New Millennium Capital Corp. (NML) to develop the LabMag and KeMag iron ore deposits (together known as The Taconite project) in Canada with reserves of 5.6 bt (at ~30% Fe) and total reserve and resources of 9.1 bt. As per the agreement, Tata Steel will help conduct a feasibility study for the project and also contribute 64% of the cost, estimated to be CAD 50 mn. Post successful completion of the feasibility study (expected in 21 months), Tata Steel will have a maximum period of four months to make an investment decision in the project. If affirmative, Tata Steel and NML will form a JV for the development of these deposits, either one or both. The concentrate/pellets from this project will be supplied to Tata Steel Europe at market price. Outlook and valuations: Positive, no immediate impact; maintain ‘BUY’ The Taconite project is an extension to the under-development DSO project in Canada that is expected to start operations by Q3CY12 (delayed by a quarter compared with last disclosure by Tata Steel). The DSO project, with reserves of64 mt, will potentially contribute 4 mtpa of iron ore from CY13. In the past, Tata Steel has indicated long-term target of 50% iron ore integration for Tata Steel Europe, which will imply a requirement of ~10 mtpa from Taconite project against its capacity of 22 mtpa. This will imply that Tata Steel will require minimum of 45% stake in the project. Overall, we are positive on Tata Steel’s strategy to secure iron ore (Canada) and coking coal (Mozambique) supplies for Tata Steel Europe. However, the benefits would flow in only H2FY13 onwards and, hence, will not have significant earnings impact even for FY13. However, increasing value of the project portfolio of NML could provide valuation upside for Tata Steel that holds ~27% in NML. We maintain ‘BUY/ Sector Outperformer’ recommendation/rating on the stock with a fair value of INR 778/share. India Equity Research | Metals and Mining Company Update TATA STEELSigns agreement for Taconite iron ore project March 9, 2011 Reuters: TISC.BO Bloomberg: TATA IN EDELWEISS 4D RATINGS Absolute RatingBUY Rating Relative to SectorOutperformer Risk Rating Relative to SectorMediumSector Relative to MarketOverweight Note: Please refer last page of the report for rating explanation MARKET DATA CMP : INR 613 52-week range (INR) : 739 / 449 Share in issue (mn) : 959.2 M cap (INR bn/USD mn) : 588 /13,061 Avg. Daily Vol. BSE/NSE (‘000) : 8,081.9 SHARE HOLDING PATTERN (%) Promoters*: 30.6 MFs, FIs & Banks : 25.7 FIIs : 16.9 Others : 26.8 * Promoters pledged shares (% of share in issue) : NIL PRICE PERFORMANCE (%) Stock Nifty EW Metals and Mining Index 1 month (0.6) 3.9 1.2 3 months (1.3) (6.5) (2.0) 12 months 0.6 7.7 (11.1) Prasad Baji +91 22 4040 7415 [email protected]Faisal Memon +91 22 6623 3478 [email protected]Financials (Consolidated) Year to March FY09 FY10 FY11E FY12E Revenues (INR mn) 1,473,293 1,017,578 1,087,167 1,242,938 Rev. growth (%) 12.0 (30.9) 6.8 14.3 EBITDA (INR mn) 181,277 74,073 148,753 165,951 Net profit (INR mn) 89,438 (4,371) 69,659 75,341 Shares outstanding (mn) 730.1 887.4 971.4 971.4 Diluted EPS (INR) 108.7 (4.2) 72.6 78.3 EPS growth (%) 12.6 (103.9) NA 7.9 P/E (x) 5.0 (146.5) 8.4 7.8 EV/EBITDA (x) 5.4 13.0 6.5 6.0 ROAE (%) 34.7 (2.8) 24.2 19.6 ISIEmergingMarketsPDF in-boa01 from 171.161.56.16 on 2011-03-10 04:10:12 EST. DownloadPDF. Downloaded by in-boa01 from 171.161.56.16 at 2011-03-10 04:10:12 EST. ISI Emerging Markets. Unauthorized Distribution Prohibited.
Edelweiss Research is also available on www.edelresearch.com , Bloomberg EDEL <GO>, Thomson First Call, Reuters and Factset. Edelweiss Securities Limited
•
Tata Steel signs agreement to develop Taconite iron ore projectTata Steel has signed an agreement with New Millennium Capital Corp. (NML) to
develop the LabMag and KeMag iron ore deposits (together known as TheTaconite project) in Canada with reserves of 5.6 bt (at ~30% Fe) and totalreserve and resources of 9.1 bt. As per the agreement, Tata Steel will helpconduct a feasibility study for the project and also contribute 64% of the cost,estimated to be CAD 50 mn. Post successful completion of the feasibility study(expected in 21 months), Tata Steel will have a maximum period of four monthsto make an investment decision in the project. If affirmative, Tata Steel and NMLwill form a JV for the development of these deposits, either one or both. Theconcentrate/pellets from this project will be supplied to Tata Steel Europe atmarket price.
Outlook and valuations: Positive, no immediate impact; maintain ‘BUY’
The Taconite project is an extension to the under-development DSO project inCanada that is expected to start operations by Q3CY12 (delayed by a quartercompared with last disclosure by Tata Steel). The DSO project, with reserves of 64 mt, will potentially contribute 4 mtpa of iron ore from CY13. In the past, TataSteel has indicated long-term target of 50% iron ore integration for Tata SteelEurope, which will imply a requirement of ~10 mtpa from Taconite projectagainst its capacity of 22 mtpa. This will imply that Tata Steel will requireminimum of 45% stake in the project.
Overall, we are positive on Tata Steel’s strategy to secure iron ore (Canada) andcoking coal (Mozambique) supplies for Tata Steel Europe. However, the benefitswould flow in only H2FY13 onwards and, hence, will not have significant earningsimpact even for FY13. However, increasing value of the project portfolio of NML
could provide valuation upside for Tata Steel that holds ~27% in NML. Wemaintain ‘BUY/ Sector Outperformer’ recommendation/rating on the stockwith a fair value of INR 778/share.
India Equity Research | Metals and Mining Company Update
TATA STEEL
Signs agreement for Taconite iron ore project
March 9, 2011
Reuters: TISC.BO Bloomberg: TATA IN
EDELWEISS 4D RATINGS
Absolute Rating BU Y
Rating Relative to Sector Outperformer
Risk Rating Relative to Sector Medium
Sector Relative to Market Overweight
Note:Please refer last page of the report for rating explanation
MARKET DATA
CMP : INR 613
52-week range (INR) : 739 / 449Share in issue (mn) : 959.2
M cap (INR bn/USD mn) : 588 /13,061
Avg. Daily Vol. BSE/NSE (‘000) : 8,081.9
SHARE HOLDING PATTERN (%)
Promoters* : 30.6
MFs, FIs & Banks : 25.7
FIIs : 16.9
Others : 26.8
* Promoters pledged shares(% of share in issue) : NIL
One of the largest magnetite resources with low cash cost of USD 20/t FOBAt 9 bt, the Taconite project is one of the largest undeveloped magnetite resourceprojects in the world. It has over three times the iron ore resources for the rest of Canada. NML’s disclosures indicate low cash cost of USD 20/t and reserves of 1.6 bt(possibly this is at the standard Fe grade of 63-65%). The targeted production is 22mtpa of concentrate with potential mine life of over 100 years. NML estimates pre-taxcash flow from the Taconite project in excess of USD 1.1 bn p.a. at an assumed pelletprice of USD 90/t (current price USD 175-190/t). The ore would be transported by a 700km slurry pipeline from the mine to the port which would have a 15 mtpa pellet plant(balance 7 mtpa to be sold as concentrate). The use of slurry pipeline reduces logisticscost substantially.
Deal structure in favour of Tata SteelTata Steel will hold 80% in the JV, and NML 20% on a “free” basis. Tata Steel will alsoarrange the equity (excluding NML’s ownership) and debt funding, which would entail atotal capital expenditure of CAD 4.9 bn, if the entire project (both deposits) is developed.On opting to develop any one of the deposits, the KeMag and LabMag mines wouldindividually entail capex of CAD 4.7 bn and CAD 3.8 bn, respectively. If Tata Steeldecides to invest in the project, NML will have the right to purchase an additional 16%equity at the same valuation as the equity funding. In case Tata Steel decides to invitethird-party investors, NML will have the right of first refusal to acquire an additional 4%stake in the project, taking its total stake to 40%. The involved parties will have offtakerights in proportion to their equity interest.
Drawbacks: High capex cost and debt levelsThe per unit capex cost is unusually high at ~USD 220/t, which is partly due to lowgrade of ore (~30% Fe) and the substantial investment in infrastructure (270 kmtransmission line, 700 km slurry pipeline and port facilities). Assuming D:E ratio of 70:30(as for the DSO project), this will imply debt and equity of USD 3.4 bn and USD 1.5 bn,respectively (combined project). Considering the large amount of capital involved, it ispossible that Tata Steel, at the time of investment, may invite third parties for
participation.
ISIEmergingMarketsPDF in-boa01 from 171.161.56.16 on 2011-03-10 04:10:12 EST. DownloadPDF.
Downloaded by in-boa01 from 171.161.56.16 at 2011-03-10 04:10:12 EST. ISI Emerging Markets. Unauthorized Distribution Prohibited.
Company DescriptionEstablished 100 years ago in 1907, Tata Steel is Asia’s first and India’s second largestprivate sector steel company. With the take over of Corus Steel (Europe’s second largeststeel producer), Tata Steel is now the sixth largest steel company in the world with over31mtpa of steel capacity. Tata Steel’s Indian operations are amongst the lowestproducers of steel in the world comprising 6.8 mtpa steel making facility at Jamshedpurin Jharkhand.
Investment ThemeWe believe the worst is behind us for the global steel sector. Steel prices have startedincreasing starting with China & India followed by hikes in USA and Europe. While lowcapacity utilization will prevent outsized price rallies, we believe prices will move abovemarginal cost. Demand is picking up slowly and we expect reasonable recovery inEuropean steel starting from Q2FY10 and going into FY11E. Tata Steel has already takensteps for cost reduction and hits on the P&L for such restructuring. Led by all this, weexpect strong earnings growth in FY11E.
Key Risks• Any delay in demand revival and/or renewed slump in European steel.
• Higher than anticipated Chinese/CIS steel exports into Europe.
ISIEmergingMarketsPDF in-boa01 from 171.161.56.16 on 2011-03-10 04:10:12 EST. DownloadPDF.
Downloaded by in-boa01 from 171.161.56.16 at 2011-03-10 04:10:12 EST. ISI Emerging Markets. Unauthorized Distribution Prohibited.
Cover age g rou p( s ) o f s t ocks b y p r im ary ana ly s t ( s ) : M e t a l s a n d M i n i n g Bhushan Steel, Coal India, Hindalco Industries, Hindustan Zinc, Jindal Steel & Power, JSW Steel, National Aluminium Company, PrakashIndustries, Steel Authority of India, Sesa Goa, Sterlite Industries (India), Tata Steel, Usha Martin
Distribution of Ratings / Market Cap
Edelweiss Research Coverage Universe
Rating Distribution* 116 45 12 176* 3 stocks under review
Market Cap (INR) 110 53 13> 50bn Between 10bn and 50 bn < 10bn
Date Company Title Price (INR) Recos
Buy Hold Reduce Total
This document has been prepared by Edelweiss Securities Limited (Edelweiss). Edelweiss, its holding company and associate companies are a full service, integratedinvestment banking, portfolio management and brokerage group. Our research analysts and sales persons provide important input into our investment bankingactivities. This document does not constitute an offer or solicitation for the purchase or sale of any financial instrument or as an official confirmation of anytransaction. The information contained herein is from publicly available data or other sources believed to be reliable, but we do not represent that it is accurate orcomplete and it should not be relied on as such. Edelweiss or any of its affiliates/ group companies shall not be in any way responsible for any loss or damage thatmay arise to any person from any inadvertent error in the information contained in this report. This document is provided for assistance only and is not intended tobe and must not alone be taken as the basis for an investment decision. The user assumes the entire risk of any use made of this information. Each recipient of thisdocument should make such investigation as it deems necessary to arrive at an independent evaluation of an investment in the securities of companies referred to inthis document (including the merits and risks involved), and should consult his own advisors to determine the merits and risks of such investment. The investmentdiscussed or views expressed may not be suitable for all investors. We and our affiliates, group companies, officers, directors, and employees may: (a) from time totime, have long or short positions in, and buy or sell the securities thereof, of company (ies) mentioned herein or (b) be engaged in any other transaction involvingsuch securities and earn brokerage or other compensation or act as advisor or lender/borrower to such company (ies) or have other potential conflict of interest with
respect to any recommendation and related information and opinions. This information is strictly confidential and is being furnished to you solely for yourinformation. This information should not be reproduced or redistributed or passed on directly or indirectly in any form to any other person or published, copied, inwhole or in part, for any purpose. This report is not directed or intended for distribution to, or use by, any person or entity who is a citizen or resident of or located inany locality, state, country or other jurisdiction, where such distribution, publication, availability or use would be contrary to law, regulation or which would subjectEdelweiss and affiliates/ group companies to any registration or licensing requirements within such jurisdiction. The distribution of this document in certainjurisdictions may be restricted by law, and persons in whose possession this document comes, should inform themselves about and observe, any such restrictions.The information given in this document is as of the date of this report and there can be no assurance that future results or events will be consistent with thisinformation. This information is subject to change without any prior notice. Edelweiss reserves the right to make modifications and alterations to this statement asmay be required from time to time. However, Edelweiss is under no obligation to update or keep the information current. Nevertheless, Edelweiss is committed toproviding independent and transparent recommendation to its client and would be happy to provide any information in response to specific client queries. NeitherEdelweiss nor any of its affiliates, group companies, directors, employees, agents or representatives shall be liable for any damages whether direct, indirect, specialor consequential including lost revenue or lost profits that may arise from or in connection with the use of the information. Past performance is not necessarily aguide to future performance. The disclosure s of interest statements incorporated in this document are provided solely to enhance the transparency and should not betreated as endorsement of the views expressed in the report. Edelweiss Securities Limited generally prohibits its analysts, persons reporting to analysts and theirfamily members from maintaining a financial interest in the securities or derivatives of any companies that the analysts cover. The analyst for this report certifiesthat all of the views expressed in this report accurately reflect his or her personal views about the subject company or companies and its or their securities, and nopart of his or her compensation was, is or will be, directly or indirectly related to specific recommendations or views expressed in this report. Analyst holding in thestock: no.
Copyright 2009 Edelweiss Research (Edelweiss Securities Ltd). All rights reserved
Access the entire repository of Edelweiss Research on w ww .edelresearch.com
Recent Research
03-Mar-11 SterliteIndustries
Revision in estimates ;Company update
168 Buy
03-Mar-11 Coal India Positive surprise onrealisations;
Company update
339 Hold
28-Feb-11 Sesa Goa Hit by increased exportduty; Company update
261 Reduce
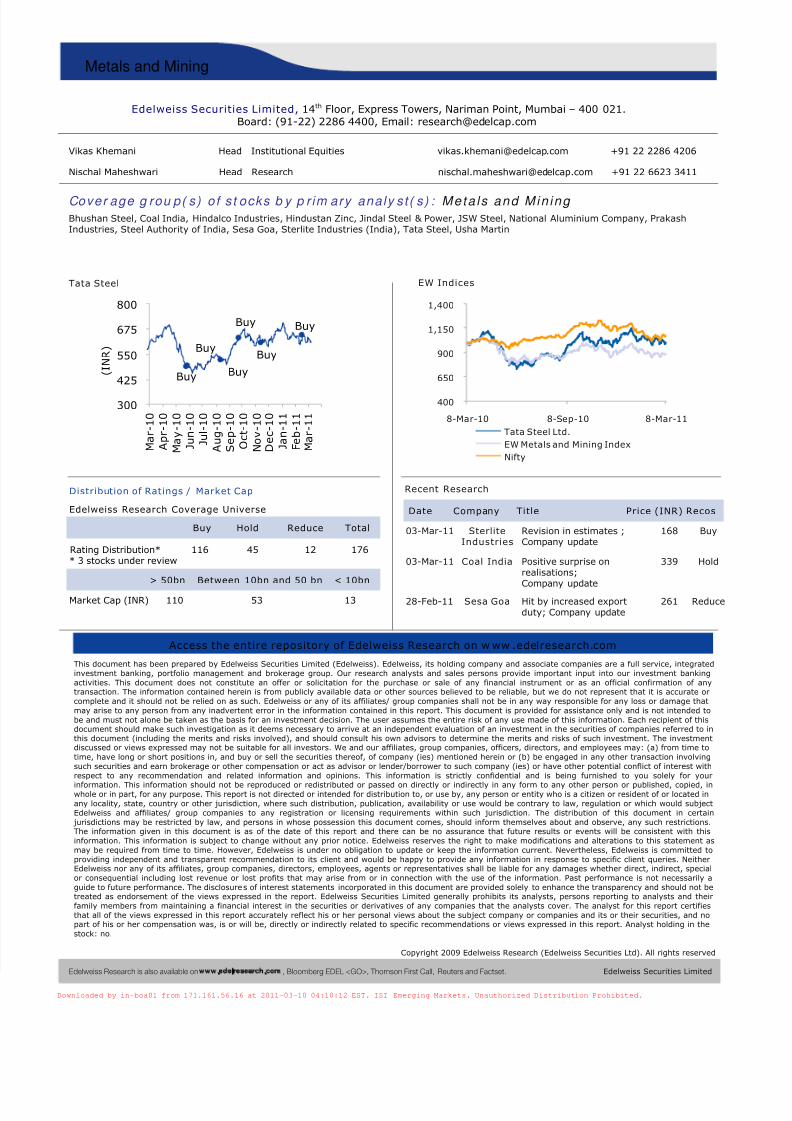
Tata Steel
EW Indices
400
650
900
1,150
1,400
8-Mar-10 8-Sep-10 8-Mar-11Tata Steel Ltd.EW Metals and Mining IndexNifty
Buy
Buy
BuyBuy
Buy
Buy
300
425
550
675
800
Mar-10
Apr-10
May-10
Jun-10
Jul-10
Aug-10
Sep-10
Oct-10
Nov-10
Dec-10
Jan-11
Feb-11
Mar-11
(INR)
ISIEmergingMarketsPDF in-boa01 from 171.161.56.16 on 2011-03-10 04:10:12 EST. DownloadPDF.