124
Annual Report 2010
www.tateandlyle.com
Tate & Lyle A
nnual Rep
ort 2010
Annual Report 2010
Directors’ report Overview 1 Performance highlights 2 Chairman’s statement 3 Chief Executive’s review
Business review 8 What we do 18 Performance 18 Group financial results 21 Food & Industrial Ingredients, Americas 23 Food & Industrial Ingredients, Europe 24 Sugars 26 Sucralose 27 Other financial information 32 Corporate social responsibility
Governance 38 Board of directors 40 Executive management 41 Corporate governance 47 Directors’ remuneration report 56 Other statutory and governance information 57 Directors’ statement of responsibilities
Financial statements and other information
Financial statements 58 Independent Auditors’ Report to the
Members of Tate & Lyle PLC 59 Consolidated income statement 60 Consolidated statement of
comprehensive income 61 Consolidated statement of financial position 62 Consolidated statement of cash flows 63 Consolidated statement of changes in
shareholders’ equity 64 Notes to the consolidated financial statements 110 Parent company financial statements
Shareholder information 118 Ten-year review 120 Information for investors
A new way of reportingYou will notice that we have changed the way we report this year. The focus of this annual report is to fulfil our statutory obligations to report on the performance and prospects of the Company to our shareholders. For everything else you would like to know about Tate & Lyle, please go to our new website, www.tateandlyle.com.
www.tateandlyle.com
Contents
Tate & Lyle is a global provider of ingredients and solutions to the food, beverage and other industries. We transform raw materials into distinctive, high-quality ingredients for our customers which are consumed or used by millions of people every day.
Cautionary statementPlease read the full cautionary and non-reliance statements which can be found on page 121.
DefinitionsIn this report, ‘Company’ means Tate & Lyle PLC; ‘Tate & Lyle’ or ‘Group’ means Tate & Lyle PLC and its subsidiary and joint-venture companies.
TrademarksSPLENDA® and the SPLENDA® logo are trademarks of McNeil Nutritionals, LLC.
The DuPont Oval logo, DuPont™ and Sorona® are trademarks or registered trademarks of E. I. du Pont de Nemours and Company.
Primary and value added productsValue added products are those that utilise technology or intellectual property enabling our customers to produce distinctive products and Tate & Lyle to obtain a price premium and/or sustainable higher margins. Other products from our commodity corn milling and sugar businesses are classified as primary.
Basis of preparationUnless stated otherwise, the Group’s financial statements are prepared in accordance with International Financial Reporting Standards (IFRSs) as adopted by the EU. Information prior to 2005 is shown under Generally Accepted Accounting Practice in the UK (UK GAAP).
Adjusted operating profit and adjusted earnings per shareUnless stated otherwise, adjusted operating profit and adjusted earnings per share in this annual report and accounts exclude discontinued operations and are before exceptional items and amortisation of acquired intangible assets.
AmortisationUnless stated otherwise, the use of the word ‘amortisation’ on pages 1 to 57 in this annual report relates to the amortisation of acquired intangible assets.
Continuing operationsUnless stated otherwise, all comments in this annual report and accounts refer to the continuing operations adjusted to exclude exceptional items and amortisation of acquired intangible assets. A reconciliation of reported and adjusted information is included in Note 42 on page 109.
Non-reliance statementThis annual report and accounts has been prepared solely to provide additional information to shareholders to assess the Group’s strategy and the potential of that strategy to succeed and should not be relied upon by any other party or for any other purpose.
Cautionary statementThis annual report and accounts contains certain forward-looking statements with respect to the financial condition, results, operations and businesses of Tate & Lyle PLC. These statements and forecasts involve risk and uncertainty because they relate to events and depend upon circumstances that may occur in the future. There are a number of factors that could cause actual results or developments to differ materially from those expressed or implied by these forward-looking statements and forecasts. Nothing in this annual report and accounts should be construed as a profit forecast.
Tate & Lyle PLCTate & Lyle PLC is a public limited company listed on the London Stock Exchange and registered in England. This is the report and accounts for the year ended 31 March 2010. More information about Tate & Lyle can be found on our website at www.tateandlyle.com.
Environmental statementThis report is printed on ‘Look!’ paper and has been independently certified on behalf of the Forest Stewardship Council (FSC).
Printed at St Ives Westerham Press Ltd, ISO14001, FSC certified and CarbonNeutral®
Registered officeTate & Lyle PLCSugar Quay Lower Thames StreetLondon EC3R 6DQTel: +44 (0)20 7626 6525Fax: +44 (0)20 7623 5213Company number: 76535
www.tateandlyle.com
CreditsDesigned, typeset and produced bywww.berghindjoseph.com
Photography by David Rees
Tate & Lyle Annual Report 2010 121
Ove
rvie
wB
usin
ess
revi
ewG
over
nanc
eF
inan
cial
sta
tem
ents
Sha
reho
lder
info
rmat
ion

253
08 09
229
10
247
Adjusted profit before tax2
Year to 31 March£m
295
160166
08 09 08 09 08 09Primary Value added Total1
125
10
204
10
298
10
132
184
298
Adjusted operating profit Year to 31 March£m
2 867
802
2 065
08 09 08 09 08 09Primary Value added Total
2 476
10
1 030
10
3 506
10
2 584
969
3 553
Sales Year to 31 March£m
(127)
08 09 10
540
154
Free cash flow4 Year to 31 March£m
1 041
08 09
8143
10
1 231
Net debt As at 31 March£m
34.6
08 09
38.9
10
38.0
Adjusted diluted earnings per share Year to 31 Marchpence
Tate & Lyle Annual Report 2010 1
Performance highlights
Year to 31 March
Statutory results 2010 2009
Operating profit £8m £164m(Loss)/profit before tax (continuing operations) £(61)m £113mProfit for the year (total operations) £19m £70mDiluted earnings per share (total operations) 3.3p 14.1p
1 Total includes central costs of £31 million in 2010 and £18 million in 2009.
2 Before exceptional items and amortisation of acquired intangible assets.
3 Exchange rate movements reduced net debt by £79 million in the year ended 31 March 2010. Excluding movements in exchange rates, net debt reduced by £338 million.
4 Free cash flow is defined as cash flow from continuing operations after interest, taxation and capital expenditure.
Sha
reho
lder
info
rmat
ion
Ove
rvie
wB
usin
ess
revi
ewG
over
nanc
eF
inan
cial
sta
tem
ents
2 Tate & Lyle Annual Report 2010
Chairman’s statement
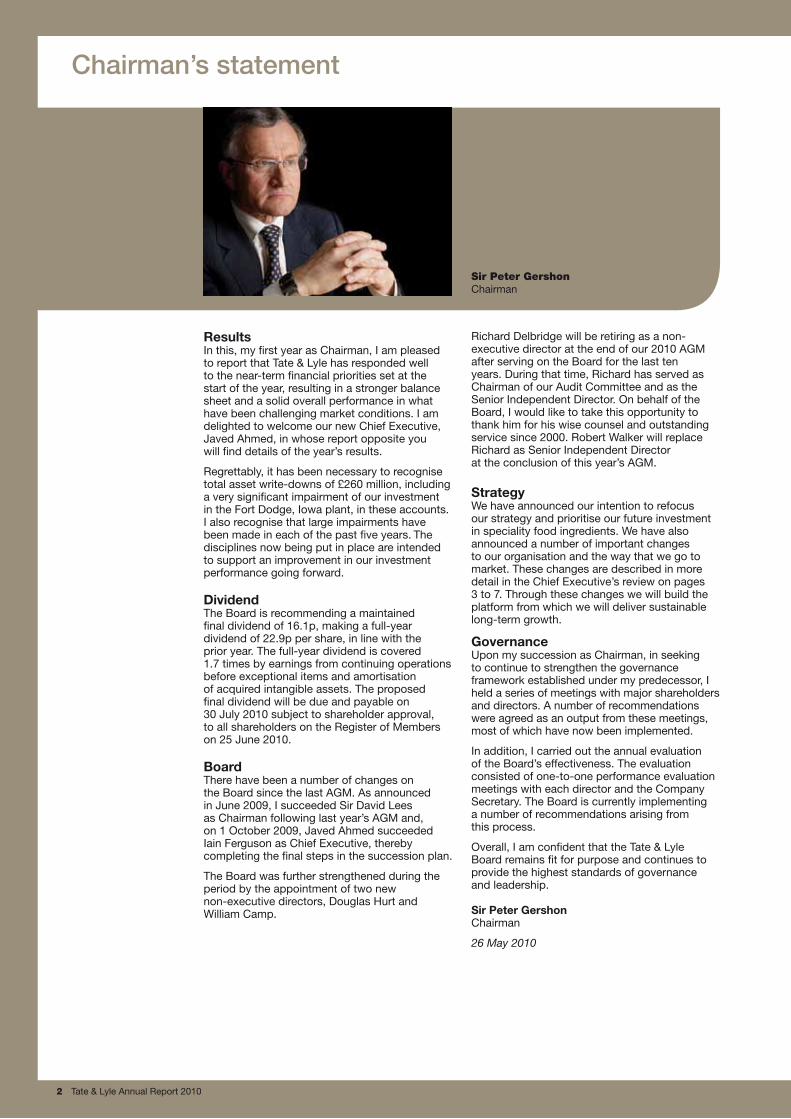
ResultsIn this, my first year as Chairman, I am pleased to report that Tate & Lyle has responded well to the near-term financial priorities set at the start of the year, resulting in a stronger balance sheet and a solid overall performance in what have been challenging market conditions. I am delighted to welcome our new Chief Executive, Javed Ahmed, in whose report opposite you will find details of the year’s results.
Regrettably, it has been necessary to recognise total asset write-downs of £260 million, including a very significant impairment of our investment in the Fort Dodge, Iowa plant, in these accounts. I also recognise that large impairments have been made in each of the past five years. The disciplines now being put in place are intended to support an improvement in our investment performance going forward.
DividendThe Board is recommending a maintained final dividend of 16.1p, making a full-year dividend of 22.9p per share, in line with the prior year. The full-year dividend is covered 1.7 times by earnings from continuing operations before exceptional items and amortisation of acquired intangible assets. The proposed final dividend will be due and payable on 30 July 2010 subject to shareholder approval, to all shareholders on the Register of Members on 25 June 2010.
BoardThere have been a number of changes on the Board since the last AGM. As announced in June 2009, I succeeded Sir David Lees as Chairman following last year’s AGM and, on 1 October 2009, Javed Ahmed succeeded Iain Ferguson as Chief Executive, thereby completing the final steps in the succession plan.
The Board was further strengthened during the period by the appointment of two new non-executive directors, Douglas Hurt and William Camp.
Richard Delbridge will be retiring as a non-executive director at the end of our 2010 AGM after serving on the Board for the last ten years. During that time, Richard has served as Chairman of our Audit Committee and as the Senior Independent Director. On behalf of the Board, I would like to take this opportunity to thank him for his wise counsel and outstanding service since 2000. Robert Walker will replace Richard as Senior Independent Director at the conclusion of this year’s AGM.
StrategyWe have announced our intention to refocus our strategy and prioritise our future investment in speciality food ingredients. We have also announced a number of important changes to our organisation and the way that we go to market. These changes are described in more detail in the Chief Executive’s review on pages 3 to 7. Through these changes we will build the platform from which we will deliver sustainable long-term growth.
GovernanceUpon my succession as Chairman, in seeking to continue to strengthen the governance framework established under my predecessor, I held a series of meetings with major shareholders and directors. A number of recommendations were agreed as an output from these meetings, most of which have now been implemented.
In addition, I carried out the annual evaluation of the Board’s effectiveness. The evaluation consisted of one-to-one performance evaluation meetings with each director and the Company Secretary. The Board is currently implementing a number of recommendations arising from this process.
Overall, I am confident that the Tate & Lyle Board remains fit for purpose and continues to provide the highest standards of governance and leadership.
SirPeterGershonChairman
26 May 2010
Sir Peter Gershon Chairman
Tate & Lyle Annual Report 2010 3
Chief Executive’s review
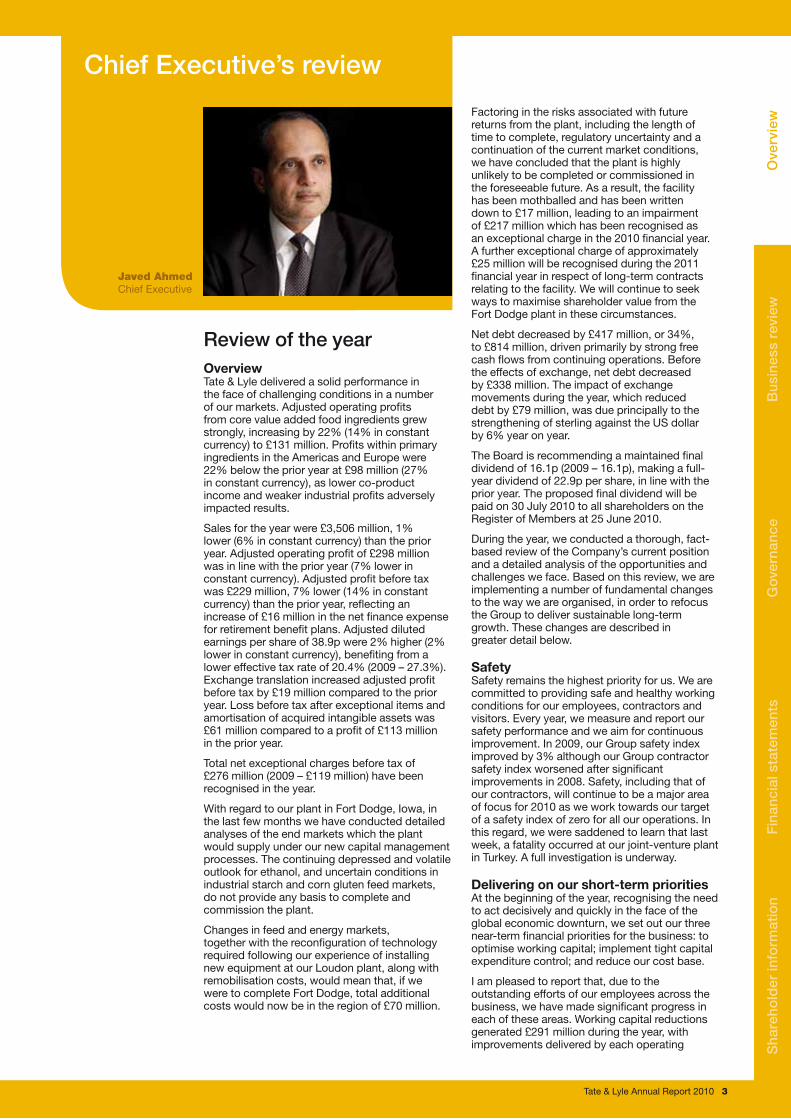
Review of the yearOverviewTate & Lyle delivered a solid performance in the face of challenging conditions in a number of our markets. Adjusted operating profits from core value added food ingredients grew strongly, increasing by 22% (14% in constant currency) to £131 million. Profits within primary ingredients in the Americas and Europe were 22% below the prior year at £98 million (27% in constant currency), as lower co-product income and weaker industrial profits adversely impacted results.
Sales for the year were £3,506 million, 1% lower (6% in constant currency) than the prior year. Adjusted operating profit of £298 million was in line with the prior year (7% lower in constant currency). Adjusted profit before tax was £229 million, 7% lower (14% in constant currency) than the prior year, reflecting an increase of £16 million in the net finance expense for retirement benefit plans. Adjusted diluted earnings per share of 38.9p were 2% higher (2% lower in constant currency), benefiting from a lower effective tax rate of 20.4% (2009 – 27.3%). Exchange translation increased adjusted profit before tax by £19 million compared to the prior year. Loss before tax after exceptional items and amortisation of acquired intangible assets was £61 million compared to a profit of £113 million in the prior year.
Total net exceptional charges before tax of £276 million (2009 – £119 million) have been recognised in the year.
With regard to our plant in Fort Dodge, Iowa, in the last few months we have conducted detailed analyses of the end markets which the plant would supply under our new capital management processes. The continuing depressed and volatile outlook for ethanol, and uncertain conditions in industrial starch and corn gluten feed markets, do not provide any basis to complete and commission the plant.
Changes in feed and energy markets, together with the reconfiguration of technology required following our experience of installing new equipment at our Loudon plant, along with remobilisation costs, would mean that, if we were to complete Fort Dodge, total additional costs would now be in the region of £70 million.
Javed AhmedChief Executive
Factoring in the risks associated with future returns from the plant, including the length of time to complete, regulatory uncertainty and a continuation of the current market conditions, we have concluded that the plant is highly unlikely to be completed or commissioned in the foreseeable future. As a result, the facility has been mothballed and has been written down to £17 million, leading to an impairment of £217 million which has been recognised as an exceptional charge in the 2010 financial year. A further exceptional charge of approximately £25 million will be recognised during the 2011 financial year in respect of long-term contracts relating to the facility. We will continue to seek ways to maximise shareholder value from the Fort Dodge plant in these circumstances.
Net debt decreased by £417 million, or 34%, to £814 million, driven primarily by strong free cash flows from continuing operations. Before the effects of exchange, net debt decreased by £338 million. The impact of exchange movements during the year, which reduced debt by £79 million, was due principally to the strengthening of sterling against the US dollar by 6% year on year.
The Board is recommending a maintained final dividend of 16.1p (2009 – 16.1p), making a full-year dividend of 22.9p per share, in line with the prior year. The proposed final dividend will be paid on 30 July 2010 to all shareholders on the Register of Members at 25 June 2010.
During the year, we conducted a thorough, fact-based review of the Company’s current position and a detailed analysis of the opportunities and challenges we face. Based on this review, we are implementing a number of fundamental changes to the way we are organised, in order to refocus the Group to deliver sustainable long-term growth. These changes are described in greater detail below.
SafetySafety remains the highest priority for us. We are committed to providing safe and healthy working conditions for our employees, contractors and visitors. Every year, we measure and report our safety performance and we aim for continuous improvement. In 2009, our Group safety index improved by 3% although our Group contractor safety index worsened after significant improvements in 2008. Safety, including that of our contractors, will continue to be a major area of focus for 2010 as we work towards our target of a safety index of zero for all our operations. In this regard, we were saddened to learn that last week, a fatality occurred at our joint-venture plant in Turkey. A full investigation is underway.
Deliveringonourshort-termprioritiesAt the beginning of the year, recognising the need to act decisively and quickly in the face of the global economic downturn, we set out our three near-term financial priorities for the business: to optimise working capital; implement tight capital expenditure control; and reduce our cost base.
I am pleased to report that, due to the outstanding efforts of our employees across the business, we have made significant progress in each of these areas. Working capital reductions generated £291 million during the year, with improvements delivered by each operating S
hare
hold
er in
form
atio
nO
verv
iew
Bus
ines
s re
view
Gov
erna
nce
Fin
anci
al s
tate
men
ts
4 Tate & Lyle Annual Report 2010
division and within each major area of the working capital base. Capital expenditure of £79 million represented 68% of depreciation, in line with our commitment stated at the beginning of the financial year to hold expenditure below the annual depreciation charge. Underlying costs reduced by £30 million in the year compared to the comparative period, including the cost savings achieved from rationalising the sucralose manufacturing footprint, with reductions achieved through our focus on all areas of the cost base.
AstrongerbalancesheetThe Group’s balance sheet has been strengthened significantly during the year. Net debt was reduced by 34% to £814 million at 31 March 2010 (from £1,231 million at 31 March 2009). This reduction has been achieved through a relentless focus on cash management within every area of the business. Tate & Lyle is a strongly cash generative business, and focus on cash management will remain an ongoing priority.
The key performance indicators of our financial strength, the ratio of net debt to earnings before interest, tax, depreciation and amortisation (EBITDA) and interest cover, remain within our internal targets. Consistent with the Group’s financial strategy at least to maintain our investment-grade credit ratings, during the year we tightened our maximum target for net debt to EBITDA to 2.0 times from 2.5 times. At 31 March 2010, the net debt to EBITDA ratio was 1.8 times (2009 – 2.4 times), within our new target and comfortably within our bank covenants. Interest cover on total operations at 31 March 2010 was 5.8 times (2009 – 6.1 times), again ahead of our minimum target of 5.0 times and well ahead of our bank covenants.
During the year we announced that, with a view to containing our pension costs and reducing balance sheet volatility, we had entered into consultation with employees who were active members of the UK Group Pension Scheme on the closure of that scheme to future accrual from April 2011. Following completion of the consultation process, the Company will close the Group scheme from April 2011. We also took the decision to remove the early retirement discretion from November 2009. We have recognised an exceptional gain of £42 million in the 2010 financial year arising from these changes.
OverviewofdivisionalbusinessperformanceAdjusted operating profit at Food & Industrial Ingredients, Americas was £178 million, 2% below the prior year (10% in constant currency). Operating profits from value added food ingredients increased by 18% (9% in constant currency), reflecting firmer pricing and steadier demand patterns. Operating profits in primary food ingredients were below the prior year due to lower co-product income from the sale of corn oil.
Performance from primary industrial ingredients, comprising ethanol, native industrial starches and animal feed co-products was below the level of the prior year due to lower animal feed co-product income and reduced industrial starch margins.
At Food & Industrial Ingredients, Europe, adjusted operating profits of £54 million were 6% above the prior year (4% in constant currency). Within Single Ingredients, profits from primary products were lower as reduced levels of capacity utilisation impacted unit margins, particularly in the second half of the year, although the business continues to benefit from the relative stability afforded by isoglucose quotas in Europe. Demand for value added food ingredients was steady, and unit margins increased with improved pricing. Food Systems performance was above the prior year, as demand in key markets proved relatively robust in the face of the economic downturn.
Adjusted operating profits within the Sugars division increased by 150% to £30 million (100% in constant currency) reflecting improved margins in our EU sugar business during the second half of the year following the final institutional price change on 1 October 2009. Performance also benefited from lower energy and distribution costs. Our molasses and storage business performed well in the year, with operating profit of £13 million, although this was below the exceptionally strong profits achieved in the comparative period when the sharp spike in cereal prices during the summer of 2008 led to very high demand and prices for molasses.
Sales of SPLENDA® Sucralose of £187 million were 11% above the prior year (4% in constant currency). Following the significant yield improvements achieved during the 2009 financial year, and the consequent decision to produce all sucralose at our fourth-generation facility in Singapore, the process of mothballing the plant in McIntosh, Alabama was completed ahead of schedule. Adjusted operating profits decreased by 7% to £67 million (9% in constant currency) due to one-off credits of £4 million in the prior year, certain costs in the current year associated with the rationalisation of the manufacturing footprint and the relatively high costs in opening inventory which impacted cost of sales in the 2010 financial year.
Central costs increased to £31 million from £18 million in the prior year. During the year, we incurred one-off costs of £5 million related to the review and reorganisation of the Group’s activities, while the prior year included one-off credits totalling £6 million.
ExceptionalitemsExceptional items within our continuing operations during the year totalled a net charge of £276 million (2009 – £119 million).
Following a detailed analysis of end markets, in light of costs of around £70 million to complete and commission our plant in Fort Dodge, and factoring in the risks associated with future returns from completing and operating the plant, we have concluded that the plant is highly unlikely to be completed or commissioned in the foreseeable future. As a result, the facility has been mothballed and written down to £17 million, leading to an impairment of £217 million which has been
“Through resolute focus on our financial priorities, we
have significantly strengthened the balance sheet. ”
Overview Chief executive’s review
Tate & Lyle Annual Report 2010 5
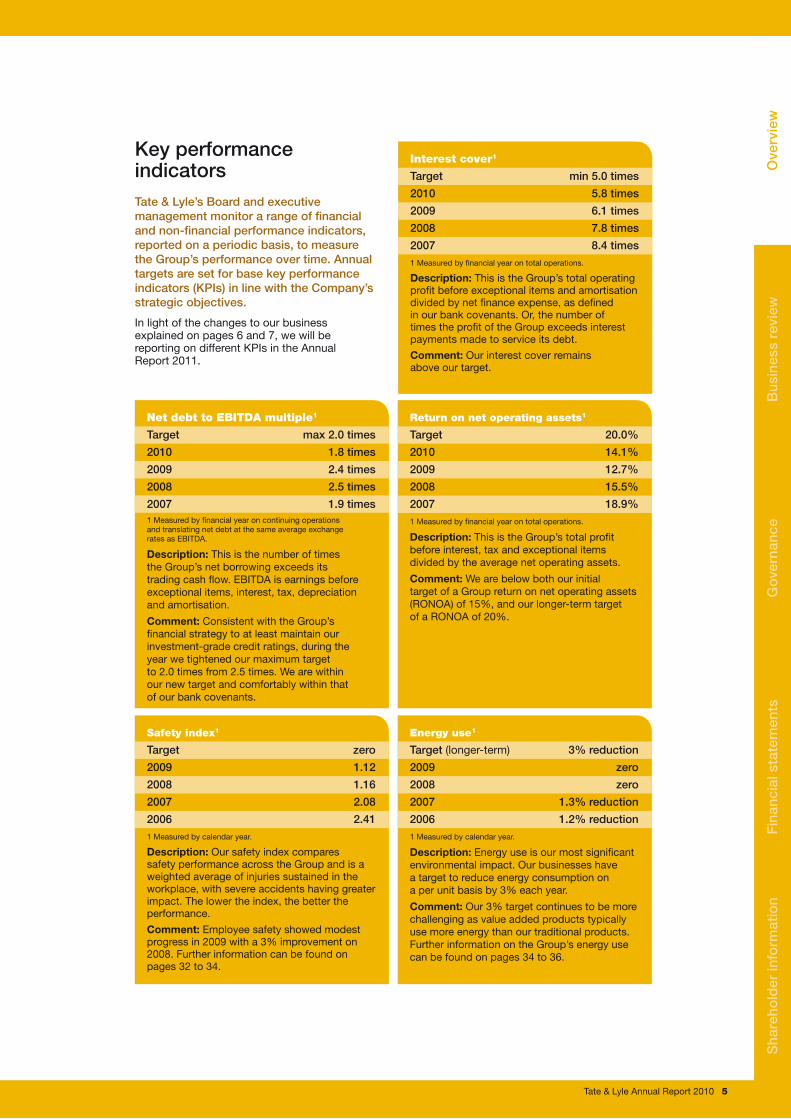
Safety index1
Target zero
2009 1.12
2008 1.16
2007 2.08
2006 2.411 Measured by calendar year.
Description: Our safety index compares safety performance across the Group and is a weighted average of injuries sustained in the workplace, with severe accidents having greater impact. The lower the index, the better the performance.
Comment: Employee safety showed modest progress in 2009 with a 3% improvement on 2008. Further information can be found on pages 32 to 34.
Net debt to EBITDA multiple1
Target max 2.0 times
2010 1.8 times
2009 2.4 times
2008 2.5 times
2007 1.9 times1 Measured by financial year on continuing operations and translating net debt at the same average exchange rates as EBITDA.
Description: This is the number of times the Group’s net borrowing exceeds its trading cash flow. EBITDA is earnings before exceptional items, interest, tax, depreciation and amortisation.
Comment: Consistent with the Group’s financial strategy to at least maintain our investment-grade credit ratings, during the year we tightened our maximum target to 2.0 times from 2.5 times. We are within our new target and comfortably within that of our bank covenants.
Return on net operating assets1
Target 20.0%
2010 14.1%
2009 12.7%
2008 15.5%
2007 18.9%1 Measured by financial year on total operations.
Description: This is the Group’s total profit before interest, tax and exceptional items divided by the average net operating assets.
Comment: We are below both our initial target of a Group return on net operating assets (RONOA) of 15%, and our longer-term target of a RONOA of 20%.
Interest cover1
Target min 5.0 times
2010 5.8 times
2009 6.1 times
2008 7.8 times
2007 8.4 times1 Measured by financial year on total operations.
Description: This is the Group’s total operating profit before exceptional items and amortisation divided by net finance expense, as defined in our bank covenants. Or, the number of times the profit of the Group exceeds interest payments made to service its debt.
Comment: Our interest cover remains above our target.
Energy use1
Target (longer-term) 3% reduction
2009 zero
2008 zero
2007 1.3% reduction
2006 1.2% reduction1 Measured by calendar year.
Description: Energy use is our most significant environmental impact. Our businesses have a target to reduce energy consumption on a per unit basis by 3% each year.
Comment:Our 3% target continues to be more challenging as value added products typically use more energy than our traditional products. Further information on the Group’s energy use can be found on pages 34 to 36.
Key performanceindicatorsTate & Lyle’s Board and executive management monitor a range of financial and non-financial performance indicators, reported on a periodic basis, to measure the Group’s performance over time. Annual targets are set for base key performance indicators (KPIs) in line with the Company’s strategic objectives.
In light of the changes to our business explained on pages 6 and 7, we will be reporting on different KPIs in the Annual Report 2011.
Sha
reho
lder
info
rmat
ion
Ove
rvie
wB
usin
ess
revi
ewG
over
nanc
eF
inan
cial
sta
tem
ents
6 Tate & Lyle Annual Report 2010
Overview Chief executive’s review
recognised as an exceptional charge in the 2010 financial year. A further exceptional charge of approximately £25 million will be recognised during the 2011 financial year in respect of long-term contracts relating to the facility.
As reported at the half year, we recognised an exceptional charge of £55 million following the decision to mothball the sucralose manufacturing facility in McIntosh, Alabama.
The reorganisation of our food systems business in Europe will lead to exceptional cash costs totalling £7 million, of which £3 million has been recognised in the 2010 financial year, with the balance recognised in the 2011 financial year.
In the Food & Industrial Ingredients, Americas segment, following a review of the portfolio of research and development projects in the context of our new strategic focus, we have written off £28 million relating to a xanthan gum pilot plant and other related assets following the decision not to pursue these products to full-scale production.
Our sugar refining business in Israel continues to experience extremely challenging market conditions, with surplus refined sugar supplies placing considerable pressure on refining margins. Given the continued decline in the business’s commercial prospects, we have recognised a further impairment charge of £15 million in addition to the charge of £9 million recognised in 2009.
An exceptional gain of £42 million has been recognised following the decision to close the UK Group Pension Scheme to future accrual from April 2011 and to remove the early retirement discretion from November 2009.
The tax impact on continuing net exceptional items totalled a £112 million credit (2009 – £44 million credit). In addition, an exceptional tax credit of £15 million has been recognised in the year relating to the release of certain tax provisions following the resolution of issues with tax authorities.
OutlookLooking forward, we anticipate that steady demand patterns for value added food ingredients will continue and, combined with the benefits of a single plant sucralose manufacturing base, we expect a modest improvement in value added food performance in the 2011 financial year.
Within our primary markets, we expect continuing modest decline in US domestic sweetener demand to be largely offset by increased demand from Mexico, and stable demand in other markets for primary food ingredients. Despite some improvement in demand patterns, industrial starch margins are expected to remain at lower levels, reflecting industry overcapacity putting pressure on pricing, and we see little near-term improvement in ethanol markets. Within Sugars, whilst unit refining margins have returned, profitability in the 2011 financial year will be constrained by short-term supply challenges.
Overall, we anticipate progress in the coming financial year as we maintain our focus on the disciplines necessary to continue delivering strong cash flows from our business.
Review of the businessSince joining Tate & Lyle in October last year, I have led a thorough, fact-based review of the Company’s current position, and an assessment of the opportunities and challenges in front of us.
Tate & Lyle has some real strengths we can build on. It was clear to me as soon as I joined the Company that acting safely, responsibly and sustainably, with high levels of integrity, were hallmarks of Tate & Lyle. The Company also has a large, cost efficient, and well invested manufacturing footprint, and deep technical process and applications expertise. Our customer base includes many large, global companies with whom we have strong, long-term relationships based on our clear focus on quality, reliability and customer service. We also have a long, successful history of operating internationally and, as can be seen from the past year’s results, the potential for strong cash generation.
At the same time, we face a number of strategic and operational challenges. Strategically, we operate in a number of different markets with different characteristics and needs. We have solid competitive positions in some of these markets, but in others a path to leadership is unclear. We continue to have a relatively large exposure to commodity markets, with their inherent volatility and cyclicality, whilst, at the same time, having a limited exposure to key avenues of longer-term growth, in terms of categories and geographies. Over the last few years there has also been some inconsistency between strategic intent and actual investment strategy, with the majority of our capital having been spent on our commodity rather than our speciality business. Additionally, the operating model has lacked focus, and constrained rather than driven performance. Finally, a number of enablers, such as the capital allocation and implementation process and the IS/IT infrastructure, need significant strengthening.
In order to address these issues and reinvigorate Tate & Lyle, we will take steps to focus, fix and grow our business.
1.FocusIn future, our purpose will be to grow our speciality food ingredients business. We will do this through deeper customer understanding, continuous innovation and agility, and through building stronger positions in high-growth markets. We will continue to drive sustained cash generation from our bulk ingredients and sugars businesses to fuel this growth.
2.FixFixing the operating modelThe current business operating structure, with a mixture of regional and product-based business units, does not support execution of the Group’s strategy. From 1 June 2010 we will reorganise and operate through three global business units: Speciality Food Ingredients, Bulk Ingredients and Sugars. Each business unit will have a distinct go-to-market organisation to provide the necessary focus and bring the required expertise to the different markets we serve, and each will have a dedicated manufacturing asset base.
Tate & Lyle Annual Report 2010 7
Fixing the operationsThe review of our approach to capital investment planning and implementation, which we announced at our half-year results in November, has been largely completed, and will lead to a number of changes to the way we invest fixed capital in our business in future. For all major capital projects, the approval process has been strengthened to incorporate a two-stage Board approval, including a more rigorous technical and commercial appraisal, supported where necessary by external experts. Ongoing reviews performed regularly by the Group Executive Committee, as well as peer reviews, have also been added to sharpen the investment appraisal process. We will also create a dedicated, internal resource, independent of the operations, with responsibility for oversight of all capital expenditure.
We have already made huge strides in the way we control working capital in our business, evident from the improvement delivered in the 2010 financial year. There is a much clearer appreciation within the organisation now of the need for working capital optimisation and this is something I intend to build on. To this end, we have implemented standard measures of working capital efficiency across the Group, and have set clear targets by business. In the 2011 financial year, these targets will, for the first time, be linked to management incentive structures.
Our three business units will be supported by global support services, using shared service centres to eliminate duplication and rationalise resources required. This will also allow us to redeploy some needed resources to the ‘front end’ of our business.
We have already started work to strengthen operational enablers, by establishing a common set of performance metrics across the business and we will move to a single global IS/IT platform to drive improved global decision making over the next two years. Although it will take time, I am confident that the steps we are taking now will lay the foundation to deliver significant improvements in operational execution over the coming months and years.
Exceptional costs of £8 million associated with the reorganisation and restructuring of the Group’s activities are expected to be recognised in the 2011 financial year, with further exceptional costs expected to be in the region of £13 million the following year. These cash costs are expected subsequently to pay back within two years. Additionally, we are developing a detailed implementation plan for a common, global IS/IT platform, which we anticipate will be implemented over the next 24 months.
Fixing the organisationIn order to fix our organisation, we are taking action to address our structure, our talent and our culture.
We will simplify and de-layer the organisation structure to accelerate decision-making and
move management closer to the business. We have developed clear guidelines on global talent acquisition to upgrade our capabilities and fill skills gaps in key areas. We are taking steps to embed a common, performance-driven culture within the organisation, and to define clear organisational values. We are establishing a clearer, metric-driven, performance management process which will be implemented during the coming year. The Group’s incentive system is also being restructured, to ensure that at all levels of the organisation there is a sharp focus on what drives behaviour and results. A greater proportion of pay will be at risk, with appropriate rewards to incentivise outstanding performance.
Fixing the investment focusOver the past four financial years, around two-thirds of our capital has been invested in our commodity business with one-third in our speciality business. Geographically, investment has been overwhelmingly focused on the developed markets with emerging markets largely ignored.
Over time, our investment focus will be realigned to our strategy: our engine of growth and the focus of acquisitions will be speciality food ingredients, with greater emphasis on emerging markets. Our bulk ingredients and sugars businesses remain strong and valued businesses, and we will continue to invest appropriately in order to increase their efficiency and generate cash.
3.GrowA new unit, the Innovation and Commercial Development group, will be established, dedicated to driving sustained long-term growth, with a key focus on speciality food ingredients. This unit will integrate R&D, global marketing and global product management, and will enable a fully integrated approach to developing and commercialising innovation.
We expect to achieve growth both in our existing markets, through the benefits of our new operating model and investment focus, and also in emerging markets and in the small- and medium-sized enterprise (SME) and private-label customer segments, where we have limited presence today.
Our new operating structure will provide a clean platform from which to grow the business, both organically and through acquisitions.
ConclusionThis statement has outlined our strategy of focusing on growing our speciality food ingredients business, and set out a number of important changes to our operating model and the way we function. We will report a set of performance metrics which will measure progress towards delivery of this strategy, and are creating reward structures aligned to these metrics.
Through these changes we will build the platform to deliver sustainable long-term value for our employees, our customers and our shareholders.
JavedAhmedChief Executive
26 May 2010
Find out more about Tate & Lyle at www.tateandlyle.com
“We are refocusing our strategy, with our speciality
food ingredients business being the key focus of investment and long-term growth. ”
Sha
reho
lder
info
rmat
ion
Ove
rvie
wB
usin
ess
revi
ewG
over
nanc
eF
inan
cial
sta
tem
ents

8 Tate & Lyle Annual Report 2010
Business review What we do
OverviewTate & Lyle is a global provider of ingredients and solutions to the food, beverage and other industries. Through our large-scale, efficient manufacturing plants, we turn raw materials into distinctive, high quality ingredients for our customers. Our ingredients and solutions add taste, texture, nutrition and increased functionality to products that millions of people around the world use or consume every day.
Tate & Lyle was founded in the UK in 1921 but its roots can be traced back to a number of companies established in the middle of the 19th century focused on sugars in Europe, and corn milling in the USA and Europe. Tate & Lyle is headquartered in the UK and operates more than 45 production facilities around the world.
Purpose and strategyTate & Lyle’s purpose is to become the leading global provider of speciality food ingredients and solutions.
Our strategy is to deliver sustainable long-term growth and returns for our shareholders through:
n disciplined focus on growing our speciality food ingredients business
– deeper customer understanding, continuous innovation and agility
– stronger positions in high-growth markets n driving our bulk ingredients and sugars
businesses for sustained cash generation to fuel this growth.
More details of how we will deliver on this strategy are given in the Chief Executive’s review on pages 3 to 7.
Organisational structureDuring the year ended 31 March 2010, the Group operated through four business divisions:
n Food & Industrial Ingredients, Americas;n Food & Industrial Ingredients, Europe;n Sugars; andn Sucralose.
These divisions were supported by the corporate head office in London and by a number of global business groups with expertise in areas such as procurement, information technology and research and development. A description of the performance of the Group and each of its four divisions for the year ended 31 March 2010 can be found on pages 18 to 31.
As explained in the Chief Executive’s review on pages 3 to 7, with effect from 1 June 2010, the Group will be reorganised into three new global business divisions:
n Speciality Food Ingredients;n Bulk Ingredients; andn Sugars.
The business divisions will be supported by a new Innovation and Commercial Development group with responsibility for bringing innovation to market; global business support functions; and a corporate head office.
Our operationsSourcingrawmaterialsEnsuring we have a long-term, reliable supply of corn and cane sugar for our plants is essential.
This involves developing long-term, mutually beneficial relationships with growers, farmers and other commercial partners to secure supply; understanding commodity markets; and hedging our costs where necessary and feasible.
CornTate & Lyle operates a network of corn wet mills in both North America and Europe, processing two types of corn: dent and waxy. Dent corn is the most common crop and is used to make high fructose corn syrup, basic food and industrial starches, alcohol (ethanol) and animal feed. Waxy corn is contracted direct from the farmer and has special functionality that makes it ideal for creating stabilisers, thickeners and emulsifiers for the food industry. It is also used in adhesives and gums for the paper industry.
Running our large corn wet milling plants in the USA efficiently 24 hours a day relies on good management of the corn supply chain. We own a network of elevators (silos) to purchase corn directly from farmer producers. Farmer-owned co-operatives and family-owned grain companies supply millions of bushels of corn each year for our plants. Corn purchase contracts may be negotiated with corn suppliers for delivery the same day, or in some cases price and terms may be for delivery up to 18 months ahead.
In Europe, we have one wholly-owned corn wet milling plant, with another four as part of our joint venture, Eaststarch. We also have one wholly-owned corn wet milling plant in Morocco. Due to the sweetener quota system in Europe and other factors such as transport infrastructure, our plants primarily serve local markets and are therefore significantly smaller than our US plants, processing in total just over two million tonnes of corn per year. We purchase dent corn locally where possible, and commission waxy corn direct from European farmers for producing speciality food starches at our plant in the Netherlands.
Cane sugarOur Sugars business processes and refines cane sugar, a tropical crop grown in areas of high sunshine and rainfall. Cane sugar accounts for around 80% of world sugar production.
In Europe, we have the capacity to refine about 1.4 million tonnes of sugar each year from our two refineries, and we process up to one million tonnes of sugar cane at our factory in Vietnam. While our Vietnamese operation sources from local growers, our European business secures supply from African, Caribbean and Pacific countries and least-developed countries under the EU Sugar Regime. These suppliers have preferential access to the European sugar market under various agreements with the EU.
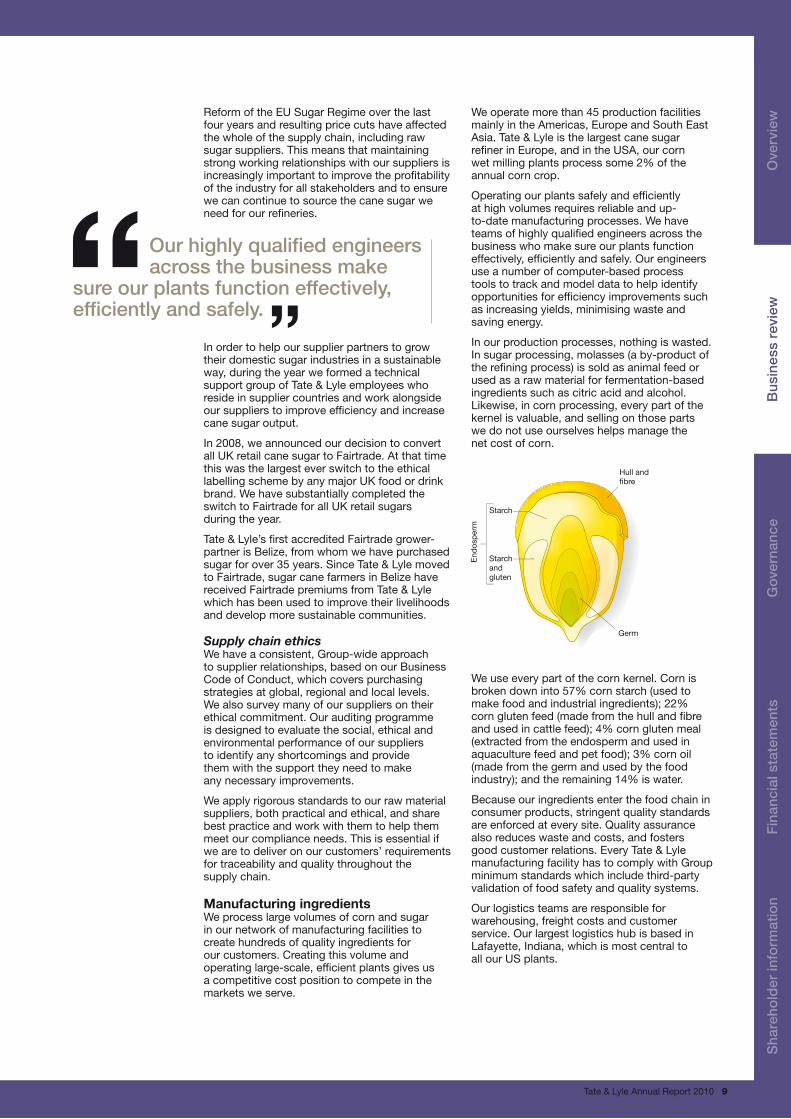
Starch
Starch and gluten
End
osp
erm
Germ
Hull and �bre
Tate & Lyle Annual Report 2010 9
Reform of the EU Sugar Regime over the last four years and resulting price cuts have affected the whole of the supply chain, including raw sugar suppliers. This means that maintaining strong working relationships with our suppliers is increasingly important to improve the profitability of the industry for all stakeholders and to ensure we can continue to source the cane sugar we need for our refineries.
In order to help our supplier partners to grow their domestic sugar industries in a sustainable way, during the year we formed a technical support group of Tate & Lyle employees who reside in supplier countries and work alongside our suppliers to improve efficiency and increase cane sugar output.
In 2008, we announced our decision to convert all UK retail cane sugar to Fairtrade. At that time this was the largest ever switch to the ethical labelling scheme by any major UK food or drink brand. We have substantially completed the switch to Fairtrade for all UK retail sugars during the year.
Tate & Lyle’s first accredited Fairtrade grower-partner is Belize, from whom we have purchased sugar for over 35 years. Since Tate & Lyle moved to Fairtrade, sugar cane farmers in Belize have received Fairtrade premiums from Tate & Lyle which has been used to improve their livelihoods and develop more sustainable communities.
Supply chain ethicsWe have a consistent, Group-wide approach to supplier relationships, based on our Business Code of Conduct, which covers purchasing strategies at global, regional and local levels. We also survey many of our suppliers on their ethical commitment. Our auditing programme is designed to evaluate the social, ethical and environmental performance of our suppliers to identify any shortcomings and provide them with the support they need to make any necessary improvements.
We apply rigorous standards to our raw material suppliers, both practical and ethical, and share best practice and work with them to help them meet our compliance needs. This is essential if we are to deliver on our customers’ requirements for traceability and quality throughout the supply chain.
ManufacturingingredientsWe process large volumes of corn and sugar in our network of manufacturing facilities to create hundreds of quality ingredients for our customers. Creating this volume and operating large-scale, efficient plants gives us a competitive cost position to compete in the markets we serve.
We operate more than 45 production facilities mainly in the Americas, Europe and South East Asia. Tate & Lyle is the largest cane sugar refiner in Europe, and in the USA, our corn wet milling plants process some 2% of the annual corn crop.
Operating our plants safely and efficiently at high volumes requires reliable and up-to-date manufacturing processes. We have teams of highly qualified engineers across the business who make sure our plants function effectively, efficiently and safely. Our engineers use a number of computer-based process tools to track and model data to help identify opportunities for efficiency improvements such as increasing yields, minimising waste and saving energy.
In our production processes, nothing is wasted. In sugar processing, molasses (a by-product of the refining process) is sold as animal feed or used as a raw material for fermentation-based ingredients such as citric acid and alcohol. Likewise, in corn processing, every part of the kernel is valuable, and selling on those parts we do not use ourselves helps manage the net cost of corn.
We use every part of the corn kernel. Corn is broken down into 57% corn starch (used to make food and industrial ingredients); 22% corn gluten feed (made from the hull and fibre and used in cattle feed); 4% corn gluten meal (extracted from the endosperm and used in aquaculture feed and pet food); 3% corn oil (made from the germ and used by the food industry); and the remaining 14% is water.
Because our ingredients enter the food chain in consumer products, stringent quality standards are enforced at every site. Quality assurance also reduces waste and costs, and fosters good customer relations. Every Tate & Lyle manufacturing facility has to comply with Group minimum standards which include third-party validation of food safety and quality systems.
Our logistics teams are responsible for warehousing, freight costs and customer service. Our largest logistics hub is based in Lafayette, Indiana, which is most central to all our US plants.
“Our highly qualified engineers across the business make
sure our plants function effectively, efficiently and safely. ”
Sha
reho
lder
info
rmat
ion
Ove
rvie
wB
usin
ess
revi
ewG
over
nanc
eF
inan
cial
sta
tem
ents
10 Tate & Lyle Annual Report 2010
NegotiatingpricesandvolumesSelling corn-based commodity products in both the Americas and Europe is usually done through annual pricing rounds. These involve a series of face-to-face meetings with customers, held over a number of months, where prices for products like high fructose corn syrup, or charges for toll production, are negotiated for the next 12 months or in some cases on a multi-year basis.
The majority of our commodity ingredients, both food and industrial, are sold through this mechanism, with only a small amount sold on a spot (or ad hoc) basis.
The pricing rounds are highly commercial and our sales teams are responsible for ensuring that we get the best price for our products, while remaining competitive against other ingredient suppliers who may sell the same ingredient or substitute products.
In the Americas, as soon as a customer order is agreed, we manage the risk of fluctuating corn prices by hedging this position on the Chicago Mercantile Exchange. In Europe, a smaller market for us than the Americas, there is no liquid corn futures market, which means we cannot hedge the full corn price risk as we can in the Americas. It is not possible to use hedging procedures to lock in the majority of by-product revenues in either Europe or the Americas. At our European sugars business, the cost of purchasing cane sugar and the final selling price of the finished product are determined within the framework of the EU Sugar Regime.
ResearchanddevelopmentWe have over 250 people in our R&D team worldwide working to develop innovative ingredients from renewable resources. We have R&D laboratories in Decatur, Illinois and Lille, France, but we also have application laboratories in countries such as France, China, Germany, Italy and Australia which are combined with our sales offices.
Our in-house R&D capability is organised into three primary groups: product development, technology, and customer solutions. The product development group focuses on developing new products and improving existing products. The technology group covers process engineering, analytical and carbohydrate chemistry, and biochemicals. The team focuses on how to create, analyse and manufacture ingredients. The customer solutions group includes applications and technical service teams. The applications teams develop prototypes and provide sensory analysis for customers using our ingredients, while the technical services teams work directly with our customers to incorporate our ingredients into their products.
With effect from 1 June 2010, our product development group will be combined with our global marketing and global platform management functions to form the new Innovation and Commercial Development group, dedicated to promoting innovation and developing new products and markets for Tate & Lyle.
Research partnershipsTo give us fresh ideas and insights into the market, we develop partnerships with the external research community. In October 2008, with the support of a £4.5 million contribution over five years from Tate & Lyle, a new clinical research facility was opened by King’s College London at St Thomas’ Hospital to undertake research into areas such as gastrointestinal health, carbohydrate metabolism, and medical conditions such as obesity, diabetes and cardiovascular disorders. Our partnership with King’s College London will allow us to share knowledge and ultimately bring new products and technologies to market.
Our R&D laboratory in Lille, France, is an active member of the Nutrition, Health and Longevity cluster in Lille that fosters collaboration between private and public research organisations and companies. Through our participation, we have been able to obtain funding for a research project to develop new prebiotics and have also made close ties with a research platform on extraction and purification methods.
Our Research Advisory Group comprises a panel of six international industry and academic experts, chaired by one of our non-executive directors, Dr Barry Zoumas. It reviews our R&D portfolio and provides insight into how leading-edge technologies could apply to future developments.
Our venture capital fund, Tate & Lyle Ventures, which was launched in 2006, invests in early-stage, high-growth companies that specialise in renewable ingredients, food technologies, renewable resources and industrial processing technologies.
To support our businesses and protect our competitive advantage, we maintain a significant number of patents. Much of the product innovation and development work we do results in patentable or proprietary new technology. We monitor market developments closely to identify any potential violations of our patents and intellectual property and take appropriate legal action where we consider it necessary.
The markets we serveWe provide customers in four markets – food and beverage, industrial, animal feed and pharmaceutical and personal care – with quality services and ingredients. Our customer base includes many of the world’s major food, beverage and industrial companies.
FoodandbeverageFood and beverage is our most significant market, comprising over 75% of the Group’s total sales. In this sector, we also sell end-products directly through retail distribution channels to retail customers in certain markets. Our ingredients can be found in the products of nearly all the world’s top 100 food and beverage companies.
We sell two distinct sets of ingredients and services to food and beverage customers – value added ingredients and primary ingredients.
Business review What we do
Tate & Lyle Annual Report 2010 11
Value added ingredients are those ingredients that utilise technology or intellectual property enabling our customers to produce distinctive products and Tate & Lyle to obtain a price premium and/or sustainable higher margins. In these markets, our customers value technical and innovation capability, insight and flexibility. Primary ingredients are relatively undifferentiated ingredients, sold in markets where customers principally value supplier reliability, quality and value.
In the value added food ingredients market, we currently operate within three categories: sweeteners, such as SPLENDA® Sucralose and crystalline fructose; texturants, such as starch and gums; and wellness ingredients, such as PROMITOR™ dietary fibres.
With effect from 1 June 2010, our Speciality Food Ingredients business will be managed separately as a single global business unit to ensure an absolute focus on the end markets we serve. We expect this business unit to be a key driver of longer-term growth.
Customer understanding drives all that we do. At the heart of our customer approach is the use of market research to understand the consumer (our customers’ customer), the markets we operate in and our customers’ needs. In 2005, we were one of the first food ingredients companies to go direct to the consumer to understand for ourselves what drives purchasing habits, and what consumers might look for in future products. We use this insight to drive our own product development, to differentiate ourselves from our competitors and, importantly, to give our customers an advantage by working with Tate & Lyle. Each year we run a programme of studies to canvass the views of consumers in Europe, the Americas and Asia. We typically use basic attitudinal research (such as focus groups) as a starting point, then complete the programme with detailed quantitative studies.
Our R&D, marketing and regulatory teams work together to provide customers with insights from consumer research, support on labelling requirements, and assistance on meeting product claims.
Over the last three years, we have also taken the opportunity to invest in food systems, or blending and speciality ingredients businesses. These businesses open up new avenues for selling ingredients through their relationships with small- to medium-sized customers and their expertise in specific areas such as the dairy industry, gums and custom formulations. Primarily based in North America, Germany, Italy and South Africa, these businesses source ingredients and use them to develop solutions for customers.
Their specialist knowledge supplements our existing in-house R&D capability. These businesses also often act as an R&D team for small- to medium-sized customers and, by building close working relationships, become trusted development partners.
IndustrialThe global market for industrial ingredients came under severe pressure as a result of the economic downturn towards the end of the 2008 calendar year, and demand has remained at lower levels since then. Over the longer term, however, we believe the trend towards greener living and the replacement of petrochemicals will continue to stimulate demand for industrial ingredients made from renewable sources. Traditional industrial markets for Tate & Lyle have included paper and board (starches), fuels (ethanol) and household goods (acidulants). Newer markets for us include textiles and plastics (Bio-PDO™).
AnimalfeedWe serve this market with molasses produced and traded worldwide and corn gluten meal and corn gluten feed produced in both Europe and the Americas. The latter are by-products of our key production processes and are sold as nourishing feed ingredients for livestock, fish and for use in pet foods. Selling on these products is important because it helps us reduce the net cost of our raw materials.
PharmaceuticalandpersonalcareA relatively small market for Tate & Lyle, pharmaceutical and personal care is one we expect will grow in the future although remaining relatively modest. At the moment, we sell two value added ingredients into this market: Zemea™ (cosmetics and creams), through our joint venture DuPont Tate & Lyle BioProducts; and SPLENDA® Sucralose (used in oral care products and to sweeten medicines without adding calories).
“We count many of the world’s major food, beverage
and industrial companies as our customers. ”
Sha
reho
lder
info
rmat
ion
Ove
rvie
wB
usin
ess
revi
ewG
over
nanc
eF
inan
cial
sta
tem
ents
12 Tate & Lyle Annual Report 2010
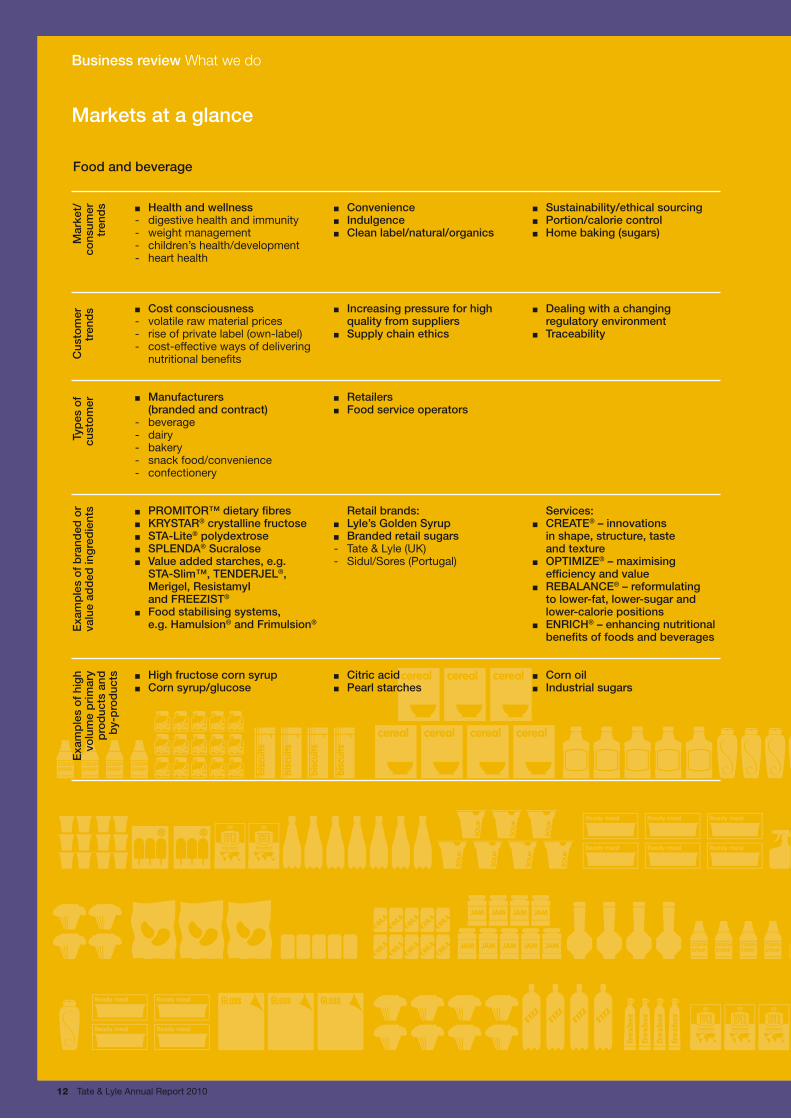
n Health and wellness- digestive health and immunity - weight management - children’s health/development - heart health n Cost consciousness- volatile raw material prices - rise of private label (own-label) - cost-effective ways of delivering nutritional benefits n Manufacturers (branded and contract)- beverage - dairy - bakery - snack food/convenience - confectionery n PROMITOR™ dietary fibresn KRYSTAR® crystalline fructosen STA-Lite® polydextrosen SPLENDA® Sucralosen Value added starches, e.g. STA-Slim™, TENDERJEL®, Merigel, ResistamyI and FREEZIST®
n Food stabilising systems, e.g. Hamulsion® and Frimulsion®
n High fructose corn syrupn Corn syrup/glucose
n Conveniencen Indulgencen Clean label/natural/organics n Increasing pressure for high quality from suppliers n Supply chain ethics n Retailersn Food service operators Retail brands: n Lyle’s Golden Syrupn Branded retail sugars- Tate & Lyle (UK) - Sidul/Sores (Portugal) n Citric acidn Pearl starches
n Sustainability/ethical sourcingn Portion/calorie controln Home baking (sugars) n Dealing with a changing regulatory environment n Traceability Services: n CREATE® – innovations in shape, structure, taste and texture n OPTIMIZE® – maximising efficiency and value n REBALANCE® – reformulating to lower-fat, lower-sugar and lower-calorie positions n ENRICH® – enhancing nutritional benefits of foods and beverages n Corn oiln Industrial sugars
Food and beverage
Mar
ket/
co
nsum
er
tren
ds
Cus
tom
er
tren
ds
Typ
es o
f cu
sto
mer
Exa
mp
les
of
bra
nded
or
valu
e ad
ded
ing
red
ient
sE
xam
ple
s o
f hi
gh
volu
me
pri
mar
y p
rod
ucts
and
b
y-p
rod
ucts
Markets at a glance
Business review What we do
Tate & Lyle Annual Report 2010 13
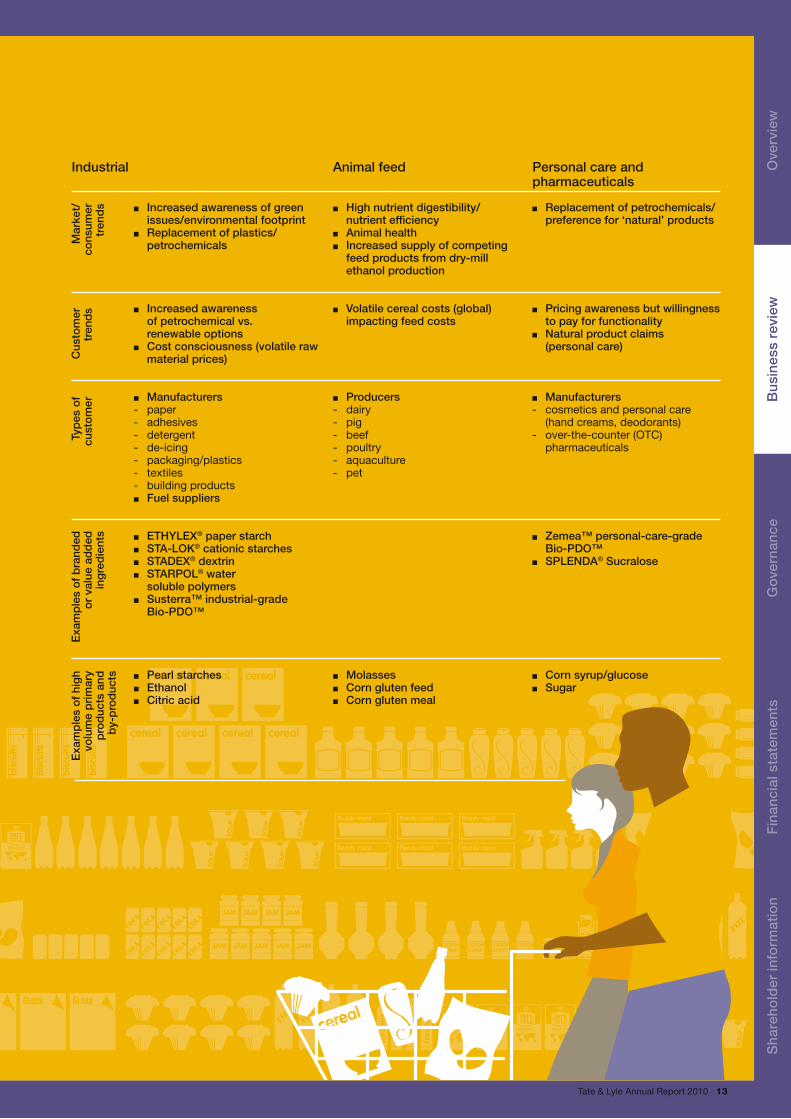
n Increased awareness of green issues/environmental footprint n Replacement of plastics/ petrochemicals n Increased awareness of petrochemical vs. renewable options n Cost consciousness (volatile raw material prices) n Manufacturers- paper - adhesives - detergent - de-icing - packaging/plastics - textiles - building products n Fuel suppliers n ETHYLEX® paper starchn STA-LOK® cationic starchesn STADEX® dextrinn STARPOL® water soluble polymers n Susterra™ industrial-grade Bio-PDO™ n Pearl starchesn Ethanoln Citric acid
n High nutrient digestibility/ nutrient efficiency n Animal healthn Increased supply of competing feed products from dry-mill ethanol production n Volatile cereal costs (global) impacting feed costs n Producers- dairy - pig - beef - poultry - aquaculture - pet n Molassesn Corn gluten feedn Corn gluten meal
n Replacement of petrochemicals/ preference for ‘natural’ products n Pricing awareness but willingness to pay for functionality n Natural product claims (personal care) n Manufacturers- cosmetics and personal care (hand creams, deodorants) - over-the-counter (OTC) pharmaceuticals n Zemea™ personal-care-grade Bio-PDO™ n SPLENDA® Sucralose n Corn syrup/glucosen Sugar
Industrial
Mar
ket/
co
nsum
er
tren
ds
Cus
tom
er
tren
ds
Typ
es o
f cu
sto
mer
Exa
mp
les
of
bra
nded
o
r va
lue
add
ed
ing
red
ient
s
Exa
mp
les
of
hig
h vo
lum
e p
rim
ary
pro
duc
ts a
nd
by-
pro
duc
ts
Animal feed Personal care and pharmaceuticals
Sha
reho
lder
info
rmat
ion
Ove
rvie
wB
usin
ess
revi
ewG
over
nanc
eF
inan
cial
sta
tem
ents
14 Tate & Lyle Annual Report 2010
PeopleRunning a diverse business like Tate & Lyle, which develops, manufactures and sells a wide variety of products and services to customers in different markets across the world, relies on a team of highly skilled, motivated people from a wide range of disciplines.
To attract and retain the best people, Tate & Lyle must be a place where people want to work. For us this is about giving people opportunities and challenges to stretch themselves and make the most of their potential; clear direction and inspirational leadership; and a supportive working environment.
NewleadershipThis financial year saw changes in the leadership team at Tate & Lyle. Javed Ahmed became Chief Executive in October 2009, and Rob Luijten joined as Group HR Director in February 2010. Along with the organisational changes explained in the Chief Executive’s review, their priority for employees will be to develop a stronger performance-driven culture throughout the Company. This change process was already underway as we published this annual report and is focusing on values, behaviours and HR processes across the world, to align these more closely with performance and results.
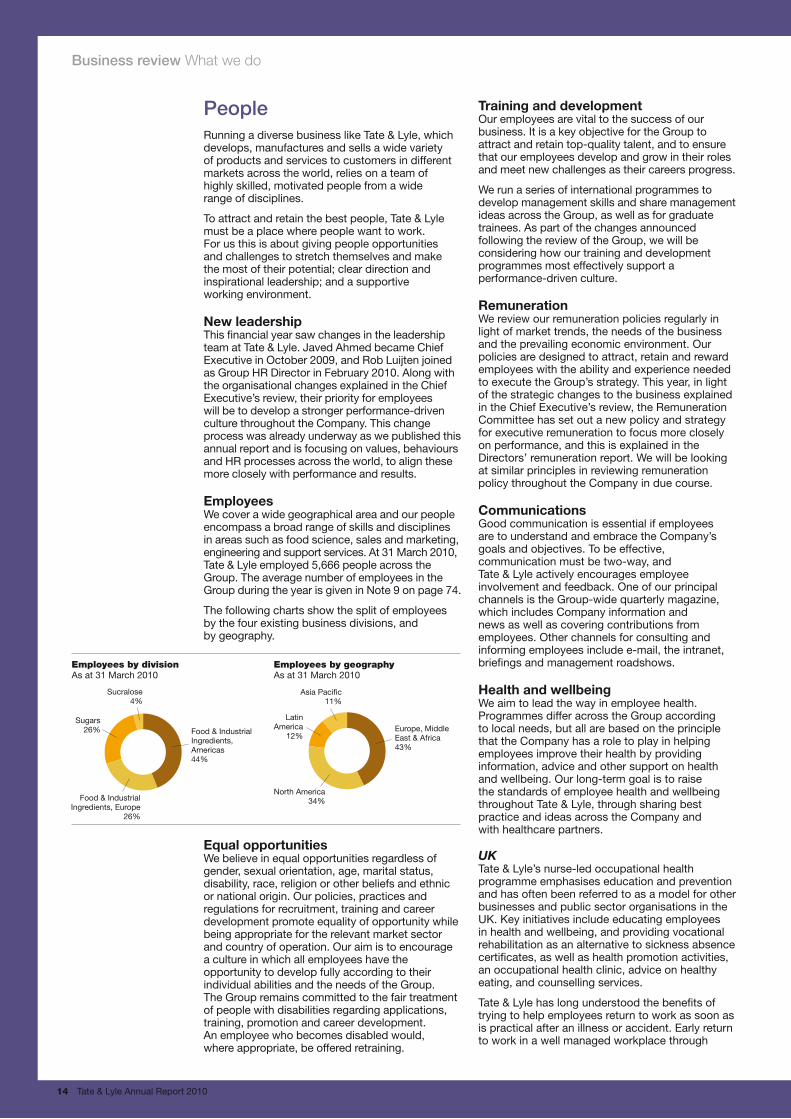
EmployeesWe cover a wide geographical area and our people encompass a broad range of skills and disciplines in areas such as food science, sales and marketing, engineering and support services. At 31 March 2010, Tate & Lyle employed 5,666 people across the Group. The average number of employees in the Group during the year is given in Note 9 on page 74.
The following charts show the split of employees by the four existing business divisions, and by geography.
EqualopportunitiesWe believe in equal opportunities regardless of gender, sexual orientation, age, marital status, disability, race, religion or other beliefs and ethnic or national origin. Our policies, practices and regulations for recruitment, training and career development promote equality of opportunity while being appropriate for the relevant market sector and country of operation. Our aim is to encourage a culture in which all employees have the opportunity to develop fully according to their individual abilities and the needs of the Group. The Group remains committed to the fair treatment of people with disabilities regarding applications, training, promotion and career development. An employee who becomes disabled would, where appropriate, be offered retraining.
TraininganddevelopmentOur employees are vital to the success of our business. It is a key objective for the Group to attract and retain top-quality talent, and to ensure that our employees develop and grow in their roles and meet new challenges as their careers progress.
We run a series of international programmes to develop management skills and share management ideas across the Group, as well as for graduate trainees. As part of the changes announced following the review of the Group, we will be considering how our training and development programmes most effectively support a performance-driven culture.
RemunerationWe review our remuneration policies regularly in light of market trends, the needs of the business and the prevailing economic environment. Our policies are designed to attract, retain and reward employees with the ability and experience needed to execute the Group’s strategy. This year, in light of the strategic changes to the business explained in the Chief Executive’s review, the Remuneration Committee has set out a new policy and strategy for executive remuneration to focus more closely on performance, and this is explained in the Directors’ remuneration report. We will be looking at similar principles in reviewing remuneration policy throughout the Company in due course.
CommunicationsGood communication is essential if employees are to understand and embrace the Company’s goals and objectives. To be effective, communication must be two-way, and Tate & Lyle actively encourages employee involvement and feedback. One of our principal channels is the Group-wide quarterly magazine, which includes Company information and news as well as covering contributions from employees. Other channels for consulting and informing employees include e-mail, the intranet, briefings and management roadshows.
HealthandwellbeingWe aim to lead the way in employee health. Programmes differ across the Group according to local needs, but all are based on the principle that the Company has a role to play in helping employees improve their health by providing information, advice and other support on health and wellbeing. Our long-term goal is to raise the standards of employee health and wellbeing throughout Tate & Lyle, through sharing best practice and ideas across the Company and with healthcare partners.
UKTate & Lyle’s nurse-led occupational health programme emphasises education and prevention and has often been referred to as a model for other businesses and public sector organisations in the UK. Key initiatives include educating employees in health and wellbeing, and providing vocational rehabilitation as an alternative to sickness absence certificates, as well as health promotion activities, an occupational health clinic, advice on healthy eating, and counselling services.
Tate & Lyle has long understood the benefits of trying to help employees return to work as soon as is practical after an illness or accident. Early return to work in a well managed workplace through
Business review What we do
Employees by divisionAs at 31 March 2010
Employees by geographyAs at 31 March 2010
Food & Industrial Ingredients, Americas44%
Food & IndustrialIngredients, Europe
26%
Sugars26%
Sucralose4%
Europe, Middle East & Africa43%
North America34%
LatinAmerica
12%
Asia Paci�c11%
Tate & Lyle Annual Report 2010 15
vocational rehabilitation can have benefits for both the employee and the employer. After the end of the financial year, in April 2010, the Government introduced the new ‘Fit Note’, a new medical statement from doctors that allows them to advise patients how they might be able to work with the right support, rather than simply saying they should or should not work. This is in line with Tate & Lyle’s vocational rehabilitation policy which was introduced in 2000. The adoption of this practice has proved extremely effective in reducing sickness/ absence and expediting employee recovery from illness and injury.
We also share elements of our programme with partners. For example, we have helped two community partners with absence management training and advice, and we host regular visits from groups of trainee GPs and doctors from Occupational Health Diploma courses to help their understanding of occupational health in a factory environment. We also offer work experience for trainee occupational health nurses from South Bank and Brunel Universities.
EuropeMany of our mainland Europe plants offer similar health programmes to the UK. These include: Company-sponsored fitness programmes; health and wellbeing awareness campaigns; healthy menu options in employee restaurants; and annual health and fitness check-ups.
USATate & Lyle continues to provide programmes and tools to help employees become better informed consumers of their own healthcare services, as well as encouraging them to adopt healthy lifestyles. Some examples of our programmes include:
n ‘Blue Points’ system: we offer this web-based system to all employees via our healthcare provider. It provides a platform for employees to initiate and track healthy behaviours. Employees earn points for meeting certain health targets, which can be redeemed online for health-related items.
n Health risk self-assessment: we encourage employees to complete this online self-assessment, which is then reviewed by medical experts from our healthcare provider. These experts then give feedback and recommendations to employees.
n Health and fitness: many plants offer exercise facilities or Company-sponsored fitness programmes.
n Stopping smoking/weight management: employees enrolled in the Blue Cross Blue Shield health plan have access to various programmes either to help stop smoking or to manage their weight; this includes discounts with various weight management firms.
n Communications: we are developing a campaign to educate employees better about the wellness programmes and services available to them.
VolunteeringMany employees across Tate & Lyle contribute their own time and money to charitable enterprises and local concerns. We support them with donations: every year we match funds raised for charity by our employees, and give donations to local community projects our employees are involved in. We also encourage employees to take part by promoting volunteering across Tate & Lyle and celebrating the work they do. Further information on how we support our local communities is on pages 36 and 37.
External environmentCompetitionThe bulk starch market, within which our food and industrial ingredients businesses compete, is concentrated around a relatively small number of large participants who operate in many different application areas, including food, beverage, paper and pharmaceuticals. The USA accounts for over half of global starch production. Our main competitors in the USA for corn wet milling and starch-based products are Archer Daniels Midland Company (ADM), Corn Products International and Cargill. National Starch (part of Akzo Nobel N.V.) is also a competitor, particularly in relation to some higher-value modified food and industrial starches. Penford Corporation is a competitor in the North American paper starch industry.
In Europe our main competitors are Cargill, Syral (part of Tereos), Roquette Frères, Danisco, Kerry and National Starch.
Competition for our European sugar business comes mainly from British Sugar (a subsidiary of Associated British Foods plc), Südzucker, Nordzucker and Tereos.
GovernmentalregulationSome of the markets in which Tate & Lyle operates are subject to significant influence from legislation or regulation. In Europe, the EU Sugar Regime is most relevant to Tate & Lyle and affects our European sugar and corn processing operations.
In the USA, the main regulation is the Renewable Fuel Standard programme, which requires that gasoline sold contains a minimum volume of fuel from renewable sources, and affects our corn processing operations in the USA, including corn-based ethanol.
“We give people opportunities and challenges to stretch
themselves and make the most of their potential. ”
Sha
reho
lder
info
rmat
ion
Ove
rvie
wB
usin
ess
revi
ewG
over
nanc
eF
inan
cial
sta
tem
ents
16 Tate & Lyle Annual Report 2010
Key risks
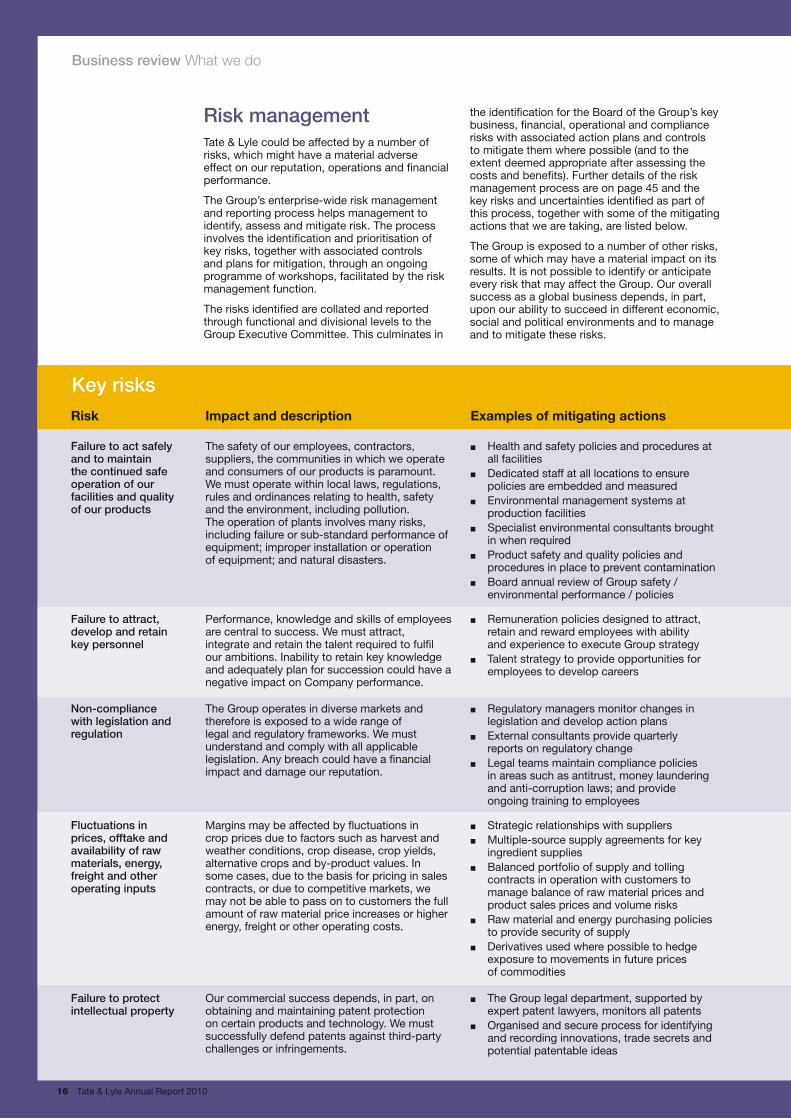
Risk managementTate & Lyle could be affected by a number of risks, which might have a material adverse effect on our reputation, operations and financial performance.
The Group’s enterprise-wide risk management and reporting process helps management to identify, assess and mitigate risk. The process involves the identification and prioritisation of key risks, together with associated controls and plans for mitigation, through an ongoing programme of workshops, facilitated by the risk management function.
The risks identified are collated and reported through functional and divisional levels to the Group Executive Committee. This culminates in
the identification for the Board of the Group’s key business, financial, operational and compliance risks with associated action plans and controls to mitigate them where possible (and to the extent deemed appropriate after assessing the costs and benefits). Further details of the risk management process are on page 45 and the key risks and uncertainties identified as part of this process, together with some of the mitigating actions that we are taking, are listed below.
The Group is exposed to a number of other risks, some of which may have a material impact on its results. It is not possible to identify or anticipate every risk that may affect the Group. Our overall success as a global business depends, in part, upon our ability to succeed in different economic, social and political environments and to manage and to mitigate these risks.
Risk Impactanddescription Examplesofmitigatingactions
Failure to act safely and to maintain the continued safe operation of our facilities and quality of our products
The safety of our employees, contractors, suppliers, the communities in which we operate and consumers of our products is paramount. We must operate within local laws, regulations, rules and ordinances relating to health, safety and the environment, including pollution. The operation of plants involves many risks, including failure or sub-standard performance of equipment; improper installation or operation of equipment; and natural disasters.
n Health and safety policies and procedures at all facilities
n Dedicated staff at all locations to ensure policies are embedded and measured
n Environmental management systems at production facilities
n Specialist environmental consultants brought in when required
n Product safety and quality policies and procedures in place to prevent contamination
n Board annual review of Group safety / environmental performance / policies
Failure to attract, develop and retain key personnel
Performance, knowledge and skills of employees are central to success. We must attract, integrate and retain the talent required to fulfil our ambitions. Inability to retain key knowledge and adequately plan for succession could have a negative impact on Company performance.
n Remuneration policies designed to attract, retain and reward employees with ability and experience to execute Group strategy
n Talent strategy to provide opportunities for employees to develop careers
Non-compliance with legislation and regulation
The Group operates in diverse markets and therefore is exposed to a wide range of legal and regulatory frameworks. We must understand and comply with all applicable legislation. Any breach could have a financial impact and damage our reputation.
n Regulatory managers monitor changes in legislation and develop action plans
n External consultants provide quarterly reports on regulatory change
n Legal teams maintain compliance policies in areas such as antitrust, money laundering and anti-corruption laws; and provide ongoing training to employees
Fluctuations in prices, offtake and availability of raw materials, energy, freight and other operating inputs
Margins may be affected by fluctuations in crop prices due to factors such as harvest and weather conditions, crop disease, crop yields, alternative crops and by-product values. In some cases, due to the basis for pricing in sales contracts, or due to competitive markets, we may not be able to pass on to customers the full amount of raw material price increases or higher energy, freight or other operating costs.
n Strategic relationships with suppliersn Multiple-source supply agreements for key
ingredient suppliesn Balanced portfolio of supply and tolling
contracts in operation with customers to manage balance of raw material prices and product sales prices and volume risks
n Raw material and energy purchasing policies to provide security of supply
n Derivatives used where possible to hedge exposure to movements in future prices of commodities
Failure to protect intellectual property
Our commercial success depends, in part, on obtaining and maintaining patent protection on certain products and technology. We must successfully defend patents against third-party challenges or infringements.
n The Group legal department, supported by expert patent lawyers, monitors all patents
n Organised and secure process for identifying and recording innovations, trade secrets and potential patentable ideas
Business review What we do
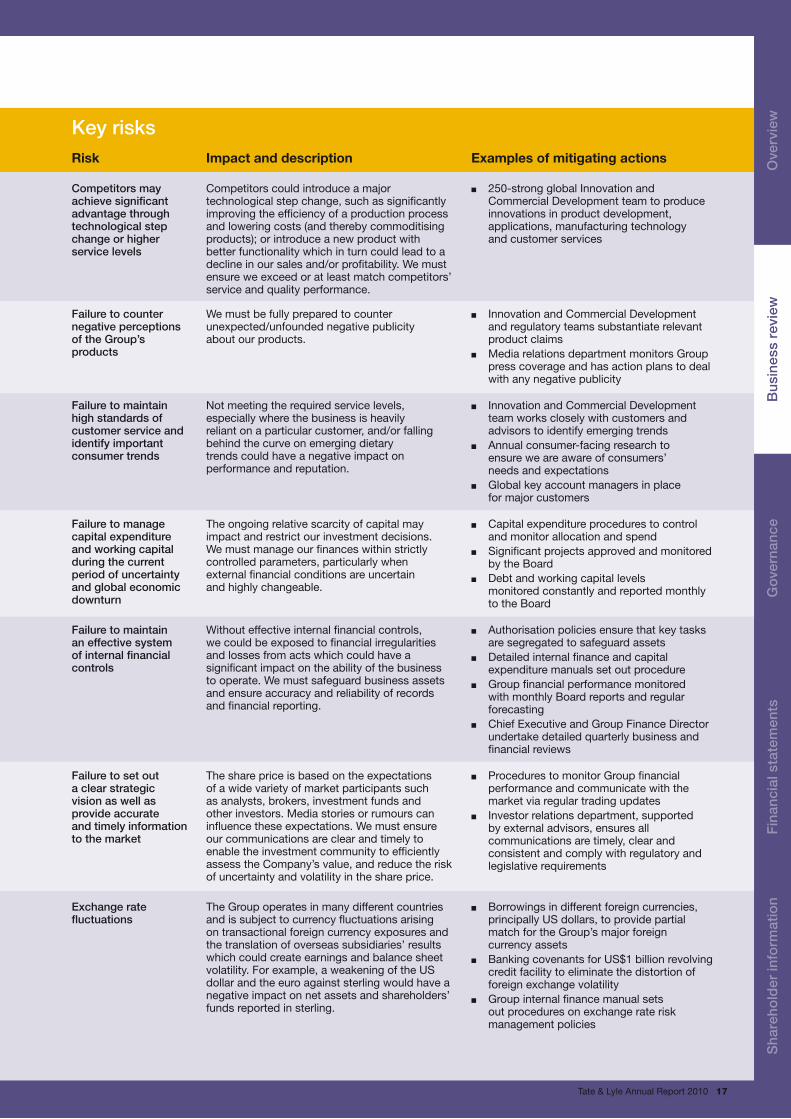
Tate & Lyle Annual Report 2010 17
Risk Impactanddescription Examplesofmitigatingactions
Competitors may achieve significant advantage through technological step change or higher service levels
Competitors could introduce a major technological step change, such as significantly improving the efficiency of a production process and lowering costs (and thereby commoditising products); or introduce a new product with better functionality which in turn could lead to a decline in our sales and/or profitability. We must ensure we exceed or at least match competitors’ service and quality performance.
n 250-strong global Innovation and Commercial Development team to produce innovations in product development, applications, manufacturing technology and customer services
Failure to counter negative perceptions of the Group’s products
We must be fully prepared to counter unexpected/unfounded negative publicity about our products.
n Innovation and Commercial Development and regulatory teams substantiate relevant product claims
n Media relations department monitors Group press coverage and has action plans to deal with any negative publicity
Failure to maintain high standards of customer service and identify important consumer trends
Not meeting the required service levels, especially where the business is heavily reliant on a particular customer, and/or falling behind the curve on emerging dietary trends could have a negative impact on performance and reputation.
n Innovation and Commercial Development team works closely with customers and advisors to identify emerging trends
n Annual consumer-facing research to ensure we are aware of consumers’ needs and expectations
n Global key account managers in place for major customers
Failure to manage capital expenditure and working capital during the current period of uncertainty and global economic downturn
The ongoing relative scarcity of capital may impact and restrict our investment decisions. We must manage our finances within strictly controlled parameters, particularly when external financial conditions are uncertain and highly changeable.
n Capital expenditure procedures to control and monitor allocation and spend
n Significant projects approved and monitored by the Board
n Debt and working capital levels monitored constantly and reported monthly to the Board
Failure to maintain an effective system of internal financial controls
Without effective internal financial controls, we could be exposed to financial irregularities and losses from acts which could have a significant impact on the ability of the business to operate. We must safeguard business assets and ensure accuracy and reliability of records and financial reporting.
n Authorisation policies ensure that key tasks are segregated to safeguard assets
n Detailed internal finance and capital expenditure manuals set out procedure
n Group financial performance monitored with monthly Board reports and regular forecasting
n Chief Executive and Group Finance Director undertake detailed quarterly business and financial reviews
Failure to set out a clear strategic vision as well as provide accurate and timely information to the market
The share price is based on the expectations of a wide variety of market participants such as analysts, brokers, investment funds and other investors. Media stories or rumours can influence these expectations. We must ensure our communications are clear and timely to enable the investment community to efficiently assess the Company’s value, and reduce the risk of uncertainty and volatility in the share price.
n Procedures to monitor Group financial performance and communicate with the market via regular trading updates
n Investor relations department, supported by external advisors, ensures all communications are timely, clear and consistent and comply with regulatory and legislative requirements
Exchange rate fluctuations
The Group operates in many different countries and is subject to currency fluctuations arising on transactional foreign currency exposures and the translation of overseas subsidiaries’ results which could create earnings and balance sheet volatility. For example, a weakening of the US dollar and the euro against sterling would have a negative impact on net assets and shareholders’ funds reported in sterling.
n Borrowings in different foreign currencies, principally US dollars, to provide partial match for the Group’s major foreign currency assets
n Banking covenants for US$1 billion revolving credit facility to eliminate the distortion of foreign exchange volatility
n Group internal finance manual sets out procedures on exchange rate risk management policies
Key risks
Sha
reho
lder
info
rmat
ion
Ove
rvie
wB
usin
ess
revi
ewG
over
nanc
eF
inan
cial
sta
tem
ents
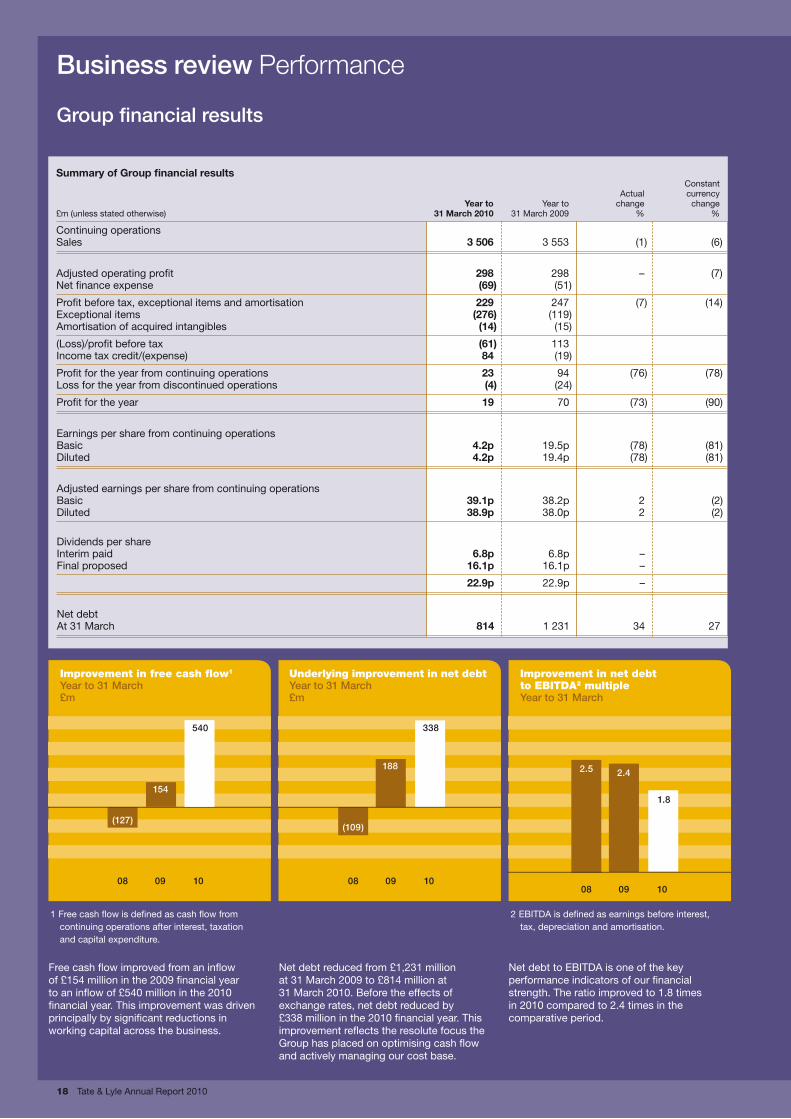
18 Tate & Lyle Annual Report 2010
Summary of Group financial results Constant Actual currency Year to Year to change change£m (unless stated otherwise) 31 March 2010 31 March 2009 % %
Continuing operations Sales 3 506 3 553 (1) (6)
Adjusted operating profit 298 298 – (7)Net finance expense (69) (51)
Profit before tax, exceptional items and amortisation 229 247 (7) (14)Exceptional items (276) (119) Amortisation of acquired intangibles (14) (15)
(Loss)/profit before tax (61) 113 Income tax credit/(expense) 84 (19)
Profit for the year from continuing operations 23 94 (76) (78)Loss for the year from discontinued operations (4) (24)
Profit for the year 19 70 (73) (90)
Earnings per share from continuing operations Basic 4.2p 19.5p (78) (81)Diluted 4.2p 19.4p (78) (81)
Adjusted earnings per share from continuing operations Basic 39.1p 38.2p 2 (2)Diluted 38.9p 38.0p 2 (2)
Dividends per share Interim paid 6.8p 6.8p – Final proposed 16.1p 16.1p –
22.9p 22.9p –
Net debt At 31 March 814 1 231 34 27
Group financial results
(127)
08 09 10
540
(109)
08 09 10
338
2.5
08 09 10
1.8
154
188
2.4
Improvement in free cash flow1
Year to 31 March£m
(127)
08 09 10
540
(109)
08 09 10
338
2.5
08 09 10
1.8
154
188
2.4
Underlying improvement in net debt Year to 31 March£m
(127)
08 09 10
540
(109)
08 09 10
338
2.5
08 09 10
1.8
154
188
2.4
Improvement in net debt to EBITDA2 multipleYear to 31 March
1 Free cash flow is defined as cash flow from continuing operations after interest, taxation and capital expenditure.
2 EBITDA is defined as earnings before interest, tax, depreciation and amortisation.
Business review Performance
Free cash flow improved from an inflow of £154 million in the 2009 financial year to an inflow of £540 million in the 2010 financial year. This improvement was driven principally by significant reductions in working capital across the business.
Net debt reduced from £1,231 million at 31 March 2009 to £814 million at 31 March 2010. Before the effects of exchange rates, net debt reduced by £338 million in the 2010 financial year. This improvement reflects the resolute focus the Group has placed on optimising cash flow and actively managing our cost base.
Net debt to EBITDA is one of the key performance indicators of our financial strength. The ratio improved to 1.8 times in 2010 compared to 2.4 times in the comparative period.
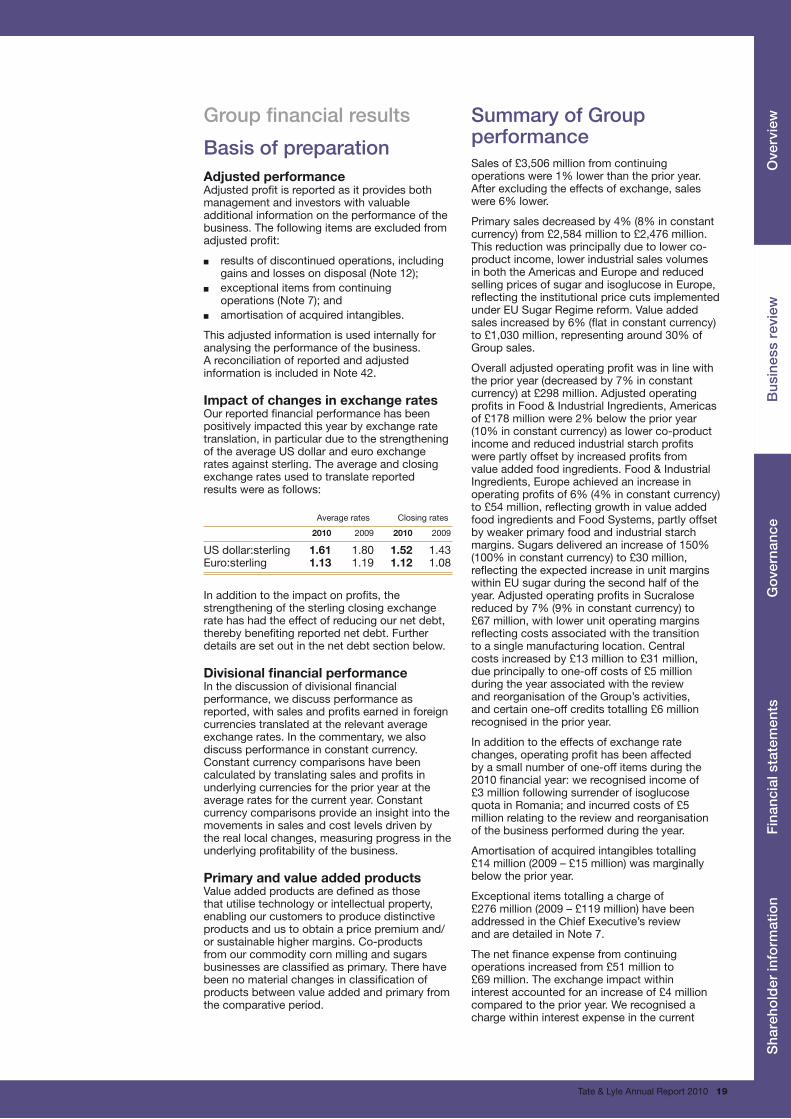
Tate & Lyle Annual Report 2010 19
Group financial results
Basis of preparationAdjusted performanceAdjusted profit is reported as it provides both management and investors with valuable additional information on the performance of the business. The following items are excluded from adjusted profit:
n results of discontinued operations, including gains and losses on disposal (Note 12);
n exceptional items from continuing operations (Note 7); and
n amortisation of acquired intangibles.
This adjusted information is used internally for analysing the performance of the business. A reconciliation of reported and adjusted information is included in Note 42.
Impact of changes in exchange ratesOur reported financial performance has been positively impacted this year by exchange rate translation, in particular due to the strengthening of the average US dollar and euro exchange rates against sterling. The average and closing exchange rates used to translate reported results were as follows:
Average rates Closing rates
2010 2009 2010 2009
US dollar:sterling 1.61 1.80 1.52 1.43Euro:sterling 1.13 1.19 1.12 1.08
In addition to the impact on profits, the strengthening of the sterling closing exchange rate has had the effect of reducing our net debt, thereby benefiting reported net debt. Further details are set out in the net debt section below.
Divisional financial performanceIn the discussion of divisional financial performance, we discuss performance as reported, with sales and profits earned in foreign currencies translated at the relevant average exchange rates. In the commentary, we also discuss performance in constant currency. Constant currency comparisons have been calculated by translating sales and profits in underlying currencies for the prior year at the average rates for the current year. Constant currency comparisons provide an insight into the movements in sales and cost levels driven by the real local changes, measuring progress in the underlying profitability of the business.
Primary and value added productsValue added products are defined as those that utilise technology or intellectual property, enabling our customers to produce distinctive products and us to obtain a price premium and/or sustainable higher margins. Co-products from our commodity corn milling and sugars businesses are classified as primary. There have been no material changes in classification of products between value added and primary from the comparative period.
Summary of Group performanceSales of £3,506 million from continuing operations were 1% lower than the prior year. After excluding the effects of exchange, sales were 6% lower.
Primary sales decreased by 4% (8% in constant currency) from £2,584 million to £2,476 million. This reduction was principally due to lower co-product income, lower industrial sales volumes in both the Americas and Europe and reduced selling prices of sugar and isoglucose in Europe, reflecting the institutional price cuts implemented under EU Sugar Regime reform. Value added sales increased by 6% (flat in constant currency) to £1,030 million, representing around 30% of Group sales.
Overall adjusted operating profit was in line with the prior year (decreased by 7% in constant currency) at £298 million. Adjusted operating profits in Food & Industrial Ingredients, Americas of £178 million were 2% below the prior year (10% in constant currency) as lower co-product income and reduced industrial starch profits were partly offset by increased profits from value added food ingredients. Food & Industrial Ingredients, Europe achieved an increase in operating profits of 6% (4% in constant currency) to £54 million, reflecting growth in value added food ingredients and Food Systems, partly offset by weaker primary food and industrial starch margins. Sugars delivered an increase of 150% (100% in constant currency) to £30 million, reflecting the expected increase in unit margins within EU sugar during the second half of the year. Adjusted operating profits in Sucralose reduced by 7% (9% in constant currency) to £67 million, with lower unit operating margins reflecting costs associated with the transition to a single manufacturing location. Central costs increased by £13 million to £31 million, due principally to one-off costs of £5 million during the year associated with the review and reorganisation of the Group’s activities, and certain one-off credits totalling £6 million recognised in the prior year.
In addition to the effects of exchange rate changes, operating profit has been affected by a small number of one-off items during the 2010 financial year: we recognised income of £3 million following surrender of isoglucose quota in Romania; and incurred costs of £5 million relating to the review and reorganisation of the business performed during the year.
Amortisation of acquired intangibles totalling £14 million (2009 – £15 million) was marginally below the prior year.
Exceptional items totalling a charge of £276 million (2009 – £119 million) have been addressed in the Chief Executive’s review and are detailed in Note 7.
The net finance expense from continuing operations increased from £51 million to £69 million. The exchange impact within interest accounted for an increase of £4 million compared to the prior year. We recognised a charge within interest expense in the current
Sha
reho
lder
info
rmat
ion
Ove
rvie
wB
usin
ess
revi
ewG
over
nanc
eF
inan
cial
sta
tem
ents
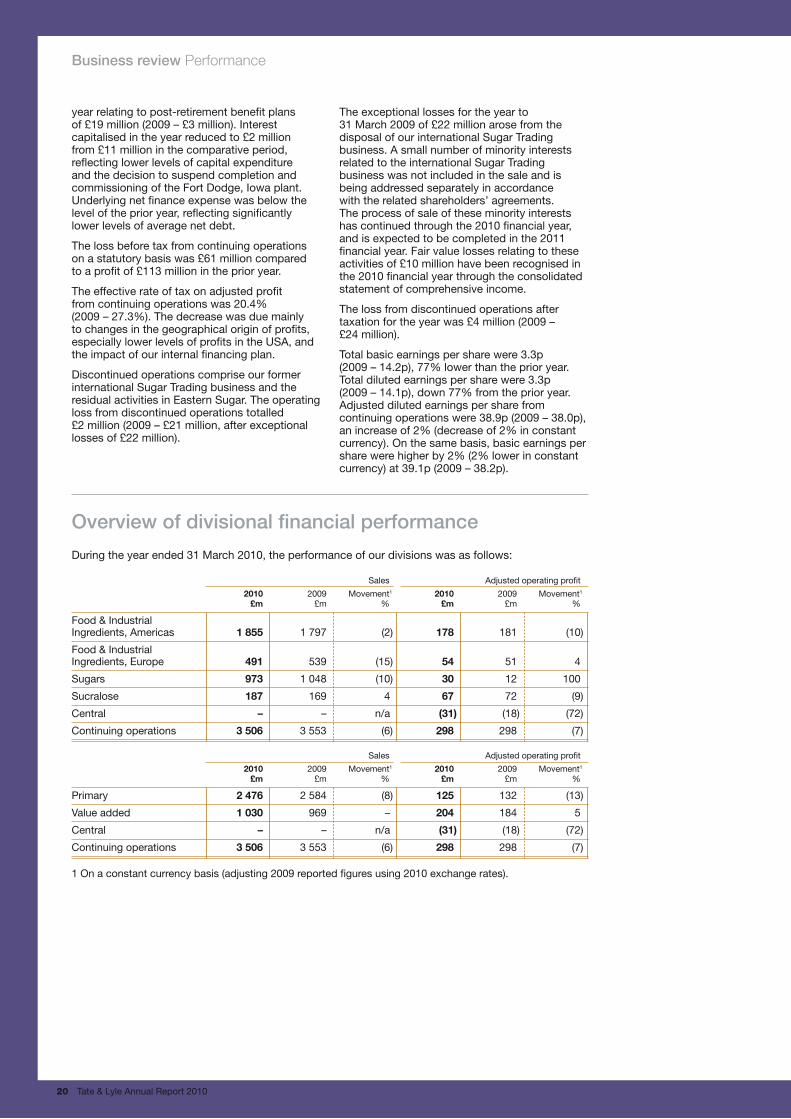
Business review Performance
20 Tate & Lyle Annual Report 2010
year relating to post-retirement benefit plans of £19 million (2009 – £3 million). Interest capitalised in the year reduced to £2 million from £11 million in the comparative period, reflecting lower levels of capital expenditure and the decision to suspend completion and commissioning of the Fort Dodge, Iowa plant. Underlying net finance expense was below the level of the prior year, reflecting significantly lower levels of average net debt.
The loss before tax from continuing operations on a statutory basis was £61 million compared to a profit of £113 million in the prior year.
The effective rate of tax on adjusted profit from continuing operations was 20.4% (2009 – 27.3%). The decrease was due mainly to changes in the geographical origin of profits, especially lower levels of profits in the USA, and the impact of our internal financing plan.
Discontinued operations comprise our former international Sugar Trading business and the residual activities in Eastern Sugar. The operating loss from discontinued operations totalled £2 million (2009 – £21 million, after exceptional losses of £22 million).
The exceptional losses for the year to 31 March 2009 of £22 million arose from the disposal of our international Sugar Trading business. A small number of minority interests related to the international Sugar Trading business was not included in the sale and is being addressed separately in accordance with the related shareholders’ agreements. The process of sale of these minority interests has continued through the 2010 financial year, and is expected to be completed in the 2011 financial year. Fair value losses relating to these activities of £10 million have been recognised in the 2010 financial year through the consolidated statement of comprehensive income.
The loss from discontinued operations after taxation for the year was £4 million (2009 – £24 million).
Total basic earnings per share were 3.3p (2009 – 14.2p), 77% lower than the prior year. Total diluted earnings per share were 3.3p (2009 – 14.1p), down 77% from the prior year. Adjusted diluted earnings per share from continuing operations were 38.9p (2009 – 38.0p), an increase of 2% (decrease of 2% in constant currency). On the same basis, basic earnings per share were higher by 2% (2% lower in constant currency) at 39.1p (2009 – 38.2p).
Overview of divisional financial performance
During the year ended 31 March 2010, the performance of our divisions was as follows:
Sales Adjusted operating profit
2010 2009 Movement1 2010 2009 Movement1
£m £m % £m £m %
Food & Industrial Ingredients, Americas 1 855 1 797 (2) 178 181 (10)
Food & Industrial Ingredients, Europe 491 539 (15) 54 51 4
Sugars 973 1 048 (10) 30 12 100
Sucralose 187 169 4 67 72 (9)
Central – – n/a (31) (18) (72)
Continuing operations 3 506 3 553 (6) 298 298 (7)
Sales Adjusted operating profit
2010 2009 Movement1 2010 2009 Movement1
£m £m % £m £m %
Primary 2 476 2 584 (8) 125 132 (13)
Value added 1 030 969 – 204 184 5
Central – – n/a (31) (18) (72)
Continuing operations 3 506 3 553 (6) 298 298 (7)
1 On a constant currency basis (adjusting 2009 reported figures using 2010 exchange rates).

Tate & Lyle Annual Report 2010 21
Market conditions
PrimaryUS domestic demand for nutritive sweeteners in the 2010 financial year continued its gradual long-term downward trend although, during the second half of the 2010 financial year, exports of corn sweeteners to Mexico increased, offsetting this impact. Higher Mexican demand was driven by high sugar prices in the Mexican market, and a relative strengthening of the Mexican peso, which increased the competitiveness of US corn sweeteners.
US ethanol production increased to around 10.8 billion gallons in the 2009 calendar year from 9.3 billion gallons in the prior year. The industry continued to commission capacity in order to meet the increased demand for corn-based ethanol mandated under the Renewable Fuel Standard. Oil prices rose steadily throughout the 2010 financial year, to close at around US$80 per barrel at 31 March 2010, and US gasoline prices remained at a premium to ethanol selling prices from the middle of the 2009 calendar year. However, with ample supply of corn-based ethanol in US markets, there was, at most, a modest cash margin in spot ethanol markets during the 2010 financial year. Lower levels of profitability in ethanol have also placed pressure on pricing and unit margins of native starch products, since the industry has some ability to swing capacity between product lines in response to changes in relative returns.
Demand for industrial starches, primarily used in paper and packaging production, recovered modestly from the levels experienced during the second half of the 2009 financial year, and showed sequential quarterly growth in the final quarter of the 2010 financial year, although still significantly below the levels experienced before the economic downturn. The markets for industrial starches remain challenging due both to lower levels of demand and margin pressure from US wet mill ethanol capacity.
Record corn yields and a large corn crop in the 2009 calendar year produced a more stable corn price environment in the 2010 financial year compared with the prior year. Lower corn quality, from the late 2009 harvest following wet conditions during autumn 2009 in much of the
US corn belt, caused some production issues for all corn processors. US corn acreage is expected to increase in 2010, and corn prices are expected to remain at levels experienced in recent months.
The market for corn gluten feed continued to be challenging, due both to pressure on US livestock numbers which affected demand, and the competitive impact of higher dry mill ethanol production, which drove the continuing increase in supply of distillers’ dry grains, a substitute ingredient in animal feed applications. Access to EU markets for corn co-products manufactured from EU-approved GM varieties has reopened, although export activity remained limited due to a lack of US competitiveness.
Value addedOverall, the market for value added food ingredients remained steady throughout the 2010 financial year, although consumer focus on the trends of health and wellness and convenience has continued to drive growth in these areas.
Demand patterns for value added industrial starches remained at levels below those experienced before the economic downturn, consistent with the trend experienced in the primary industrial starch markets.
Financial performanceSales of £1,855 million were 3% above the prior year (2% lower in constant currency). The decrease in constant currency was driven principally by the impact of lower co-product values. Adjusted operating profit of £178 million was 2% below the prior year (10% in constant currency). The effect of exchange translation was to increase operating profit by £17 million.
PrimarySales increased by 3% to £1,309 million (decreased by 2% in constant currency). Operating profits decreased by £21 million to £77 million, a reduction of 21% (29% in constant currency). Co-product income was significantly below the comparative period, which benefited from strong prices during the commodity price peak of summer 2008. Corn prices in the USA saw an unprecedented spike in the 2008 calendar year, reaching almost US$8 per bushel
Food & Industrial Ingredients, Americas
Year to 31 March 2010 Year to 31 March 2009
Value Value Primary added Total Primary added Total £m £m £m £m £m £m
Sales Food 982 382 1 364 878 369 1 247Industrial 327 164 491 393 157 550
1 309 546 1 855 1 271 526 1 797
Adjusted operating profit/(loss) Food 85 98 183 95 83 178Industrial (8) 3 (5) 3 – 3
77 101 178 98 83 181
Margin Food 8.7% 25.7% 13.4% 10.8% 22.5% 14.3% Industrial (2.4)% 1.8% (1.0)% 0.8% – 0.5% Total 5.9% 18.5% 9.6% 7.7% 15.8% 10.1%
Sha
reho
lder
info
rmat
ion
Ove
rvie
wB
usin
ess
revi
ewG
over
nanc
eF
inan
cial
sta
tem
ents
Business review Performance
22 Tate & Lyle Annual Report 2010
in July 2008. Corn co-product prices also peaked during the third quarter of the 2008 calendar year. However, the subsequent fall in corn and soy prices resulted in corresponding price declines for corn gluten feed, corn gluten meal, and corn oil. Crude oil prices peaked at almost US$150 per barrel in July 2008, but fell rapidly to below US$40 per barrel during the second half of the 2008 calendar year. Corn gluten feed selling prices were weak during the 2010 financial year due both to lower demand, following reductions in US beef and dairy herds, and an increased supply of the co-product from dry mill ethanol production.
Primary food sales of £982 million were 12% higher than the prior year (7% in constant currency). Operating profits of £85 million were 11% below the prior year (18% in constant currency). The reduction in operating profit was due to lower co-product income from the sale of corn oil. Excluding the impact of co-products, operating profits in primary food were marginally above the prior year. Total sales volumes within primary food were marginally above the prior year, as increased sweetener demand from Mexico in the second half of the 2010 financial year contrasted with a modest destocking effect experienced across all major product lines in the second half of the prior year.
Operating profits from primary sweeteners in the second half of the 2010 financial year were below the comparative period, reflecting margins in the final quarter somewhat below the prior year.
Profits at Almex, our Mexican cereal sweeteners and starches joint venture, were marginally below the prior year due to a modest reduction in unit margins. Our citric acid business performed well, with solid improvement in operating profit over the prior year reflecting strong global demand.
Primary industrial sales (comprising ethanol, native industrial starches and animal feed co-products) of £327 million were 17% below the prior year (21% in constant currency). Operating losses of £8 million in the 2010 financial year compared with operating profits of £3 million in the prior year. The reduction in operating profits was due principally to lower industrial starch profits and lower animal feed co-product income.
Industrial starch profits in the 2010 financial year were lower than the prior year due to lower levels of underlying demand (which reduced markedly from the third quarter of the 2009 financial year) and to additional demand in the comparative period following the floods in Iowa during 2008 which affected production at competitor plants. Demand remains relatively weak in the US domestic paper and packaging markets, and the relative strength of the US dollar has adversely impacted the overseas competitiveness of our major customers. Industrial starch prices and margins have also come under pressure from lower ethanol returns, as the industry has some ability to swing capacity between these product lines.
Ethanol losses were broadly in line with the comparative period. Although US ethanol markets improved slightly in the second half of the 2010 financial year, with a modest cash margin returning to spot markets, ethanol activities in the second half of the 2010 financial year still generated an operating loss.
Following a detailed analysis of end markets, in light of costs of around £70 million to complete and commission our plant in Fort Dodge, and factoring in the risks associated with future returns from completing and operating the plant, we have concluded that the plant is highly unlikely to be completed or commissioned in the foreseeable future. As a result, the facility has been mothballed and written down to £17 million, leading to an impairment of £217 million which has been recognised as an exceptional charge in the 2010 financial year. A further exceptional charge of approximately £25 million will be recognised during the 2011 financial year in respect of long-term contracts relating to the facility.
Value addedValue added ingredients sales increased by 4% to £546 million (decreased by 3% in constant currency). Operating profits increased by 22% (12% in constant currency) to £101 million.
Operating profits from value added food increased by 18% (9% in constant currency) to £98 million reflecting firmer pricing and steady demand patterns. We have continued to experience good growth in sales volumes of our wellness ingredients. PROMITOR™ Soluble Corn Fiber performed strongly, with several major customers launching new products containing this ingredient during the year in order to meet increased consumer demand.
Operating profits from value added industrial ingredients were £3 million, compared with break even in the prior year. Operating profits from value added industrial starches were broadly in line with the prior year: while demand patterns have stabilised at levels somewhat below those experienced immediately following the economic downturn, unit margins continue to be under pressure. The Bio-PDO™ joint venture broke even in the 2010 financial year, having made a small loss in the prior year.
Looking forwardDemand for value added food ingredients has proved steady, and we expect this trend to continue. Within our primary food markets, we expect domestic demand for corn sweeteners to continue its long-term trend of gradual decline, although Mexico currently represents an attractive market for US sweeteners.
Whilst we have seen a degree of improvement in demand for industrial starches from the levels experienced during the second half of the 2009 financial year, with lower capacity utilisation levels in key US end markets and reduced export markets, we remain cautious about the timing and extent of further improvement in demand.
Visibility over the timing of any improvement in ethanol markets remains limited.
Corn costs have weakened since the start of the calendar year with the expectation of a large US corn crop in calendar year 2010. The level of net corn costs will, as usual, be a key factor in determining performance in the coming financial year.

Tate & Lyle Annual Report 2010 23
Market conditions
PrimaryVolumes of isoglucose produced within the EU are regulated via quota as part of the EU Sugar Regime. The selling price of isoglucose is linked to the price of sugar but, unlike sugar, the raw material input price is not regulated. During the four-year process of reform, isoglucose producers paid a restructuring levy, but also had their quotas increased by 60%. The payment of these levies ceased on 30 September 2009. Through our Eaststarch joint-venture, and its 50% share in the Hungrana joint-venture facility, the Group has an economic interest in approximately 55% of the EU’s isoglucose quotas.
European demand for corn-based sweeteners for use in fermentation (which is not subject to quota control) continued to be adversely impacted by competition from out-of-quota sugar stocks, which act as a substitute for this purpose. Market demand for other primary food ingredients in the 2010 financial year was relatively steady at levels marginally below those experienced before the economic downturn.
Industrial starch markets in Europe have remained challenging. With demand still materially below the levels experienced before the economic downturn and greater competition from other carbohydrate sources, notably wheat and potato starches, pricing in this market has been under considerable pressure.
The good European corn crop of 2008 was followed by another in 2009, and net corn costs have remained at similar, lower levels throughout the 2010 financial year.
Value addedDemand for value added food ingredients has remained steady. Consumer focus on health and wellness continues to drive market growth in this area.
Financial performanceSales decreased by 9% to £491 million (15% in constant currency). Adjusted operating profit increased by 6% to £54 million (4% in constant currency). EU restructuring aid totalling £3 million (2009 – £11 million) was recognised during the year, following the surrender of isoglucose
quota in Romania. Excluding restructuring aid in both years, operating profit increased by 24% in constant currency. The effect of exchange translation was to increase profit by £1 million.
The Single Ingredients business achieved a result marginally below the prior year. Lower levels of capacity utilisation impacted unit margins, particularly in the second half of the year. The Food Systems business reported a result slightly ahead of the prior year, reflecting robust demand patterns and continuing benefit from the integration of this business.
PrimarySales of primary products decreased by 20% to £266 million (25% in constant currency). Operating profit reduced from £27 million to £21 million, a decrease of 22% (22% in constant currency).
Within primary food ingredients, liquid sweetener volumes were broadly in line with the prior year. Sweetener volumes reduced following closure of the Greek plant, but the business continued to benefit from its increased EU isoglucose quota and, during the year, completed the expansion of isoglucose capacity at our joint-venture plant in Slovakia. However, against the backdrop of lower levels of demand we have seen following the economic downturn, unit margins in non-quota primary food were below the level of the prior year, reflecting a more competitive marketplace, particularly during the second half of the 2010 financial year.
During the first half of the 2010 financial year, the division recognised a charge of £4 million representing the final levies payable into the EU restructuring fund. During the second half of the 2010 financial year, restructuring aid of £3 million was recognised following our decision to surrender our Romanian isoglucose quota. During the second half of the prior year, restructuring aid of £11 million was recognised following the surrender of the small isoglucose quotas in the Netherlands and Greece.
Primary industrial ingredients generated an operating loss of £3 million in the year, compared to a result of breakeven in the prior year. Sales volumes were below the prior year, and unit margins came under pressure in an increasingly competitive marketplace.
Food & Industrial Ingredients, Europe
Year to 31 March 2010 Year to 31 March 2009
Value Value Primary added Total Primary added Total £m £m £m £m £m £m
Sales Food 133 225 358 170 206 376Industrial 133 – 133 163 – 163
266 225 491 333 206 539
Adjusted operating profit/(loss) Food 24 33 57 27 24 51Industrial (3) – (3) – – –
21 33 54 27 24 51
Margin Food 18.0% 14.7% 15.9% 15.9% 11.7% 13.6%Industrial (2.3)% – (2.3)% – – –Total 7.9% 14.7% 11.0% 8.1% 11.7% 9.5%
Sha
reho
lder
info
rmat
ion
Ove
rvie
wB
usin
ess
revi
ewG
over
nanc
eF
inan
cial
sta
tem
ents

Business review Performance
24 Tate & Lyle Annual Report 2010
Value addedValue added sales increased from £206 million to £225 million, an increase of 9% (2% in constant currency). Operating profits increased by 38% (32% in constant currency) to £33 million.
We achieved value added operating profit growth in both Single Ingredients and Food Systems. Single Ingredients’ sales volumes increased slightly, and unit margins increased with improved pricing. Volumes benefited from the successful commissioning of the new polydextrose line at our plant in the Netherlands, the first polydextrose production facility in Europe. Food Systems performed above the prior year, as demand in key markets proved relatively robust in the face of the economic downturn.
Looking forwardPerformance in the coming financial year will, as usual, be influenced by European cereal prices following this year’s harvest. Isoglucose prices will continue to be linked to EU sugar prices, which appear to have stabilised following the completion of regime reform. While we expect continuing stability in demand from food and beverage customers, we remain cautious over the extent and timing of recovery in industrial starch markets.
Market conditions
EU sugarThe sugar and isoglucose markets within the EU are regulated by EU Sugar Regime legislation, part of the EU Common Agricultural Policy. A four-year period of reform, which saw the surrender of almost six million tonnes of beet sugar quotas and a reduction in the EU institutional price structures of 36%, ended on 1 October 2009 with the implementation of the final quota and price cuts.
During the reform period, the market was characterised by oversupply, because the timing of the beet quota surrender was later than initially forecast by the EU Commission. However, as
expected, from 1 October 2009, the market has become better balanced, leading to improved unit refining margins for EU sugar processors.
Under the new regime, preferential access rights for cane sugar imports are granted to an expanded, but still limited, set of supplier countries. The supply of raw cane sugar in the EU market has come under increasing pressure in recent months both because supply from preferential sources has not grown as quickly as foreseen in the reform process and because increased world sugar prices, which recently hit 30-year highs, have reduced the economic incentive to export all preferential raw sugar to the EU market.
Sugars
Year to 31 March 2010 Year to 31 March 2009
Value Value Primary added Total Primary added Total £m £m £m £m £m £m
Sales Products 673 72 745 711 68 779Molasses 228 – 228 269 – 269
901 72 973 980 68 1 048
Adjusted operating profit/(loss) Products 14 3 17 (11) 5 (6)Molasses 13 – 13 18 – 18
27 3 30 7 5 12
Margin Products 2.1% 4.2% 2.3% (1.5)% 7.4% (0.8)%Molasses 5.7% – 5.7% 6.7% – 6.7%Total 3.0% 4.2% 3.1% 0.7% 7.4% 1.1%
Tate & Lyle Annual Report 2010 25
VietnamSugar prices in the Vietnamese market have remained strong due to the spike in world prices, and the impact of grassy green shoot disease, which has reduced sugar cane output in the region.
MolassesIn the molasses market, traded volumes have reduced from the prior year, although prices and margins have remained relatively strong.
Financial performanceSales reduced by 7% to £973 million (10% in constant currency). This reduction principally reflected lower average selling prices following the final EU institutional price cut on 1 October 2009 and lower traded molasses volumes.
Adjusted operating profit increased by 150% to £30 million (100% in constant currency) reflecting improved margins in the EU during the second half of the 2010 financial year, following the 1 October 2009 price change. Performance also benefited from lower energy and distribution costs. We recognised £17 million of transitional aid in the year (2009 – £17 million). We will recognise the final £8.5 million of transitional aid in the six months to 30 September 2010. The effect of exchange translation was to increase profit by £3 million.
Our Vietnamese cane sugar business, Nghe An Tate & Lyle, performed marginally ahead of the prior year, with improved selling prices more than offsetting lower sales volumes.
Following a further decline in the commercial prospects of our sugar refining business in Israel, we have recognised an exceptional charge of £15 million (2009 – £9 million) representing a full write-down of the fixed assets and an inventory impairment.
PrimaryAdjusted operating profit increased by £20 million to £27 million. Unit margins increased in all of our major EU industrial markets from 1 October 2009, although total sales volumes in the 2010 financial year were marginally below the prior year. Lower natural gas prices led to lower energy costs in the year while improvements in supply chain management led to a reduction in distribution costs.
Our molasses and storage business performed well in the year, with operating profit of £13 million. This was below the exceptionally strong profits of £18 million achieved in the comparative period when the sharp spike in cereal prices during the summer of 2008 led to very high demand and prices for molasses.
Value addedOperating profit of £3 million was 40% below the prior year (50% in constant currency) as the UK retail sugar marketplace remained extremely competitive during the year.
Securing raw sugar suppliesThe business has worked hard to address the challenge of raw sugar supply. In July 2009, Mitr Lao, our joint venture in Laos, delivered its first sugar to our UK refinery. This was the first sugar delivered to Europe from Asia under the Everything But Arms (EBA) initiative. We anticipate growth from this project, and others in Laos and Cambodia, in future years. In April 2010, we announced that we have entered into an agreement with the Jamaican government for the supply of 100,000 tonnes of sugar in the 2011 calendar year.
During the year, we also formed a technical support group to work with our preferential cane sugar supplier partners to grow their sugar industries sustainably and profitably. Led by a Tate & Lyle employee with over 30 years’ experience in the cane sugar supply chain, this group will help our partners improve their performance in field, factory and logistics.
Looking forwardIn the 2011 financial year, we expect unit refining margins in EU sugar to remain at levels similar to those achieved during the second half of the 2010 financial year. Before the impact of transitional aid, with lower levels of capacity utilisation, we expect operating profits from EU sugar to be marginally above the level achieved in the 2010 financial year.
Sha
reho
lder
info
rmat
ion
Ove
rvie
wB
usin
ess
revi
ewG
over
nanc
eF
inan
cial
sta
tem
ents
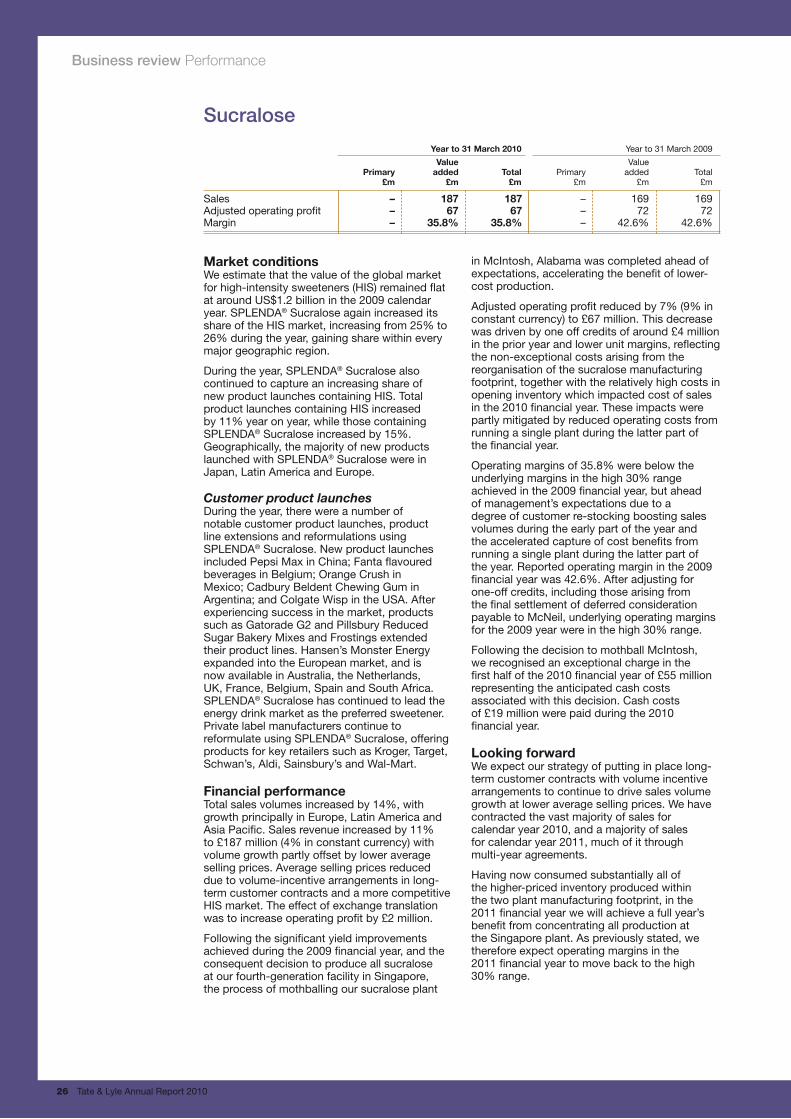
Business review Performance
26 Tate & Lyle Annual Report 2010
Market conditionsWe estimate that the value of the global market for high-intensity sweeteners (HIS) remained flat at around US$1.2 billion in the 2009 calendar year. SPLENDA® Sucralose again increased its share of the HIS market, increasing from 25% to 26% during the year, gaining share within every major geographic region.
During the year, SPLENDA® Sucralose also continued to capture an increasing share of new product launches containing HIS. Total product launches containing HIS increased by 11% year on year, while those containing SPLENDA® Sucralose increased by 15%. Geographically, the majority of new products launched with SPLENDA® Sucralose were in Japan, Latin America and Europe.
Customer product launchesDuring the year, there were a number of notable customer product launches, product line extensions and reformulations using SPLENDA® Sucralose. New product launches included Pepsi Max in China; Fanta flavoured beverages in Belgium; Orange Crush in Mexico; Cadbury Beldent Chewing Gum in Argentina; and Colgate Wisp in the USA. After experiencing success in the market, products such as Gatorade G2 and Pillsbury Reduced Sugar Bakery Mixes and Frostings extended their product lines. Hansen’s Monster Energy expanded into the European market, and is now available in Australia, the Netherlands, UK, France, Belgium, Spain and South Africa. SPLENDA® Sucralose has continued to lead the energy drink market as the preferred sweetener. Private label manufacturers continue to reformulate using SPLENDA® Sucralose, offering products for key retailers such as Kroger, Target, Schwan’s, Aldi, Sainsbury’s and Wal-Mart.
Financial performanceTotal sales volumes increased by 14%, with growth principally in Europe, Latin America and Asia Pacific. Sales revenue increased by 11% to £187 million (4% in constant currency) with volume growth partly offset by lower average selling prices. Average selling prices reduced due to volume-incentive arrangements in long-term customer contracts and a more competitive HIS market. The effect of exchange translation was to increase operating profit by £2 million.
Following the significant yield improvements achieved during the 2009 financial year, and the consequent decision to produce all sucralose at our fourth-generation facility in Singapore, the process of mothballing our sucralose plant
in McIntosh, Alabama was completed ahead of expectations, accelerating the benefit of lower-cost production.
Adjusted operating profit reduced by 7% (9% in constant currency) to £67 million. This decrease was driven by one off credits of around £4 million in the prior year and lower unit margins, reflecting the non-exceptional costs arising from the reorganisation of the sucralose manufacturing footprint, together with the relatively high costs in opening inventory which impacted cost of sales in the 2010 financial year. These impacts were partly mitigated by reduced operating costs from running a single plant during the latter part of the financial year.
Operating margins of 35.8% were below the underlying margins in the high 30% range achieved in the 2009 financial year, but ahead of management’s expectations due to a degree of customer re-stocking boosting sales volumes during the early part of the year and the accelerated capture of cost benefits from running a single plant during the latter part of the year. Reported operating margin in the 2009 financial year was 42.6%. After adjusting for one-off credits, including those arising from the final settlement of deferred consideration payable to McNeil, underlying operating margins for the 2009 year were in the high 30% range.
Following the decision to mothball McIntosh, we recognised an exceptional charge in the first half of the 2010 financial year of £55 million representing the anticipated cash costs associated with this decision. Cash costs of £19 million were paid during the 2010 financial year.
Looking forwardWe expect our strategy of putting in place long-term customer contracts with volume incentive arrangements to continue to drive sales volume growth at lower average selling prices. We have contracted the vast majority of sales for calendar year 2010, and a majority of sales for calendar year 2011, much of it through multi-year agreements.
Having now consumed substantially all of the higher-priced inventory produced within the two plant manufacturing footprint, in the 2011 financial year we will achieve a full year’s benefit from concentrating all production at the Singapore plant. As previously stated, we therefore expect operating margins in the 2011 financial year to move back to the high 30% range.
Sucralose
Year to 31 March 2010 Year to 31 March 2009
Value Value Primary added Total Primary added Total £m £m £m £m £m £m
Sales – 187 187 – 169 169 Adjusted operating profit – 67 67 – 72 72 Margin – 35.8% 35.8% – 42.6% 42.6%
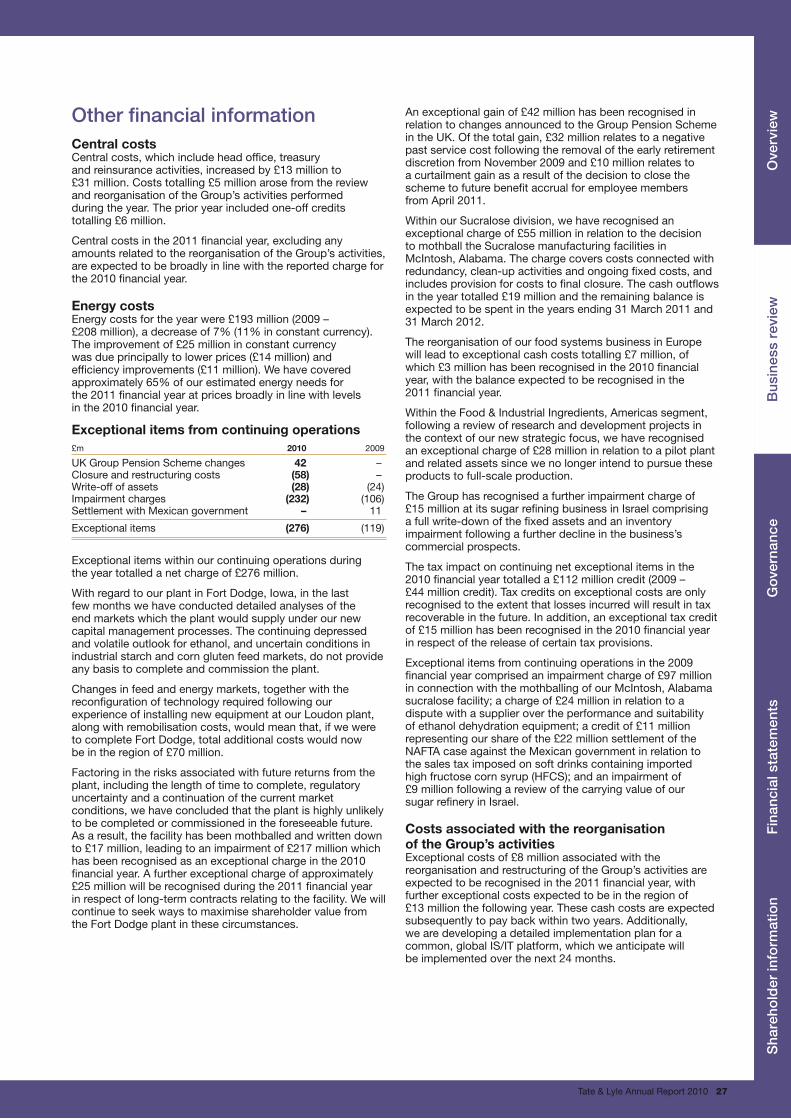
Tate & Lyle Annual Report 2010 27
Other financial informationCentral costsCentral costs, which include head office, treasury and reinsurance activities, increased by £13 million to £31 million. Costs totalling £5 million arose from the review and reorganisation of the Group’s activities performed during the year. The prior year included one-off credits totalling £6 million.
Central costs in the 2011 financial year, excluding any amounts related to the reorganisation of the Group’s activities, are expected to be broadly in line with the reported charge for the 2010 financial year.
Energy costsEnergy costs for the year were £193 million (2009 – £208 million), a decrease of 7% (11% in constant currency). The improvement of £25 million in constant currency was due principally to lower prices (£14 million) and efficiency improvements (£11 million). We have covered approximately 65% of our estimated energy needs for the 2011 financial year at prices broadly in line with levels in the 2010 financial year.
Exceptional items from continuing operations£m 2010 2009
UK Group Pension Scheme changes 42 –Closure and restructuring costs (58) –Write-off of assets (28) (24)Impairment charges (232) (106)Settlement with Mexican government – 11
Exceptional items (276) (119)
Exceptional items within our continuing operations during the year totalled a net charge of £276 million.
With regard to our plant in Fort Dodge, Iowa, in the last few months we have conducted detailed analyses of the end markets which the plant would supply under our new capital management processes. The continuing depressed and volatile outlook for ethanol, and uncertain conditions in industrial starch and corn gluten feed markets, do not provide any basis to complete and commission the plant.
Changes in feed and energy markets, together with the reconfiguration of technology required following our experience of installing new equipment at our Loudon plant, along with remobilisation costs, would mean that, if we were to complete Fort Dodge, total additional costs would now be in the region of £70 million.
Factoring in the risks associated with future returns from the plant, including the length of time to complete, regulatory uncertainty and a continuation of the current market conditions, we have concluded that the plant is highly unlikely to be completed or commissioned in the foreseeable future. As a result, the facility has been mothballed and written down to £17 million, leading to an impairment of £217 million which has been recognised as an exceptional charge in the 2010 financial year. A further exceptional charge of approximately £25 million will be recognised during the 2011 financial year in respect of long-term contracts relating to the facility. We will continue to seek ways to maximise shareholder value from the Fort Dodge plant in these circumstances.
An exceptional gain of £42 million has been recognised in relation to changes announced to the Group Pension Scheme in the UK. Of the total gain, £32 million relates to a negative past service cost following the removal of the early retirement discretion from November 2009 and £10 million relates to a curtailment gain as a result of the decision to close the scheme to future benefit accrual for employee members from April 2011.
Within our Sucralose division, we have recognised an exceptional charge of £55 million in relation to the decision to mothball the Sucralose manufacturing facilities in McIntosh, Alabama. The charge covers costs connected with redundancy, clean-up activities and ongoing fixed costs, and includes provision for costs to final closure. The cash outflows in the year totalled £19 million and the remaining balance is expected to be spent in the years ending 31 March 2011 and 31 March 2012.
The reorganisation of our food systems business in Europe will lead to exceptional cash costs totalling £7 million, of which £3 million has been recognised in the 2010 financial year, with the balance expected to be recognised in the 2011 financial year.
Within the Food & Industrial Ingredients, Americas segment, following a review of research and development projects in the context of our new strategic focus, we have recognised an exceptional charge of £28 million in relation to a pilot plant and related assets since we no longer intend to pursue these products to full-scale production.
The Group has recognised a further impairment charge of £15 million at its sugar refining business in Israel comprising a full write-down of the fixed assets and an inventory impairment following a further decline in the business’s commercial prospects.
The tax impact on continuing net exceptional items in the 2010 financial year totalled a £112 million credit (2009 – £44 million credit). Tax credits on exceptional costs are only recognised to the extent that losses incurred will result in tax recoverable in the future. In addition, an exceptional tax credit of £15 million has been recognised in the 2010 financial year in respect of the release of certain tax provisions.
Exceptional items from continuing operations in the 2009 financial year comprised an impairment charge of £97 million in connection with the mothballing of our McIntosh, Alabama sucralose facility; a charge of £24 million in relation to a dispute with a supplier over the performance and suitability of ethanol dehydration equipment; a credit of £11 million representing our share of the £22 million settlement of the NAFTA case against the Mexican government in relation to the sales tax imposed on soft drinks containing imported high fructose corn syrup (HFCS); and an impairment of £9 million following a review of the carrying value of our sugar refinery in Israel.
Costs associated with the reorganisation of the Group’s activitiesExceptional costs of £8 million associated with the reorganisation and restructuring of the Group’s activities are expected to be recognised in the 2011 financial year, with further exceptional costs expected to be in the region of £13 million the following year. These cash costs are expected subsequently to pay back within two years. Additionally, we are developing a detailed implementation plan for a common, global IS/IT platform, which we anticipate will be implemented over the next 24 months.
Sha
reho
lder
info
rmat
ion
Ove
rvie
wB
usin
ess
revi
ewG
over
nanc
eF
inan
cial
sta
tem
ents
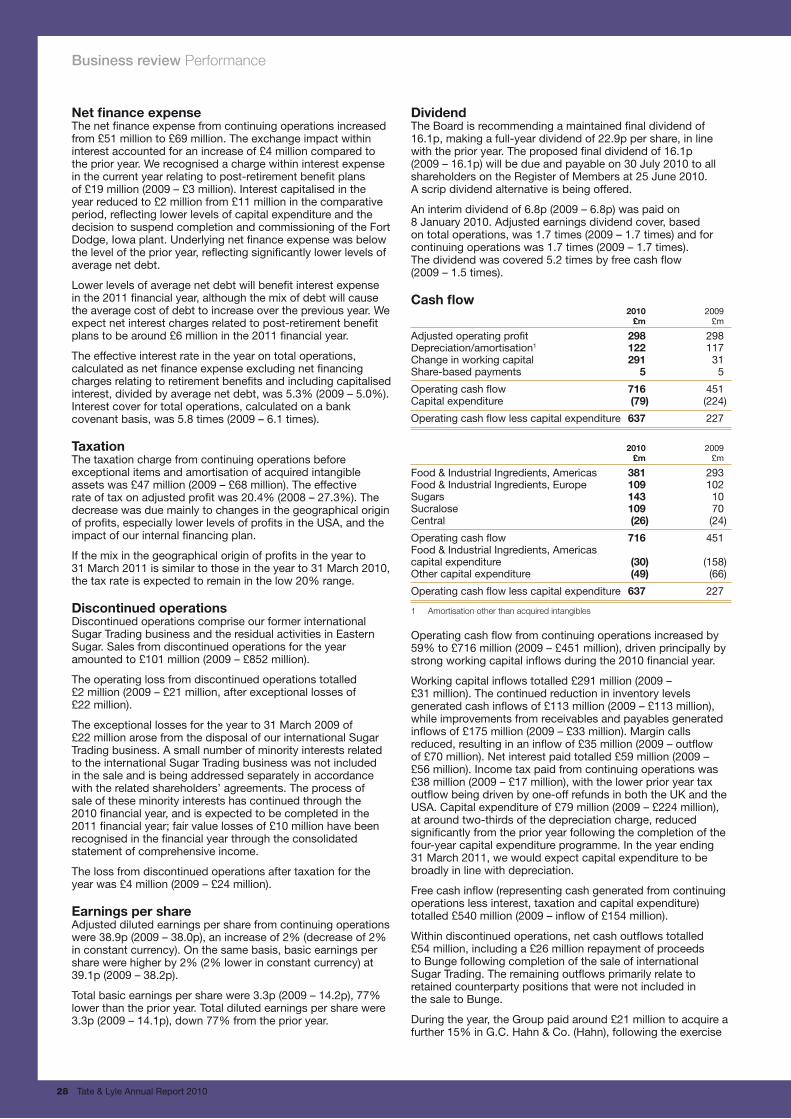
Business review Performance
28 Tate & Lyle Annual Report 2010
Net finance expenseThe net finance expense from continuing operations increased from £51 million to £69 million. The exchange impact within interest accounted for an increase of £4 million compared to the prior year. We recognised a charge within interest expense in the current year relating to post-retirement benefit plans of £19 million (2009 – £3 million). Interest capitalised in the year reduced to £2 million from £11 million in the comparative period, reflecting lower levels of capital expenditure and the decision to suspend completion and commissioning of the Fort Dodge, Iowa plant. Underlying net finance expense was below the level of the prior year, reflecting significantly lower levels of average net debt.
Lower levels of average net debt will benefit interest expense in the 2011 financial year, although the mix of debt will cause the average cost of debt to increase over the previous year. We expect net interest charges related to post-retirement benefit plans to be around £6 million in the 2011 financial year.
The effective interest rate in the year on total operations, calculated as net finance expense excluding net financing charges relating to retirement benefits and including capitalised interest, divided by average net debt, was 5.3% (2009 – 5.0%).Interest cover for total operations, calculated on a bank covenant basis, was 5.8 times (2009 – 6.1 times).
TaxationThe taxation charge from continuing operations before exceptional items and amortisation of acquired intangible assets was £47 million (2009 – £68 million). The effective rate of tax on adjusted profit was 20.4% (2008 – 27.3%). The decrease was due mainly to changes in the geographical origin of profits, especially lower levels of profits in the USA, and the impact of our internal financing plan.
If the mix in the geographical origin of profits in the year to 31 March 2011 is similar to those in the year to 31 March 2010, the tax rate is expected to remain in the low 20% range. Discontinued operationsDiscontinued operations comprise our former international Sugar Trading business and the residual activities in Eastern Sugar. Sales from discontinued operations for the year amounted to £101 million (2009 – £852 million).
The operating loss from discontinued operations totalled £2 million (2009 – £21 million, after exceptional losses of £22 million).
The exceptional losses for the year to 31 March 2009 of £22 million arose from the disposal of our international Sugar Trading business. A small number of minority interests related to the international Sugar Trading business was not included in the sale and is being addressed separately in accordance with the related shareholders’ agreements. The process of sale of these minority interests has continued through the 2010 financial year, and is expected to be completed in the 2011 financial year; fair value losses of £10 million have been recognised in the financial year through the consolidated statement of comprehensive income.
The loss from discontinued operations after taxation for the year was £4 million (2009 – £24 million).
Earnings per shareAdjusted diluted earnings per share from continuing operations were 38.9p (2009 – 38.0p), an increase of 2% (decrease of 2% in constant currency). On the same basis, basic earnings per share were higher by 2% (2% lower in constant currency) at 39.1p (2009 – 38.2p).
Total basic earnings per share were 3.3p (2009 – 14.2p), 77% lower than the prior year. Total diluted earnings per share were 3.3p (2009 – 14.1p), down 77% from the prior year.
DividendThe Board is recommending a maintained final dividend of 16.1p, making a full-year dividend of 22.9p per share, in line with the prior year. The proposed final dividend of 16.1p (2009 – 16.1p) will be due and payable on 30 July 2010 to all shareholders on the Register of Members at 25 June 2010. A scrip dividend alternative is being offered.
An interim dividend of 6.8p (2009 – 6.8p) was paid on 8 January 2010. Adjusted earnings dividend cover, based on total operations, was 1.7 times (2009 – 1.7 times) and for continuing operations was 1.7 times (2009 – 1.7 times). The dividend was covered 5.2 times by free cash flow (2009 – 1.5 times).
Cash flow 2010 2009 £m £m
Adjusted operating profit 298 298Depreciation/amortisation1 122 117Change in working capital 291 31Share-based payments 5 5
Operating cash flow 716 451Capital expenditure (79) (224)
Operating cash flow less capital expenditure 637 227
2010 2009 £m £m
Food & Industrial Ingredients, Americas 381 293 Food & Industrial Ingredients, Europe 109 102 Sugars 143 10 Sucralose 109 70 Central (26) (24)
Operating cash flow 716 451 Food & Industrial Ingredients, Americas capital expenditure (30) (158)Other capital expenditure (49) (66)
Operating cash flow less capital expenditure 637 227
1 Amortisationotherthanacquiredintangibles
Operating cash flow from continuing operations increased by 59% to £716 million (2009 – £451 million), driven principally by strong working capital inflows during the 2010 financial year.
Working capital inflows totalled £291 million (2009 – £31 million). The continued reduction in inventory levels generated cash inflows of £113 million (2009 – £113 million), while improvements from receivables and payables generated inflows of £175 million (2009 – £33 million). Margin calls reduced, resulting in an inflow of £35 million (2009 – outflow of £70 million). Net interest paid totalled £59 million (2009 – £56 million). Income tax paid from continuing operations was £38 million (2009 – £17 million), with the lower prior year tax outflow being driven by one-off refunds in both the UK and the USA. Capital expenditure of £79 million (2009 – £224 million), at around two-thirds of the depreciation charge, reduced significantly from the prior year following the completion of the four-year capital expenditure programme. In the year ending 31 March 2011, we would expect capital expenditure to be broadly in line with depreciation.
Free cash inflow (representing cash generated from continuing operations less interest, taxation and capital expenditure) totalled £540 million (2009 – inflow of £154 million).
Within discontinued operations, net cash outflows totalled £54 million, including a £26 million repayment of proceeds to Bunge following completion of the sale of international Sugar Trading. The remaining outflows primarily relate to retained counterparty positions that were not included in the sale to Bunge.
During the year, the Group paid around £21 million to acquire a further 15% in G.C. Hahn & Co. (Hahn), following the exercise
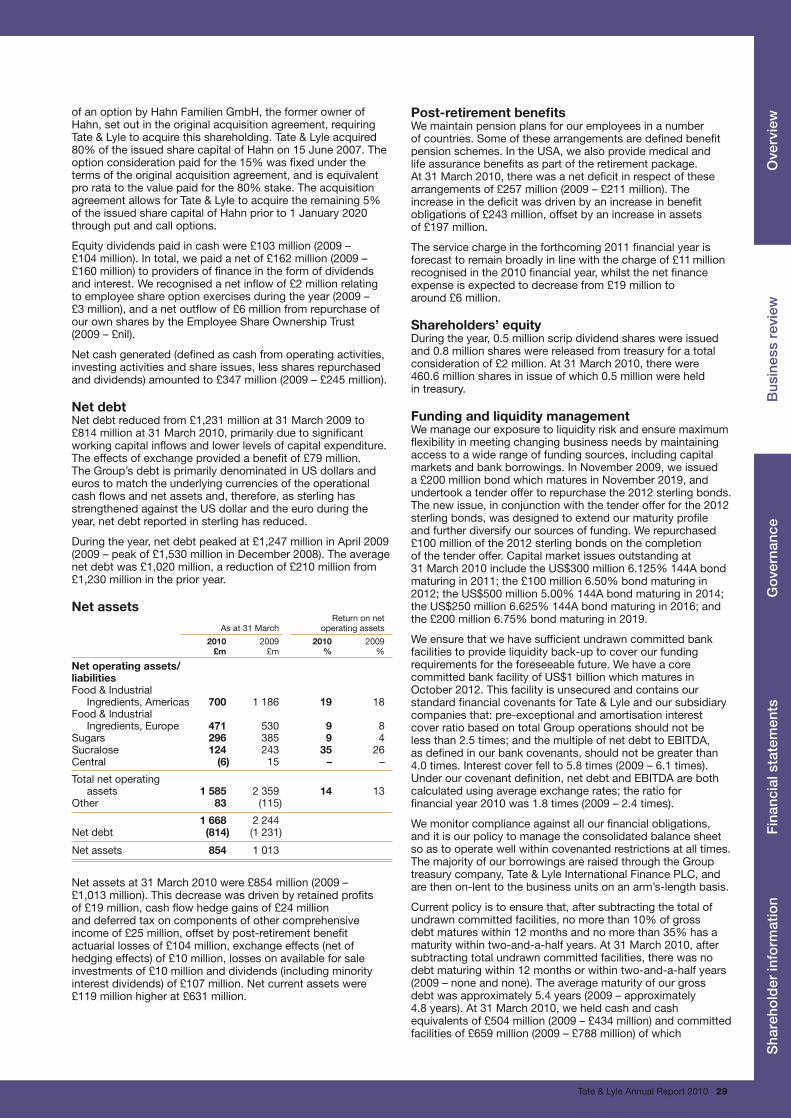
Tate & Lyle Annual Report 2010 29
of an option by Hahn Familien GmbH, the former owner of Hahn, set out in the original acquisition agreement, requiring Tate & Lyle to acquire this shareholding. Tate & Lyle acquired 80% of the issued share capital of Hahn on 15 June 2007. The option consideration paid for the 15% was fixed under the terms of the original acquisition agreement, and is equivalent pro rata to the value paid for the 80% stake. The acquisition agreement allows for Tate & Lyle to acquire the remaining 5% of the issued share capital of Hahn prior to 1 January 2020 through put and call options.
Equity dividends paid in cash were £103 million (2009 – £104 million). In total, we paid a net of £162 million (2009 – £160 million) to providers of finance in the form of dividends and interest. We recognised a net inflow of £2 million relating to employee share option exercises during the year (2009 – £3 million), and a net outflow of £6 million from repurchase of our own shares by the Employee Share Ownership Trust (2009 – £nil).
Net cash generated (defined as cash from operating activities, investing activities and share issues, less shares repurchased and dividends) amounted to £347 million (2009 – £245 million).
Net debtNet debt reduced from £1,231 million at 31 March 2009 to £814 million at 31 March 2010, primarily due to significant working capital inflows and lower levels of capital expenditure. The effects of exchange provided a benefit of £79 million. The Group’s debt is primarily denominated in US dollars and euros to match the underlying currencies of the operational cash flows and net assets and, therefore, as sterling has strengthened against the US dollar and the euro during the year, net debt reported in sterling has reduced.
During the year, net debt peaked at £1,247 million in April 2009 (2009 – peak of £1,530 million in December 2008). The average net debt was £1,020 million, a reduction of £210 million from £1,230 million in the prior year. Net assets Return on net As at 31 March operating assets
2010 2009 2010 2009 £m £m % %
Net operating assets/liabilities Food & Industrial Ingredients, Americas 700 1 186 19 18Food & Industrial Ingredients, Europe 471 530 9 8Sugars 296 385 9 4Sucralose 124 243 35 26Central (6) 15 – –
Total net operating assets 1 585 2 359 14 13Other 83 (115)
1 668 2 244 Net debt (814) (1 231)
Net assets 854 1 013
Net assets at 31 March 2010 were £854 million (2009 – £1,013 million). This decrease was driven by retained profits of £19 million, cash flow hedge gains of £24 million and deferred tax on components of other comprehensive income of £25 million, offset by post-retirement benefit actuarial losses of £104 million, exchange effects (net of hedging effects) of £10 million, losses on available for sale investments of £10 million and dividends (including minority interest dividends) of £107 million. Net current assets were £119 million higher at £631 million.
Post-retirement benefitsWe maintain pension plans for our employees in a number of countries. Some of these arrangements are defined benefit pension schemes. In the USA, we also provide medical and life assurance benefits as part of the retirement package. At 31 March 2010, there was a net deficit in respect of these arrangements of £257 million (2009 – £211 million). The increase in the deficit was driven by an increase in benefit obligations of £243 million, offset by an increase in assets of £197 million.
The service charge in the forthcoming 2011 financial year is forecast to remain broadly in line with the charge of £11 million recognised in the 2010 financial year, whilst the net finance expense is expected to decrease from £19 million to around £6 million.
Shareholders’ equity During the year, 0.5 million scrip dividend shares were issued and 0.8 million shares were released from treasury for a total consideration of £2 million. At 31 March 2010, there were 460.6 million shares in issue of which 0.5 million were held in treasury.
Funding and liquidity managementWe manage our exposure to liquidity risk and ensure maximum flexibility in meeting changing business needs by maintaining access to a wide range of funding sources, including capital markets and bank borrowings. In November 2009, we issued a £200 million bond which matures in November 2019, and undertook a tender offer to repurchase the 2012 sterling bonds. The new issue, in conjunction with the tender offer for the 2012 sterling bonds, was designed to extend our maturity profile and further diversify our sources of funding. We repurchased £100 million of the 2012 sterling bonds on the completion of the tender offer. Capital market issues outstanding at 31 March 2010 include the US$300 million 6.125% 144A bond maturing in 2011; the £100 million 6.50% bond maturing in 2012; the US$500 million 5.00% 144A bond maturing in 2014; the US$250 million 6.625% 144A bond maturing in 2016; and the £200 million 6.75% bond maturing in 2019.
We ensure that we have sufficient undrawn committed bank facilities to provide liquidity back-up to cover our funding requirements for the foreseeable future. We have a core committed bank facility of US$1 billion which matures in October 2012. This facility is unsecured and contains our standard financial covenants for Tate & Lyle and our subsidiary companies that: pre-exceptional and amortisation interest cover ratio based on total Group operations should not be less than 2.5 times; and the multiple of net debt to EBITDA, as defined in our bank covenants, should not be greater than 4.0 times. Interest cover fell to 5.8 times (2009 – 6.1 times). Under our covenant definition, net debt and EBITDA are both calculated using average exchange rates; the ratio for financial year 2010 was 1.8 times (2009 – 2.4 times).
We monitor compliance against all our financial obligations, and it is our policy to manage the consolidated balance sheet so as to operate well within covenanted restrictions at all times. The majority of our borrowings are raised through the Group treasury company, Tate & Lyle International Finance PLC, and are then on-lent to the business units on an arm’s-length basis.
Current policy is to ensure that, after subtracting the total of undrawn committed facilities, no more than 10% of gross debt matures within 12 months and no more than 35% has a maturity within two-and-a-half years. At 31 March 2010, after subtracting total undrawn committed facilities, there was no debt maturing within 12 months or within two-and-a-half years (2009 – none and none). The average maturity of our gross debt was approximately 5.4 years (2009 – approximately 4.8 years). At 31 March 2010, we held cash and cash equivalents of £504 million (2009 – £434 million) and committed facilities of £659 million (2009 – £788 million) of which
Sha
reho
lder
info
rmat
ion
Ove
rvie
wB
usin
ess
revi
ewG
over
nanc
eF
inan
cial
sta
tem
ents
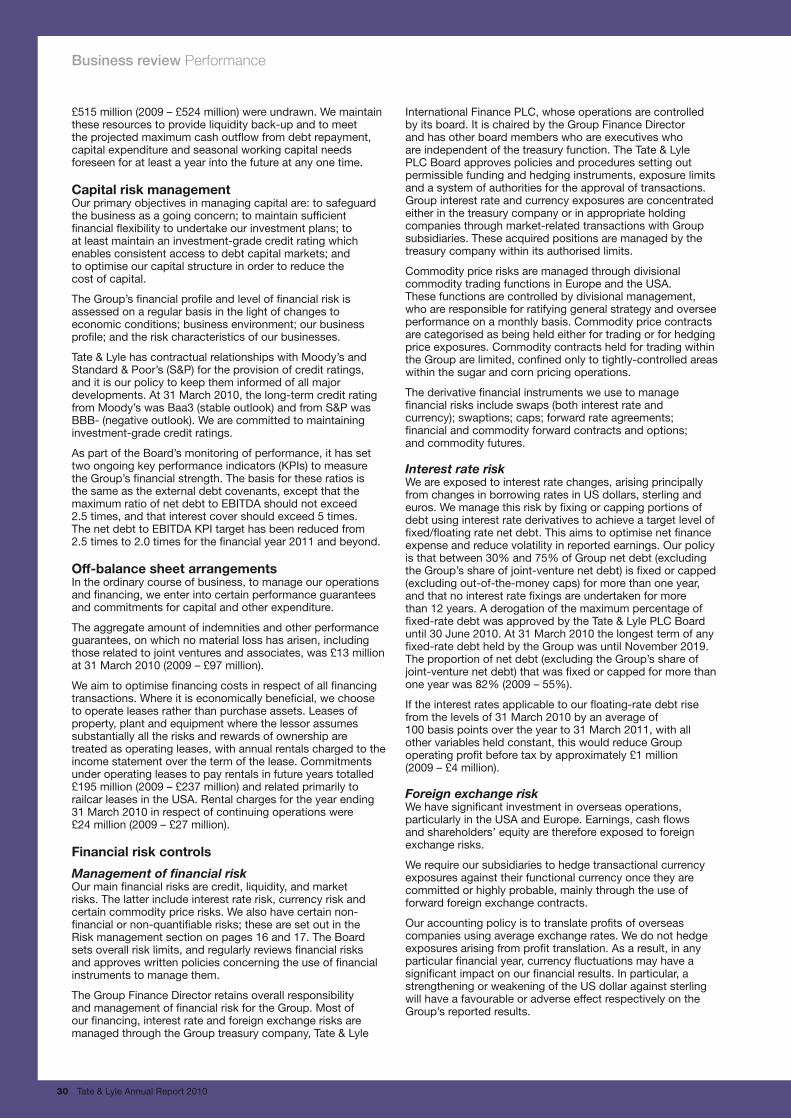
30 Tate & Lyle Annual Report 2010
Business review Performance
£515 million (2009 – £524 million) were undrawn. We maintain these resources to provide liquidity back-up and to meet the projected maximum cash outflow from debt repayment, capital expenditure and seasonal working capital needs foreseen for at least a year into the future at any one time.
Capital risk managementOur primary objectives in managing capital are: to safeguard the business as a going concern; to maintain sufficient financial flexibility to undertake our investment plans; to at least maintain an investment-grade credit rating which enables consistent access to debt capital markets; and to optimise our capital structure in order to reduce the cost of capital.
The Group’s financial profile and level of financial risk is assessed on a regular basis in the light of changes to economic conditions; business environment; our business profile; and the risk characteristics of our businesses.
Tate & Lyle has contractual relationships with Moody’s and Standard & Poor’s (S&P) for the provision of credit ratings, and it is our policy to keep them informed of all major developments. At 31 March 2010, the long-term credit rating from Moody’s was Baa3 (stable outlook) and from S&P was BBB- (negative outlook). We are committed to maintaining investment-grade credit ratings.
As part of the Board’s monitoring of performance, it has set two ongoing key performance indicators (KPIs) to measure the Group’s financial strength. The basis for these ratios is the same as the external debt covenants, except that the maximum ratio of net debt to EBITDA should not exceed 2.5 times, and that interest cover should exceed 5 times. The net debt to EBITDA KPI target has been reduced from 2.5 times to 2.0 times for the financial year 2011 and beyond.
Off-balance sheet arrangementsIn the ordinary course of business, to manage our operations and financing, we enter into certain performance guarantees and commitments for capital and other expenditure.
The aggregate amount of indemnities and other performance guarantees, on which no material loss has arisen, including those related to joint ventures and associates, was £13 million at 31 March 2010 (2009 – £97 million).
We aim to optimise financing costs in respect of all financing transactions. Where it is economically beneficial, we choose to operate leases rather than purchase assets. Leases of property, plant and equipment where the lessor assumes substantially all the risks and rewards of ownership are treated as operating leases, with annual rentals charged to the income statement over the term of the lease. Commitments under operating leases to pay rentals in future years totalled £195 million (2009 – £237 million) and related primarily to railcar leases in the USA. Rental charges for the year ending 31 March 2010 in respect of continuing operations were £24 million (2009 – £27 million).
Financial risk controls
Management of financial riskOur main financial risks are credit, liquidity, and market risks. The latter include interest rate risk, currency risk and certain commodity price risks. We also have certain non-financial or non-quantifiable risks; these are set out in the Risk management section on pages 16 and 17. The Board sets overall risk limits, and regularly reviews financial risks and approves written policies concerning the use of financial instruments to manage them.
The Group Finance Director retains overall responsibility and management of financial risk for the Group. Most of our financing, interest rate and foreign exchange risks are managed through the Group treasury company, Tate & Lyle
International Finance PLC, whose operations are controlled by its board. It is chaired by the Group Finance Director and has other board members who are executives who are independent of the treasury function. The Tate & Lyle PLC Board approves policies and procedures setting out permissible funding and hedging instruments, exposure limits and a system of authorities for the approval of transactions. Group interest rate and currency exposures are concentrated either in the treasury company or in appropriate holding companies through market-related transactions with Group subsidiaries. These acquired positions are managed by the treasury company within its authorised limits.
Commodity price risks are managed through divisional commodity trading functions in Europe and the USA. These functions are controlled by divisional management, who are responsible for ratifying general strategy and oversee performance on a monthly basis. Commodity price contracts are categorised as being held either for trading or for hedging price exposures. Commodity contracts held for trading within the Group are limited, confined only to tightly-controlled areas within the sugar and corn pricing operations.
The derivative financial instruments we use to manage financial risks include swaps (both interest rate and currency); swaptions; caps; forward rate agreements; financial and commodity forward contracts and options; and commodity futures.
Interest rate riskWe are exposed to interest rate changes, arising principally from changes in borrowing rates in US dollars, sterling and euros. We manage this risk by fixing or capping portions of debt using interest rate derivatives to achieve a target level of fixed/floating rate net debt. This aims to optimise net finance expense and reduce volatility in reported earnings. Our policy is that between 30% and 75% of Group net debt (excluding the Group’s share of joint-venture net debt) is fixed or capped (excluding out-of-the-money caps) for more than one year, and that no interest rate fixings are undertaken for more than 12 years. A derogation of the maximum percentage of fixed-rate debt was approved by the Tate & Lyle PLC Board until 30 June 2010. At 31 March 2010 the longest term of any fixed-rate debt held by the Group was until November 2019. The proportion of net debt (excluding the Group’s share of joint-venture net debt) that was fixed or capped for more than one year was 82% (2009 – 55%).
If the interest rates applicable to our floating-rate debt rise from the levels of 31 March 2010 by an average of 100 basis points over the year to 31 March 2011, with all other variables held constant, this would reduce Group operating profit before tax by approximately £1 million (2009 – £4 million).
Foreign exchange riskWe have significant investment in overseas operations, particularly in the USA and Europe. Earnings, cash flows and shareholders’ equity are therefore exposed to foreign exchange risks.
We require our subsidiaries to hedge transactional currency exposures against their functional currency once they are committed or highly probable, mainly through the use of forward foreign exchange contracts.
Our accounting policy is to translate profits of overseas companies using average exchange rates. We do not hedge exposures arising from profit translation. As a result, in any particular financial year, currency fluctuations may have a significant impact on our financial results. In particular, a strengthening or weakening of the US dollar against sterling will have a favourable or adverse effect respectively on the Group’s reported results.
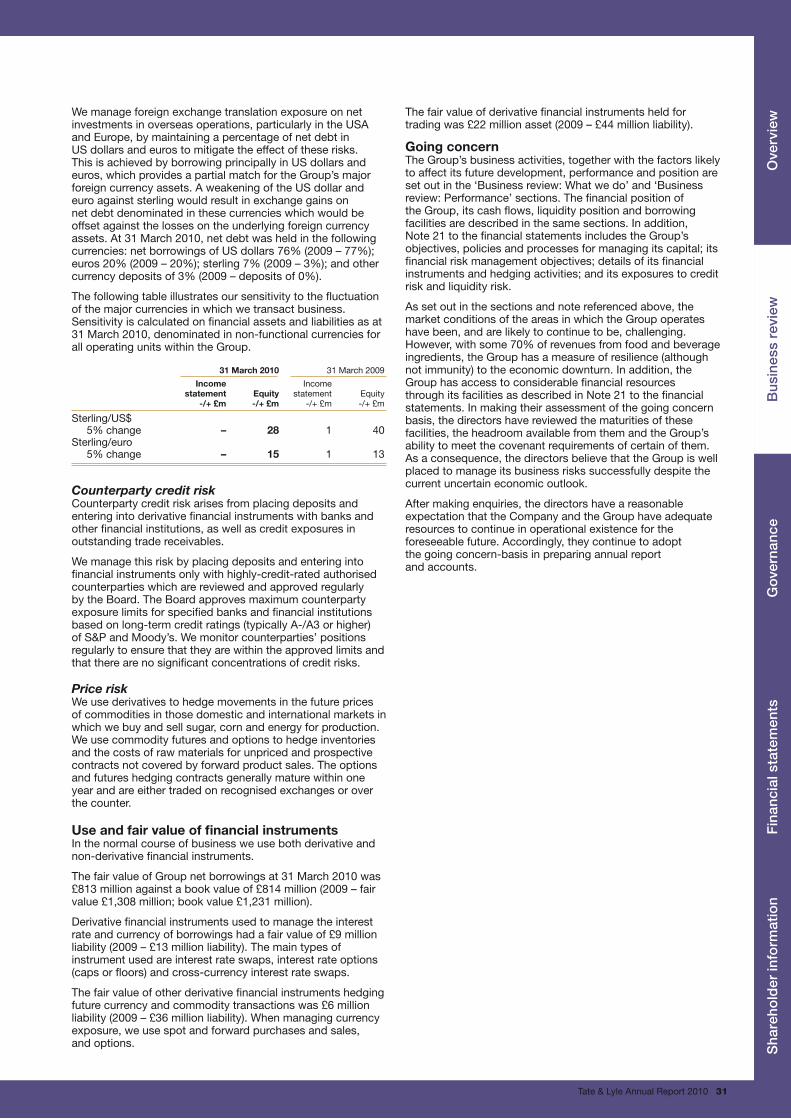
Tate & Lyle Annual Report 2010 31
We manage foreign exchange translation exposure on net investments in overseas operations, particularly in the USA and Europe, by maintaining a percentage of net debt in US dollars and euros to mitigate the effect of these risks. This is achieved by borrowing principally in US dollars and euros, which provides a partial match for the Group’s major foreign currency assets. A weakening of the US dollar and euro against sterling would result in exchange gains on net debt denominated in these currencies which would be offset against the losses on the underlying foreign currency assets. At 31 March 2010, net debt was held in the following currencies: net borrowings of US dollars 76% (2009 – 77%); euros 20% (2009 – 20%); sterling 7% (2009 – 3%); and other currency deposits of 3% (2009 – deposits of 0%).
The following table illustrates our sensitivity to the fluctuation of the major currencies in which we transact business. Sensitivity is calculated on financial assets and liabilities as at 31 March 2010, denominated in non-functional currencies for all operating units within the Group.
31 March 2010 31 March 2009
Income Income statement Equity statement Equity -/+ £m -/+ £m -/+ £m -/+ £m Sterling/US$ 5% change – 28 1 40 Sterling/euro 5% change – 15 1 13
Counterparty credit riskCounterparty credit risk arises from placing deposits and entering into derivative financial instruments with banks and other financial institutions, as well as credit exposures in outstanding trade receivables.
We manage this risk by placing deposits and entering into financial instruments only with highly-credit-rated authorised counterparties which are reviewed and approved regularly by the Board. The Board approves maximum counterparty exposure limits for specified banks and financial institutions based on long-term credit ratings (typically A-/A3 or higher) of S&P and Moody’s. We monitor counterparties’ positions regularly to ensure that they are within the approved limits and that there are no significant concentrations of credit risks.
Price riskWe use derivatives to hedge movements in the future prices of commodities in those domestic and international markets in which we buy and sell sugar, corn and energy for production. We use commodity futures and options to hedge inventories and the costs of raw materials for unpriced and prospective contracts not covered by forward product sales. The options and futures hedging contracts generally mature within one year and are either traded on recognised exchanges or over the counter.
Use and fair value of financial instrumentsIn the normal course of business we use both derivative and non-derivative financial instruments.
The fair value of Group net borrowings at 31 March 2010 was £813 million against a book value of £814 million (2009 – fair value £1,308 million; book value £1,231 million).
Derivative financial instruments used to manage the interest rate and currency of borrowings had a fair value of £9 million liability (2009 – £13 million liability). The main types of instrument used are interest rate swaps, interest rate options (caps or floors) and cross-currency interest rate swaps.
The fair value of other derivative financial instruments hedging future currency and commodity transactions was £6 million liability (2009 – £36 million liability). When managing currency exposure, we use spot and forward purchases and sales, and options.
The fair value of derivative financial instruments held for trading was £22 million asset (2009 – £44 million liability).
Going concernThe Group’s business activities, together with the factors likely to affect its future development, performance and position are set out in the ‘Business review: What we do’ and ‘Business review: Performance’ sections. The financial position of the Group, its cash flows, liquidity position and borrowing facilities are described in the same sections. In addition, Note 21 to the financial statements includes the Group’s objectives, policies and processes for managing its capital; its financial risk management objectives; details of its financial instruments and hedging activities; and its exposures to credit risk and liquidity risk.
As set out in the sections and note referenced above, the market conditions of the areas in which the Group operates have been, and are likely to continue to be, challenging. However, with some 70% of revenues from food and beverage ingredients, the Group has a measure of resilience (although not immunity) to the economic downturn. In addition, the Group has access to considerable financial resources through its facilities as described in Note 21 to the financial statements. In making their assessment of the going concern basis, the directors have reviewed the maturities of these facilities, the headroom available from them and the Group’s ability to meet the covenant requirements of certain of them. As a consequence, the directors believe that the Group is well placed to manage its business risks successfully despite the current uncertain economic outlook.
After making enquiries, the directors have a reasonable expectation that the Company and the Group have adequate resources to continue in operational existence for the foreseeable future. Accordingly, they continue to adopt the going concern-basis in preparing annual report and accounts.
Sha
reho
lder
info
rmat
ion
Ove
rvie
wB
usin
ess
revi
ewG
over
nanc
eF
inan
cial
sta
tem
ents
32 Tate & Lyle Annual Report 2010
Corporate social responsibility
OverviewThis year, we have changed how we report corporate social responsibility (CSR). We have incorporated those areas in which we measure performance – safety, environment, community – into this ‘Business review: Performance’ section, emphasising their importance to the long-term success of the business. The other two parts of our traditional CSR report, namely how we manage our relationships with commercial partners and suppliers, and our approach to employee health and wellbeing, are covered in the ‘Business review: What we do’ section, since they are an integral part of how we do business.
We believe that changing the way we report CSR more accurately reflects the central role it plays in the way we do business – which, for Tate & Lyle, means operating to high social, ethical and environmental standards in all circumstances.
Managing corporate social responsibilityOur approach to CSR is enshrined in our Business Code of Conduct (the Code). The Code applies unconditionally to all wholly-owned parts of the Group, and we also aim to apply the Code in those operations in which we have a 50% stake or more. Where we have a minority stake, we encourage our partners to adopt the Code. Applying the Code requires proactive management at every level within the Company. The Board reviews Tate & Lyle’s CSR policies and performance annually, and the Chief Executive is the Board member accountable for all aspects of CSR. A copy of the Code can be found on our website, www.tateandlyle.com.
Our internal audit function reviews the processes used to collect and collate the information contained within this CSR section. In the 2011 financial year, we will be establishing a new Corporate Responsibility Board Committee. This Committee will be reviewing our current data and processes and, as a result, we expect that there will be a number of changes to our methodology and presentational format and this will be reflected in the Annual Report 2011.
SafetyTate & Lyle has no higher priority than safety, which we believe is fundamental to running a successful business. This means ensuring safe and healthy conditions for everyone at our sites: employees; contractors; and visitors. By reporting, recognising and rewarding safety performance, we aim to ensure that all our operations focus on continuous improvement.
OverviewThe Group continued to make progress in safety performance in the 2009 calendar year, with improvements in all areas with the exception of the severity rate (lost workdays) which worsened by 18%. Following significant improvements in 2008, our contractor safety index worsened by 28% in 2009. This will be a major area of focus in 2010.
Employee safety results for the 2009 calendar year
n Group safety index (weighted average of injuries sustained in the workplace across Tate & Lyle, with more severe incidents having greater impact) improved by 3%;
n Recordable injury rate (injury requiring treatment beyond first aid) improved by 33%;
n Lost-time accident rate (recordable injury sufficiently severe to result in lost workdays or to restrict the employee’s ability to perform his/her job) improved by 17%; and
n Severity rate (number of workdays lost due to injuries per 200,000 employee hours) worsened by 18%.
Most Group locations equalled or improved on their 2008 safety performance, including 19 locations that reported no recordable injuries and 24 that reported no lost-time accidents for the year. Overall, we were pleased that our results showed good progress compared to 2008, with the exception of the severity rate which worsened. Actions are being taken to reduce the severity rate in 2010 primarily through a focus on training, behavioural auditing, and continuous reviews of physical conditions and programmes at each site.
Benchmarking resultsIn comparing the performance of each of our divisions with results from the US Bureau of Labor Statistics (2008 being the most recent data available), again this year our divisions are outperforming the average reported standard for their peers in their respective sectors and in the US private sector as a whole.
Contractor safety results for the 2009 calendar yearFollowing significant improvements in 2008, we were disappointed that our contractor safety index worsened by 28% in 2009, impacted in particular by a 50% worsening of the severity rate (lost workdays).
In the 2009 calendar year, compared with the 2008 results:
n Contractor safety index worsened by 28%;n Recordable injury rate improved by 26%;n Lost-time accident rate improved by 2%; andn Severity rate worsened by 50%.
Contractor safety is a major focus in 2010. At our larger sites we are introducing a new contractor review system to evaluate contractor safety performance on a monthly basis. We will also hold regular safety meetings with contractors to explain safety expectations, and accountability for safety performance will be a factor in contractor selection and site maintenance.
Benchmarking resultsWhile we were disappointed with our contractor safety performance in 2009, our results nonetheless compare well with the US Bureau of Labor Statistics for 2008 (the most recent data available). The Bureau reports the overall recordable injury rate per 200,000 employee hours for US contractors to be 4.7 against 1.42 at Tate & Lyle, and the overall lost-time accident rate to be 2.5 against our rate of 0.75.
Business review Performance

09
1.12
07
2.08
08
1.16
08 09
3.43
07
3.74
2.67
Group safety index
Thesmallertheindex,thebettertheperformance.OurtargetiszeroforeveryTate&Lyleoperation.
ECA B G HF
6.20
4.50
1.69
0.820.43 1.00 0.99
D
5.90
US industry3.90
Benchmarking safety: recordable injury rate1
ECA B D G H
0.33
F
4.00
2.50
0.363
0.28
3.20
0.770.31 0.33
US industry2.00
Benchmarking safety: lost-time accident rate2
A USfoodmanufacturing E Food&IndustrialIngredients,AmericasB USgrainmilling F Food&IndustrialIngredients,EuropeC UScornrefiners G SugarsD USsugarindustry H Sucralose
1 Numberofinjuriesper200,000employeehoursrequiringmorethanfirstaid.
2 Rateofrecordableinjuriessufficientlyserioustoresultinlostworkdaysorrestrictedworkactivities.
3 Caseswithdaysawayfromworkonly,notincludingrestrictedworkactivities.
Sources:Tate&LyledatafromGroupsafetyrecordsUSindustrystatisticsasreportedbytheUSBureauofLaborStatistics
Contractor safety index
Thesmallertheindex,thebettertheperformance.OurtargetiszeroforeveryTate&Lyleoperation.
4.70
USindustry
Tate& Lyle
1.42
Benchmarking contractor safety: recordable injury rate1
2.50
USindustry
Tate& Lyle
0.75
Benchmarking contractor safety: lost-time accident rate2
1 Numberofinjuriesper200,000employeehoursrequiringmorethanfirstaid.
2 Rateofrecordableinjuriessufficientlyserioustoresultinlostworkdaysorrestrictedworkactivities.
Tate & Lyle Annual Report 2010 33
Safety – key performance indicators
Sha
reho
lder
info
rmat
ion
Ove
rvie
wB
usin
ess
revi
ewG
over
nanc
eF
inan
cial
sta
tem
ents
34 Tate & Lyle Annual Report 2010
Business review Performance
Managing safetyMaintaining a consistently safe and healthy workplace for our people requires effective, proactive management. We operate network safety committees in the Americas and Europe that share knowledge and experience between plants with the aim of ensuring consistently high standards of safety across Tate & Lyle.
The core elements of our approach to safety are:
n an increased focus on the human and behavioural aspects of safety;
n utilization of the networking concept to make effective use of available resources;
n improved communications on issues of safety throughout the Group;
n sharing of best practice, including the use of leading indicators;
n auditing of safety and loss control programmes; and n active involvement of Company executives to promote and
audit safety programmes.
Projects and activitiesOur network safety committees and their task forces undertook a wide range of safety projects in 2009. Some examples include:
n Group-wide behavioural auditing and training. During 2009, our operations in the Americas introduced a new five-step employee training programme called SafeStart;
n use of a third-party and insurance audit teams to review Occupational Safety and Health Administration and regulatory compliance, and fire protection programme;
n sustained efforts to keep the families of employees involved in the overall safety process through promotional items, contests, and safety days;
n ongoing use of recognition and award programmes to identify and reward outstanding safety performance and mark safety milestones; and
n continued work in managing and monitoring contractors, along with on-site contractor training.
AwardsTate & Lyle runs a number of annual, Group-wide safety awards. To qualify for entry into our ‘Global Safety’ awards programme, plants must operate the entire year without lost time, and meet other ‘world-class safety’ criteria. Winners in 2009 were:
n Large plant (over 250,000 employee hours per year): Amylum Nisasta (Turkey)
n Small plant (fewer than 250,000 employee hours per year): Plaistow (UK).
Our ‘Flagship’ awards are made by the US and European Safety Committees on a divisional level. Winners in 2009 were:
n US/Asia large plant: Singapore n Europe large plant: Amylum Nisasta (Turkey)n Small plant: Dayton, Ohio (USA).
OutlookWe were saddened to learn that shortly before this report was published, a fatality occured at our joint-venture plant in Turkey. The Board has been informed and a full investigation is under way.
While our employee safety record is good, we want every site to be world class. In order to maintain consistency across Tate & Lyle’s plants and operations, safety leaders from across the Group have developed a new strategic global safety plan for the Group. Going forward, we will measure ourselves annually against world-class safety performance indicators, improving the co-ordination, scope and presentation of safety reporting data to help us identify issues and events in advance. Contractor safety and physical/behavioural auditing and safety training will continue to be areas of focus in 2010.
By implementing the global indicators and promoting the active involvement of management, employees and contractors in our safety efforts, we aim to improve safety performance further and come closer to world-class safety across the Group.
EnvironmentTate & Lyle believes that companies must take steps to manage their impact on the environment. As a consequence we are committed to conducting our business in a manner that is sensitive to the environmental needs of the communities within which we operate. This aim will be achieved by upholding defined, key environmental standards in all of our operations, and we actively encourage our business partners to demonstrate similar levels of commitment.
OverviewManaging our impacts to produce a more positive result is good for the environment and also brings economic benefits to Tate & Lyle. When reviewing our environmental footprint, we focus on those impacts which have most effect on the environment and over which we have direct control. Our three most significant environmental impacts are, in order of magnitude, energy use, water use and non-hazardous solid waste production. Energy use is by far our most significant impact, and therefore has highest priority. In recent years, we have also reported our carbon footprint, an increasingly important global measure of overall environmental performance.
Tate & Lyle’s environmental policy applies to all our locations, and fully integrates environmental management into their operational systems and procedures. The Board reviews the policy and environmental performance annually. The policy can be found on our website, www.tateandlyle.com.
2009 calendar year results We focus our measurement and improvement efforts on the areas with the greatest environmental and financial impact. Compared to 2008 figures, and using normalised indices for consumption per unit of finished product output, our results for the 2009 calendar year were:
n energy consumption remained the same;n water consumption decreased by 4%; and n non-hazardous solid waste production decreased by 24%.
Although we did not meet our target of a per-unit 3% reduction in energy consumption in 2009, we are pleased to report that we have reduced both water consumption and waste production per unit of output, following increases in 2008.
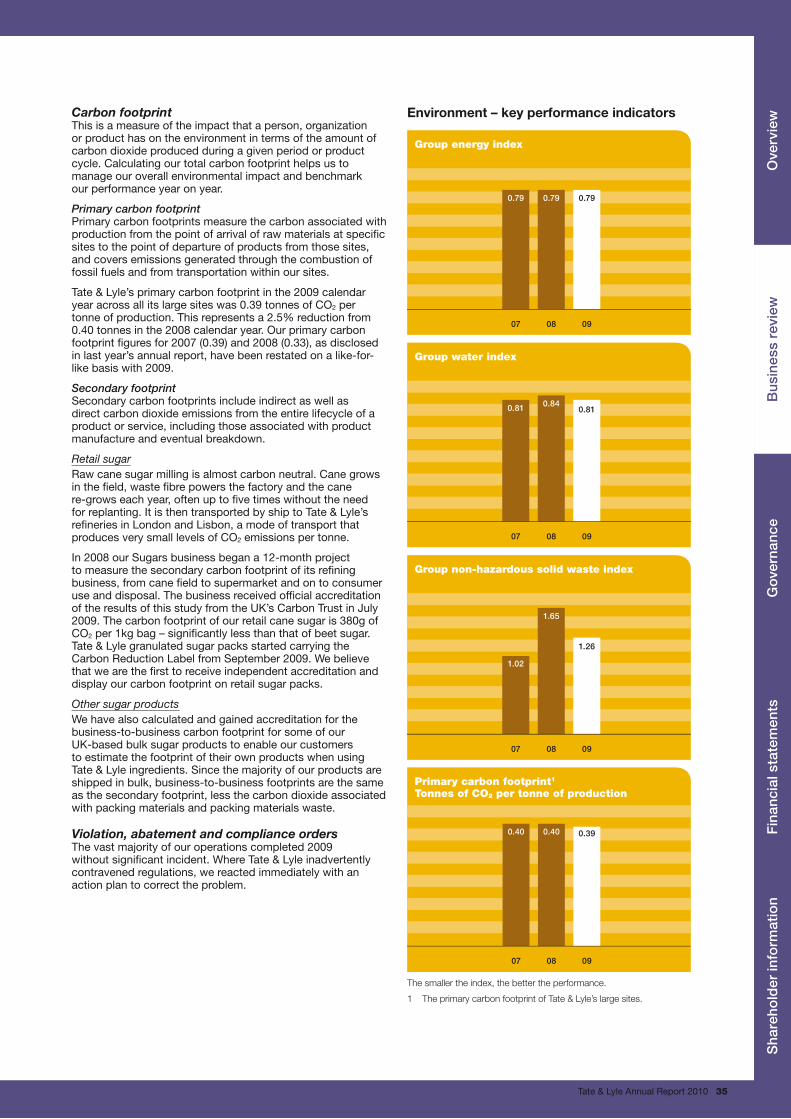
08 09
0.79
07
0.79 0.79
Group energy index
08 09
0.81
07
0.81 0.84
Group water index
08 09
1.26
07
1.02
1.65
Group non-hazardous solid waste index
0.40
08
0.40
07 09
0.39
Primary carbon footprint1
Tonnes of CO2 per tonne of production
Thesmallertheindex,thebettertheperformance.
1 TheprimarycarbonfootprintofTate&Lyle’slargesites.
Tate & Lyle Annual Report 2010 35
Carbon footprint This is a measure of the impact that a person, organization or product has on the environment in terms of the amount of carbon dioxide produced during a given period or product cycle. Calculating our total carbon footprint helps us to manage our overall environmental impact and benchmark our performance year on year.
Primary carbon footprintPrimary carbon footprints measure the carbon associated with production from the point of arrival of raw materials at specific sites to the point of departure of products from those sites, and covers emissions generated through the combustion of fossil fuels and from transportation within our sites.
Tate & Lyle’s primary carbon footprint in the 2009 calendar year across all its large sites was 0.39 tonnes of CO2 per tonne of production. This represents a 2.5% reduction from 0.40 tonnes in the 2008 calendar year. Our primary carbon footprint figures for 2007 (0.39) and 2008 (0.33), as disclosed in last year’s annual report, have been restated on a like-for-like basis with 2009.
Secondary footprint Secondary carbon footprints include indirect as well as direct carbon dioxide emissions from the entire lifecycle of a product or service, including those associated with product manufacture and eventual breakdown.
Retail sugarRaw cane sugar milling is almost carbon neutral. Cane grows in the field, waste fibre powers the factory and the cane re-grows each year, often up to five times without the need for replanting. It is then transported by ship to Tate & Lyle’s refineries in London and Lisbon, a mode of transport that produces very small levels of CO2 emissions per tonne.
In 2008 our Sugars business began a 12-month project to measure the secondary carbon footprint of its refining business, from cane field to supermarket and on to consumer use and disposal. The business received official accreditation of the results of this study from the UK’s Carbon Trust in July 2009. The carbon footprint of our retail cane sugar is 380g of CO2 per 1kg bag – significantly less than that of beet sugar. Tate & Lyle granulated sugar packs started carrying the Carbon Reduction Label from September 2009. We believe that we are the first to receive independent accreditation and display our carbon footprint on retail sugar packs.
Other sugar productsWe have also calculated and gained accreditation for the business-to-business carbon footprint for some of our UK-based bulk sugar products to enable our customers to estimate the footprint of their own products when using Tate & Lyle ingredients. Since the majority of our products are shipped in bulk, business-to-business footprints are the same as the secondary footprint, less the carbon dioxide associated with packing materials and packing materials waste.
Violation, abatement and compliance ordersThe vast majority of our operations completed 2009 without significant incident. Where Tate & Lyle inadvertently contravened regulations, we reacted immediately with an action plan to correct the problem.
Environment – key performance indicators
Sha
reho
lder
info
rmat
ion
Ove
rvie
wB
usin
ess
revi
ewG
over
nanc
eF
inan
cial
sta
tem
ents
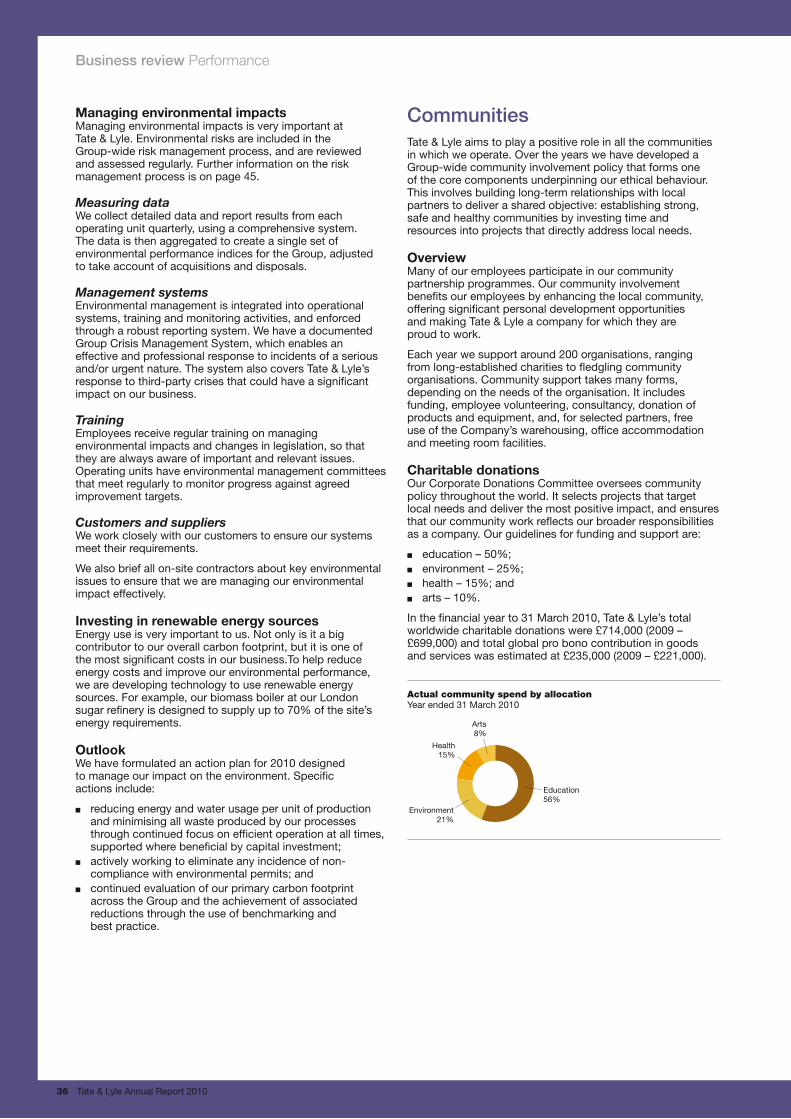
Actual community spend by allocationYear ended 31 March 2010
Education56%
Environment21%
Health15%
Arts8%
36 Tate & Lyle Annual Report 2010
Business review Performance
Managing environmental impactsManaging environmental impacts is very important at Tate & Lyle. Environmental risks are included in the Group-wide risk management process, and are reviewed and assessed regularly. Further information on the risk management process is on page 45.
Measuring dataWe collect detailed data and report results from each operating unit quarterly, using a comprehensive system. The data is then aggregated to create a single set of environmental performance indices for the Group, adjusted to take account of acquisitions and disposals.
Management systemsEnvironmental management is integrated into operational systems, training and monitoring activities, and enforced through a robust reporting system. We have a documented Group Crisis Management System, which enables an effective and professional response to incidents of a serious and/or urgent nature. The system also covers Tate & Lyle’s response to third-party crises that could have a significant impact on our business.
TrainingEmployees receive regular training on managing environmental impacts and changes in legislation, so that they are always aware of important and relevant issues. Operating units have environmental management committees that meet regularly to monitor progress against agreed improvement targets.
Customers and suppliersWe work closely with our customers to ensure our systems meet their requirements.
We also brief all on-site contractors about key environmental issues to ensure that we are managing our environmental impact effectively.
Investing in renewable energy sourcesEnergy use is very important to us. Not only is it a big contributor to our overall carbon footprint, but it is one of the most significant costs in our business.To help reduce energy costs and improve our environmental performance, we are developing technology to use renewable energy sources. For example, our biomass boiler at our London sugar refinery is designed to supply up to 70% of the site’s energy requirements.
OutlookWe have formulated an action plan for 2010 designed to manage our impact on the environment. Specific actions include:
n reducing energy and water usage per unit of production and minimising all waste produced by our processes through continued focus on efficient operation at all times, supported where beneficial by capital investment;
n actively working to eliminate any incidence of non-compliance with environmental permits; and
n continued evaluation of our primary carbon footprint across the Group and the achievement of associated reductions through the use of benchmarking and best practice.
CommunitiesTate & Lyle aims to play a positive role in all the communities in which we operate. Over the years we have developed a Group-wide community involvement policy that forms one of the core components underpinning our ethical behaviour. This involves building long-term relationships with local partners to deliver a shared objective: establishing strong, safe and healthy communities by investing time and resources into projects that directly address local needs.
OverviewMany of our employees participate in our community partnership programmes. Our community involvement benefits our employees by enhancing the local community, offering significant personal development opportunities and making Tate & Lyle a company for which they are proud to work.
Each year we support around 200 organisations, ranging from long-established charities to fledgling community organisations. Community support takes many forms, depending on the needs of the organisation. It includes funding, employee volunteering, consultancy, donation of products and equipment, and, for selected partners, free use of the Company’s warehousing, office accommodation and meeting room facilities.
Charitable donationsOur Corporate Donations Committee oversees community policy throughout the world. It selects projects that target local needs and deliver the most positive impact, and ensures that our community work reflects our broader responsibilities as a company. Our guidelines for funding and support are:
n education – 50%;n environment – 25%;n health – 15%; andn arts – 10%.
In the financial year to 31 March 2010, Tate & Lyle’s total worldwide charitable donations were £714,000 (2009 – £699,000) and total global pro bono contribution in goods and services was estimated at £235,000 (2009 – £221,000).
Find out more about Tate & Lyle at www.tateandlyle.com
Tate & Lyle Annual Report 2010 37
We support many initiatives and organisations involved in community regeneration all round the world. Here is a selection from each of the UK and the USA.
UK
n Community Links: a local charity working to regenerate the area of Newham in east London
n Community Food Enterprise: a social enterprise improving community access to affordable fresh fruit and vegetables in east London
n Richard House Children’s Hospice: London’s first hospice for terminally-ill children, which we have supported since it was founded in 1996
n Tate Britain: supporting art projects for children at this London gallery
n East London Business Alliance (ELBA): we are a founder member of this regeneration agency for east London, which connects business to local people, public and community partners to enable social and economic change. We support ELBA’s initiative to capture long-term benefits from London hosting the 2012 Olympic Games.
USA
n Educational institutions: including Millikin University, Purdue University, the University of Illinois, and Richland Community College
n Decatur Park District: we fund a number of youth activities as well as annual park district events that provide recreational opportunities for the entire community
n Decatur Community Foundation: we are a founder member of this organisation created in 2000 to provide an endowment to support a broad range of programmes that benefit the Decatur, Illinois community.
Employee volunteeringTate & Lyle employees around the world make great efforts to support their local communities. Their involvement is vital to maintain good, long-term relationships. Our employees join local committees, advocate their causes and provide mentoring and business skills.
Volunteering also brings benefits to Tate & Lyle. Employees tell us that they benefit hugely from community work, which helps them develop their skills and become more rounded as individuals. Further information on some of our employees’ volunteering activities around the world can be found on our website, www.tateandlyle.com.
OutlookWe continue to encourage our employees around the world to get involved in supporting their communities. In 2010, we will be focusing our spend more closely to ensure it is used in areas where it can be most beneficial.
Sha
reho
lder
info
rmat
ion
Ove
rvie
wB
usin
ess
revi
ewG
over
nanc
eF
inan
cial
sta
tem
ents
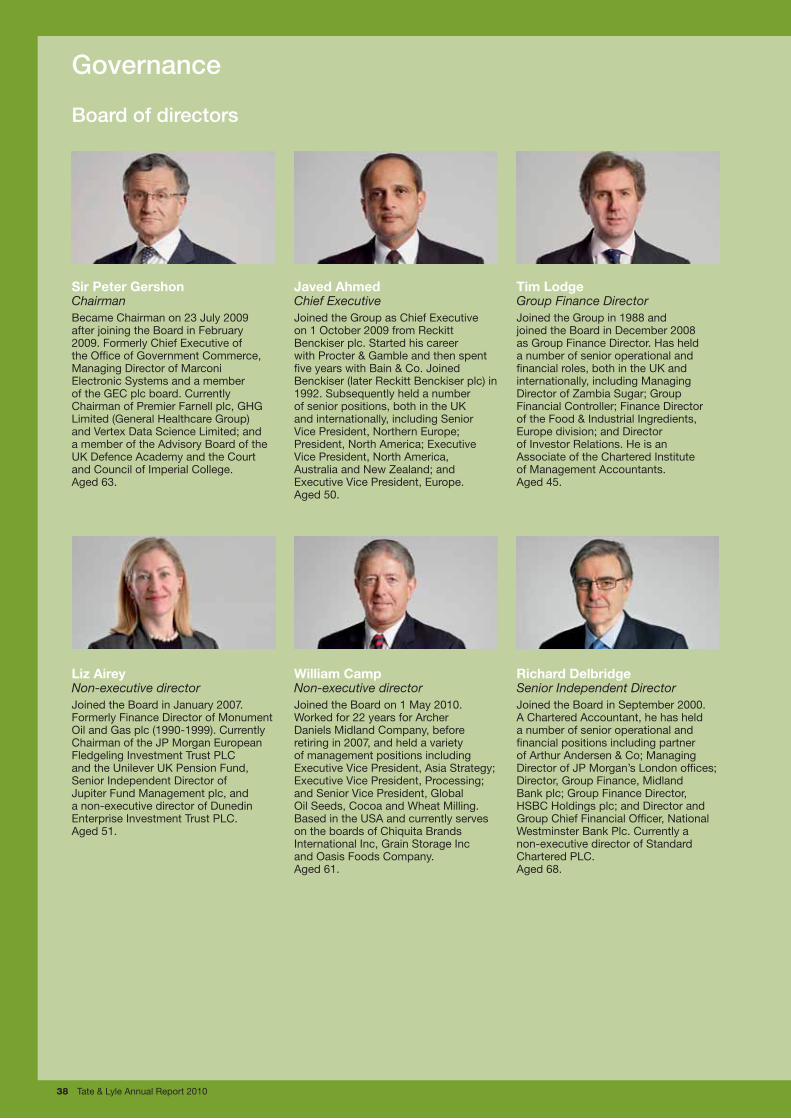
38 Tate & Lyle Annual Report 2010
Governance
Sir Peter GershonChairmanBecame Chairman on 23 July 2009 after joining the Board in February 2009. Formerly Chief Executive of the Office of Government Commerce, Managing Director of Marconi Electronic Systems and a member of the GEC plc board. Currently Chairman of Premier Farnell plc, GHG Limited (General Healthcare Group) and Vertex Data Science Limited; and a member of the Advisory Board of the UK Defence Academy and the Court and Council of Imperial College. Aged 63.
Javed AhmedChief ExecutiveJoined the Group as Chief Executive on 1 October 2009 from Reckitt Benckiser plc. Started his career with Procter & Gamble and then spent five years with Bain & Co. Joined Benckiser (later Reckitt Benckiser plc) in 1992. Subsequently held a number of senior positions, both in the UK and internationally, including Senior Vice President, Northern Europe; President, North America; Executive Vice President, North America, Australia and New Zealand; and Executive Vice President, Europe. Aged 50.
Tim LodgeGroup Finance DirectorJoined the Group in 1988 and joined the Board in December 2008 as Group Finance Director. Has held a number of senior operational and financial roles, both in the UK and internationally, including Managing Director of Zambia Sugar; Group Financial Controller; Finance Director of the Food & Industrial Ingredients, Europe division; and Director of Investor Relations. He is an Associate of the Chartered Institute of Management Accountants. Aged 45.
Board of directors
Liz AireyNon-executive directorJoined the Board in January 2007. Formerly Finance Director of Monument Oil and Gas plc (1990-1999). Currently Chairman of the JP Morgan European Fledgeling Investment Trust PLC and the Unilever UK Pension Fund, Senior Independent Director of Jupiter Fund Management plc, and a non-executive director of Dunedin Enterprise Investment Trust PLC. Aged 51.
William CampNon-executive directorJoined the Board on 1 May 2010. Worked for 22 years for Archer Daniels Midland Company, before retiring in 2007, and held a variety of management positions including Executive Vice President, Asia Strategy; Executive Vice President, Processing; and Senior Vice President, Global Oil Seeds, Cocoa and Wheat Milling. Based in the USA and currently serves on the boards of Chiquita Brands International Inc, Grain Storage Inc and Oasis Foods Company. Aged 61.
Richard DelbridgeSenior Independent DirectorJoined the Board in September 2000. A Chartered Accountant, he has held a number of senior operational and financial positions including partner of Arthur Andersen & Co; Managing Director of JP Morgan’s London offices; Director, Group Finance, Midland Bank plc; Group Finance Director, HSBC Holdings plc; and Director and Group Chief Financial Officer, National Westminster Bank Plc. Currently a non-executive director of Standard Chartered PLC. Aged 68.
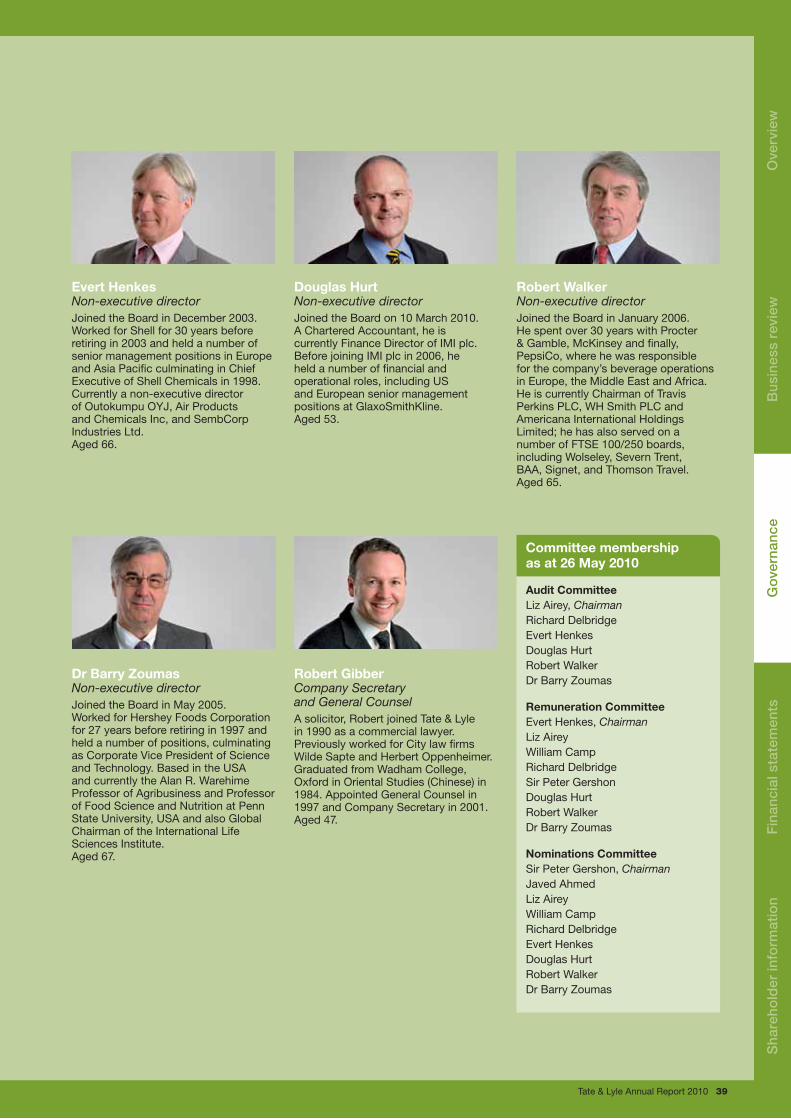
Tate & Lyle Annual Report 2010 39
Evert HenkesNon-executive directorJoined the Board in December 2003. Worked for Shell for 30 years before retiring in 2003 and held a number of senior management positions in Europe and Asia Pacific culminating in Chief Executive of Shell Chemicals in 1998. Currently a non-executive director of Outokumpu OYJ, Air Products and Chemicals Inc, and SembCorp Industries Ltd. Aged 66.
Douglas HurtNon-executive directorJoined the Board on 10 March 2010. A Chartered Accountant, he is currently Finance Director of IMI plc. Before joining IMI plc in 2006, he held a number of financial and operational roles, including US and European senior management positions at GlaxoSmithKline. Aged 53.
Robert WalkerNon-executive directorJoined the Board in January 2006. He spent over 30 years with Procter & Gamble, McKinsey and finally, PepsiCo, where he was responsible for the company’s beverage operations in Europe, the Middle East and Africa. He is currently Chairman of Travis Perkins PLC, WH Smith PLC and Americana International Holdings Limited; he has also served on a number of FTSE 100/250 boards, including Wolseley, Severn Trent, BAA, Signet, and Thomson Travel. Aged 65.
Dr Barry ZoumasNon-executive directorJoined the Board in May 2005. Worked for Hershey Foods Corporation for 27 years before retiring in 1997 and held a number of positions, culminating as Corporate Vice President of Science and Technology. Based in the USA and currently the Alan R. Warehime Professor of Agribusiness and Professor of Food Science and Nutrition at Penn State University, USA and also Global Chairman of the International Life Sciences Institute. Aged 67.
Robert GibberCompany Secretary and General CounselA solicitor, Robert joined Tate & Lyle in 1990 as a commercial lawyer. Previously worked for City law firms Wilde Sapte and Herbert Oppenheimer. Graduated from Wadham College, Oxford in Oriental Studies (Chinese) in 1984. Appointed General Counsel in 1997 and Company Secretary in 2001. Aged 47.
Committee membership as at 26 May 2010
Audit CommitteeLiz Airey, Chairman Richard DelbridgeEvert HenkesDouglas Hurt Robert WalkerDr Barry Zoumas
Remuneration CommitteeEvert Henkes, Chairman Liz Airey William CampRichard DelbridgeSir Peter GershonDouglas Hurt Robert WalkerDr Barry Zoumas
Nominations CommitteeSir Peter Gershon, ChairmanJaved Ahmed Liz AireyWilliam CampRichard Delbridge Evert HenkesDouglas HurtRobert Walker Dr Barry Zoumas
Sha
reho
lder
info
rmat
ion
Ove
rvie
wB
usin
ess
revi
ewG
over
nanc
eF
inan
cial
sta
tem
ents

Governance Executive management
Executive management
The members of the Group Executive Committee as at 26 May 2010 are as follows:
Javed Ahmed Chief Executive (Chairman of the Committee)
Tim LodgeGroup Finance Director
Robert GibberCompany Secretary and General Counsel
Ian BaconChief Executive, Sugars
Karl KramerPresident, Sucralose
Rob LuijtenGroup Human Resources Director
Olivier RigaudPresident, Food & Industrial Ingredients, Europe
Matt Wineinger President, Food & Industrial Ingredients, Americas
Olivier RigaudPresident,
Speciality Food Ingredients
Matt Wineinger President,
Bulk Ingredients
Ian BaconPresident, Sugars
Karl Kramer President,
Innovation and Commercial Development
Javed Ahmed Chief Executive
Tim LodgeChief Financial
Officer
Rob LuijtenExecutive Vice
President, Human Resources
Robert Gibber Executive Vice
President, Company
Secretary and General Counsel
Executive managementThe Group Executive Committee oversees the development and execution of the Group’s strategy, and has overall responsibility for achieving business results.
The biographies for Javed Ahmed, Tim Lodge and Robert Gibber are on pages 38 and 39.
Ian BaconChief Executive, SugarsJoined Tate & Lyle in November 2005 and became Chief Executive, Sugars in January 2006. A graduate of Birmingham University, Ian began his 26-year career with Unilever in 1979, holding a number of senior positions including Vice President, Global Customer Development; Vice President, Operations North Africa, Middle East and Turkey; and General Manager, Birds Eye Wall’s.
Karl KramerPresident, SucraloseJoined Tate & Lyle in April 2008 and became President, Sucralose in June 2008. A graduate of Chemical Engineering from the New Jersey Institute of Technology, Karl also holds an MBA from the New York University Stern School of Business. Began his career in R&D at General Foods and then worked in brand management for Nestlé, and in international sales for the NutraSweet Kelco Division of Monsanto. Before joining Tate & Lyle, Karl held various international general management roles in the flavour division of Givaudan.
Rob LuijtenGroup Human Resources DirectorJoined Tate & Lyle in February 2010. Holds a Masters degree in Human Resource Studies from Tilburg University and began his career with Inamed Corporation before spending ten years with GE Plastics where he held a number of senior human resources roles in both Europe and Asia, including five years based in Shanghai as Human Resources Director, Asia Pacific. Subsequently joined BG Group PLC where he was Human Resources Director, Africa, Middle East and Asia until 2009.
Olivier RigaudPresident, Food & Industrial Ingredients, EuropeJoined Tate & Lyle (Amylum business) in 1988 as a sales manager in France. A chemistry graduate, he has held various management positions within Tate & Lyle, including in industrial products, liquid sweeteners and alcohol sales. In 2000, Olivier became Vice President Food Ingredients, Europe and was appointed President, Food & Industrial Ingredients, Europe in 2008.
Matt WineingerPresident, Food & Industrial Ingredients, AmericasJoined Tate & Lyle in March 2008 and became President, Food & Industrial Ingredients, Americas in July 2008. A graduate of Kansas State University, Matt started his career in the Food Products Division at Procter & Gamble and then worked in a variety of roles for Monsanto and later Cargill, where he became President of Sales, Marketing and Research & Development in 2002 for its Meat
Executive management structure from 1 June 2010
As explained in the Chief Executive’s review on page 6, from 1 June 2010 we will reorganise and operate through three global business units: Speciality Food Ingredients, Bulk Ingredients and Sugars.
A new unit, the Innovation and Commercial Development group, will be established.
The composition of the Group Executive Committee is shown in the diagram below.
Solutions platform. Subsequently joined Swift and Co, where he was President of its Australian Meat Holdings division until 2007.
40 Tate & Lyle Annual Report 2010

Tate & Lyle Annual Report 2010 41
Compliance with the Combined CodeAs a UK-listed company, Tate & Lyle is required to state whether it has complied with the provisions in Section 1 of the Financial Reporting Council’s (FRC) Combined Code on Corporate Governance (as updated in 2008) (the Code) during the financial year under review. The Code is available from the FRC’s website (www.frc.org.uk). The Board confirms that the Company has complied with all these provisions during the financial year ended 31 March 2010.
This report, together with the directors’ remuneration report, provides details of how the Company applies the principles and complies with the provisions of the Code.
Board of directorsThe Board is collectively responsible for promoting the success of the Company and for providing entrepreneurial leadership within a framework of prudent and effective controls that enable risk to be assessed and managed. It sets the Company’s objectives and ensures that it has the necessary financial resources and people to meet them, and reviews management performance. The Board also sets the Company’s values and standards and ensures that its obligations to shareholders and others are met.
The Board has a schedule of matters reserved to it for its decision. This schedule is reviewed annually and includes approval of:
n Group strategy;n annual budget and operating plans;n major capital expenditure, acquisitions or divestments;n full-year and half-year results and interim
management statements;n safety and environmental policies;n Board and Company Secretary appointments;n senior management structure, responsibilities and
succession plans;n treasury policies;n directors’ conflicts of interest;n system of internal control and risk management; andn dividend policy.
Other responsibilities are delegated to Board Committees, which operate within defined terms of reference. Details of these are given in the Board Committees section.
The directors’ responsibilities for the preparation of financial statements are explained on page 57 and their statement on going concern is on page 31.
Board balance and independenceAt the date of this report, the Board comprises the Chairman, who has no executive responsibilities, two executive directors and seven non-executive directors. The names and biographies of the directors are in the Board of directors section.
Sir David Lees ceased to be a director on 23 July 2009 and Sir Peter Gershon succeeded him as Chairman of the Company on the same day. Iain Ferguson ceased to be a director on 1 October 2009 and Javed Ahmed succeeded him as Chief Executive and as a director of the Company on the same day. Douglas Hurt and William Camp were appointed non-executive directors with effect from 10 March 2010 and 1 May 2010 respectively.
With the exception of the Chairman, who is presumed under the Code not to be independent, the Board considers all the non-executive directors to be independent.
The Board has appointed a Senior Independent Director, Richard Delbridge, who is available to shareholders if they have any issues or concerns, and leads the annual review of the Chairman’s performance. The Board has appointed Robert Walker to succeed Richard Delbridge as Senior Independent Director with effect from the close of the 2010 Annual General Meeting (AGM), when Richard will cease to be a director.
The non-executive directors have a wide range of skills and knowledge and combine broad business and commercial experience with independent and objective judgement.
The terms and conditions of appointment of the non-executive directors can be inspected at the Company’s registered office and will be available for inspection at the AGM.
Chairman and Chief ExecutiveThe roles of the Chairman and Chief Executive are separated and their responsibilities are clearly established, set out in writing and agreed by the Board. The Chairman is responsible for the leadership and workings of the Board and ensuring its effectiveness, while the Chief Executive is responsible for running the business and implementing strategy and policy.
The other significant commitments of the Chairman, Sir Peter Gershon, are set out on page 38. The Board is satisfied that they do not restrict him from carrying out his duties as Chairman effectively.
Re-election of directorsThe Company’s Articles of Association require all directors to seek re-election by shareholders at least once every three years. In addition, any directors appointed by the Board must stand for re-election at the first AGM following his or her appointment. Any non-executive directors who have served for more than nine years are subject to annual re-election.
The FRC’s review of the Code recognised the importance of the Chairman in setting the tone for the rest of the Board. In light of public statements ahead of the publication of the new UK Corporate Governance Code, it has been decided that the Chairman will seek re-election at the forthcoming AGM.
The directors standing for re-election this year are Liz Airey and Evert Henkes, who were last re-elected in 2007, and Javed Ahmed, Douglas Hurt and William Camp, who were appointed since the last AGM. The Chairman, Sir Peter Gershon, will also stand for re-election. The directors standing for re-election, with the exception of Javed Ahmed, do not have service contracts.
At no time during the year has any director had any material interest in a contract with the Group, being a contract of significance in relation to the Group’s business. A statement of directors’ interests in Company shares is on page 56.
Corporate governanceTate & Lyle is committed to high standards of corporate governance which the Board believes are central to achieving the Group’s objectives and maximising shareholder value.
Sha
reho
lder
info
rmat
ion
Ove
rvie
wB
usin
ess
revi
ewG
over
nanc
eF
inan
cial
sta
tem
ents
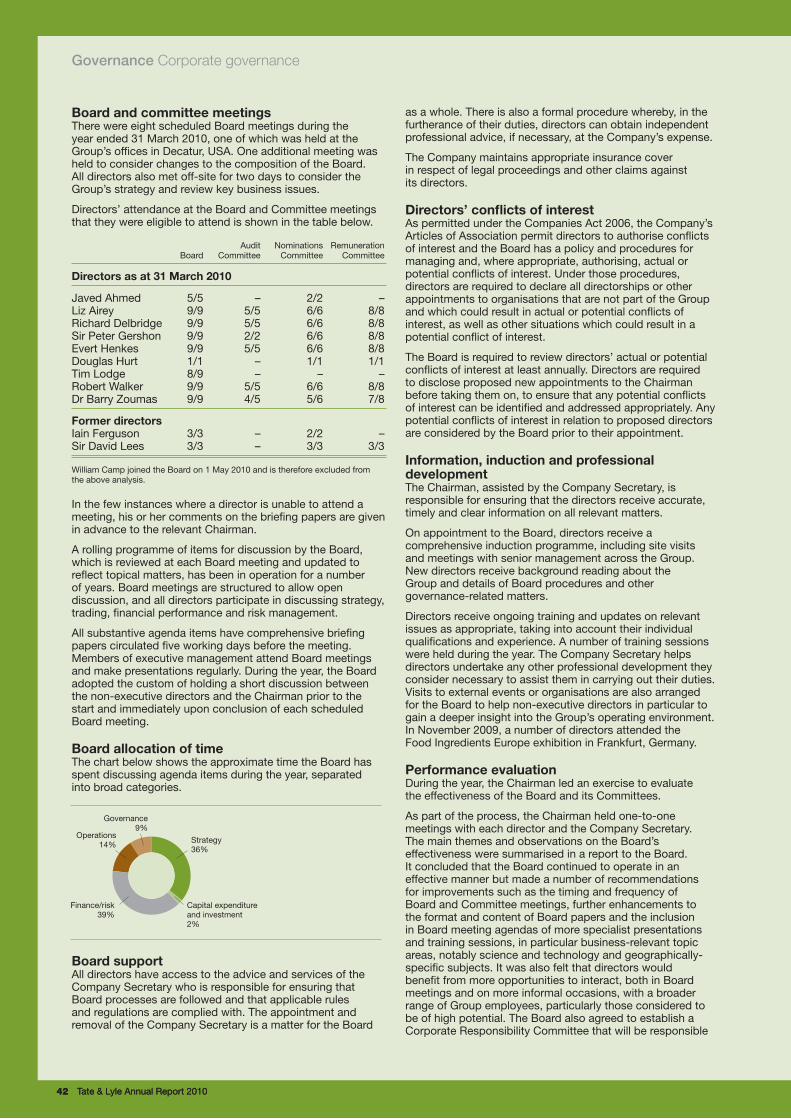
Governance Corporate governance
42 Tate & Lyle Annual Report 201042 Tate & Lyle Annual Report 2010
Board and committee meetingsThere were eight scheduled Board meetings during the year ended 31 March 2010, one of which was held at the Group’s offices in Decatur, USA. One additional meeting was held to consider changes to the composition of the Board. All directors also met off-site for two days to consider the Group’s strategy and review key business issues.
Directors’ attendance at the Board and Committee meetings that they were eligible to attend is shown in the table below.
Audit Nominations Remuneration Board Committee Committee Committee
Directors as at 31 March 2010
Javed Ahmed 5/5 – 2/2 –Liz Airey 9/9 5/5 6/6 8/8Richard Delbridge 9/9 5/5 6/6 8/8Sir Peter Gershon 9/9 2/2 6/6 8/8Evert Henkes 9/9 5/5 6/6 8/8Douglas Hurt 1/1 – 1/1 1/1Tim Lodge 8/9 – – –Robert Walker 9/9 5/5 6/6 8/8Dr Barry Zoumas 9/9 4/5 5/6 7/8
Former directors Iain Ferguson 3/3 – 2/2 –Sir David Lees 3/3 – 3/3 3/3
William Camp joined the Board on 1 May 2010 and is therefore excluded from the above analysis.
In the few instances where a director is unable to attend a meeting, his or her comments on the briefing papers are given in advance to the relevant Chairman.
A rolling programme of items for discussion by the Board, which is reviewed at each Board meeting and updated to reflect topical matters, has been in operation for a number of years. Board meetings are structured to allow open discussion, and all directors participate in discussing strategy, trading, financial performance and risk management.
All substantive agenda items have comprehensive briefing papers circulated five working days before the meeting. Members of executive management attend Board meetings and make presentations regularly. During the year, the Board adopted the custom of holding a short discussion between the non-executive directors and the Chairman prior to the start and immediately upon conclusion of each scheduled Board meeting.
Board allocation of time The chart below shows the approximate time the Board has spent discussing agenda items during the year, separated into broad categories.
Board supportAll directors have access to the advice and services of the Company Secretary who is responsible for ensuring that Board processes are followed and that applicable rules and regulations are complied with. The appointment and removal of the Company Secretary is a matter for the Board
as a whole. There is also a formal procedure whereby, in the furtherance of their duties, directors can obtain independent professional advice, if necessary, at the Company’s expense.
The Company maintains appropriate insurance cover in respect of legal proceedings and other claims against its directors.
Directors’ conflicts of interestAs permitted under the Companies Act 2006, the Company’s Articles of Association permit directors to authorise conflicts of interest and the Board has a policy and procedures for managing and, where appropriate, authorising, actual or potential conflicts of interest. Under those procedures, directors are required to declare all directorships or other appointments to organisations that are not part of the Group and which could result in actual or potential conflicts of interest, as well as other situations which could result in a potential conflict of interest.
The Board is required to review directors’ actual or potential conflicts of interest at least annually. Directors are required to disclose proposed new appointments to the Chairman before taking them on, to ensure that any potential conflicts of interest can be identified and addressed appropriately. Any potential conflicts of interest in relation to proposed directors are considered by the Board prior to their appointment.
Information, induction and professional developmentThe Chairman, assisted by the Company Secretary, is responsible for ensuring that the directors receive accurate, timely and clear information on all relevant matters.
On appointment to the Board, directors receive a comprehensive induction programme, including site visits and meetings with senior management across the Group. New directors receive background reading about the Group and details of Board procedures and other governance-related matters.
Directors receive ongoing training and updates on relevant issues as appropriate, taking into account their individual qualifications and experience. A number of training sessions were held during the year. The Company Secretary helps directors undertake any other professional development they consider necessary to assist them in carrying out their duties. Visits to external events or organisations are also arranged for the Board to help non-executive directors in particular to gain a deeper insight into the Group’s operating environment. In November 2009, a number of directors attended the Food Ingredients Europe exhibition in Frankfurt, Germany.
Performance evaluationDuring the year, the Chairman led an exercise to evaluate the effectiveness of the Board and its Committees.
As part of the process, the Chairman held one-to-one meetings with each director and the Company Secretary. The main themes and observations on the Board’s effectiveness were summarised in a report to the Board. It concluded that the Board continued to operate in an effective manner but made a number of recommendations for improvements such as the timing and frequency of Board and Committee meetings, further enhancements to the format and content of Board papers and the inclusion in Board meeting agendas of more specialist presentations and training sessions, in particular business-relevant topic areas, notably science and technology and geographically-specific subjects. It was also felt that directors would benefit from more opportunities to interact, both in Board meetings and on more informal occasions, with a broader range of Group employees, particularly those considered to be of high potential. The Board also agreed to establish a Corporate Responsibility Committee that will be responsible
Strategy36%
Capital expenditureand investment2%
Finance/risk39%
Operations14%
Governance9%
Tate & Lyle Annual Report 2010 43Tate & Lyle Annual Report 2010 43
for reviewing and monitoring the processes and measures used to manage social, environmental and ethical risks and will assist the Board to enhance its strategy and policies in this area. The Committee will report to the Board and will be chaired by the Chairman of the Board. Other actions arising from the performance evaluation are being or will be taken to address the matters raised, with progress monitored by the Company Secretary.
With regard to the performance of individual directors, the Chairman concluded that all directors continue to make an effective contribution to the Board’s work, are well prepared and informed about issues they need to consider, and that their commitment remains strong.
During the year, the non-executive directors met together without the Chairman, under the chairmanship of the Senior Independent Director, to appraise the Chairman’s performance (the Senior Independent Director having first sought the views of the executive directors). In addition, the Chairman held a private meeting with the non-executive directors to appraise the Chief Executive’s performance and to address any other matters the non-executive directors wished to raise.
The Audit, Nominations and Remuneration Committees also undertook an evaluation of their work and effectiveness during the year, the results of which were reported to the Board by the respective Committee Chairmen. The reviews concluded that each Committee operated effectively throughout the year.
Shareholder communicationsThe Chief Executive, Group Finance Director and Director of Investor Relations maintain a regular programme of visits and presentations to major institutional shareholders both in the UK and overseas. The Chairman and Senior Independent Director participate in this programme as appropriate and the Chairman provides feedback to the Board on any matters raised with him by major shareholders. Both Sir Peter Gershon and Javed Ahmed undertook separate visits to major institutional shareholders following their respective appointments during the year.
The Investor Relations department provides the Board with a detailed report on any meetings with major institutional shareholders at each scheduled Board meeting. All directors receive copies of analysts’ reports on the Company and the Board is briefed periodically by the Company’s financial advisers on investors’ perceptions of Tate & Lyle and its investor relations activities.
The non-executive directors are encouraged to attend presentations to analysts and shareholders, and the full-year and half-year results presentations.
The Company aims to present a balanced and clear assessment in all its reports to the public and to regulators. Key announcements, financial reports and other information about the Group can be found on the Company’s website at www.tateandlyle.com.
Annual General Meeting (AGM)The 2010 AGM will be held at the Queen Elizabeth II Conference Centre in London, on Thursday 22 July 2010 at 11.00 am. Full details are set out in the Notice of Meeting.
Shareholders who attend the AGM have the opportunity to put questions to the Board on matters relating to the Group’s operations and performance. Approximately 200 shareholders attended the 2009 AGM. The level of proxy votes received in respect of each resolution, together with the level of abstentions, are announced to shareholders at the AGM, notified to the market and published on the Company’s website.
Share capitalAt 31 March 2010, the Company had nominal issued ordinary and preference share capital of £117 million comprising £115 million in ordinary shares, including £0.1 million in treasury shares, and £2 million in preference shares.
To satisfy obligations under employee share plans, the Company issued 48,287 ordinary shares during the year and reissued 816,012 ordinary shares from treasury. The Company did not issue any ordinary shares or reissue any ordinary shares from treasury during the period from 1 April 2010 to 26 May 2010.
Further information about share capital is on page 91. Information about options granted under the Company’s employee share schemes is on pages 93 and 94.
The Company was given authority at the 2009 AGM to make market purchases of up to 45,868,000 of its own ordinary shares. The Company made no such purchases during the year ended 31 March 2010. This authority will expire at the 2010 AGM and approval will be sought from shareholders for a similar authority to be given for a further year.
Substantial shareholdingsAt 26 May 2010, the Company had been notified under Rule 5 of the Disclosure and Transparency Rules of the Financial Services Authority of the following holdings of voting rights in its shares:
No. of shares % held
INVESCO plc 73,462,349 15.97Harbinger Capital Partners LLC 42,313,670 9.21AXA S.A. 22,890,148 4.98Lehman Brothers International (Europe) 18,122,510 3.95Legal & General Group plc 18,062,288 3.93Barclays Global Investors 17,568,133 3.59
Articles of AssociationThe Articles of Association set out the internal regulation of the Company and cover such matters as the rights of shareholders, the appointment or removal of directors and the conduct of the Board and general meetings. Copies are available on request and are displayed on the Company’s website at www.tateandlyle.com.
In accordance with the Articles of Association, directors can be appointed or removed by the Board or by shareholders in general meeting. Amendments to the Articles of Association have to be approved by at least 75% of those voting in person or by proxy at a general meeting of the Company. Subject to UK company law and the Articles of Association, the directors may exercise all the powers of the Company, and may delegate authorities to committees, and day-to-day management and decision making to individual executive directors. Details of the main Board Committees can be found on pages 44 to 45.
A special resolution will be put to the 2010 AGM to adopt new Articles of Association reflecting changes arising from the implementation of the final sections of the Companies Act 2006 and the Shareholders’ Rights Directive.
Board CommitteesThere are three main Board Committees: Remuneration, Nominations and Audit. The terms of reference of each Committee, which are reviewed annually by the Board, are available on the Company’s website, www.tateandlyle.com, or from the Company Secretariat at the registered office.
Sha
reho
lder
info
rmat
ion
Ove
rvie
wB
usin
ess
revi
ewG
over
nanc
eF
inan
cial
sta
tem
ents
Governance Corporate governance
44 Tate & Lyle Annual Report 2010
The Committees are supported by the services of the Company Secretariat and, if necessary, can obtain independent professional advice at the Company’s expense. The Company Secretary, Robert Gibber, is Secretary to each Board Committee.
Remuneration CommitteeThe Committee comprises the independent non-executive directors and the Chairman of the Board. The members of the Committee at the date of this report are shown on page 39.
The Committee meets as required, usually before each Board meeting, and has a formal calendar of items for consideration.
The Committee determines the remuneration packages of each executive director and the other members of the Group Executive Committee. These include base salary, bonus, long-term incentives, benefits and terms of employment, including those upon which their service may be terminated. The Committee also determines the base salary, long-term incentives and benefits of certain other senior executives. In consultation with the Chief Executive, the Committee determines the remuneration of the Chairman. The remuneration of non-executive directors is determined by the executive directors and the Chairman. More information on policy, practice and the workings of the Committee can be found in the directors’ remuneration report.
Nominations CommitteeThe Committee comprises the non-executive directors and the Chief Executive under the chairmanship of the Chairman of the Board (except when the Committee is dealing with the appointment of a successor to the Chairman, when the Senior Independent Director chairs the Committee).
The members of the Committee at the date of this report are shown on page 39. Sir Peter Gershon succeeded Sir David Lees as Chairman of the Committee on 23 July 2009. Iain Ferguson ceased to be a member of the Committee on 1 October 2009 and Javed Ahmed joined the Committee on the same day. Douglas Hurt and William Camp joined the Committee on 10 March and 1 May 2010 respectively.
The main responsibilities of the Committee are to:
n review the size and composition of the Board, including succession planning, and the leadership needs of the Group generally;
n recommend candidates for appointment as executive and non-executive directors and as Company Secretary, taking into account the balance of the Board and the required blend of skills and experience;
n make recommendations on the processes for theappointment of the Chairman of the Board;
n review annually the performance of each member of the Group Executive Committee and to report on that review to the Remuneration Committee; and
n make recommendations on the nomination of the Senior Independent Director, the reappointment of non-executive directors upon the expiry of their term of office, and the proposed re-election of directors retiring by rotation at the AGM.
In May 2009, and as disclosed in the Annual Report 2009, after a competitive selection process which was undertaken with the assistance of external recruitment consultants, the Committee recommended that Javed Ahmed be appointed Chief Executive. The recommendation was approved by the Board and Javed Ahmed joined the Board on 1 October 2009.
The Nominations Committee is responsible for succession planning for non-executive directors to ensure that directors are recruited to fill actual or forthcoming vacancies.
When recruiting non-executive directors the Committee considers the particular skills, knowledge and experience that would most benefit the Board and engages external recruitment consultants. During the year, external recruitment consultants were engaged to assist in the search for two additional non-executive directors. Following a detailed selection process the Committee recommended that Douglas Hurt and William Camp join the Board. The recommendations were approved by the Board and they joined the Board on 10 March and 1 May 2010 respectively.
Audit CommitteeThe Committee comprises solely independent non-executive directors.
The members of the Committee at the date of this report are shown on page 39. Sir Peter Gershon ceased to be a member of the Committee on 23 July 2009. Douglas Hurt joined the Committee on 10 March 2010.
All the Committee members have extensive management experience in large international organisations. The Chairman, Liz Airey, is an investment banker and former finance director of Monument Oil and Gas plc, and Douglas Hurt is Finance Director at IMI plc.
The Committee meets at least five times each year. The Chairman of the Company, Chief Executive, Group Finance Director, Head of Global Risk and Assurance (who leads the internal audit function) and other members of the senior management team (as invited by the Committee), together with the external auditors, usually attend meetings. The minutes of each meeting are circulated to the Board. Both the Head of Global Risk and Assurance and the external auditors have direct access to, and meet regularly with, the Chairman of the Committee outside formal Committee meetings.
The Committee maintains a formal calendar of items for consideration at each meeting and within the annual audit cycle to ensure that its work is in line with the requirements of the Code.
The main responsibilities of the Committee are to:
n oversee the Group’s financial reporting process and monitor the integrity of the full-year and half-year financial statements and any formal announcements relating to the Company’s financial performance, paying particular attention to significant reporting judgements contained therein, including critical accounting policies and practices;
n review the Group’s internal financial controls and its internal control and risk management systems;
n review and monitor the external auditors’ independenceand objectivity and the effectiveness of the audit process, taking into consideration relevant UK professional and regulatory requirements;
n make recommendations for submission to shareholdersfor their approval in general meeting as to the appointment, reappointment and removal of the external auditors and to approve their remuneration and terms of engagement;
n monitor and review the effectiveness of the internalaudit function;
n develop and implement a policy on the engagement of the external auditors to supply non-audit-related services; and
n review arrangements by which employees may, inconfidence, raise concerns about possible improprieties in matters of financial reporting, financial control or other matters.
Tate & Lyle Annual Report 2010 45
During the year and up to the date of this annual report, the Audit Committee discharged its responsibilities as set out in its terms of reference by undertaking the following work:
n meeting prior to the Board meetings at which the annual report and financial statements, the half-year report and interim management statements were approved. In doing so, the Committee reviewed significant accounting policies, financial reporting issues and judgements and reports from the external auditors; n reviewing the effectiveness of the external audit process,
the external auditors’ strategy and plan for the audit, and the qualifications, expertise, resources and independence of the external auditors;
n agreeing the terms of engagement and fee of the externalauditors for the audit;
n reviewing the policy on auditor independence and thebasis of the provision of non-audit-related services by the external auditors;
n meeting with representatives of the external auditors in the USA (while on a scheduled site visit);
n receiving and considering regular reports from the Headof Global Risk and Assurance on the Group’s risk management system, findings from reviews of internal financial controls, and the remit, organisation, annual plan and resources of the internal audit function;
n undertaking a review of the effectiveness of the internal audit function, with the assistance of Independent Audit Limited. The review concluded that the internal audit function had greatly strengthened over the last few years and was making a significant contribution to the internal governance of the Group. Further development will be necessary to ensure that the internal audit function continues to meet the Group’s needs which will evolve with the implementation of the Group’s strategy. In addition, some opportunities to improve processes and practices were identified and are being implemented;
n again with the assistance of Independent Audit Limited, undertaking a review of the effectiveness of the external auditors, the outcome of which is reported below;
n reviewing the Committee’s terms of reference and its effectiveness. The review in 2010 concluded that no substantive amendments to the terms of reference were required and that the Committee had fulfilled its role and responsibilities appropriately;
n reviewing the annual report disclosure items relevant tothe Committee, including the going concern statement and the reports on risk management and internal control;
n reviewing the potential impact on the Group’s financialstatements of significant corporate governance and accounting statements;
n reviewing the findings of the external auditors, their management letters on accounting procedures and internal financial controls and audit representation letters;
n meeting separately with the Chief Executive, GroupFinance Director, external auditors and the Head of Global Risk and Assurance in order to understand any concerns relevant to the Audit Committee that they might have;
n reviewing procedures under which employees may, inconfidence, raise concerns about possible improprieties in matters of financial reporting, financial control or other matters; and
n reviewing an annual report on the Group’s systems ofinternal control and its effectiveness, and reporting the results of the review to the Board.
The Committee operates a policy to safeguard the objectivity and independence of the external auditors. This policy sets out certain disclosure requirements by the external auditors to the Committee; restrictions on the employment of the external auditors’ former employees; partner rotation; and procedures for the approval of non-audit-related services provided by the external auditors. During the year, the Committee reviewed the processes that the external auditors have in place to safeguard their independence and received a letter from them confirming that, in their opinion, they remained independent.
The procedure for the provision of non-audit-related services by the external auditors is governed by a schedule appended to the policy on auditor independence. It states the services that the external auditors are not permitted to provide and those that the external auditors may provide, together with the appropriate approvals processes.
The Committee receives a regular report setting out the non-audit-related services provided by the external auditors during the year and the fees charged. Details of the amounts paid to the external auditors are given in Note 8 on page 74. Having undertaken a review of the non-audit-related services provided during the year, the Committee is satisfied that these services did not prejudice the external auditors’ independence.
In light of the long-standing nature of Pricewaterhouse-Coopers LLP’s tenure as the external auditors of the Group’s accounts, the Audit Committee appointed Independent Audit Limited to undertake a review of the external auditors during the year. The review concluded that Pricewaterhouse-Coopers LLP provided a good service to Tate & Lyle and advised that there was no need to undertake a tender for the audit. The Committee concurred with these conclusions. The Committee also reviewed the fees paid to other audit firms for services during the year ended 31 March 2010 and noted that there were no contractual obligations that would restrict the Committee’s choice of external auditors should it decide that any change was appropriate. The Committee recommended to the Board that PricewaterhouseCoopers LLP continue to act as auditors to the Group. PricewaterhouseCoopers LLP have indicated their willingness to continue in office, and a resolution that they be re-appointed will be proposed at the AGM.
Risk management The Board of directors has overall responsibility for the Group’s system of internal control and risk management. The schedule of matters reserved to the Board ensures that the directors control, among other matters, all significant strategic, financial and organisational issues.
The Group’s enterprise-wide risk management and reporting process helps Group management to identify, assess, prioritise and mitigate risk. The process involves an ongoing programme of workshops, facilitated by the risk management function, held around the Group. The risks identified are collated and reported through functional and divisional levels to the Group Executive Committee. This culminates in the identification of the Group’s key business, financial, operational and compliance risks with associated action plans and controls to mitigate them where possible (and to the extent deemed appropriate taking account of costs and benefits).
As part of this process, senior executive management confirms to the Audit Committee once a year that these key risks are being managed appropriately within their operations, and that controls have been examined and are effective. Responsibility for managing each key risk and the associated mitigating controls are allocated to an individual executive within each division. Changes in the status of the key risks and changes to the risk matrix are reported regularly to executive management and to the Board.
Sha
reho
lder
info
rmat
ion
Ove
rvie
wB
usin
ess
revi
ewG
over
nanc
eF
inan
cial
sta
tem
ents

Governance Corporate governance
46 Tate & Lyle Annual Report 2010
During the year ended 31 March 2010, the risk assessment process was reviewed and changes were made to improve the process across the Group. The enhanced process continues to follow the Committee of Sponsoring Organizations of the Treadway Commission (COSO) Enterprise Risk Framework. The COSO framework provides a process to manage the risk of failure to achieve business objectives and assurance against material loss or mis-statement. A series of risk assessments was carried out, culminating in a workshop with the Group Executive Committee at which the specific Group risks and the key risks from each business area were considered. The output, a Group Risk Assessment, was then reviewed by the Board.
Internal control The Board of directors has overall responsibility for the Group’s system of internal control and for reviewing its effectiveness. The Board delegates to executive management the responsibility for designing, operating and monitoring both the system and the maintenance of effective internal control in each of the Group’s businesses. These systems of internal control are designed to manage rather than eliminate risk, and can provide only reasonable and not absolute assurance against material errors, losses, fraud or breaches of laws or regulations.
Executive management is also responsible for establishing and maintaining adequate internal control and risk management systems relating to the financial reporting process. The systems and controls in place include policies and procedures that relate to the maintenance of records that, in reasonable detail, accurately and fairly reflect transactions and dispositions of assets; provide reasonable assurance that transactions are recorded as necessary to permit the preparation of financial statements in accordance with International Financial Reporting Standards; require representatives of the businesses to certify that their reported information gives a true and fair view of the state of affairs of the business and its results for the period; and review and reconcile reported data.
All the material joint ventures to which the Group is party currently follow the Group’s formal systems of internal control, and their internal control procedures are regularly reviewed by the internal audit function. The systems of internal control are based on a process of identifying, evaluating and managing risks and include the risk management processes set out above. These accord with the guidance in the Turnbull Report and were in place throughout the year and up to the date of this annual report. The key risks that might hinder the achievement of the Group’s business objectives are managed, controlled and monitored by the following processes:
n the Group’s businesses operate under mandatory writtenpolicies and procedural manuals to provide an appropriate control environment. These set out the Group’s commitment to competence, integrity and ethics. The policies are reviewed by the Board annually and changes are made as appropriate to enhance existing control procedures;
n key strategic risks are addressed through the Group’sprocess of preparation of plans by each operating unit and the compilation of these risks in the Group’s operating plan;
n there is a comprehensive annual planning and financial reporting system comparing results with plan and the previous year on a monthly and cumulative basis. The process of planning, budgeting and making short-term forecasts, which is subject to an ongoing review, should provide early warning of potential financial risks. Revised forecasts for the year are produced at least four times a year;
n the Chief Executive and Group Finance Directorundertake regular financial and operational reviews of the major operating units within the Group;
n the Chief Executive and the Group Finance Directorsubmit written reports to each Board meeting, which include consideration of changing threats to and opportunities for the business. The standard Board review of investments and disposals includes identification of major risks that could affect the outcome of each project, with a sensitivity analysis;
n the Company has procedures for the authorisation andproject management of capital expenditure and investment, granting of guarantees, trading and hedging of currencies and commodities and use of treasury products; and
n formal annual reports and presentations are receivedby the Board on certain areas of special risk. These include insurance, treasury management, commodity trading, pensions, and safety and environmental issues.
The Audit Committee periodically reviews the effectiveness of the system of internal control through reports from the external auditors and the internal audit function. The internal audit function follows a planned programme of reviews that are aligned to the risks existing in the Group’s businesses. It has the authority to review any relevant aspect of the business.
The Board, with the assistance of the Audit Committee, has conducted an annual assessment of the effectiveness of the systems of risk management and internal control during the financial year and up to the date of this annual report. The review, co-ordinated by the internal audit function, includes a Group-wide certification that appropriate internal controls are in place to facilitate the Board’s review of effectiveness. The internal audit function monitors and selectively checks the results of this exercise, ensuring that the representations made are consistent with the results of the department’s work during the year. Where weaknesses have been identified, plans for correcting them are also reported. The results of this exercise are summarised for the Audit Committee and the Board. In the event that any significant losses were to be incurred during the year as a result of a failure of controls, a detailed analysis would be provided to the Audit Committee and the Board. The Board confirms that no significant weaknesses were identified in relation to the review conducted during the year and accordingly no remedial action is required.

Tate & Lyle Annual Report 2010 47
Directors’ remuneration reportThis report has been prepared in accordance with the requirements of the Companies Act 2006 (the Act) and Schedule 8 of the Large and Medium Sized Companies and Groups (Accounts and Reports) Regulations 2008 (the Regulations), the Listing Rules of the UK Listing Authority and the Combined Code. PricewaterhouseCoopers LLP have audited such content as required by the Act (the tabular information on pages 53 to 56). A resolution to approve this report will be proposed at the AGM on 22 July 2010.
Remuneration CommitteeThe Remuneration Committee comprises the independent non-executive directors and the Chairman of the Board. The members of the Committee during the year and up to the date of this report were:
Evert Henkes, Chairman Liz Airey William Camp (from 1 May 2010)Richard DelbridgeSir Peter GershonDouglas Hurt (from 10 March 2010)Sir David Lees (until 23 July 2009)Robert WalkerDr Barry Zoumas
The Chief Executive, Group Human Resources Director, Group Compensation Manager and Company Secretary, who acts as Secretary to the Committee, are normally invited to attend meetings, although none are present or involved when his or her own remuneration is discussed.
The Committee met eight times during the year. Individual members’ attendance records at meetings during the year are given in the table on page 42.
ResponsibilitiesThe Committee’s terms of reference, which can be found on the Company’s website at www.tateandlyle.com, are reviewed annually to ensure they reflect best practice. The Committee’s responsibilities include:
n setting the remuneration of the executive directors, the Company Chairman and other senior management in accordance with a policy determined by the Committee and agreed with the Board;
n reviewing the competitiveness of executive remuneration using data from independent consultants;
n reviewing the operation of the long-term incentive plans and annual bonus plan, and determining the participants and overall grant levels; and
n agreeing performance targets for the annual bonus plan and long-term incentive plan and reviewing performance against these targets.
The Committee reviews its work and effectiveness each year and reports any recommendations to the Board. The 2010 review concluded that the Committee had fulfilled its role and responsibilities appropriately.
ConsultantsThe Committee receives advice from independent remuneration consultants. During the year, Hewitt New Bridge Street (Hewitt) (part of Hewitt Associates Ltd) acted as principal adviser to the Committee.
In addition to market remuneration data provided by Hewitt and by Towers Watson, the Committee receives total shareholder return performance data and ranking information for the Performance Share Plan and Deferred Bonus Share Plan and general market data from Kepler Associates. Linklaters provides general legal advice on remuneration matters. Towers Watson assists with pension accounting for the Company and acts as actuaries to the UK-based Tate & Lyle Group Pension Scheme. Hewitt, Towers Watson and Kepler Associates provided no other services to the Group. Linklaters gave legal advice to the Group on a range of matters.
Review of executive remunerationIn light of the Company’s evolving strategic objectives, explained in the Chief Executive’s review, the Committee undertook a comprehensive review of executive remuneration arrangements, with input from its external advisers. The results of this review, and proposed changes to remuneration for the forthcoming year are explained in the summary of executive remuneration review on page 52.
Remuneration strategy and policy
StrategyThe Company’s remuneration strategy is to provide remuneration packages that attract, retain and motivate high-calibre individuals such that they will deliver superior operational performance and outstanding financial results, in a manner that aligns with the Group’s core values and Business Code of Conduct to foster sustainable, profitable growth. To do so, packages must:
n be aligned to shareholders’ interests;n be competitive;n encourage a focus on long-term, sustained performance;n be fair and transparent; andn be consistent across the Group.
PolicyTo achieve the strategy, the policy for the remuneration of executive directors and senior executives includes:
n setting base salary around the market median;n rewarding stretching, superior performance with upper
quartile levels of reward;n providing an appropriate balance between reward in the
short and the long term, and between reward that is fixed and variable; and
n providing a competitive, balanced package of benefits.
The Committee also takes into account the general pay and employment conditions of other employees of the Company when determining executive directors’ remuneration for the relevant financial year. This includes taking account of the levels of base salary increase for employees below executive level when reviewing executive base salaries, and ensuring that the same principles apply in setting performance targets for executive’s incentives as for other employees of the Group.
Sha
reho
lder
info
rmat
ion
Ove
rvie
wB
usin
ess
revi
ewG
over
nanc
eF
inan
cial
sta
tem
ents

Governance Directors’ remuneration report
48 Tate & Lyle Annual Report 2010
Remuneration arrangements during the year ended 31 March 2010 for executive directors
Balance between fixed and variable componentsThe relative proportions of the Chief Executive’s and the Group Finance Director’s remuneration, when valued at both target and stretch performance levels, including base salary, annual bonus and the award value of the long-term incentives, are shown in the charts below.
Remuneration componentsThe current remuneration package for executive directors consists of base salary, annual bonus, other benefits, long-term incentives, and retirement benefits as follows:
Component Objective Principles
Base salary Reflects market value of the individual, n Reviewed annually with changes usually taking effect on 1 April. his or her skills and experience n Benchmarked against relevant comparators, primarily the 50th and performance. to 130th ranked companies of the FTSE. n Base salary reviews take into account pay increase levels for employees below the executive level. n Positioned around the median of the relevant market, taking account of personal performance.
Annual bonus Incentivises year-on-year delivery n Targets set at the start of each financial year by reference to of short-term performance objectives. the annual operating plan, performance in previous years, market expectations and the prevailing economic climate. n Level of payout is determined by reference to the performance of the Group, primarily against financial objectives.
Other benefits Provide a competitive, cost-effective n Designed to reflect local market practice. benefits package.
Long-term Incentivise long-term value creation. n Discretionary annual award of shares, subject to performanceincentives Assists retention of key individuals. conditions and remaining in service. Aligns executives’ and shareholders’ interests.
Pension Provides competitive post-retirement n Delivered through a company pension plan and/or cash benefits. allowances, reflecting local market practice. n For executive directors, only base salary is pensionable.
Non-performance-related pay 40%
Performance-related pay 60%
Target performanceChief Executive
Non-performance-related pay 57%
Performance-related pay 43%
Group Finance Director
Non-performance-related pay 18%
Performance-related pay 82%
Stretch performanceChief Executive
Non-performance-related pay 31%
Performance-related pay 69%
Group Finance Director
Tate & Lyle Annual Report 2010 49
Base salary, benefits and other allowancesSince the Chief Executive joined the Group on 1 October 2009, the Committee agreed that an increase at the normal review date of 1 April would not be appropriate in 2010. The Group Finance Director’s base salary was increased by 2%, effective 1 April 2010 (2009 – 0%). This was in line with levels of base salary increase for other employees.
Executive directors’ base salaries are shown in the table below.
As at 1 April 2009 or date of appointment As at 1 April 2010 if later £ £
Javed Ahmed 675 000 675 000Tim Lodge 382 500 375 000
Executive directors also receive other benefits comprising principally a company car or a cash allowance in lieu; health insurance; and premiums paid on life assurance policies.
Annual bonus scheme
Bonus for the year ended 31 March 2010Two performance criteria were applied to the bonus for the year ended 31 March 2010 as follows:
Performance criteria Proportion of annual incentive
Group profit before tax, exceptional items and amortisation (PBTEA) 75%Operating cash flow metric (cash flow) 25%
The performance target criteria consisted of threshold and target awards payable on the achievement of predetermined performance levels, and a maximum award payable for the achievement of a performance level in excess of target performance. There was a minimum requirement that before any bonus could be payable under the cash flow metric, threshold PBTEA had to be achieved. For bonus purposes, PBTEA and cash flow were based on the performance of the Group’s continuing businesses.
The executive directors’ award potential, as a percentage of base salary, for the achievement of different levels of performance was as follows: % of base salary
Threshold Target Maximum
Javed Ahmed 10% 75% 150%Tim Lodge 10% 50% 100%
The financial results for the year ended 31 March 2010 are explained in detail in the business review. The Group delivered an outstanding performance in operating cash flow, with a £417 million (34%) reduction in net debt, and a net debt to EBITDA ratio of 1.8 times (2009 – 2.4 times). Free cash flow of £540 million (2009 – £154 million) was generated. Performance substantially exceeded the ‘stretch’ level under this component of bonus. Group PBTEA, measured on a constant exchange rate basis, was 97% of the ‘stretch’ performance level after adjustments. The Remuneration Committee awarded Tim Lodge a total bonus of £352,621 (94% of base salary) taking account of performance on the two metrics, and his outstanding personal contribution to the results for the year ending 31 March 2010 and to the development of the new Group strategy for the forthcoming year.
As reported in the Annual Report 2009, under the terms of his recruitment package, Javed Ahmed was, subject to certain conditions, entitled to a compensatory cash payment of 75% of base salary, to recognise the potential annual bonus payment foregone from his former employer. The Remuneration Committee, with input from the Nominations
Committee, deemed that the conditions had been met and accordingly a payment of £506,250 (75% of base salary) was awarded to him. In accordance with the terms of his appointment, Javed Ahmed’s entitlement to a bonus under the Tate & Lyle annual bonus scheme for the year ended 31 March 2010 was reduced by the amount of this compensatory cash payment and was such that he did not receive any bonus payment.
Long-term incentive arrangementsPerformance-based long-term incentive plans (LTIPs) closely align executive directors’ and senior executives’ interests with those of shareholders, and are therefore an important component of the overall package.
During the year ended 31 March 2010, the Company operated one LTIP, the Tate & Lyle 2003 Performance Share Plan (PSP). In addition, there are some outstanding awards that were made under earlier plans that are no longer in operation or have been suspended.
Performance Share Plan (PSP)
Maximum award levelUnder the PSP, executive directors and other senior executives are awarded, at the discretion of the Committee, a conditional right to receive a number of Tate & Lyle ordinary shares in value up to a maximum of 175% of base salary per annum.
Javed Ahmed received special long-term incentive awards to facilitate his recruitment, detailed in the Annual Report 2009, and also on page 54. Although these were not granted under the PSP, they have similar terms to PSP awards. Javed Ahmed did not receive a grant in 2009 under the PSP itself.
Performance conditions – 2009 awardsThe number of shares a participant ultimately receives depends on the Group’s performance during the three-year performance period beginning on 1 April in the year of the award. For the 2009 awards, the performance conditions comprised two elements:
a) Total shareholder return (TSR) – 50% of total awardPerformance is measured by comparing the TSR (share price growth plus reinvested dividends) of Tate & Lyle relative to a comparator group comprising the companies occupying positions 50 to 130 of the FTSE rankings at the beginning of the relevant performance period of three years. The Committee considered the comparator group to be appropriate given the Company’s position in the FTSE Index. The Committee chose the relative TSR metric as an objective measure of the value created for shareholders. The Committee reviews the performance measurement metrics and the continued validity of the comparator group annually. All share prices for the purpose of the TSR calculation are based on a three-month average.
b) Adjusted diluted earnings per share (EPS) metric – 50% of total awardPerformance is measured by comparing the compound annual growth rate (CAGR) of the Company’s adjusted diluted EPS from total operations over the three-year performance period against predetermined targets. The Committee considered that the use of adjusted diluted EPS alongside relative TSR created a balance between two commonly used internal and external metrics, both being relevant measures aligned to shareholder value.
Sha
reho
lder
info
rmat
ion
Ove
rvie
wB
usin
ess
revi
ewG
over
nanc
eF
inan
cial
sta
tem
ents

Governance Directors’ remuneration report
50 Tate & Lyle Annual Report 2010
Shares awarded under the PSP in 2009 vest in accordance with the following schedule:
CAGR of adjusted diluted EPS during the Relative TSR ranking Percentage of performance period percentileaward vesting (50% of award) (50% of award)
0% Below 5% Below median
25% 5% At median
On a straight-line Between 5% Between median basis between and 15% and upper quartile 25% and 100%
100% 15% or more At upper quartile or above
There is no retesting of the performance conditions.
Before any shares become eligible for release, the Committee must also be satisfied that this is justified by the underlying financial performance of the Group over the measurement period. Subject to the Committee’s approval, the conditional award is then converted into an option to acquire the appropriate number of shares.
Suspended schemes
Deferred Bonus Share Plan (DBSP)Awards were made under the DBSP from 2005 to 2008, and it was suspended in 2009. Under the DBSP, executives had the opportunity to defer up to 50% of their annual cash bonus (after deduction of tax, national insurance or other social security payments) and invest the amount deferred in the Company’s shares. Subject to the satisfaction of employment conditions for awards made prior to 2008 and a performance condition over the performance period, participants received awards of matching shares based on the number of shares which could have been acquired from the gross bonus amount deferred by the participant (lodged shares). The performance condition attached to past awards is the same as that attached to PSP awards made in the same year.
Awards made in 2007 under the PSP and DBSPThe awards made under the PSP and DBSP in 2007 were subject to a performance condition based on the Company’s TSR over the three-year performance period from 1 April 2007 to 31 March 2010, relative to a comparator group of companies (being those occupying positions 50 to 130 in the FTSE rankings at the start of the measurement period). The Company’s TSR ranked Tate & Lyle 49th in the comparator group of companies. This was below the minimum requirement of median performance, and accordingly, awards made under the PSP did not vest and lapsed. DBSP participants will receive one matching share for every three lodged shares subject to the service requirements in the plan rules.
Change of control and votingSome of the Company’s employee share plans include restrictions on transferring shares while the shares are subject to the plan. All of the Company’s share plans contain provisions relating to a change of control (as explained in more detail above). Outstanding awards and options would normally vest and become exercisable on a change of control, subject to the satisfaction of any performance conditions at that time. Where participants are the beneficial owners of the shares under an employee share plan, but not the registered owner, the voting rights are normally exercised by the registered owner at the direction of the participants.
Sharesave SchemeThe Scheme is open to all employees in the UK, including executive directors. No performance conditions are attached to options granted under the Scheme since it is an
all-employee scheme, and the value of individual grants is capped. Options granted to participants are normally set at a discount of 10% to the market value of the shares at the time of the grant.
DilutionTo satisfy options granted under the 1992 Executive Share Option Scheme (closed in July 2000) and the Sharesave Scheme, the Company issues new shares. To satisfy outstanding awards under the PSP and DBSP matching shares, the Company uses either treasury shares or shares that have been purchased by the Trustees of the Tate & Lyle Employee Benefit Trust. The Company will use shares that have been purchased by the Employee Benefit Trust to satisfy awards made to Javed Ahmed.
In the ten-year period to 31 March 2010, awards made under the executive schemes represented 1.6% of the Company’s issued ordinary share capital (2009 – 1.8%), leaving available dilution headroom of 3.4% (2009 – 3.2%). Awards made under all share schemes represented 3.0% of the Company’s issued ordinary share capital (2009 – 3.1%) leaving available dilution headroom of 7.0% (2009 – 6.9%).
Executive shareholding policyThe shareholding requirement for Javed Ahmed is four times base salary. Under the policy applying during the year ended 31 March 2010 the shareholding requirement for other executive directors was one times base salary. Executive directors who have not met their target shareholding are expected to retain a significant proportion of shares acquired through LTIPs towards meeting their target.
PensionsThe Group’s largest pension scheme is the UK-based Tate & Lyle Group Pension Scheme (Group Scheme), a defined benefit arrangement. The Company closed the Group Scheme to new entrants from 1 April 2002, and, since then, new employees have been offered defined-contribution type pension provision through a Stakeholder Plan, which is an insurance-based contract. The Group Scheme will close to future final salary pension accrual on 5 April 2011 and be replaced by a defined contribution pension plan.
Current executive directors Javed Ahmed is not a member of the Group Scheme for pension purposes and accordingly has accrued no pension benefits under it. He has been provided with life assurance cover and has also participated in the Group Income Protection Scheme, which applies to all UK employees who are not otherwise covered for ill-health benefits under the Group Scheme. He is paid a cash allowance calculated as 35% of base salary, from which he can make his own retirement savings arrangements.
Tim Lodge is a member of the Group Scheme and currently accrues pension at a rate of approximately 1/38th of pensionable earnings (basic salary only) for each year of service, subject to an employee contribution of 3% of pensionable salary. The benefit also includes a widow’s pension payable on his death and a lump sum on death in service. Once in payment, his pension (and any subsequent widow’s pension) is subject to increases in line with the UK Retail Price Index (RPI) up to a maximum of 5%, with a minimum of 3%.
Former executive directors Iain Ferguson, the former Chief Executive, left the Company on 31 December 2009. He was not a member of the Group Scheme for pension purposes and accordingly accrued no pension benefits under it. He was paid a cash allowance calculated as a percentage of base salary. He was provided with life assurance cover and also participated in the Group Income Protection Scheme.
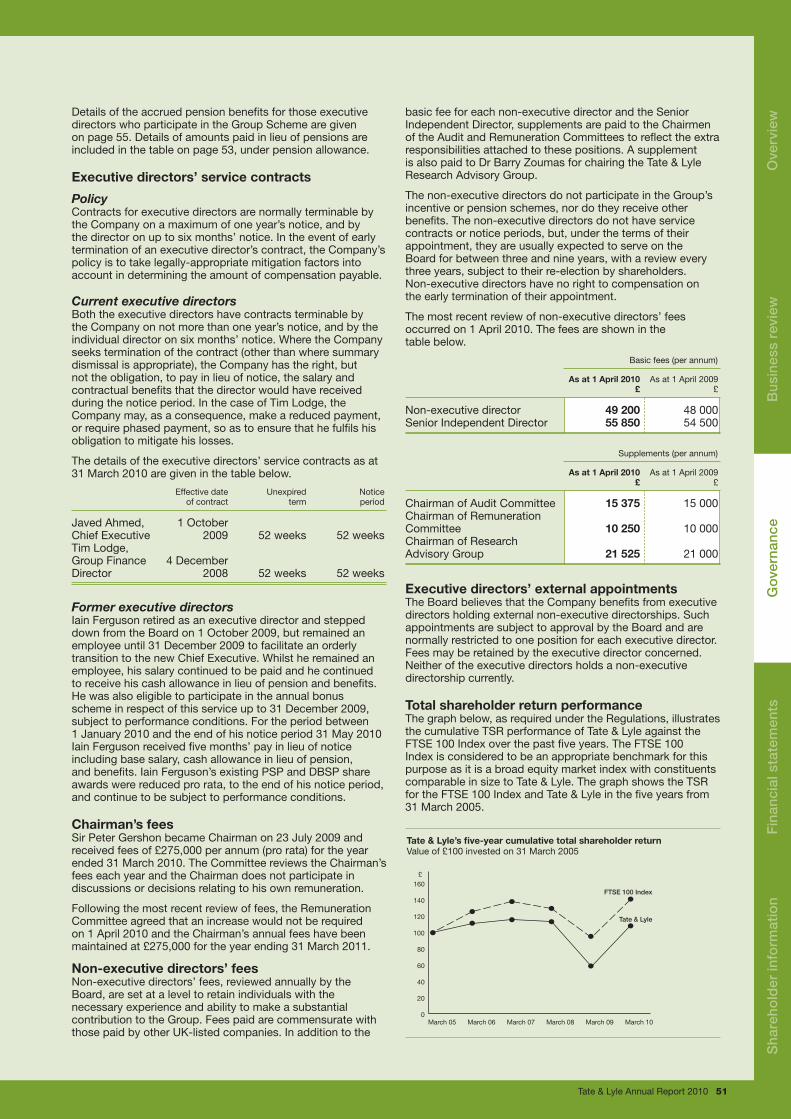
Tate & Lyle Annual Report 2010 51
Details of the accrued pension benefits for those executive directors who participate in the Group Scheme are given on page 55. Details of amounts paid in lieu of pensions are included in the table on page 53, under pension allowance.
Executive directors’ service contracts
PolicyContracts for executive directors are normally terminable by the Company on a maximum of one year’s notice, and by the director on up to six months’ notice. In the event of early termination of an executive director’s contract, the Company’s policy is to take legally-appropriate mitigation factors into account in determining the amount of compensation payable.
Current executive directorsBoth the executive directors have contracts terminable by the Company on not more than one year’s notice, and by the individual director on six months’ notice. Where the Company seeks termination of the contract (other than where summary dismissal is appropriate), the Company has the right, but not the obligation, to pay in lieu of notice, the salary and contractual benefits that the director would have received during the notice period. In the case of Tim Lodge, the Company may, as a consequence, make a reduced payment, or require phased payment, so as to ensure that he fulfils his obligation to mitigate his losses.
The details of the executive directors’ service contracts as at 31 March 2010 are given in the table below.
Effective date Unexpired Notice of contract term period
Javed Ahmed, 1 October Chief Executive 2009 52 weeks 52 weeksTim Lodge, Group Finance 4 December Director 2008 52 weeks 52 weeks
Former executive directorsIain Ferguson retired as an executive director and stepped down from the Board on 1 October 2009, but remained an employee until 31 December 2009 to facilitate an orderly transition to the new Chief Executive. Whilst he remained an employee, his salary continued to be paid and he continued to receive his cash allowance in lieu of pension and benefits. He was also eligible to participate in the annual bonus scheme in respect of this service up to 31 December 2009, subject to performance conditions. For the period between 1 January 2010 and the end of his notice period 31 May 2010 Iain Ferguson received five months’ pay in lieu of notice including base salary, cash allowance in lieu of pension, and benefits. Iain Ferguson’s existing PSP and DBSP share awards were reduced pro rata, to the end of his notice period, and continue to be subject to performance conditions.
Chairman’s feesSir Peter Gershon became Chairman on 23 July 2009 and received fees of £275,000 per annum (pro rata) for the year ended 31 March 2010. The Committee reviews the Chairman’s fees each year and the Chairman does not participate in discussions or decisions relating to his own remuneration.
Following the most recent review of fees, the Remuneration Committee agreed that an increase would not be required on 1 April 2010 and the Chairman’s annual fees have been maintained at £275,000 for the year ending 31 March 2011.
Non-executive directors’ feesNon-executive directors’ fees, reviewed annually by the Board, are set at a level to retain individuals with the necessary experience and ability to make a substantial contribution to the Group. Fees paid are commensurate with those paid by other UK-listed companies. In addition to the
basic fee for each non-executive director and the Senior Independent Director, supplements are paid to the Chairmen of the Audit and Remuneration Committees to reflect the extra responsibilities attached to these positions. A supplement is also paid to Dr Barry Zoumas for chairing the Tate & Lyle Research Advisory Group.
The non-executive directors do not participate in the Group’s incentive or pension schemes, nor do they receive other benefits. The non-executive directors do not have service contracts or notice periods, but, under the terms of their appointment, they are usually expected to serve on the Board for between three and nine years, with a review every three years, subject to their re-election by shareholders. Non-executive directors have no right to compensation on the early termination of their appointment.
The most recent review of non-executive directors’ fees occurred on 1 April 2010. The fees are shown in the table below.
Basic fees (per annum)
As at 1 April 2010 As at 1 April 2009 £ £
Non-executive director 49 200 48 000Senior Independent Director 55 850 54 500
Supplements (per annum)
As at 1 April 2010 As at 1 April 2009 £ £
Chairman of Audit Committee 15 375 15 000Chairman of Remuneration Committee 10 250 10 000Chairman of Research Advisory Group 21 525 21 000
Executive directors’ external appointmentsThe Board believes that the Company benefits from executive directors holding external non-executive directorships. Such appointments are subject to approval by the Board and are normally restricted to one position for each executive director. Fees may be retained by the executive director concerned. Neither of the executive directors holds a non-executive directorship currently.
Total shareholder return performanceThe graph below, as required under the Regulations, illustrates the cumulative TSR performance of Tate & Lyle against the FTSE 100 Index over the past five years. The FTSE 100 Index is considered to be an appropriate benchmark for this purpose as it is a broad equity market index with constituents comparable in size to Tate & Lyle. The graph shows the TSR for the FTSE 100 Index and Tate & Lyle in the five years from 31 March 2005.
Tate & Lyle’s �ve-year cumulative total shareholder returnValue of £100 invested on 31 March 2005
Tate & Lyle
FTSE 100 Index
March 05 March 06 March 07 March 08 March 09 March 100
20
40
60
80
100
120
140
160£
Sha
reho
lder
info
rmat
ion
Ove
rvie
wB
usin
ess
revi
ewG
over
nanc
eF
inan
cial
sta
tem
ents
Governance Directors’ remuneration report
52 Tate & Lyle Annual Report 2010
Summary of executive remuneration review The Committee undertook a comprehensive review of executive remuneration during the year ended 31 March 2010, and is planning to implement a number of changes to remuneration policy for the year ending 31 March 2011, intended to provide more emphasis on driving Company performance and delivering value for shareholders.
The remuneration arrangements for Javed Ahmed (details of which were disclosed in the Annual Report 2009 and in this report) were excluded from this review having been agreed on his appointment in 2009. His arrangements will remain unchanged.
Following consultation with major shareholders and shareholder bodies, a number of changes to the existing arrangements for Tim Lodge and other members of the Group Executive Committee are proposed.
These changes are designed to support the Company’s strategy, with a greater emphasis on performance-related pay, alignment to shareholder value growth, sustained performance and management of risk. The changes also reflect Tate & Lyle’s increasingly international business profile and management team, with more than three-quarters of revenues generated outside the UK.
Annual bonus for the year ending 31 March 2011
1. Performance metricsThere will be a new approach to performance metrics for annual bonus, designed to reflect the key value drivers for the business. There will be three performance metrics: sales growth, profitability and cash conversion cycle, to reflect management’s ability to grow the business, generate underlying profit and convert profit into cash. Sales growth will be measured by a contribution metric (net sales less raw material cost), profit will be based on the current PBTEA metric, and cash conversion cycle will be based on net working capital. The greatest emphasis will be on profit; before any bonus becomes payable under any of the criteria, a minimum level of profit will need to be achieved. To achieve the maximum bonus payout, performance against all three metrics will need to be outstanding. Consistent with prior years, all numbers will be restated on the basis of exchange rates used for the Group’s annual operating plan.
As the financial targets are commercially sensitive they will not be disclosed in advance. However, following shareholder consultation, the Committee has determined that the directors’ remuneration report for the year ending 31 March 2011 will include the financial targets for each metric, the extent to which they were achieved and the impact of this on the bonus paid.
2. Target and maximum bonus payableThe target level of annual bonus will remain unchanged at 50% of base salary. However, the maximum bonus will be set at 175% of base salary, for achieving outstanding performance across all three metrics.
3. Delivery in sharesThe portion of any annual bonus above 100% of base salary will be delivered in Tate & Lyle PLC shares, which will be deferred for a further two years. These shares will not benefit from any matching. This will contribute to executives’ increased shareholding requirements (see below) and provide a focus on sustained shareholder value growth and risk management.
The balance of the annual bonus will be delivered in non-deferred cash.
4. Claw-backThe Committee will have the authority to claw back up to 100% of annual bonus, in certain situations such as employee misconduct or mis-statement of financial results.
Long-term incentive
1. Award size and shareholding requirementThe PSP rules currently permit a maximum individual award of 1.75 times base salary. Following the executive remuneration review, the Committee concluded it should seek shareholder approval for an increase in the award limit, which is detailed in the Notice of AGM. The proposed larger award size will also be subject to a new approach to performance conditions (see below). It is also accompanied by a significant increase in the executive shareholding requirement, also detailed in the Notice. The percentage of the total award that vests at threshold performance will also reduce, as a further incentive to drive higher levels of performance.
The USA is the largest operating base and source of sales and profits for the company. A higher LTI award limit will enable the Committee to make awards that take better account of market practice amongst companies operating in the North American market.
Accordingly, shareholder approval of this amendment to the rules of the PSP is being sought at the forthcoming AGM.
2. Performance conditionsThe Committee’s view is that performance conditions for the PSP should give management a clear line of sight between their performance and reward, as this will maximize the motivational impact of the Plan. As Tate & Lyle has few, if any, directly comparable peers, relative TSR does not provide this line of sight. The broad peer group that has been used for previous PSP awards includes companies across many different sectors, and therefore does not give a like-for-like comparison.
It is therefore proposed to apply financial performance conditions to the award. These will be metrics that are important drivers of shareholder value. The Committee is aware that financial performance conditions are sometimes criticised for being susceptible to manipulation. The Committee will therefore make any necessary adjustments to the performance outcomes to ensure that the results are a true reflection of the actual performance achieved.
For the awards in 2010 the proposed metrics are:
(a) Adjusted diluted earnings per share (EPS) metric: 50% of total award.
Performance is measured by comparing the compound annual growth rate (CAGR) of the Company’s adjusted diluted EPS from continuing operations over the three-year performance period against the predetermined targets.
(b) Adjusted return on capital employed (ROCE): 50% of total award.
Tate & Lyle has extensive capital investment in its plant and equipment, and from previous acquisitions. Ensuring this generates a healthy level of return is an important objective and accordingly the ROCE metric has been introduced.
Performance is measured by the adjusted ROCE percentage over the three-year performance period against the predetermined targets.
Details of the performance targets and vesting scale for the 2010 awards to be made under the PSP are provided in the Notice of AGM, accompanying the resolution seeking shareholder approval for a change to the award limit.
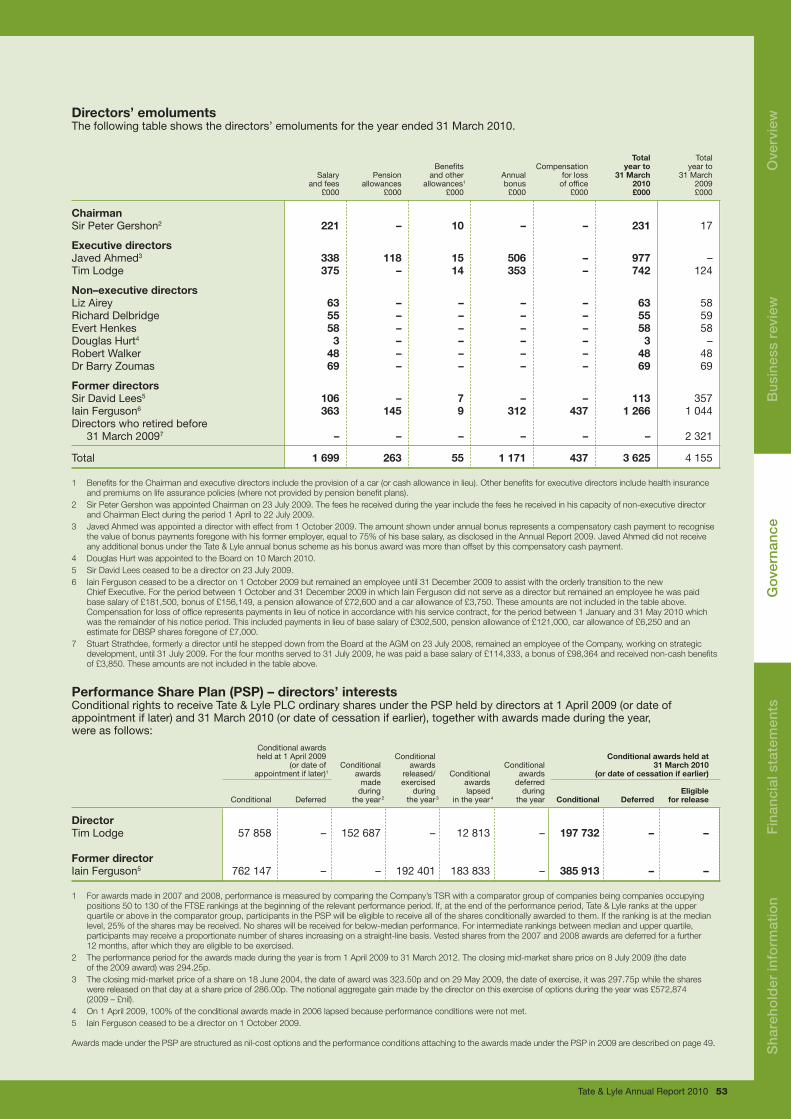
Tate & Lyle Annual Report 2010 53
Directors’ emolumentsThe following table shows the directors’ emoluments for the year ended 31 March 2010. Total Total Benefits Compensation year to year to Salary Pension and other Annual for loss 31 March 31 March and fees allowances allowances1 bonus of office 2010 2009 £000 £000 £000 £000 £000 £000 £000
Chairman Sir Peter Gershon2 221 – 10 – – 231 17
Executive directorsJaved Ahmed3 338 118 15 506 – 977 –Tim Lodge 375 – 14 353 – 742 124
Non–executive directors Liz Airey 63 – – – – 63 58Richard Delbridge 55 – – – – 55 59Evert Henkes 58 – – – – 58 58Douglas Hurt4 3 – – – – 3 –Robert Walker 48 – – – – 48 48Dr Barry Zoumas 69 – – – – 69 69
Former directorsSir David Lees5 106 – 7 – – 113 357Iain Ferguson6 363 145 9 312 437 1 266 1 044Directors who retired before 31 March 20097 – – – – – – 2 321
Total 1 699 263 55 1 171 437 3 625 4 155
1 Benefits for the Chairman and executive directors include the provision of a car (or cash allowance in lieu). Other benefits for executive directors include health insurance and premiums on life assurance policies (where not provided by pension benefit plans).
2 Sir Peter Gershon was appointed Chairman on 23 July 2009. The fees he received during the year include the fees he received in his capacity of non-executive director and Chairman Elect during the period 1 April to 22 July 2009.
3 Javed Ahmed was appointed a director with effect from 1 October 2009. The amount shown under annual bonus represents a compensatory cash payment to recognise the value of bonus payments foregone with his former employer, equal to 75% of his base salary, as disclosed in the Annual Report 2009. Javed Ahmed did not receive any additional bonus under the Tate & Lyle annual bonus scheme as his bonus award was more than offset by this compensatory cash payment.
4 Douglas Hurt was appointed to the Board on 10 March 2010.5 Sir David Lees ceased to be a director on 23 July 2009. 6 Iain Ferguson ceased to be a director on 1 October 2009 but remained an employee until 31 December 2009 to assist with the orderly transition to the new
Chief Executive. For the period between 1 October and 31 December 2009 in which Iain Ferguson did not serve as a director but remained an employee he was paid base salary of £181,500, bonus of £156,149, a pension allowance of £72,600 and a car allowance of £3,750. These amounts are not included in the table above. Compensation for loss of office represents payments in lieu of notice in accordance with his service contract, for the period between 1 January and 31 May 2010 which was the remainder of his notice period. This included payments in lieu of base salary of £302,500, pension allowance of £121,000, car allowance of £6,250 and an estimate for DBSP shares foregone of £7,000.
7 Stuart Strathdee, formerly a director until he stepped down from the Board at the AGM on 23 July 2008, remained an employee of the Company, working on strategic development, until 31 July 2009. For the four months served to 31 July 2009, he was paid a base salary of £114,333, a bonus of £98,364 and received non-cash benefits of £3,850. These amounts are not included in the table above.
Performance Share Plan (PSP) – directors’ interestsConditional rights to receive Tate & Lyle PLC ordinary shares under the PSP held by directors at 1 April 2009 (or date of appointment if later) and 31 March 2010 (or date of cessation if earlier), together with awards made during the year, were as follows: Conditional awards held at 1 April 2009 Conditional Conditional awards held at (or date of Conditional awards Conditional 31 March 2010 appointment if later)1 awards released/ Conditional awards (or date of cessation if earlier) made exercised awards deferred during during lapsed during Eligible Conditional Deferred the year2 the year3 in the year4 the year Conditional Deferred for release
Director Tim Lodge 57 858 – 152 687 – 12 813 – 197 732 – –
Former director Iain Ferguson5 762 147 – – 192 401 183 833 – 385 913 – –
1 For awards made in 2007 and 2008, performance is measured by comparing the Company’s TSR with a comparator group of companies being companies occupying positions 50 to 130 of the FTSE rankings at the beginning of the relevant performance period. If, at the end of the performance period, Tate & Lyle ranks at the upper quartile or above in the comparator group, participants in the PSP will be eligible to receive all of the shares conditionally awarded to them. If the ranking is at the median level, 25% of the shares may be received. No shares will be received for below-median performance. For intermediate rankings between median and upper quartile, participants may receive a proportionate number of shares increasing on a straight-line basis. Vested shares from the 2007 and 2008 awards are deferred for a further 12 months, after which they are eligible to be exercised.
2 The performance period for the awards made during the year is from 1 April 2009 to 31 March 2012. The closing mid-market share price on 8 July 2009 (the date of the 2009 award) was 294.25p.
3 The closing mid-market price of a share on 18 June 2004, the date of award was 323.50p and on 29 May 2009, the date of exercise, it was 297.75p while the shares were released on that day at a share price of 286.00p. The notional aggregate gain made by the director on this exercise of options during the year was £572,874 (2009 – £nil).
4 On 1 April 2009, 100% of the conditional awards made in 2006 lapsed because performance conditions were not met.5 Iain Ferguson ceased to be a director on 1 October 2009.
Awards made under the PSP are structured as nil-cost options and the performance conditions attaching to the awards made under the PSP in 2009 are described on page 49.
Sha
reho
lder
info
rmat
ion
Ove
rvie
wB
usin
ess
revi
ewG
over
nanc
eF
inan
cial
sta
tem
ents

Governance Directors’ remuneration report
54 Tate & Lyle Annual Report 2010
Deferred Bonus Share Plan (DBSP) – directors’ interestsConditional rights to receive matching shares over Tate & Lyle PLC ordinary shares under the DBSP held by directors at 1 April 2009 (or date of appointment if later) and 31 March 2010 (or date of cessation if earlier), together with awards made during the year, were as follows:
Maximum Shares Maximum Maximum matching Shares Shares acquired matching matching Matching Matching shares acquired acquired with net shares shares shares shares on gross with net with bonus at on gross awarded released lapsed bonus at bonus at net bonus 31 March bonus at during during during 31 March 1 April 2009 during the year 20101 1 April 2009 the year the year2,3,4 the year 2010
Director Tim Lodge 2 003 – 2 003 6 790 – – – 6 790
Former director Iain Ferguson6 58 038 – 32 302 196 739 – 14 540 72 701 109 498
1 Or date of cessation if earlier.2 The matching shares, representing the minimum one-for-three share match based on continued employment, were released on 11 June 2009 and the closing
mid-market share price on that day was 314.25p and on 28 June 2006, the date of award, it was 589.50p.3 For awards made in 2006 and 2007, vesting is determined as follows: n if the shares are held throughout the three-year performance period, and the executive continues to be employed by the Company, matching shares are awarded
on the basis of one matching share for every three lodged shares; or n for TSR during the three-year performance period of between median and upper quartile of the companies positioned 50 to 130 of the FTSE Index at the start of
the performance period, one matching share will be awarded for each lodged share increasing to two matching shares for upper quartile performance or above.4 The notional aggregate gain made by directors on the exercise of options during the year was £45,692 (2009 – £83,783).5 For awards made in 2008, vesting is determined as follows: for TSR during the three-year performance period of median against the companies positioned 50 to 130
of the FTSE Index at the start of the performance period, one matching share will be awarded for each lodged share increasing on a pro-rata basis so that two matching shares are awarded for upper quartile performance.
6 Iain Ferguson ceased to be a director on 1 October 2009.
Share awards made to Javed AhmedTo facilitate the recruitment of Javed Ahmed as Chief Executive in 2009, the Remuneration Committee established special share incentive arrangements, applying only to him, comprising awards to compensate him for certain long-term incentives given up by him as a consequence of leaving his former employer, and to provide an appropriate level of performance-based incentives taking account of the ongoing level of long-term incentive awards that would have applied had he remained with his previous employer.
Full details of the awards, which are on terms similar to those set out in the PSP, are as follows:
Awards held Awards held at on appointment Awards Awards Awards 31 March 2010 made released Awards deferred during during lapsed during Eligible Conditional Deferred the year1 the year in the year the year Conditional Deferred for release
Award nameCompensatory award – A2 – – 419 403 – – 419 403 – 419 403 –Compensatory award – B3 – – 269 616 – – – 269 616 – –Compensatory award – C4 – – 359 488 – – – 359 488 – –Long-term incentive award – A4 – – 659 609 – – – 659 609 – –
Total – – 1 708 116 – – 419 403 1 288 713 419 403 –
1 The closing mid-market share price on 28 October 2009 (the date of the awards) was 444.90p.2 This award is not subject to performance conditions to compensate him for certain long-term incentives given up by him as a consequence of leaving his former employer
and shares will be delivered on 1 October 2011, being the second anniversary of Javed Ahmed joining the Company. Pending delivery, Javed Ahmed receives a payment in lieu of dividend on these shares which will be subject to the deduction of tax. In the event of a change of control, the shares will be delivered immediately.
3 This awards is subject to the same performance condition as that which applies to awards made under the PSP in 2008. Performance will be measured and the relevant number of shares released after the performance period ends on 31 March 2011.
4 This awards is subject to the same performance condition as that which applies to awards made under the PSP in 2009 as disclosed on page 49. Performance will be measured and the relevant number of shares released after the performance period ends on 31 March 2012.
The provisions relating to Javed Ahmed, to whom benefits are provided under the special share incentive arrangements (the Scheme), the maximum number of shares available for release, and the basis for determining the participant’s entitlement cannot be altered to the advantage of the participant without prior shareholder approval (except for minor amendments to benefit the administration of the Scheme, to take account of a change in legislation or to obtain or maintain favourable tax, exchange control, or regulatory treatment for the participant or the Company). The benefits under the special share incentive arrangements detailed above are non-pensionable. The terms of the Scheme will be available for inspection at the registered office of the Company from the date that the Notice of AGM is sent until the close of the AGM, and at the place of the AGM for at least 15 minutes before and during the meeting.
1,3,5
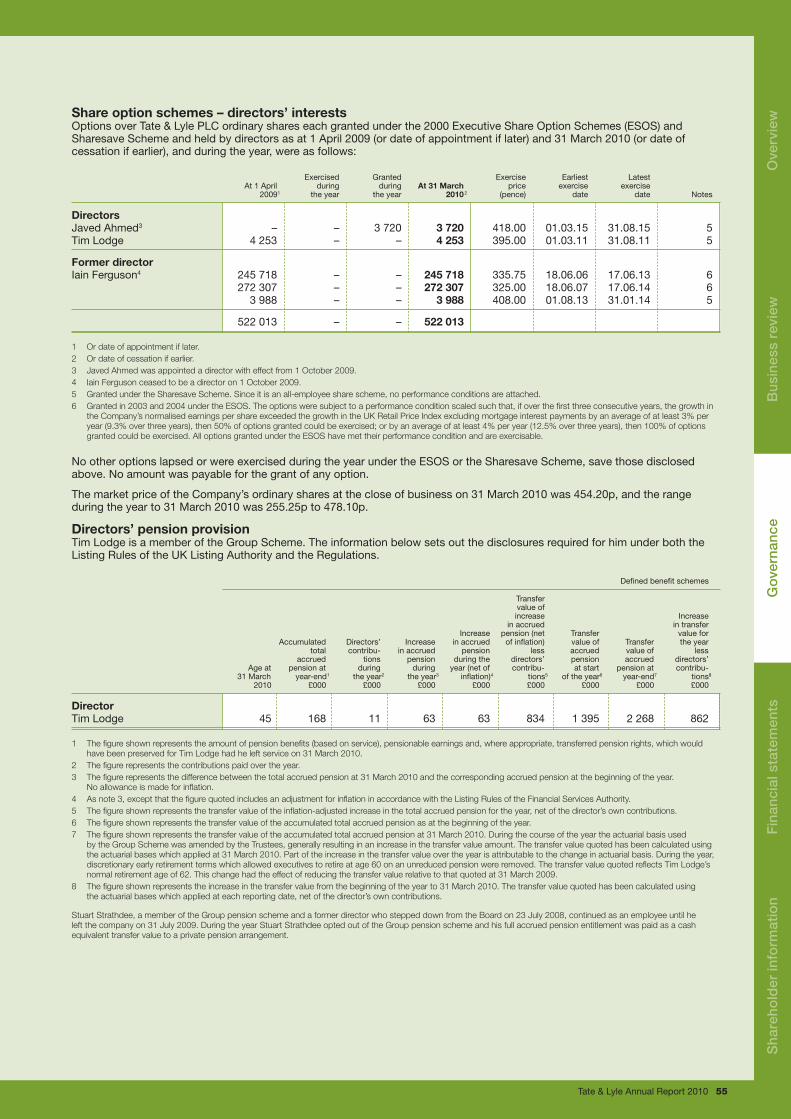
Tate & Lyle Annual Report 2010 55
Share option schemes – directors’ interestsOptions over Tate & Lyle PLC ordinary shares each granted under the 2000 Executive Share Option Schemes (ESOS) and Sharesave Scheme and held by directors as at 1 April 2009 (or date of appointment if later) and 31 March 2010 (or date of cessation if earlier), and during the year, were as follows:
Exercised Granted Exercise Earliest Latest At 1 April during during At 31 March price exercise exercise 20091 the year the year 2010 2 (pence) date date Notes
Directors Javed Ahmed3 – – 3 720 3 720 418.00 01.03.15 31.08.15 5Tim Lodge 4 253 – – 4 253 395.00 01.03.11 31.08.11 5
Former director Iain Ferguson4 245 718 – – 245 718 335.75 18.06.06 17.06.13 6 272 307 – – 272 307 325.00 18.06.07 17.06.14 6 3 988 – – 3 988 408.00 01.08.13 31.01.14 5
522 013 – – 522 013
1 Or date of appointment if later.2 Or date of cessation if earlier.3 Javed Ahmed was appointed a director with effect from 1 October 2009.4 Iain Ferguson ceased to be a director on 1 October 2009.5 Granted under the Sharesave Scheme. Since it is an all-employee share scheme, no performance conditions are attached.6 Granted in 2003 and 2004 under the ESOS. The options were subject to a performance condition scaled such that, if over the first three consecutive years, the growth in
the Company’s normalised earnings per share exceeded the growth in the UK Retail Price Index excluding mortgage interest payments by an average of at least 3% per year (9.3% over three years), then 50% of options granted could be exercised; or by an average of at least 4% per year (12.5% over three years), then 100% of options granted could be exercised. All options granted under the ESOS have met their performance condition and are exercisable.
No other options lapsed or were exercised during the year under the ESOS or the Sharesave Scheme, save those disclosed above. No amount was payable for the grant of any option.
The market price of the Company’s ordinary shares at the close of business on 31 March 2010 was 454.20p, and the range during the year to 31 March 2010 was 255.25p to 478.10p.
Directors’ pension provision Tim Lodge is a member of the Group Scheme. The information below sets out the disclosures required for him under both the Listing Rules of the UK Listing Authority and the Regulations.
Defined benefit schemes
Transfer value of increase Increase in accrued in transfer Increase pension (net Transfer value for Accumulated Directors’ Increase in accrued of inflation) value of Transfer the year total contribu- in accrued pension less accrued value of less accrued tions pension during the directors’ pension accrued directors’ Age at pension at during during year (net of contribu- at start pension at contribu- 31 March year-end1 the year2 the year3 inflation)4 tions5 of the year6 year-end7 tions8
2010 £000 £000 £000 £000 £000 £000 £000 £000
DirectorTim Lodge 45 168 11 63 63 834 1 395 2 268 862
1 The figure shown represents the amount of pension benefits (based on service), pensionable earnings and, where appropriate, transferred pension rights, which would have been preserved for Tim Lodge had he left service on 31 March 2010.
2 The figure represents the contributions paid over the year. 3 The figure represents the difference between the total accrued pension at 31 March 2010 and the corresponding accrued pension at the beginning of the year.
No allowance is made for inflation. 4 As note 3, except that the figure quoted includes an adjustment for inflation in accordance with the Listing Rules of the Financial Services Authority. 5 The figure shown represents the transfer value of the inflation-adjusted increase in the total accrued pension for the year, net of the director’s own contributions. 6 The figure shown represents the transfer value of the accumulated total accrued pension as at the beginning of the year. 7 The figure shown represents the transfer value of the accumulated total accrued pension at 31 March 2010. During the course of the year the actuarial basis used
by the Group Scheme was amended by the Trustees, generally resulting in an increase in the transfer value amount. The transfer value quoted has been calculated using the actuarial bases which applied at 31 March 2010. Part of the increase in the transfer value over the year is attributable to the change in actuarial basis. During the year, discretionary early retirement terms which allowed executives to retire at age 60 on an unreduced pension were removed. The transfer value quoted reflects Tim Lodge’s normal retirement age of 62. This change had the effect of reducing the transfer value relative to that quoted at 31 March 2009.
8 The figure shown represents the increase in the transfer value from the beginning of the year to 31 March 2010. The transfer value quoted has been calculated using the actuarial bases which applied at each reporting date, net of the director’s own contributions.
Stuart Strathdee, a member of the Group pension scheme and a former director who stepped down from the Board on 23 July 2008, continued as an employee until he left the company on 31 July 2009. During the year Stuart Strathdee opted out of the Group pension scheme and his full accrued pension entitlement was paid as a cash equivalent transfer value to a private pension arrangement.
Sha
reho
lder
info
rmat
ion
Ove
rvie
wB
usin
ess
revi
ewG
over
nanc
eF
inan
cial
sta
tem
ents
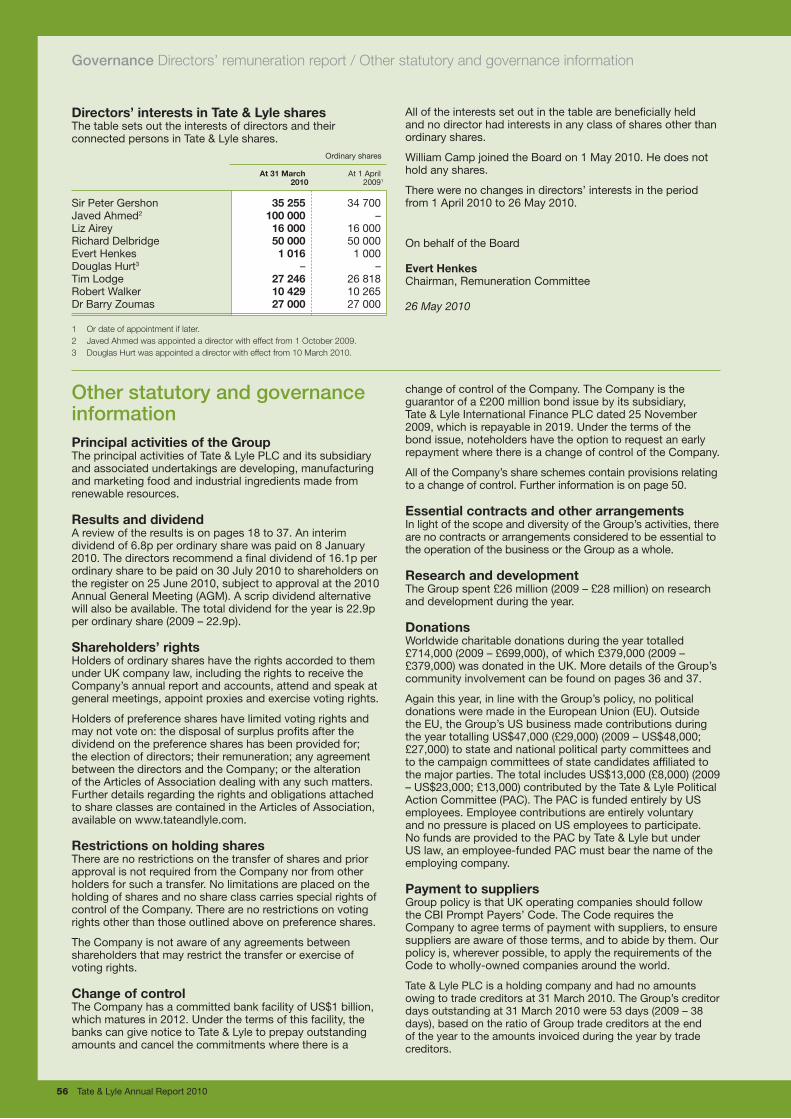
Governance Directors’ remuneration report / Other statutory and governance information
56 Tate & Lyle Annual Report 2010
Other statutory and governance information Principal activities of the GroupThe principal activities of Tate & Lyle PLC and its subsidiary and associated undertakings are developing, manufacturing and marketing food and industrial ingredients made from renewable resources.
Results and dividendA review of the results is on pages 18 to 37. An interim dividend of 6.8p per ordinary share was paid on 8 January 2010. The directors recommend a final dividend of 16.1p per ordinary share to be paid on 30 July 2010 to shareholders on the register on 25 June 2010, subject to approval at the 2010 Annual General Meeting (AGM). A scrip dividend alternative will also be available. The total dividend for the year is 22.9p per ordinary share (2009 – 22.9p).
Shareholders’ rightsHolders of ordinary shares have the rights accorded to them under UK company law, including the rights to receive the Company’s annual report and accounts, attend and speak at general meetings, appoint proxies and exercise voting rights.
Holders of preference shares have limited voting rights and may not vote on: the disposal of surplus profits after the dividend on the preference shares has been provided for; the election of directors; their remuneration; any agreement between the directors and the Company; or the alteration of the Articles of Association dealing with any such matters. Further details regarding the rights and obligations attached to share classes are contained in the Articles of Association, available on www.tateandlyle.com.
Restrictions on holding sharesThere are no restrictions on the transfer of shares and prior approval is not required from the Company nor from other holders for such a transfer. No limitations are placed on the holding of shares and no share class carries special rights of control of the Company. There are no restrictions on voting rights other than those outlined above on preference shares.
The Company is not aware of any agreements between shareholders that may restrict the transfer or exercise of voting rights.
Change of controlThe Company has a committed bank facility of US$1 billion, which matures in 2012. Under the terms of this facility, the banks can give notice to Tate & Lyle to prepay outstanding amounts and cancel the commitments where there is a
change of control of the Company. The Company is the guarantor of a £200 million bond issue by its subsidiary, Tate & Lyle International Finance PLC dated 25 November 2009, which is repayable in 2019. Under the terms of the bond issue, noteholders have the option to request an early repayment where there is a change of control of the Company.
All of the Company’s share schemes contain provisions relating to a change of control. Further information is on page 50.
Essential contracts and other arrangements In light of the scope and diversity of the Group’s activities, there are no contracts or arrangements considered to be essential to the operation of the business or the Group as a whole.
Research and developmentThe Group spent £26 million (2009 – £28 million) on research and development during the year.
DonationsWorldwide charitable donations during the year totalled £714,000 (2009 – £699,000), of which £379,000 (2009 – £379,000) was donated in the UK. More details of the Group’s community involvement can be found on pages 36 and 37.
Again this year, in line with the Group’s policy, no political donations were made in the European Union (EU). Outside the EU, the Group’s US business made contributions during the year totalling US$47,000 (£29,000) (2009 – US$48,000; £27,000) to state and national political party committees and to the campaign committees of state candidates affiliated to the major parties. The total includes US$13,000 (£8,000) (2009 – US$23,000; £13,000) contributed by the Tate & Lyle Political Action Committee (PAC). The PAC is funded entirely by US employees. Employee contributions are entirely voluntary and no pressure is placed on US employees to participate. No funds are provided to the PAC by Tate & Lyle but under US law, an employee-funded PAC must bear the name of the employing company.
Payment to suppliersGroup policy is that UK operating companies should follow the CBI Prompt Payers’ Code. The Code requires the Company to agree terms of payment with suppliers, to ensure suppliers are aware of those terms, and to abide by them. Our policy is, wherever possible, to apply the requirements of the Code to wholly-owned companies around the world.
Tate & Lyle PLC is a holding company and had no amounts owing to trade creditors at 31 March 2010. The Group’s creditor days outstanding at 31 March 2010 were 53 days (2009 – 38 days), based on the ratio of Group trade creditors at the end of the year to the amounts invoiced during the year by trade creditors.
Directors’ interests in Tate & Lyle sharesThe table sets out the interests of directors and their connected persons in Tate & Lyle shares. Ordinary shares
At 31 March At 1 April 2010 20091
Sir Peter Gershon 35 255 34 700Javed Ahmed2 100 000 –Liz Airey 16 000 16 000Richard Delbridge 50 000 50 000Evert Henkes 1 016 1 000Douglas Hurt3 – –Tim Lodge 27 246 26 818Robert Walker 10 429 10 265Dr Barry Zoumas 27 000 27 000
1 Or date of appointment if later.2 Javed Ahmed was appointed a director with effect from 1 October 2009.3 Douglas Hurt was appointed a director with effect from 10 March 2010.
All of the interests set out in the table are beneficially held and no director had interests in any class of shares other than ordinary shares.
William Camp joined the Board on 1 May 2010. He does not hold any shares.
There were no changes in directors’ interests in the period from 1 April 2010 to 26 May 2010.
On behalf of the Board
Evert Henkes Chairman, Remuneration Committee 26 May 2010

Tate & Lyle Annual Report 2010 57
Governance Directors’ statement of responsibilities
Directors’ statement of responsibilitiesThe directors are responsible for preparing the annual report, the directors’ remuneration report and the Group and the Parent company financial statements in accordance with applicable law and regulations.
Company law requires the directors to prepare financial statements for each financial year. Under that law the directors have prepared the Group financial statements in accordance with International Financial Reporting Standards (IFRSs) as adopted by the EU, and the Parent company financial statements in accordance with applicable law and UK Accounting Standards (UK Generally Accepted Accounting Practice). Under company law, the directors must not approve the financial statements unless they are satisfied that they give a true and fair view of the state of affairs of the Company and the Group and of the profit or loss of the Group for that period.
In preparing these financial statements, the directors are required to:
n select suitable accounting policies and then apply them consistently;
n make judgements and accounting estimates that are reasonable and prudent;
n state whether IFRSs as adopted by the EU, and with regard to the Parent company financial statements applicable UK Accounting Standards, have been followed, subject to any material departures disclosed and explained in the Group and Parent company financial statements; and
n prepare the Group and Parent company financial statements on the going concern basis unless it is inappropriate to presume that the Group will continue in business.
The directors are responsible for keeping adequate accounting records that are sufficient to show and explain the transactions of the Company and the Group and disclose with reasonable accuracy at any time the financial position of the Company and the Group, and enable them to ensure that the financial statements and the directors’ remuneration report comply with the Companies Act 2006 and, as regards the Group financial statements, Article 4 of the IAS Regulation. They are also responsible for safeguarding the assets of the Company and the Group and hence for taking reasonable steps for the prevention and detection of fraud and other irregularities.
The directors are responsible for the maintenance and integrity of the Company’s website. UK legislation governing the preparation and dissemination of financial statements may differ from legislation in other jurisdictions.
Each of the directors, whose names and functions are listed on pages 38 and 39, confirms that, to the best of his or her knowledge:
n the Group financial statements, which have been preparedin accordance with IFRSs as adopted by the EU, give a true and fair view of the assets, liabilities, financial position and profit of the Group; and
n the business review contained in the directors’ reportincludes a fair review of the development and performance of the business and the position of the Group, together with a description of the principal risks and uncertainties that it faces.
Disclosure of information to auditorsSo far as each director is aware, there is no relevant audit information of which the Company’s auditors are unaware; and he or she has taken all the steps that he or she ought to have taken as a director in order to make himself or herself aware of any relevant audit information and to establish that the Company’s auditors are aware of that information.
The directors’ report on pages 1 to 57 of this annual report was approved by the directors on 26 May 2010.
On behalf of the Board
Robert GibberCompany Secretary 26 May 2010
Find out more about Tate & Lyle at www.tateandlyle.com S
hare
hold
er in
form
atio
nO
verv
iew
Bus
ines
s re
view
Gov
erna
nce
Fin
anci
al s
tate
men
ts
58 Tate & Lyle Annual Report 2010
We have audited the Group financial statements of Tate & Lyle PLC for the year ended 31 March 2010 which comprise the Consolidated income statement, the Consolidated statement of comprehensive income, the Consolidated statement of financial position, Consolidated statement of cash flows, the Consolidated statement of changes in shareholders’ equity and the related Notes to the consolidated financial statements. The financial reporting framework that has been applied in their preparation is applicable law and International Financial Reporting Standards (IFRSs) as adopted by the European Union.
Respective responsibilities of directors and auditors As explained more fully in the Directors’ statement of responsibilities set out on page 57, the directors are responsible for the preparation of the Group financial statements and for being satisfied that they give a true and fair view. Our responsibility is to audit the Group financial statements in accordance with applicable law and International Standards on Auditing (UK and Ireland). Those standards require us to comply with the Auditing Practices Board’s Ethical Standards for Auditors.
This report, including the opinions, has been prepared for and only for the Company’s members as a body in accordance with Chapter 3 of Part 16 of the Companies Act 2006 and for no other purpose. We do not, in giving these opinions, accept or assume responsibility for any other purpose or to any other person to whom this report is shown or into whose hands it may come save where expressly agreed by our prior consent in writing.
Scope of the audit of the financial statements An audit involves obtaining evidence about the amounts and disclosures in the financial statements sufficient to give reasonable assurance that the financial statements are free from material misstatement, whether caused by fraud or error. This includes an assessment of: whether the accounting policies are appropriate to the Group’s circumstances and have been consistently applied and adequately disclosed; the reasonableness of significant accounting estimates made by the directors; and the overall presentation of the financial statements.
Opinion on financial statements In our opinion the Group financial statements:
n give a true and fair view of the state of the Group’s affairs as at 31 March 2010 and of its profit and cash flows for the year then ended;
n have been properly prepared in accordance with IFRSs as adopted by the European Union; and
n have been prepared in accordance with the requirements of the Companies Act 2006 and Article 4 of the lAS Regulation.
Opinion on other matters prescribed by the Companies Act 2006 In our opinion the information given in the Directors’ report for the financial year for which the Group financial statements are prepared is consistent with the Group financial statements.
Matters on which we are required to report by exception We have nothing to report in respect of the following:
Under the Companies Act 2006 we are required to report to you if, in our opinion:
n certain disclosures of directors’ remuneration specified by law are not made; or
n we have not received all the information and explanations we require for our audit.
Under the Listing Rules we are required to review:
n the directors’ statement, set out on page 31, in relation to going concern; and
n the part of the Corporate Governance statement relating to the Company’s compliance with the nine provisions of the June 2008 Combined Code specified for our review.
Other matter We have reported separately on the Parent company financial statements of Tate & Lyle PLC for the year ended 31 March 2010 and on the information in the Directors’ remuneration report that is described as having been audited.
Paul Cragg (Senior Statutory Auditor)for and on behalf of PricewaterhouseCoopers LLPChartered Accountants and Statutory Auditors London 26 May 2010
Note: the maintenance and integrity of the Tate & Lyle PLC website is the responsibility of the directors; the work carried out by the auditors does not involve consideration of these matters and, accordingly, the auditors accept no responsibility for any changes that may have occurred to the financial statements since they were initially presented on the website.
Independent Auditors’ Report to the Members of Tate & Lyle PLC
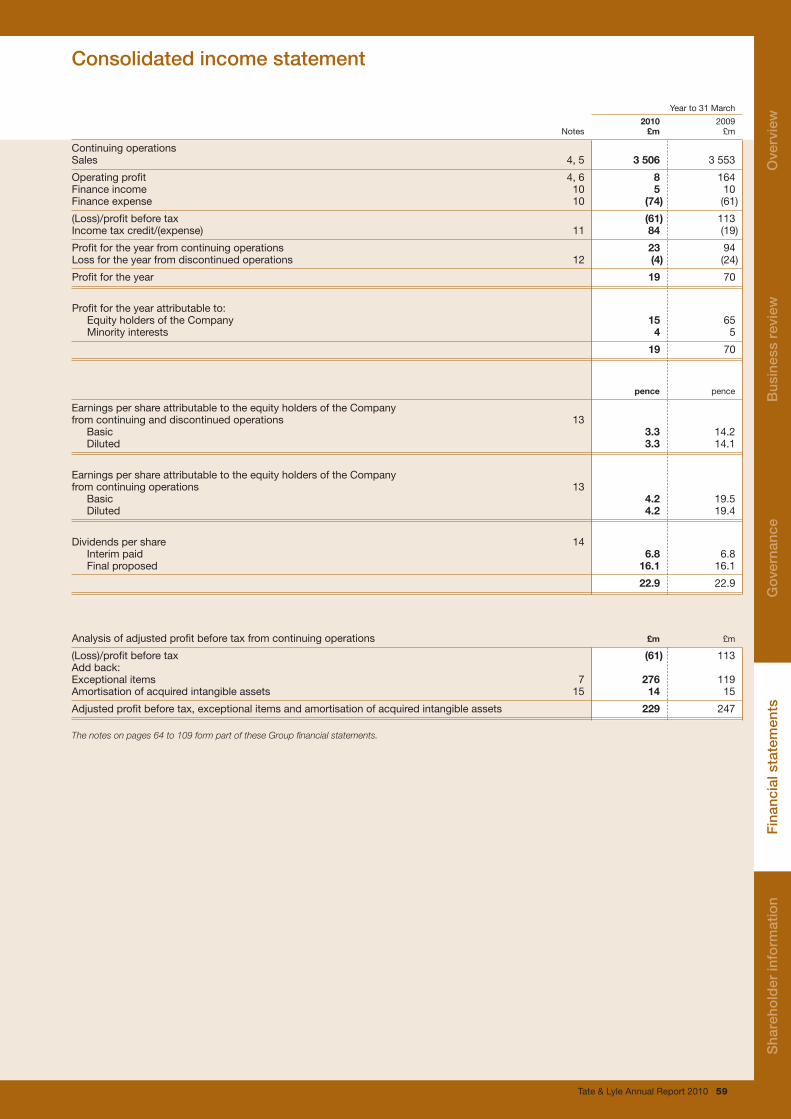
Tate & Lyle Annual Report 2010 59
Year to 31 March
2010 2009 Notes £m £m
Continuing operations Sales 4, 5 3 506 3 553
Operating profit 4, 6 8 164Finance income 10 5 10Finance expense 10 (74) (61)
(Loss)/profit before tax (61) 113Income tax credit/(expense) 11 84 (19)
Profit for the year from continuing operations 23 94Loss for the year from discontinued operations 12 (4) (24)
Profit for the year 19 70
Profit for the year attributable to: Equity holders of the Company 15 65 Minority interests 4 5
19 70
pence pence
Earnings per share attributable to the equity holders of the Company from continuing and discontinued operations 13 Basic 3.3 14.2 Diluted 3.3 14.1
Earnings per share attributable to the equity holders of the Company from continuing operations 13 Basic 4.2 19.5 Diluted 4.2 19.4
Dividends per share 14 Interim paid 6.8 6.8 Final proposed 16.1 16.1
22.9 22.9
Analysis of adjusted profit before tax from continuing operations £m £m
(Loss)/profit before tax (61) 113Add back:Exceptional items 7 276 119Amortisation of acquired intangible assets 15 14 15
Adjusted profit before tax, exceptional items and amortisation of acquired intangible assets 229 247
The notes on pages 64 to 109 form part of these Group financial statements.
Consolidated income statement
Sha
reho
lder
info
rmat
ion
Ove
rvie
wB
usin
ess
revi
ewG
over
nanc
eF
inan
cial
sta
tem
ents
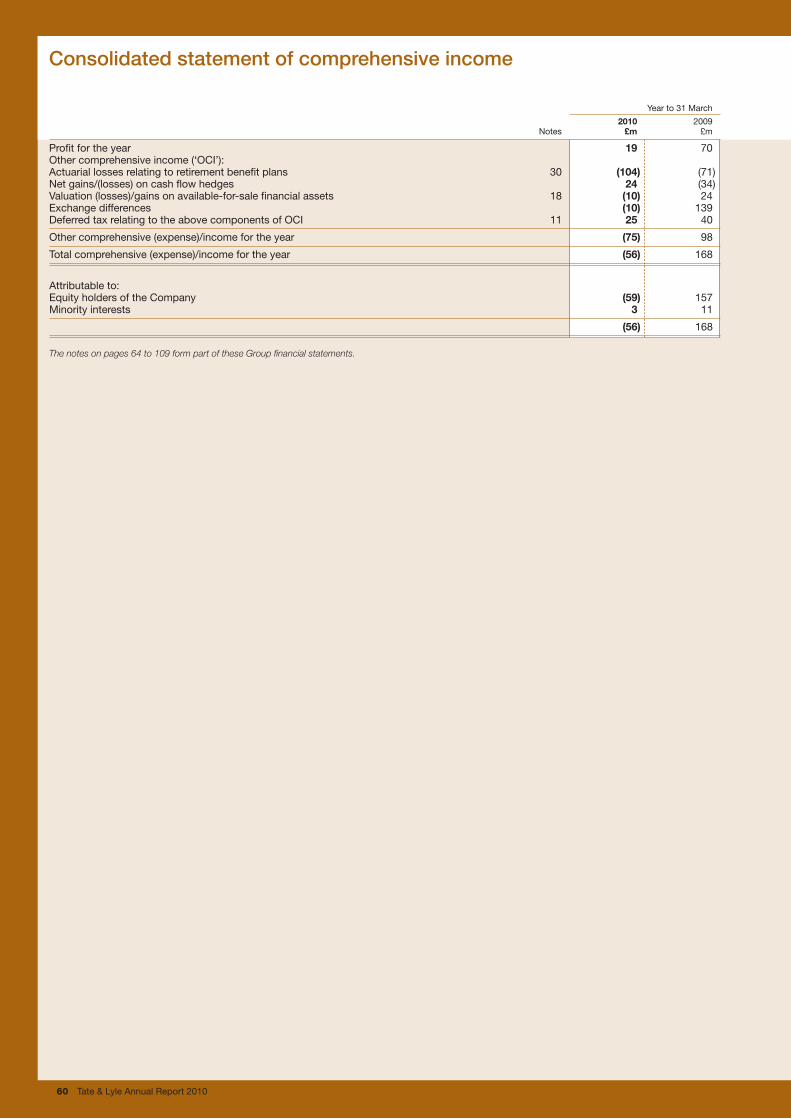
60 Tate & Lyle Annual Report 2010
Year to 31 March
2010 2009 Notes £m £m
Profit for the year 19 70Other comprehensive income (‘OCI’): Actuarial losses relating to retirement benefit plans 30 (104) (71)Net gains/(losses) on cash flow hedges 24 (34)Valuation (losses)/gains on available-for-sale financial assets 18 (10) 24Exchange differences (10) 139Deferred tax relating to the above components of OCI 11 25 40
Other comprehensive (expense)/income for the year (75) 98
Total comprehensive (expense)/income for the year (56) 168
Attributable to:Equity holders of the Company (59) 157Minority interests 3 11
(56) 168
The notes on pages 64 to 109 form part of these Group financial statements.
Consolidated statement of comprehensive income
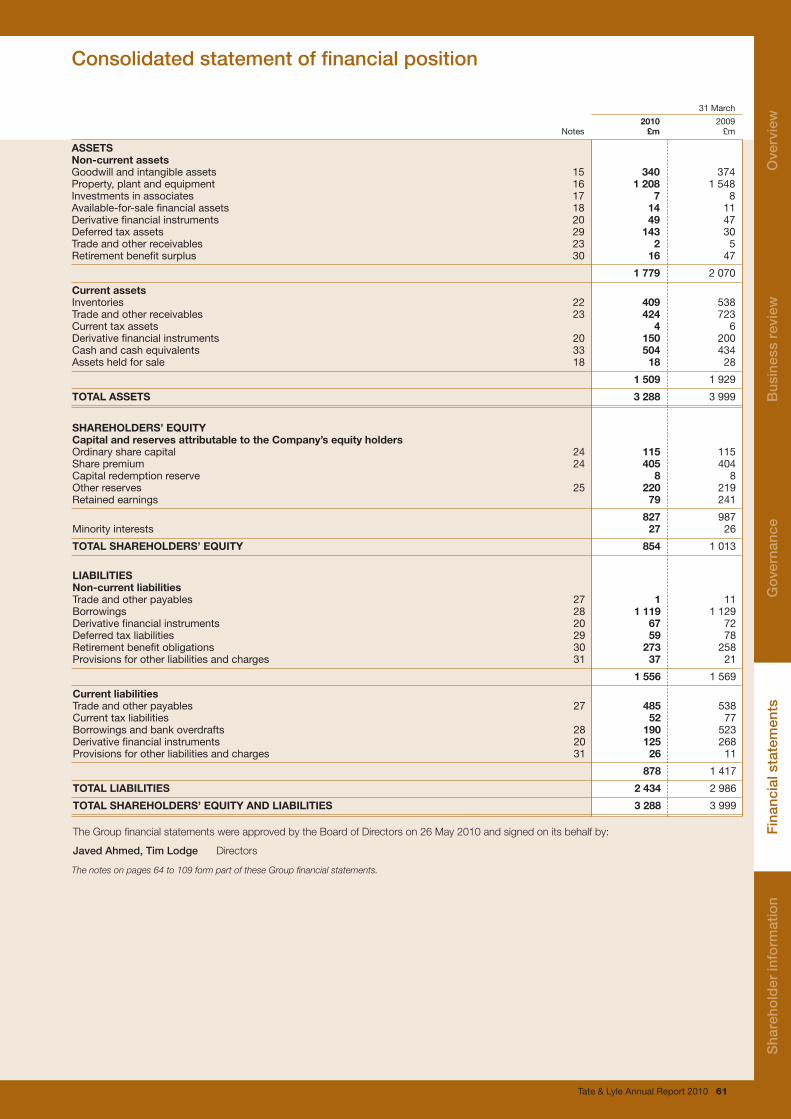
Tate & Lyle Annual Report 2010 61
31 March
2010 2009 Notes £m £m
ASSETSNon-current assetsGoodwill and intangible assets 15 340 374Property, plant and equipment 16 1 208 1 548Investments in associates 17 7 8Available-for-sale financial assets 18 14 11Derivative financial instruments 20 49 47Deferred tax assets 29 143 30Trade and other receivables 23 2 5Retirement benefit surplus 30 16 47 1 779 2 070
Current assetsInventories 22 409 538Trade and other receivables 23 424 723Current tax assets 4 6Derivative financial instruments 20 150 200Cash and cash equivalents 33 504 434Assets held for sale 18 18 28
1 509 1 929
TOTAL ASSETS 3 288 3 999
SHAREHOLDERS’ EQUITYCapital and reserves attributable to the Company’s equity holders Ordinary share capital 24 115 115Share premium 24 405 404Capital redemption reserve 8 8Other reserves 25 220 219Retained earnings 79 241
827 987Minority interests 27 26
TOTAL SHAREHOLDERS’ EQUITY 854 1 013
LIABILITIESNon-current liabilitiesTrade and other payables 27 1 11Borrowings 28 1 119 1 129Derivative financial instruments 20 67 72Deferred tax liabilities 29 59 78Retirement benefit obligations 30 273 258Provisions for other liabilities and charges 31 37 21
1 556 1 569
Current liabilitiesTrade and other payables 27 485 538Current tax liabilities 52 77Borrowings and bank overdrafts 28 190 523Derivative financial instruments 20 125 268Provisions for other liabilities and charges 31 26 11
878 1 417
TOTAL LIABILITIES 2 434 2 986
TOTAL SHAREHOLDERS’ EQUITY AND LIABILITIES 3 288 3 999
The Group financial statements were approved by the Board of Directors on 26 May 2010 and signed on its behalf by:
Javed Ahmed, Tim Lodge Directors
The notes on pages 64 to 109 form part of these Group financial statements.
Consolidated statement of financial position
Sha
reho
lder
info
rmat
ion
Ove
rvie
wB
usin
ess
revi
ewG
over
nanc
eF
inan
cial
sta
tem
ents
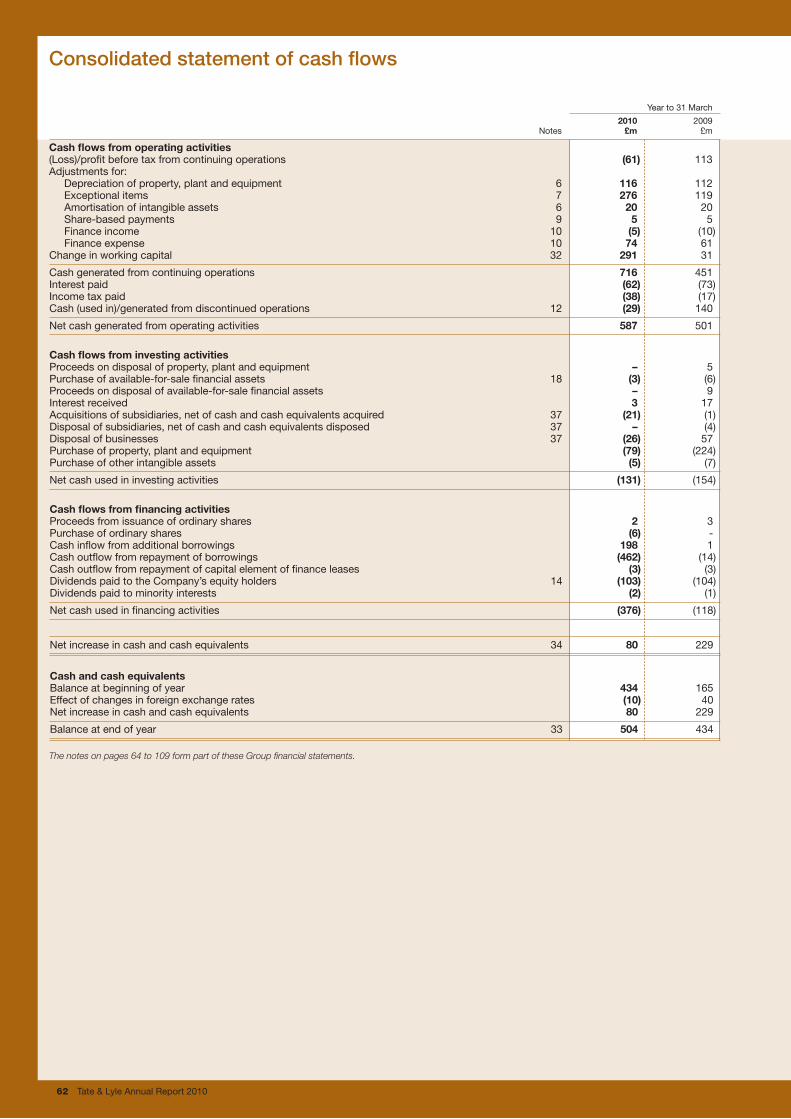
62 Tate & Lyle Annual Report 2010
Year to 31 March
2010 2009 Notes £m £m
Cash flows from operating activities(Loss)/profit before tax from continuing operations (61) 113Adjustments for: Depreciation of property, plant and equipment 6 116 112 Exceptional items 7 276 119 Amortisation of intangible assets 6 20 20 Share-based payments 9 5 5 Finance income 10 (5) (10) Finance expense 10 74 61Change in working capital 32 291 31
Cash generated from continuing operations 716 451Interest paid (62) (73)Income tax paid (38) (17)Cash (used in)/generated from discontinued operations 12 (29) 140
Net cash generated from operating activities 587 501
Cash flows from investing activitiesProceeds on disposal of property, plant and equipment – 5Purchase of available-for-sale financial assets 18 (3) (6)Proceeds on disposal of available-for-sale financial assets – 9Interest received 3 17Acquisitions of subsidiaries, net of cash and cash equivalents acquired 37 (21) (1)Disposal of subsidiaries, net of cash and cash equivalents disposed 37 – (4)Disposal of businesses 37 (26) 57Purchase of property, plant and equipment (79) (224)Purchase of other intangible assets (5) (7)
Net cash used in investing activities (131) (154)
Cash flows from financing activitiesProceeds from issuance of ordinary shares 2 3Purchase of ordinary shares (6) -Cash inflow from additional borrowings 198 1Cash outflow from repayment of borrowings (462) (14)Cash outflow from repayment of capital element of finance leases (3) (3)Dividends paid to the Company’s equity holders 14 (103) (104)Dividends paid to minority interests (2) (1)
Net cash used in financing activities (376) (118)
Net increase in cash and cash equivalents 34 80 229
Cash and cash equivalents Balance at beginning of year 434 165Effect of changes in foreign exchange rates (10) 40Net increase in cash and cash equivalents 80 229
Balance at end of year 33 504 434
The notes on pages 64 to 109 form part of these Group financial statements.
Consolidated statement of cash flows
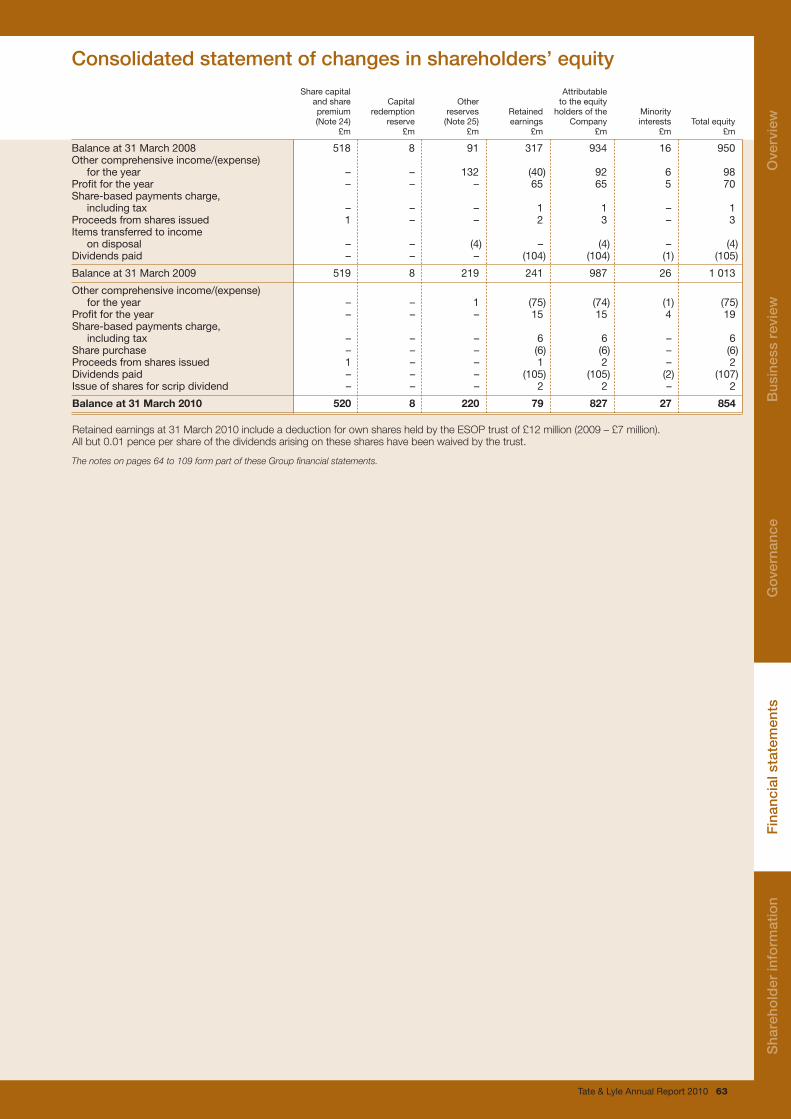
Tate & Lyle Annual Report 2010 63
Share capital Attributable and share Capital Other to the equity premium redemption reserves Retained holders of the Minority (Note 24) reserve (Note 25) earnings Company interests Total equity £m £m £m £m £m £m £m
Balance at 31 March 2008 518 8 91 317 934 16 950Other comprehensive income/(expense) for the year – – 132 (40) 92 6 98Profit for the year – – – 65 65 5 70Share-based payments charge, including tax – – – 1 1 – 1Proceeds from shares issued 1 – – 2 3 – 3Items transferred to income on disposal – – (4) – (4) – (4)Dividends paid – – – (104) (104) (1) (105)
Balance at 31 March 2009 519 8 219 241 987 26 1 013
Other comprehensive income/(expense) for the year – – 1 (75) (74) (1) (75)Profit for the year – – – 15 15 4 19Share-based payments charge, including tax – – – 6 6 – 6Share purchase – – – (6) (6) – (6)Proceeds from shares issued 1 – – 1 2 – 2Dividends paid – – – (105) (105) (2) (107)Issue of shares for scrip dividend – – – 2 2 – 2
Balance at 31 March 2010 520 8 220 79 827 27 854
Retained earnings at 31 March 2010 include a deduction for own shares held by the ESOP trust of £12 million (2009 – £7 million). All but 0.01 pence per share of the dividends arising on these shares have been waived by the trust.
The notes on pages 64 to 109 form part of these Group financial statements.
Consolidated statement of changes in shareholders’ equity
Sha
reho
lder
info
rmat
ion
Ove
rvie
wB
usin
ess
revi
ewG
over
nanc
eF
inan
cial
sta
tem
ents
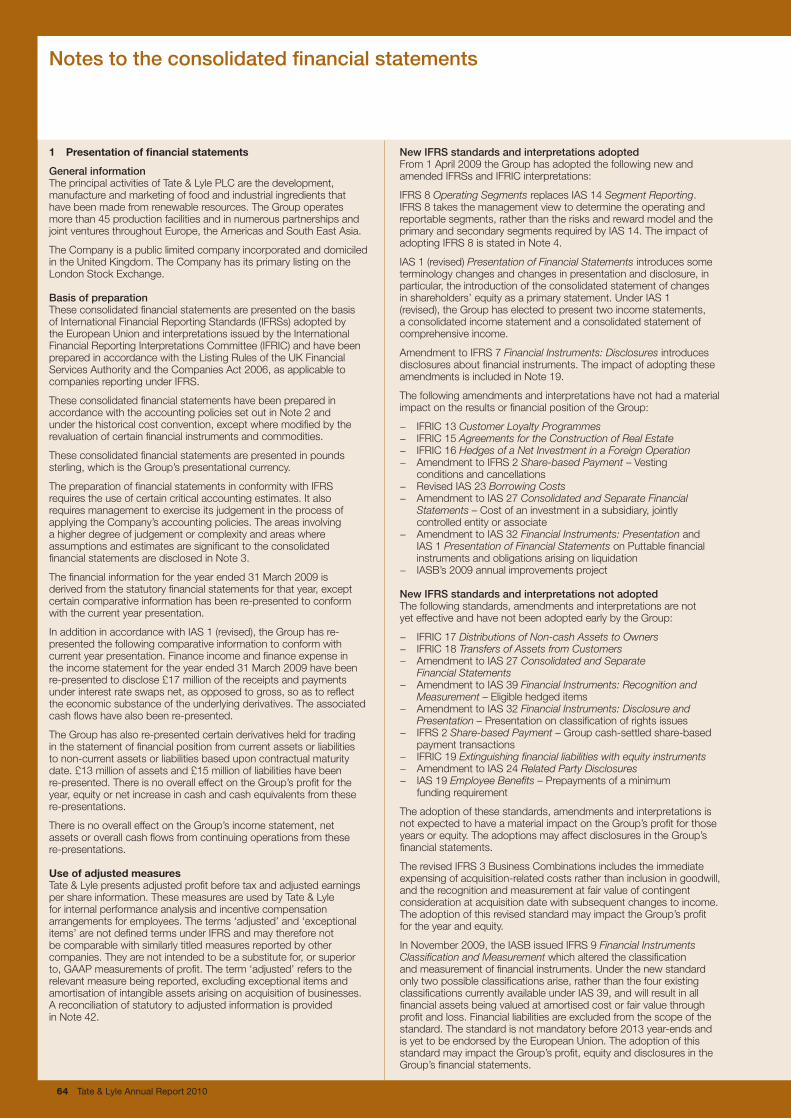
64 Tate & Lyle Annual Report 2010
Notes to the consolidated financial statements
1 Presentation of financial statements
General informationThe principal activities of Tate & Lyle PLC are the development, manufacture and marketing of food and industrial ingredients that have been made from renewable resources. The Group operates more than 45 production facilities and in numerous partnerships and joint ventures throughout Europe, the Americas and South East Asia.
The Company is a public limited company incorporated and domiciled in the United Kingdom. The Company has its primary listing on the London Stock Exchange.
Basis of preparationThese consolidated financial statements are presented on the basis of International Financial Reporting Standards (IFRSs) adopted by the European Union and interpretations issued by the International Financial Reporting Interpretations Committee (IFRIC) and have been prepared in accordance with the Listing Rules of the UK Financial Services Authority and the Companies Act 2006, as applicable to companies reporting under IFRS.
These consolidated financial statements have been prepared in accordance with the accounting policies set out in Note 2 and under the historical cost convention, except where modified by the revaluation of certain financial instruments and commodities.
These consolidated financial statements are presented in pounds sterling, which is the Group’s presentational currency.
The preparation of financial statements in conformity with IFRS requires the use of certain critical accounting estimates. It also requires management to exercise its judgement in the process of applying the Company’s accounting policies. The areas involving a higher degree of judgement or complexity and areas where assumptions and estimates are significant to the consolidated financial statements are disclosed in Note 3.
The financial information for the year ended 31 March 2009 is derived from the statutory financial statements for that year, except certain comparative information has been re-presented to conform with the current year presentation.
In addition in accordance with IAS 1 (revised), the Group has re-presented the following comparative information to conform with current year presentation. Finance income and finance expense in the income statement for the year ended 31 March 2009 have been re-presented to disclose £17 million of the receipts and payments under interest rate swaps net, as opposed to gross, so as to reflect the economic substance of the underlying derivatives. The associated cash flows have also been re-presented.
The Group has also re-presented certain derivatives held for trading in the statement of financial position from current assets or liabilities to non-current assets or liabilities based upon contractual maturity date. £13 million of assets and £15 million of liabilities have been re-presented. There is no overall effect on the Group’s profit for the year, equity or net increase in cash and cash equivalents from these re-presentations.
There is no overall effect on the Group’s income statement, net assets or overall cash flows from continuing operations from these re-presentations.
Use of adjusted measuresTate & Lyle presents adjusted profit before tax and adjusted earnings per share information. These measures are used by Tate & Lyle for internal performance analysis and incentive compensation arrangements for employees. The terms ‘adjusted’ and ‘exceptional items’ are not defined terms under IFRS and may therefore not be comparable with similarly titled measures reported by other companies. They are not intended to be a substitute for, or superior to, GAAP measurements of profit. The term ‘adjusted’ refers to the relevant measure being reported, excluding exceptional items and amortisation of intangible assets arising on acquisition of businesses. A reconciliation of statutory to adjusted information is provided in Note 42.
New IFRS standards and interpretations adoptedFrom 1 April 2009 the Group has adopted the following new and amended IFRSs and IFRIC interpretations:
IFRS 8 Operating Segments replaces IAS 14 Segment Reporting. IFRS 8 takes the management view to determine the operating and reportable segments, rather than the risks and reward model and the primary and secondary segments required by IAS 14. The impact of adopting IFRS 8 is stated in Note 4.
IAS 1 (revised) Presentation of Financial Statements introduces some terminology changes and changes in presentation and disclosure, in particular, the introduction of the consolidated statement of changes in shareholders’ equity as a primary statement. Under IAS 1 (revised), the Group has elected to present two income statements, a consolidated income statement and a consolidated statement of comprehensive income.
Amendment to IFRS 7 Financial Instruments: Disclosures introduces disclosures about financial instruments. The impact of adopting these amendments is included in Note 19.
The following amendments and interpretations have not had a material impact on the results or financial position of the Group:
− IFRIC 13 Customer Loyalty Programmes− IFRIC 15 Agreements for the Construction of Real Estate− IFRIC 16 Hedges of a Net Investment in a Foreign Operation− Amendment to IFRS 2 Share-based Payment – Vesting
conditions and cancellations− Revised IAS 23 Borrowing Costs− Amendment to IAS 27 Consolidated and Separate Financial
Statements – Cost of an investment in a subsidiary, jointly controlled entity or associate
− Amendment to IAS 32 Financial Instruments: Presentation and IAS 1 Presentation of Financial Statements on Puttable financial instruments and obligations arising on liquidation
− IASB’s 2009 annual improvements project
New IFRS standards and interpretations not adopted The following standards, amendments and interpretations are not yet effective and have not been adopted early by the Group:
− IFRIC 17 Distributions of Non-cash Assets to Owners− IFRIC 18 Transfers of Assets from Customers− Amendment to IAS 27 Consolidated and Separate
Financial Statements− Amendment to IAS 39 Financial Instruments: Recognition and
Measurement – Eligible hedged items− Amendment to IAS 32 Financial Instruments: Disclosure and
Presentation – Presentation on classification of rights issues− IFRS 2 Share-based Payment – Group cash-settled share-based
payment transactions− IFRIC 19 Extinguishing financial liabilities with equity instruments− Amendment to IAS 24 Related Party Disclosures− IAS 19 Employee Benefits – Prepayments of a minimum
funding requirement The adoption of these standards, amendments and interpretations is not expected to have a material impact on the Group’s profit for those years or equity. The adoptions may affect disclosures in the Group’s financial statements.
The revised IFRS 3 Business Combinations includes the immediate expensing of acquisition-related costs rather than inclusion in goodwill, and the recognition and measurement at fair value of contingent consideration at acquisition date with subsequent changes to income. The adoption of this revised standard may impact the Group’s profit for the year and equity.
In November 2009, the IASB issued IFRS 9 Financial Instruments Classification and Measurement which altered the classification and measurement of financial instruments. Under the new standard only two possible classifications arise, rather than the four existing classifications currently available under IAS 39, and will result in all financial assets being valued at amortised cost or fair value through profit and loss. Financial liabilities are excluded from the scope of the standard. The standard is not mandatory before 2013 year-ends and is yet to be endorsed by the European Union. The adoption of this standard may impact the Group’s profit, equity and disclosures in the Group’s financial statements.
Tate & Lyle Annual Report 2010 65
The parent company, Tate & Lyle PLC, has not adopted IFRS as its statutory reporting basis. Audited financial statements for the parent company, prepared in accordance with UK GAAP, are set out on pages 110 to 117.
2 Group accounting policies
Basis of consolidation(a) SubsidiariesSubsidiaries are all entities over which the Group has the power to govern the financial and operating policies, generally accompanying a shareholding of more than one half of the voting rights and taking into account the existence of potential voting rights. Subsidiaries are fully consolidated from the date on which control is transferred to the Group. They are de-consolidated from the date that control ceases. The purchase method of accounting is used to account for the acquisition of subsidiaries by the Group. The recognised identifiable assets, liabilities and contingent liabilities of a subsidiary are measured at their fair values at the date of acquisition. The interest of minority shareholders is stated at the minority’s proportion of the fair values of the identifiable assets, liabilities and contingent liabilities recognised. Where necessary, adjustments are made to the financial statements of subsidiaries to bring the accounting policies used into line with those used by the Group. All inter-company transactions and balances between Group entities are eliminated on consolidation.
(b)JointventuresAn entity is regarded as a joint venture if the Group has joint control over its operating and financial policies. The Group’s interests in jointly-controlled entities are accounted for by proportionate consolidation, whereby the Group’s share of the joint ventures’ income and expenses, assets and liabilities and cash flows are combined on a line-by-line basis with similar items in the Group’s financial statements. Where necessary, adjustments are made to the financial statements of joint ventures to bring the accounting policies used into line with those used by the Group. The Group recognises the portion of gains or losses on the sale of assets to the joint venture that is attributable to the other venturers. The Group does not recognise its share of profits or losses from the joint venture that result from the Group’s purchase of assets from the joint venture until it resells the assets to an external entity.
(c)AssociatesAn entity is regarded as an associate if the Group has significant influence, but not control, over its operating and financial policies. Significant influence generally exists where the Group holds more than 20% and less than 50% of the shareholders’ voting rights. Associates are accounted for under the equity method whereby the Group’s income statement includes its share of their profits and losses and the Group’s statement of financial position includes its share of their net assets. Where necessary, adjustments are made to the financial statements of associates to bring the accounting policies used into line with those used by the Group. When the Group’s share of losses in an associate equals or exceeds its interest in the associate, including any other unsecured receivables, the Group does not recognise further losses, unless it has incurred obligations or made payments on behalf of the associate.
Foreign currency translation(a)FunctionalandpresentationalcurrencyItems included in the financial statements of each of the Group’s entities are measured using the currency of the primary economic environment in which the entity operates (the ‘functional currency’). The consolidated financial statements are presented in pounds sterling, which is the Group’s presentational currency.
(b)TransactionsandbalancesForeign currency transactions are translated into the functional currency using the exchange rates prevailing at the dates of the transactions. Foreign exchange gains and losses resulting from the settlement of such transactions and from the translation at period end exchange rates of monetary assets and liabilities denominated in foreign currencies are recognised in the income statement, except when deferred in equity as qualifying cash flow hedges and qualifying net investment hedges.
(c)GroupentitiesFrom 1 April 2004, the results and financial position of all the Group’s entities that have a functional currency different from the presentational currency are translated into the presentation currency as follows:
(i) assets and liabilities, including goodwill and fair value adjustments for each statement of financial position presented, are translated at the closing rate at the date of that statement of financial position;
(ii) income and expenses for each income statement and cash flows are translated at weighted average exchange rates as a reasonable approximation to the rates prevailing on the transaction dates; and
(iii) all resulting exchange differences are recognised as a separate component of equity.
Prior to 1 April 2004, exchange differences were recognised in retained earnings.
On consolidation, exchange differences arising from borrowings and other currency instruments designated as hedges of such investments, are taken to equity.
When a foreign operation is sold, such exchange differences that have accumulated since 1 April 2004 are recognised in the income statement as part of the gain or loss on sale.
Property, plant and equipmentLand and buildings mainly comprise manufacturing sites and administrative facilities.
Property, plant and equipment is stated at historical cost less depreciation and impairment. Historical cost includes expenditure that is directly attributable to the acquisition of the items. Subsequent costs are included in the asset’s carrying amount or recognised as a separate asset, as appropriate, only when it is probable that future economic benefits associated with the expenditure will flow to the Group and the cost of the item can be measured reliably. All repairs and maintenance expenditures are charged to the income statement during the financial period in which they are incurred.
Depreciation is calculated using the straight-line method to allocate the cost or revalued amount of each asset to its residual value over its useful economic life as follows:
Freehold land: No depreciationFreehold buildings: 20 to 50 yearsLeasehold property: Period of the leaseBulk liquid storage tanks: 12 to 20 yearsPlant and machinery: 3 to 28 years
The assets’ residual values and useful lives are reviewed at each statement of financial position date and adjusted if appropriate. An asset’s carrying amount is written down immediately to its recoverable amount if the asset’s carrying amount is greater than its estimated recoverable amount.
In the prior year the useful lives of certain assets were adjusted which resulted in a reduction in the depreciation charge by approximately £6 million.
Gains and losses on disposals are determined by comparing the disposal proceeds with the carrying amount and are included in the income statement.
Leased assetsLeases of property, plant and equipment where the Group assumes substantially all the risks and rewards of ownership are classified as finance leases. Assets held under finance leases are capitalised at the lower of the fair value of the leased asset and the present value of the minimum lease payments. The corresponding leasing commitments, net of finance charges, are included in liabilities.
Leasing payments are analysed between capital and interest components so that the interest element is charged to the income statement over the period of the lease at a constant periodic rate of interest on the remaining balance of the liability outstanding.
Depreciation on assets held under finance leases is charged to the income statement.
Sha
reho
lder
info
rmat
ion
Ove
rvie
wB
usin
ess
revi
ewG
over
nanc
eF
inan
cial
sta
tem
ents
66 Tate & Lyle Annual Report 2010
Notes to the consolidated financial statements
2 Group accounting policies (continued)
All other leases are treated as operating leases with annual rentals charged to the income statement, net of any incentives granted to the lessee, over the term of the lease.
Intangible assets(a)GoodwillGoodwill is calculated as the difference between the fair value of the consideration exchanged in a business combination, including directly attributable acquisition costs, and the net fair values of the identifiable assets and liabilities acquired and is capitalised. Goodwill is tested for impairment annually and whenever there is an indication of impairment and is carried at cost less accumulated impairment losses.
Where the acquired interest in the net fair value of the identifiable assets and liabilities exceeds the cost of the business combination, the excess is recognised immediately in the income statement.
Gains and losses on the disposal of a business component include the carrying amount of goodwill relating to the entity sold.
(b)PatentsandotherintellectualpropertyPatents and other intellectual property are shown at historical cost less accumulated amortisation and impairment losses. Where the assets are acquired as part of a business combination, historical cost is based on their fair values as at the date of the combination. Amortisation of the assets is recognised on a straight-line basis over the period of their expected benefit.
(c)OtheracquiredintangibleassetsOther acquired intangible assets are intangible assets arising on consolidation of acquired businesses and include brands, recipes, customer relationships and supplier networks. Amortisation of the assets is recognised on a straight-line basis over the period of their expected benefit.
(d)OtherintangibleassetsOther intangible assets mainly include certain development expenditure and software costs. Costs incurred on development projects (relating to the design and testing of new or improved products) are recognised as intangible assets when the IAS 38 recognition criteria are met. Capitalised development costs are amortised from the commencement of the commercial production of the product on a straight-line basis over the period of its expected benefit. Research and other development expenditures are recognised as an expense as incurred. Development costs previously recognised as an expense are not recognised as an asset in a subsequent period.
ImpairmentAssets that have an indefinite useful life are not subject to amortisation and are tested annually for impairment. In addition, assets in the course of construction are not depreciated and are subject to annual impairment review. Assets that are subject to amortisation or depreciation are reviewed for impairment whenever events or changes in circumstances indicate that their carrying amounts may not be recoverable. An impairment loss is recognised for the amount by which the asset’s carrying amount exceeds its recoverable amount. The recoverable amount is the higher of an asset’s fair value less costs to sell and value in use. For the purposes of assessing impairment, assets other than goodwill are grouped at the lowest levels for which there are separately identifiable cash inflows. Goodwill is allocated to units representing the lowest level at which goodwill is monitored by the Group’s Board of Directors for internal management purposes. Further details are given in Note 3.
Financial instruments(a) Available-for-salefinancialassetsEquity instruments held by the Group and designated as available-for-sale are carried at fair value, with movements in fair value recognised directly in equity. Cumulative fair value gains or losses on an asset are recycled through the income statement when the asset is disposed or impaired. A significant or prolonged decline in the fair value of the security below its cost is considered as an indicator that the securities are impaired. Impairments are recognised in the income statement.
(b)LoansandreceivablesNon-current and current receivables and loans granted are recognised initially at fair value and thereafter carried at amortised cost less provisions for impairment. Movements in carrying value are recognised in the income statement.
(c) BorrowingsBorrowings are recognised initially at fair value, net of transaction costs incurred. Where borrowings are designated as hedged items under fair value hedges, they are subsequently remeasured for fair value changes in respect of the hedged risk with such changes recognised in the income statement. Otherwise, borrowings are subsequently stated at amortised cost; any difference between the proceeds (net of transaction costs) and the redemption value is recognised in the income statement over the period of the borrowings using the effective interest method. Borrowings are classified as current liabilities unless the Group has an unconditional right to defer settlement of the liability for at least 12 months after the balance sheet date.
(d)CommoditytradinginstrumentsCommodity instruments acquired for trading purposes are carried at fair value. Movements in fair value are recognised in the income statement.
(e) CommodityandtreasuryhedginginstrumentsUnder IAS 39, hedging relationships are categorised by type and must meet strict criteria to qualify for hedge accounting.
(i) Cash flow hedges Hedges of firm commitments and highly probable forecast transactions, including forecast intra-group transactions that are expected to affect consolidated profit or loss, are designated as cash flow hedges. To the extent that movements in the fair values of these instruments effectively offset the underlying risk being hedged they are recognised in the hedging reserve in equity until the period during which the hedged forecast transaction affects profit or loss, at which point the cumulative gain or loss is recognised in the income statement, offsetting the value of the hedged transaction.
(ii) Fair value hedges Hedges against the movement in fair value of recognised assets and liabilities are designated as fair value hedges. To the extent that movements in the fair values of these instruments effectively offset the underlying risk being hedged they are recognised in the income statement by offset against the hedged transaction.
(iii) Hedges of net investments Hedges of a net investment in a foreign operation are designated as net investment hedges. To the extent that movements in the fair values of these instruments effectively offset the underlying risk being hedged they are recognised in the translation reserve until the period during which a foreign operation is disposed of or partially disposed of, at which point the cumulative gain or loss is recognised in profit or loss, offsetting the cumulative difference recognised on the translation of the net investment.
Hedge accounting is discontinued at the point when the hedging relationship no longer qualifies for hedge accounting. In the case of cash flow hedging relationships, the cumulative movement in the fair value of the hedging instrument previously recognised in equity up to that point is retained there until the forecast transaction affects profit or loss, unless the hedged transaction is no longer expected to occur, in which case the cumulative movement in fair value is transferred to profit or loss immediately. Movements in the fair value of hedging instruments where the relationship failed to meet the IAS39 hedge accounting criteria or where the movement represents the ineffective portion of a qualifying hedging relationship are recognised in the income statement immediately as other income and expense or net finance expense, as appropriate.
(f) EmbeddedderivativesWhere an embedded derivative is not closely related to the host contract and where the host contract itself is not already recognised at fair value, movements in the fair value of the embedded derivative are separated from the associated transaction and, except where the embedded derivative is designated as a cash flow hedging instrument, recognised in the income statement.

Tate & Lyle Annual Report 2010 67
2 Group accounting policies (continued)
(g)FairvaluesFair values are based on market values where they are available. For unlisted securities the Group establishes fair value using valuation techniques. These include the use of recent arm’s length transactions, reference to other similar instruments and discounted cash flow analysis.
Where no market prices are available, the fair value of financial liabilities is calculated with reference to discounted expected future cash flows.
InventoriesInventories are stated at the lower of cost and net realisable value with the exception of certain items of merchandisable agricultural commodities which are stated at market value, in line with regional industry accounting practices.
Cost comprises direct materials and, where applicable, direct labour costs and those overheads that have been incurred in bringing the inventories to their present location and condition. Cost is calculated using the ‘first in – first out’ or weighted average cost methods, appropriate to the materials and production processes involved. Net realisable value represents the estimated selling price less all estimated costs to completion and costs to be incurred in marketing, selling and distribution.
Cash and cash equivalentsCash and cash equivalents include cash in hand, deposits held at call with banks, other short-term highly liquid investments with original maturities of three months or less, and bank overdrafts which are not considered to be borrowings in nature.
Share capitalOrdinary shares are classified as equity. Incremental costs directly attributable to the issue of new shares are shown in equity as a deduction, net of tax, from the proceeds.
Where any Group company purchases the Company’s equity share capital and holds that share either directly as treasury shares or indirectly within an ESOP trust, the consideration paid, including any directly attributable incremental costs (net of income taxes), is deducted from equity attributable to the Company’s equity holders until the shares are cancelled, reissued or disposed. Where such shares are subsequently sold or reissued, any consideration received, net of any directly attributable incremental transaction costs and the related income tax effects, is included in equity attributable to the Company’s equity holders. These shares are used to satisfy share options granted to employees under the Group’s share option schemes. The trustee of the ESOP trust purchases the Company’s shares on the open market using loans made by the Company or other loans guaranteed by the Company.
ProvisionsProvisions for liabilities and charges are recognised when the Group has a present legal or constructive obligation as a result of past events, it is more likely than not that an outflow of resources will be required to settle the obligation and the amount can be reliably measured. If the effect is material, provisions are measured using expected future cash flows discounted at a pre-tax rate that reflects current market assessments of the time value of money and, where appropriate, the risks specific to the liability. The impact of unwinding any discount is taken to finance expense.
Provisions are not recognised for future operating losses. A provision for onerous contracts is recognised when the expected benefits to be derived by the Group from a contract are lower than the unavoidable cost of meeting its obligations under the contract.
Income taxesThe charge for current tax is based on the results for the year as adjusted for items which are non-taxable or disallowed. It is calculated using rates that have been enacted or substantively enacted by the balance sheet date.
Deferred tax is accounted for using the balance sheet liability method in respect of temporary differences arising from differences between the carrying amount of assets and liabilities in the financial statements and the corresponding tax basis used in the computation of taxable
profit. In principle, deferred tax liabilities are recognised for all taxable temporary differences (except as noted below) and deferred tax assets are recognised to the extent that it is probable that taxable profits will be available against which deductible temporary differences can be utilised. Such assets and liabilities are not recognised if the temporary differences arise from goodwill or from the initial recognition (other than in a business combination) of other assets and liabilities in a transaction which affects neither the tax profit nor the accounting profit.
Deferred tax liabilities are recognised for taxable temporary differences arising on investments in subsidiaries and associates, and interests in joint ventures, except where the Group is able to control the reversal of the temporary difference and it is probable that the temporary difference will not reverse in the foreseeable future.
Deferred tax is calculated using the enacted or substantively enacted rates that are expected to apply when the asset or liability is settled. Deferred tax is charged or credited in the income statement, except when it relates to items credited or charged directly to equity, in which case the deferred tax is also dealt with in equity.
Deferred tax assets and liabilities are offset when they relate to income taxes levied by the same taxation authority and the Group intends to settle its current tax assets and liabilities on a net basis.
Revenue recognition(a)SalesofgoodsandservicesSales comprise the amount receivable in the ordinary course of business, net of value added and sales taxes, for goods and services provided. Sales are recognised at the point or points at which the Group has performed its obligations in connection with the contractual terms of the sales agreement, and in exchange obtains the right to consideration.
(b)InterestincomeInterest income is recognised on a time-proportion basis using the effective interest method.
(c)DividendincomeDividend income is recognised when the right to receive payment is established.
Employee benefits(a)PensionobligationsGroup companies operate various pension schemes. The schemes are generally funded through payments to insurance companies or trustee payments to insurance companies or trustee-administered funds, determined by periodic actuarial calculations. The Group has both defined benefit and defined contribution plans.
A defined benefit plan is a pension plan that defines an amount of pension benefit that an employee will receive on retirement, usually dependent on one or more factors such as age, years of service and compensation.
A defined contribution plan is a pension plan under which the Group pays fixed contributions into a separate entity. The Group has no legal or constructive obligations to pay further contributions if the fund does not hold sufficient assets to pay all employees the benefits relating to employee service in the current and prior periods.
The amounts recognised in the statement of financial position in respect of defined benefit pension plans are the present value of the defined benefit obligation at the balance sheet date less the fair value of plan assets, together with adjustments for actuarial gains or losses charged or credited to equity and past service costs. The defined benefit obligation is calculated annually by independent actuaries using the projected unit credit method. The present value of the defined benefit obligation is determined by discounting the estimated future cash outflows using interest rates of high-quality corporate bonds that are denominated in the currency in which the benefits will be paid, and that have terms to maturity approximating to the terms of the related pension liability. Past service costs are recognised immediately in income, unless the changes to the pension plan are conditional on the employees remaining in service for a specified period of time (the vesting period). In this case, the past service costs are amortised on a straight-line basis over the vesting period.
Any gains or losses from settlement or curtailment is recognised in the income statement when the curtailment or settlement occurs. S
hare
hold
er in
form
atio
nO
verv
iew
Bus
ines
s re
view
Gov
erna
nce
Fin
anci
al s
tate
men
ts
68 Tate & Lyle Annual Report 2010
2 Group accounting policies (continued)
Actuarial gains and losses arising from experience adjustments and changes in actuarial assumptions are charged or credited to equity immediately through the statement of comprehensive income.
Where the actuarial valuation of a scheme demonstrates that the scheme is in surplus, the recognised asset is limited to that for which the Group expects to benefit in future by refunds or a reduction in contribution.
For defined contribution plans, the Group pays contributions to publicly or privately administered pension insurance plans on a mandatory, contractual or voluntary basis. The Group has no further payment obligations once the contributions have been paid. The contributions are recognised as employee benefit expense when they are due. Prepaid contributions are recognised as an asset to the extent that a cash refund or a reduction in the future payments is available.
(b)Otherpost-employmentobligationsSome Group companies provide post-employment healthcare benefits to their retirees. The entitlement to these benefits is usually conditional on the employee remaining in service up to retirement age and the completion of a minimum service period. The expected costs of these benefits are accrued over the period of employment using an accounting methodology similar to that for defined benefit pension plans. Actuarial gains and losses arising from experience adjustments and changes in actuarial assumptions are charged or credited to equity immediately. These obligations are valued annually by independent qualified actuaries.
(c)Share-basedcompensationThe Group operates a number of equity-settled, share-based compensation plans. The fair value of employee services received in exchange for the grant of the options is recognised as an expense. The total amount to be expensed over the vesting period is determined by reference to the fair value of the options granted, excluding the impact of any non-market vesting conditions (for example, earnings targets). Non-market vesting conditions are included in assumptions about the number of options that are expected to become exercisable. At each balance sheet date, for options granted with non-market vesting conditions, the Group revises its estimates of the number of options that are expected to become exercisable. It recognises the impact of the revision of original estimates, if any, in the income statement, and a corresponding adjustment to equity. The proceeds received net of any directly attributable transaction costs are credited to share capital and share premium when the options are exercised.
Research and developmentResearch expenditure is recognised in the income statement in the year in which it is incurred. Development expenditure is recognised in the income statement in the year in which it is incurred unless it is probable that future economic benefits will flow to the Group from the asset being developed, the cost of the asset can be reliably measured and technical feasibility can be demonstrated and there is an intention to complete and utilise the asset. When the recognition criteria are met, development costs are capitalised as an intangible asset and are amortised on a straight-line basis over the estimated useful life from the time the asset is available for use.
Borrowing costsBorrowing costs directly arising from the purchase, construction or production of an asset are capitalised as part of the cost of that asset.
Exceptional itemsExceptional items comprise items of income and expense, including tax items, that are material in amount and unlikely to recur and which merit separate disclosure in order to provide an understanding of the Group’s underlying financial performance. Examples of events giving rise to the disclosure of material items of income and expense as exceptional items include, but are not limited to, impairment events, disposals of operations or individual assets, litigation claims by or against the Group and the restructuring of components of the Group’s operations. See Note 7 for further details.
Government grantsA government grant is recognised when there is reasonable assurance that any conditions attached to the grant will be satisfied and the grants will be received. A government grant is recognised at its fair value and is accounted for as a deduction against the cost concerned or within other income over the periods necessary to match the grants with the related costs that they are intended to compensate.
Dividend distributionFinal dividend distributions to the Company’s equity holders are recognised as a liability in the Group’s financial statements in the period in which the dividends are approved by the Company’s shareholders, while interim dividend distributions are recognised in the period in which the dividends are declared and paid. Where a scrip alternative is offered and taken, the distribution is effected through an issue of bonus shares from the share premium account.
Segment reportingAs disclosed in Note 1 and Note 4, the Group has adopted IFRS 8 Operating Segments. IFRS 8 requires that entities adopt the management approach to identifying reportable operating segments and reporting the financial performance of those segments. Segment information is reported for those components for which separate financial information is available and which management uses internally for allocating resources and assessing performance.
Discontinued operations and assets held for saleBusiness components that represent separate major lines of business or geographical areas of operations are recognised as discontinued if the operations have been disposed of, are being abandoned or meet the criteria to be classified as held for sale.
Assets and disposal groups are classified as held for sale if their carrying amount will be principally recovered through a sale transaction rather than through continuing use. This condition is regarded as met only when the sale is highly probable, expected to be completed within one year and the asset (or disposal group) is available for immediate sale in its present condition. Operations held for sale are held at the lower of their carrying amount on the date they are classified as held for sale and fair value less costs to sell.
3 Critical accounting estimates and judgements
In order to prepare these consolidated financial statements in accordance with the accounting policies set out in Note 2, management has used estimates and judgements to establish the amounts at which certain items are recorded. Critical accounting estimates and judgements are those that have the greatest impact on the financial statements and require the most difficult, subjective and complex judgements about matters that are inherently uncertain. Estimates are based on factors including historical experience and expectations of future events that management believe to be reasonable. However, given the judgemental nature of such estimates, actual results could be different from the assumptions used. The critical accounting estimates and judgements are set out below.
Impairment of assetsAsset impairments have the potential to significantly impact income. In order to determine whether impairments are required the Group estimates the recoverable amount of the asset. This calculation is usually based on projecting future cash flows over a five-year period and using a terminal value to incorporate expectations of growth thereafter. A discount factor is applied to obtain a current value (‘value in use’). The ‘fair value less costs to sell’ of an asset is used if this results in an amount in excess of ‘value in use’.
Estimated future cash flows for impairment calculations are based on management’s expectations of future volumes and margins based on plans and best estimates of the productivity of the assets in their current condition. Future cash flows therefore exclude benefits from major expansion projects requiring future capital expenditure where that expenditure has not been approved at the balance sheet date.
Future cash flows are discounted using a discount rate based on the Group’s weighted average cost of capital, adjusted if appropriate for circumstances specific to the asset being tested. The weighted average cost of capital is impacted by estimates of interest rates, equity returns and market and country-related risks. The Group’s weighted average cost of capital is reviewed on an annual basis.
Notes to the consolidated financial statements
Tate & Lyle Annual Report 2010 69
3 Critical accounting estimates and judgements (continued)
If the cash flow or discount rate assumptions were to change because of market conditions, the level of impairment could be different and could result in the impairment of property, plant and equipment being increased or reversed, in part or in full, at a future date.
Further details are set out in Notes 15 and 16.
Retirement benefitsAmong the range of retirement benefits provided in businesses around the Group are a number of defined benefit pension plans and an unfunded healthcare benefit scheme in the US. The amounts recorded in the financial statements for both of these types of arrangement are based on a number of assumptions, changes to which could have a material impact on the reported amounts.
Any net deficit or surplus arising on defined benefit plans and the liability under the healthcare plan is shown in the statement of financial position. The amount recorded is the difference between plan assets and liabilities at the balance sheet date. Plan assets are based on market value at that date. Plan liabilities, including healthcare liabilities, are based on actuarial estimates of the present value of future pension or other benefits that will be payable to members. The most sensitive assumptions involved in calculating the expected liabilities are mortality rates and the discount rate used to calculate the present value. If the mortality rates assumption changed, a one year increase to longevity at age 65 would increase the liability by £65 million. The main financial assumption is the real discount rate, being the excess of the discount rate over the rate of inflation. If this assumption increased by 0.1%, the gross plan liabilities would decrease by approximately £19 million.
The income statement generally comprises a regular charge to operating profit and a finance charge, which represents the net of expected income from plan assets and an interest charge on plan liabilities. These calculations are based on expected outcomes at the start of the financial year. The income statement is most sensitive to changes in expected returns from plan assets and the discount rate used to calculate the interest charge on plan liabilities. A 0.1% increase in the assumption of the real discount rate would increase the finance expense by approximately £0.1 million.
Full details of these assumptions, which are based on advice from the Group’s actuaries, are set out in Note 30.
ProvisionsThe Group recognises a provision where a legal or constructive obligation exists at the balance sheet date and a reliable estimate can be made of the likely outcome. Where appropriate, future cash outflows that are expected to arise over a number of years are discounted to a present value using a relevant discount rate.
At the balance sheet date, provisions included amounts for insurance claims payable by the Group’s reinsurance company, legal matters, employee termination and other restructuring costs.
Although provisions are reviewed on a regular basis and adjusted for management’s best current estimates, the judgemental nature of these items means that future amounts settled may be different from those provided.
Further details are set out in Note 31.
TaxationThe Group operates in a large number of tax jurisdictions around the world. Tax regulations generally are complex and in some jurisdictions agreeing tax liabilities with local tax authorities can take several years. Consequently, at the balance sheet date, tax liabilities and assets are based on management’s best estimate of the future amounts that will be settled. While the Group aims to ensure that the estimates recorded are accurate, the actual amounts could be different from those expected.
Deferred tax assets mainly represent asset impairments and retirement benefit obligations that the Group expects to recover at some time in the future and by their nature the amounts recorded are therefore dependent on management’s judgement about future events.
Further details are set out in Notes 11 and 29.
Sha
reho
lder
info
rmat
ion
Ove
rvie
wB
usin
ess
revi
ewG
over
nanc
eF
inan
cial
sta
tem
ents
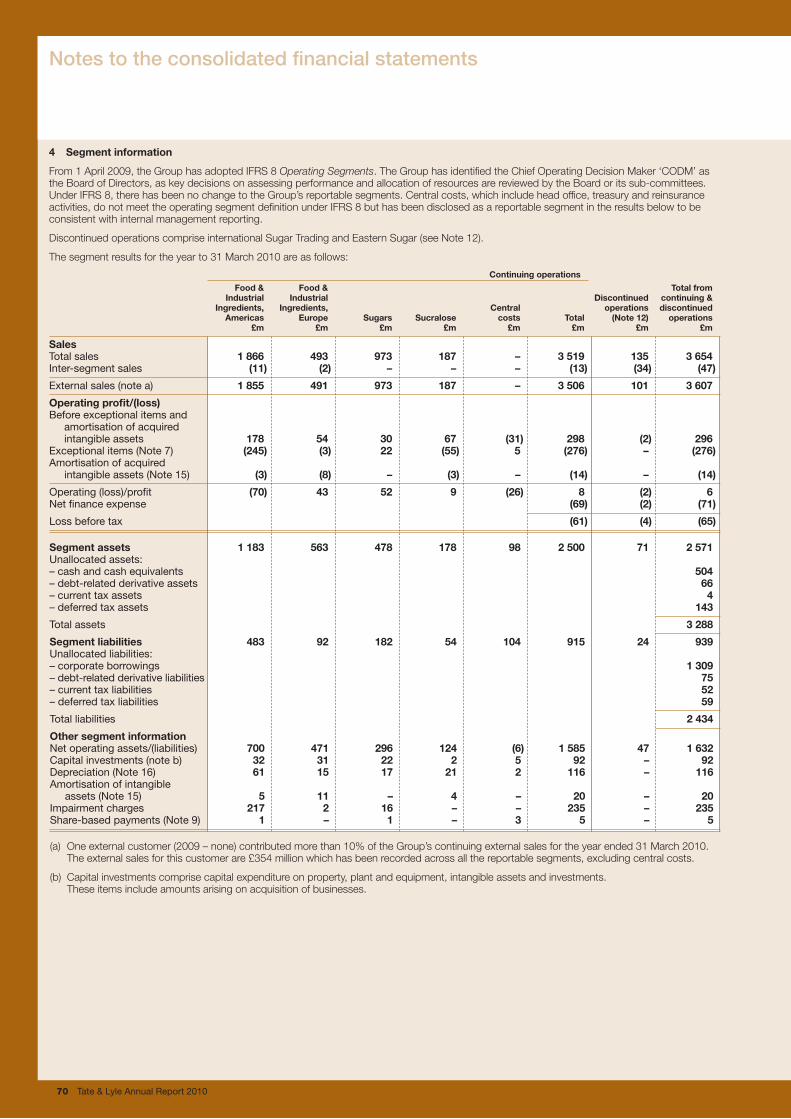
70 Tate & Lyle Annual Report 2010
Notes to the consolidated financial statements
4 Segment information
From 1 April 2009, the Group has adopted IFRS 8 Operating Segments. The Group has identified the Chief Operating Decision Maker ‘CODM’ as the Board of Directors, as key decisions on assessing performance and allocation of resources are reviewed by the Board or its sub-committees. Under IFRS 8, there has been no change to the Group’s reportable segments. Central costs, which include head office, treasury and reinsurance activities, do not meet the operating segment definition under IFRS 8 but has been disclosed as a reportable segment in the results below to be consistent with internal management reporting.
Discontinued operations comprise international Sugar Trading and Eastern Sugar (see Note 12).
The segment results for the year to 31 March 2010 are as follows:
Continuing operations
Food & Food & Total from Industrial Industrial Discontinued continuing & Ingredients, Ingredients, Central operations discontinued Americas Europe Sugars Sucralose costs Total (Note 12) operations £m £m £m £m £m £m £m £m
SalesTotal sales 1 866 493 973 187 – 3 519 135 3 654Inter-segment sales (11) (2) – – – (13) (34) (47)
External sales (note a) 1 855 491 973 187 – 3 506 101 3 607
Operating profit/(loss)Before exceptional items and amortisation of acquired intangible assets 178 54 30 67 (31) 298 (2) 296Exceptional items (Note 7) (245) (3) 22 (55) 5 (276) – (276)Amortisation of acquired intangible assets (Note 15) (3) (8) – (3) – (14) – (14)
Operating (loss)/profit (70) 43 52 9 (26) 8 (2) 6Net finance expense (69) (2) (71)
Loss before tax (61) (4) (65)
Segment assets 1 183 563 478 178 98 2 500 71 2 571Unallocated assets: – cash and cash equivalents 504– debt-related derivative assets 66– current tax assets 4– deferred tax assets 143
Total assets 3 288
Segment liabilities 483 92 182 54 104 915 24 939Unallocated liabilities: – corporate borrowings 1 309– debt-related derivative liabilities 75– current tax liabilities 52– deferred tax liabilities 59
Total liabilities 2 434
Other segment information Net operating assets/(liabilities) 700 471 296 124 (6) 1 585 47 1 632Capital investments (note b) 32 31 22 2 5 92 – 92Depreciation (Note 16) 61 15 17 21 2 116 – 116Amortisation of intangible assets (Note 15) 5 11 – 4 – 20 – 20Impairment charges 217 2 16 – – 235 – 235Share-based payments (Note 9) 1 – 1 – 3 5 – 5
(a) One external customer (2009 – none) contributed more than 10% of the Group’s continuing external sales for the year ended 31 March 2010. The external sales for this customer are £354 million which has been recorded across all the reportable segments, excluding central costs.
(b) Capital investments comprise capital expenditure on property, plant and equipment, intangible assets and investments. These items include amounts arising on acquisition of businesses.
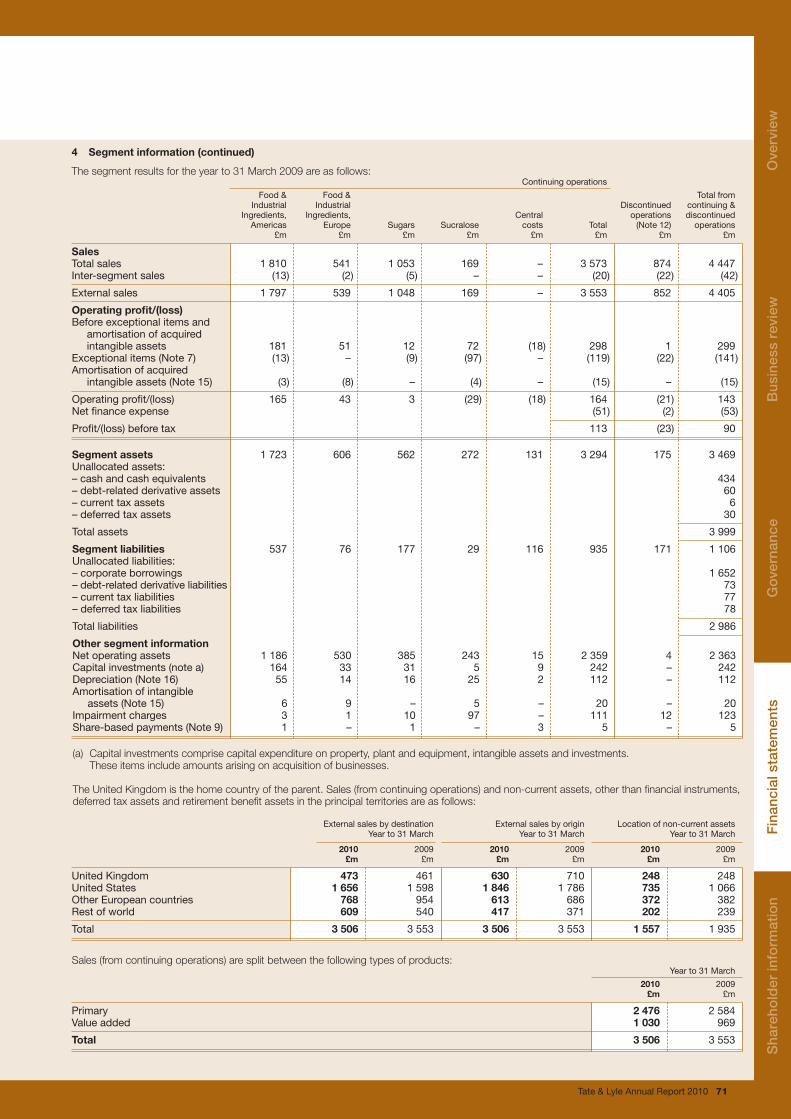
Tate & Lyle Annual Report 2010 71
4 Segment information (continued)
The segment results for the year to 31 March 2009 are as follows: Continuing operations
Food & Food & Total from Industrial Industrial Discontinued continuing & Ingredients, Ingredients, Central operations discontinued Americas Europe Sugars Sucralose costs Total (Note 12) operations £m £m £m £m £m £m £m £m
SalesTotal sales 1 810 541 1 053 169 – 3 573 874 4 447Inter-segment sales (13) (2) (5) – – (20) (22) (42)
External sales 1 797 539 1 048 169 – 3 553 852 4 405
Operating profit/(loss)Before exceptional items and amortisation of acquired intangible assets 181 51 12 72 (18) 298 1 299Exceptional items (Note 7) (13) – (9) (97) – (119) (22) (141)Amortisation of acquired intangible assets (Note 15) (3) (8) – (4) – (15) – (15)
Operating profit/(loss) 165 43 3 (29) (18) 164 (21) 143Net finance expense (51) (2) (53)
Profit/(loss) before tax 113 (23) 90
Segment assets 1 723 606 562 272 131 3 294 175 3 469Unallocated assets: – cash and cash equivalents 434– debt-related derivative assets 60– current tax assets 6– deferred tax assets 30
Total assets 3 999
Segment liabilities 537 76 177 29 116 935 171 1 106Unallocated liabilities: – corporate borrowings 1 652– debt-related derivative liabilities 73– current tax liabilities 77– deferred tax liabilities 78
Total liabilities 2 986
Other segment information Net operating assets 1 186 530 385 243 15 2 359 4 2 363Capital investments (note a) 164 33 31 5 9 242 – 242Depreciation (Note 16) 55 14 16 25 2 112 – 112Amortisation of intangible assets (Note 15) 6 9 – 5 – 20 – 20Impairment charges 3 1 10 97 – 111 12 123Share-based payments (Note 9) 1 – 1 – 3 5 – 5
(a) Capital investments comprise capital expenditure on property, plant and equipment, intangible assets and investments. These items include amounts arising on acquisition of businesses.
The United Kingdom is the home country of the parent. Sales (from continuing operations) and non-current assets, other than financial instruments, deferred tax assets and retirement benefit assets in the principal territories are as follows:
External sales by destination External sales by origin Location of non-current assets Year to 31 March Year to 31 March Year to 31 March
2010 2009 2010 2009 2010 2009 £m £m £m £m £m £m
United Kingdom 473 461 630 710 248 248United States 1 656 1 598 1 846 1 786 735 1 066 Other European countries 768 954 613 686 372 382Rest of world 609 540 417 371 202 239
Total 3 506 3 553 3 506 3 553 1 557 1 935
Sales (from continuing operations) are split between the following types of products: Year to 31 March
2010 2009 £m £m
Primary 2 476 2 584Value added 1 030 969
Total 3 506 3 553
Sha
reho
lder
info
rmat
ion
Ove
rvie
wB
usin
ess
revi
ewG
over
nanc
eF
inan
cial
sta
tem
ents
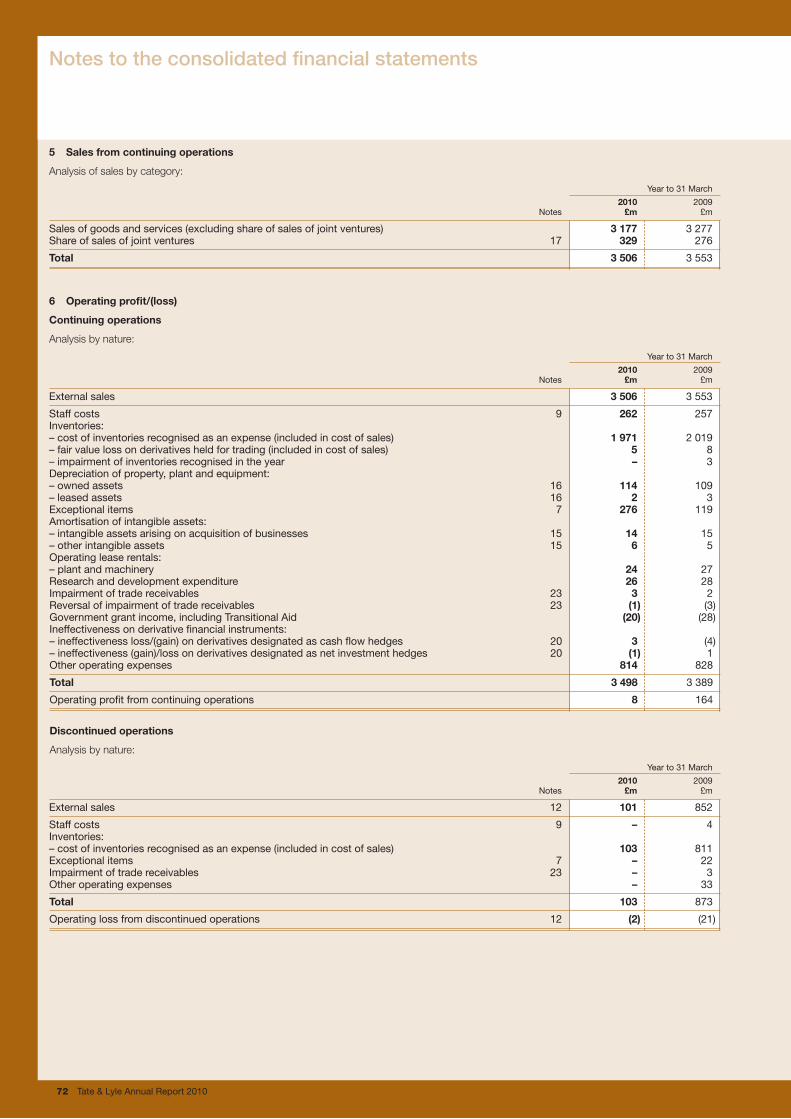
72 Tate & Lyle Annual Report 2010
5 Sales from continuing operations
Analysis of sales by category:
Year to 31 March
2010 2009 Notes £m £m
Sales of goods and services (excluding share of sales of joint ventures) 3 177 3 277 Share of sales of joint ventures 17 329 276
Total 3 506 3 553
6 Operating profit/(loss)
Continuing operations
Analysis by nature:
Year to 31 March 2010 2009 Notes £m £m
External sales 3 506 3 553
Staff costs 9 262 257Inventories:– cost of inventories recognised as an expense (included in cost of sales) 1 971 2 019– fair value loss on derivatives held for trading (included in cost of sales) 5 8– impairment of inventories recognised in the year – 3Depreciation of property, plant and equipment:– owned assets 16 114 109– leased assets 16 2 3Exceptional items 7 276 119Amortisation of intangible assets:– intangible assets arising on acquisition of businesses 15 14 15– other intangible assets 15 6 5Operating lease rentals:– plant and machinery 24 27Research and development expenditure 26 28Impairment of trade receivables 23 3 2Reversal of impairment of trade receivables 23 (1) (3)Government grant income, including Transitional Aid (20) (28)Ineffectiveness on derivative financial instruments:– ineffectiveness loss/(gain) on derivatives designated as cash flow hedges 20 3 (4)– ineffectiveness (gain)/loss on derivatives designated as net investment hedges 20 (1) 1Other operating expenses 814 828
Total 3 498 3 389
Operating profit from continuing operations 8 164
Discontinued operations
Analysis by nature:
Year to 31 March
2010 2009 Notes £m £m
External sales 12 101 852
Staff costs 9 – 4Inventories:– cost of inventories recognised as an expense (included in cost of sales) 103 811Exceptional items 7 – 22Impairment of trade receivables 23 – 3Other operating expenses – 33
Total 103 873
Operating loss from discontinued operations 12 (2) (21)
Notes to the consolidated financial statements
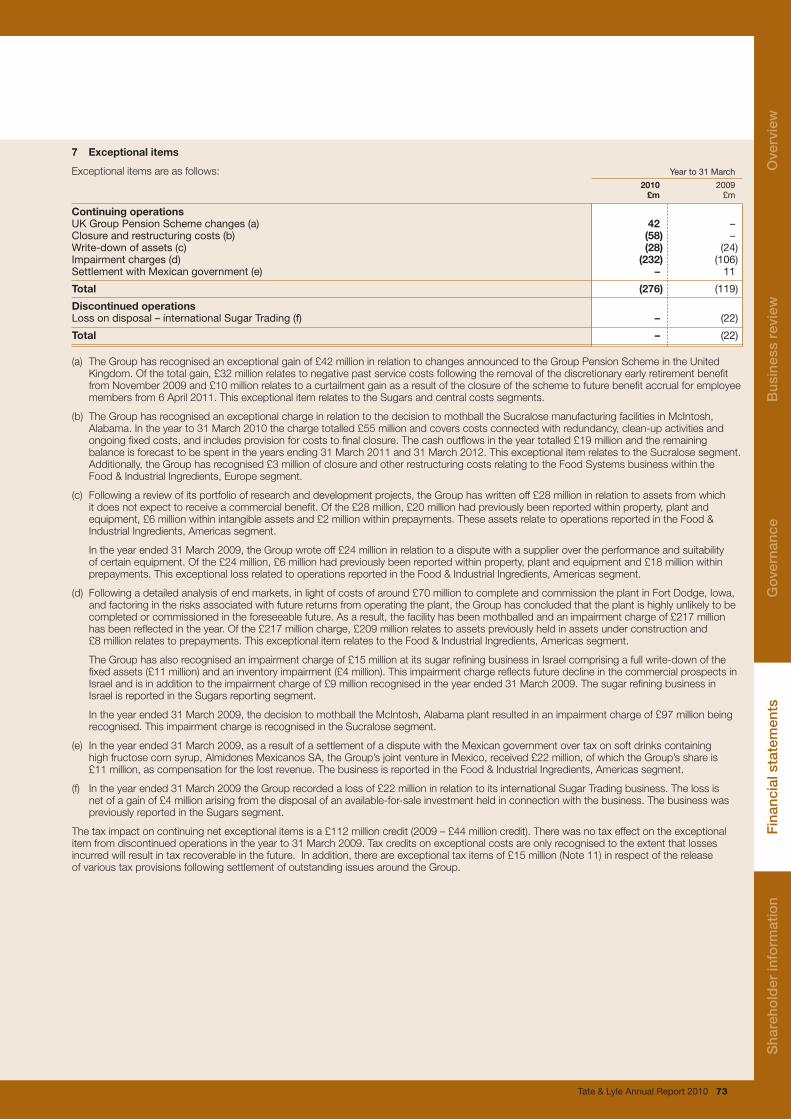
Tate & Lyle Annual Report 2010 73
7 Exceptional items
Exceptional items are as follows: Year to 31 March
2010 2009 £m £m
Continuing operationsUK Group Pension Scheme changes (a) 42 – Closure and restructuring costs (b) (58) – Write-down of assets (c) (28) (24)Impairment charges (d) (232) (106)Settlement with Mexican government (e) – 11
Total (276) (119)
Discontinued operationsLoss on disposal – international Sugar Trading (f) – (22)
Total – (22)
(a) The Group has recognised an exceptional gain of £42 million in relation to changes announced to the Group Pension Scheme in the United Kingdom. Of the total gain, £32 million relates to negative past service costs following the removal of the discretionary early retirement benefit from November 2009 and £10 million relates to a curtailment gain as a result of the closure of the scheme to future benefit accrual for employee members from 6 April 2011. This exceptional item relates to the Sugars and central costs segments.
(b) The Group has recognised an exceptional charge in relation to the decision to mothball the Sucralose manufacturing facilities in McIntosh, Alabama. In the year to 31 March 2010 the charge totalled £55 million and covers costs connected with redundancy, clean-up activities and ongoing fixed costs, and includes provision for costs to final closure. The cash outflows in the year totalled £19 million and the remaining balance is forecast to be spent in the years ending 31 March 2011 and 31 March 2012. This exceptional item relates to the Sucralose segment. Additionally, the Group has recognised £3 million of closure and other restructuring costs relating to the Food Systems business within the Food & Industrial Ingredients, Europe segment.
(c) Following a review of its portfolio of research and development projects, the Group has written off £28 million in relation to assets from which it does not expect to receive a commercial benefit. Of the £28 million, £20 million had previously been reported within property, plant and equipment, £6 million within intangible assets and £2 million within prepayments. These assets relate to operations reported in the Food & Industrial Ingredients, Americas segment.
In the year ended 31 March 2009, the Group wrote off £24 million in relation to a dispute with a supplier over the performance and suitability of certain equipment. Of the £24 million, £6 million had previously been reported within property, plant and equipment and £18 million within prepayments. This exceptional loss related to operations reported in the Food & Industrial Ingredients, Americas segment.
(d) Following a detailed analysis of end markets, in light of costs of around £70 million to complete and commission the plant in Fort Dodge, Iowa, and factoring in the risks associated with future returns from operating the plant, the Group has concluded that the plant is highly unlikely to be completed or commissioned in the foreseeable future. As a result, the facility has been mothballed and an impairment charge of £217 million has been reflected in the year. Of the £217 million charge, £209 million relates to assets previously held in assets under construction and £8 million relates to prepayments. This exceptional item relates to the Food & Industrial Ingredients, Americas segment.
The Group has also recognised an impairment charge of £15 million at its sugar refining business in Israel comprising a full write-down of the fixed assets (£11 million) and an inventory impairment (£4 million). This impairment charge reflects future decline in the commercial prospects in Israel and is in addition to the impairment charge of £9 million recognised in the year ended 31 March 2009. The sugar refining business in Israel is reported in the Sugars reporting segment.
In the year ended 31 March 2009, the decision to mothball the McIntosh, Alabama plant resulted in an impairment charge of £97 million being recognised. This impairment charge is recognised in the Sucralose segment.
(e) In the year ended 31 March 2009, as a result of a settlement of a dispute with the Mexican government over tax on soft drinks containing high fructose corn syrup, Almidones Mexicanos SA, the Group’s joint venture in Mexico, received £22 million, of which the Group’s share is £11 million, as compensation for the lost revenue. The business is reported in the Food & Industrial Ingredients, Americas segment.
(f) In the year ended 31 March 2009 the Group recorded a loss of £22 million in relation to its international Sugar Trading business. The loss is net of a gain of £4 million arising from the disposal of an available-for-sale investment held in connection with the business. The business was previously reported in the Sugars segment.
The tax impact on continuing net exceptional items is a £112 million credit (2009 – £44 million credit). There was no tax effect on the exceptional item from discontinued operations in the year to 31 March 2009. Tax credits on exceptional costs are only recognised to the extent that losses incurred will result in tax recoverable in the future. In addition, there are exceptional tax items of £15 million (Note 11) in respect of the release of various tax provisions following settlement of outstanding issues around the Group.
Sha
reho
lder
info
rmat
ion
Ove
rvie
wB
usin
ess
revi
ewG
over
nanc
eF
inan
cial
sta
tem
ents

74 Tate & Lyle Annual Report 2010
8 Auditors’ remuneration
During the year the Group (including its overseas subsidiaries) obtained the following services from the Company’s auditors as detailed below: Year to 31 March
2010 2009 £m £m
Fees payable to the Company’s auditors for the audit of the Company’s annual financial statements 0.6 0.7Fees payable to the Company’s auditors and its associates for other services:– the audit of the Company’s subsidiaries, pursuant to legislation 1.5 1.5
Total audit fees 2.1 2.2Other services pursuant to legislation 0.1 0.1All other services 0.2 0.1
Total 2.4 2.4
In addition to the above, fees totalling £0.1 million (2009 – £0.1 million) were paid to the Company’s auditors in respect of the audit of Group pension schemes.
9 Staff costs
Staff costs for the Group during the year were as follows:
Year to 31 March 2010 Year to 31 March 2009
Continuing Discontinued Continuing Discontinued operations operations operations operations Notes £m £m £m £m
Wages and salaries 221 – 215 4Social security costs 23 – 22 –Other pension costs:– defined benefit schemes 30 9 – 12 –– defined contribution schemes 2 – 1 – – retirement healthcare benefits 30 2 – 2 –Share-based payments 26 5 – 5 –
Total 262 – 257 4
The average number of people employed by the Group, excluding associates’ employees and including a proportionate share of people employed by joint ventures, is set out below. As required by the Companies Act 2006, this includes part-time employees:
Year to 31 March
By business segment 2010 2009
Food & Industrial Ingredients, Americas 2 376 2 512Food & Industrial Ingredients, Europe 1 340 1 998Sugars 1 391 1 359Sucralose 229 262Central 280 278
Total 5 616 6 409
Included in the above numbers are 3 (2009 – 52) employees relating to discontinued operations, where all employees were employed by Sugars in both years.
The number of people employed by the Group at 31 March 2010 was 5,666 (2009 – 5,718).
Key management compensation
Year to 31 March
2010 2009 £m £m
Salaries and short-term employee benefits 5 3Retirement benefits 1 1Share-based payments 2 1Share option gains 1 –Termination benefits – 2
Total 9 7
Key management are represented by the Group Executive Committee, which was formed on 1 July 2008 replacing the Group Management Committee. The Group Executive Committee as at 31 March 2010 consisted of the Company’s executive directors, details of whose remuneration are given in the directors’ remuneration report on pages 47 to 56, the Company Secretary and General Counsel, the Presidents of the four business divisions, the President, Global R&D and the Group Human Resources Director.
The aggregate emoluments of directors in respect of qualifying services to the Company were £4 million (2009 – £4 million).
Notes to the consolidated financial statements
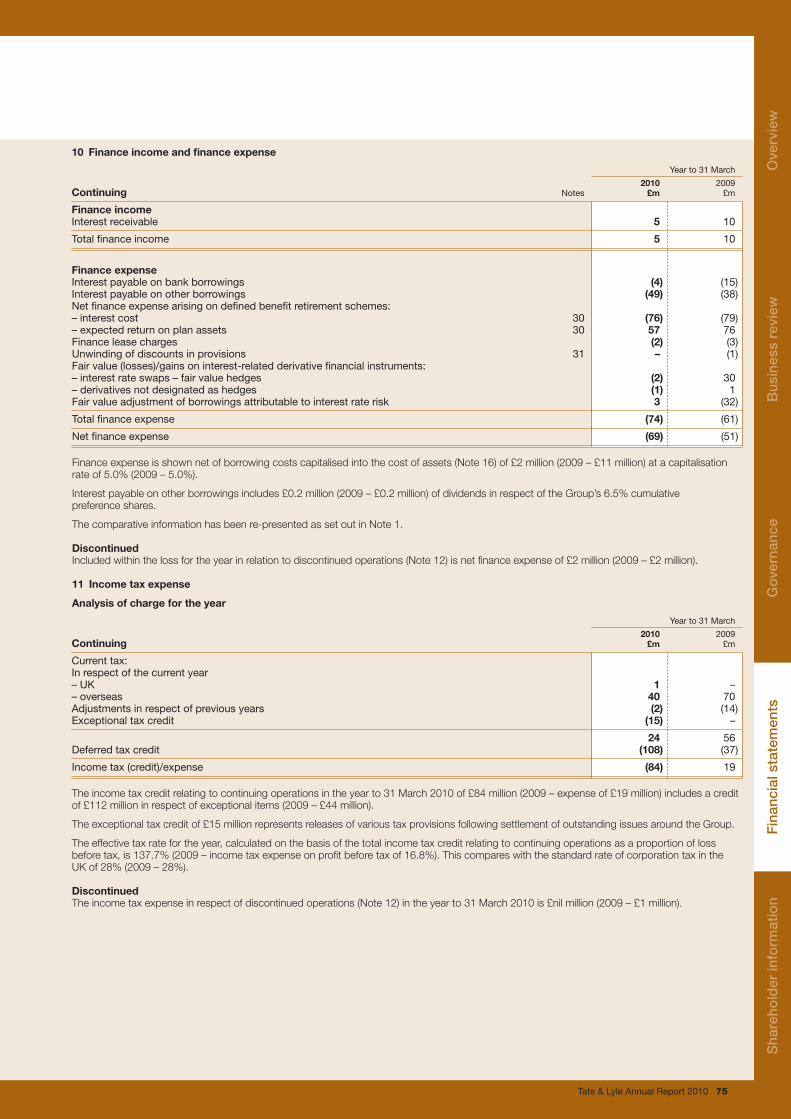
Tate & Lyle Annual Report 2010 75
10 Finance income and finance expense
Year to 31 March
2010 2009Continuing Notes £m £m
Finance incomeInterest receivable 5 10
Total finance income 5 10
Finance expenseInterest payable on bank borrowings (4) (15)Interest payable on other borrowings (49) (38)Net finance expense arising on defined benefit retirement schemes:– interest cost 30 (76) (79)– expected return on plan assets 30 57 76Finance lease charges (2) (3)Unwinding of discounts in provisions 31 – (1)Fair value (losses)/gains on interest-related derivative financial instruments:– interest rate swaps – fair value hedges (2) 30– derivatives not designated as hedges (1) 1Fair value adjustment of borrowings attributable to interest rate risk 3 (32)
Total finance expense (74) (61)
Net finance expense (69) (51)
Finance expense is shown net of borrowing costs capitalised into the cost of assets (Note 16) of £2 million (2009 – £11 million) at a capitalisation rate of 5.0% (2009 – 5.0%).
Interest payable on other borrowings includes £0.2 million (2009 – £0.2 million) of dividends in respect of the Group’s 6.5% cumulative preference shares.
The comparative information has been re-presented as set out in Note 1.
DiscontinuedIncluded within the loss for the year in relation to discontinued operations (Note 12) is net finance expense of £2 million (2009 – £2 million).
11 Income tax expense
Analysis of charge for the year
Year to 31 March
2010 2009Continuing £m £m
Current tax:In respect of the current year– UK 1 –– overseas 40 70Adjustments in respect of previous years (2) (14)Exceptional tax credit (15) –
24 56Deferred tax credit (108) (37)
Income tax (credit)/expense (84) 19
The income tax credit relating to continuing operations in the year to 31 March 2010 of £84 million (2009 – expense of £19 million) includes a credit of £112 million in respect of exceptional items (2009 – £44 million).
The exceptional tax credit of £15 million represents releases of various tax provisions following settlement of outstanding issues around the Group.
The effective tax rate for the year, calculated on the basis of the total income tax credit relating to continuing operations as a proportion of loss before tax, is 137.7% (2009 – income tax expense on profit before tax of 16.8%). This compares with the standard rate of corporation tax in the UK of 28% (2009 – 28%).
DiscontinuedThe income tax expense in respect of discontinued operations (Note 12) in the year to 31 March 2010 is £nil million (2009 – £1 million).
Sha
reho
lder
info
rmat
ion
Ove
rvie
wB
usin
ess
revi
ewG
over
nanc
eF
inan
cial
sta
tem
ents

76 Tate & Lyle Annual Report 2010
11 Income tax expense (continued) Year to 31 March
2010 2009Continuing £m £m
(Loss)/profit before tax (61) 113
Corporation tax (credit)/charge thereon at 28% (2009 – 28%) (17) 32Adjusted for the effects of:– exceptional tax credit (15) –– (income not taxable)/expenses not deductible for tax purposes (2) 2– losses not recognised 19 29– adjustments to tax in respect of previous periods (2) (7)– different tax rates applied on overseas earnings (67) (37)
Total (84) 19
The effective tax rate relating to continuing operations on profit before exceptional items, amortisation and exceptional tax items is 20.4% (2009 – 27.3%).
Tax credit/(charge) relating to components of other comprehensive income Year to 31 March
2010 2009 £m £m
Retirement benefit obligations 29 31Cash flow hedges (4) 9Available for sale financial assets – –
Tax credit relating to components of other comprehensive income 25 40
Current tax – –Deferred tax (Note 29) 25 40
Tax on items recognised directly in equity
Year to 31 March
2010 2009 £m £m
Deferred tax (credit)/charge on share-based payments (1) 4
Total (1) 4
12 Discontinued operations
As previously reported, during the year ended 31 March 2009 the Group reached an agreement for the sale of its international Sugar Trading operations to Bunge Limited. Accordingly, the results of the international Sugar Trading operations are presented as discontinued operations for the years to 31 March 2010 and 31 March 2009. Under the terms of the sale agreement, the Group managed the working capital of the business until 31 March 2009, when the balances were assumed by Bunge.
Following an extensive review of the impact of the new EU Sugar Regime, the Group’s Eastern Sugar joint venture ceased processing beets by March 2007 and renounced its sugar quotas in Hungary, Czech Republic and Slovakia in return for Restructuring Aid. Accordingly, the results of Eastern Sugar are presented as discontinued operations for the years ended 31 March 2010 and 31 March 2009.
The results of international Sugar Trading and Eastern Sugar were both reported in the Sugars segment.
Notes to the consolidated financial statements
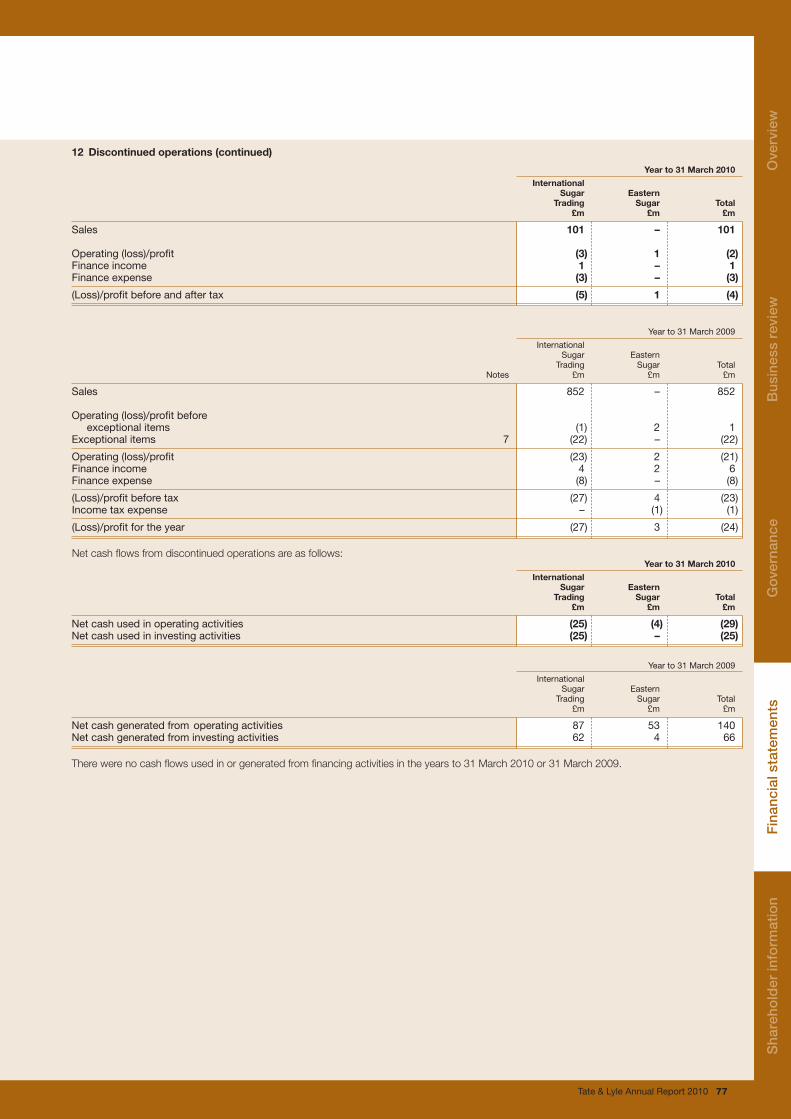
Tate & Lyle Annual Report 2010 77
12 Discontinued operations (continued)
Year to 31 March 2010
International Sugar Eastern Trading Sugar Total £m £m £m
Sales 101 – 101
Operating (loss)/profit (3) 1 (2)Finance income 1 – 1Finance expense (3) – (3)
(Loss)/profit before and after tax (5) 1 (4)
Year to 31 March 2009
International Sugar Eastern Trading Sugar Total Notes £m £m £m
Sales 852 – 852
Operating (loss)/profit before exceptional items (1) 2 1Exceptional items 7 (22) – (22)
Operating (loss)/profit (23) 2 (21)Finance income 4 2 6Finance expense (8) – (8)
(Loss)/profit before tax (27) 4 (23)Income tax expense – (1) (1)
(Loss)/profit for the year (27) 3 (24)
Net cash flows from discontinued operations are as follows: Year to 31 March 2010
International Sugar Eastern Trading Sugar Total £m £m £m
Net cash used in operating activities (25) (4) (29)Net cash used in investing activities (25) – (25)
Year to 31 March 2009
International Sugar Eastern Trading Sugar Total £m £m £m
Net cash generated from operating activities 87 53 140Net cash generated from investing activities 62 4 66
There were no cash flows used in or generated from financing activities in the years to 31 March 2010 or 31 March 2009.S
hare
hold
er in
form
atio
nO
verv
iew
Bus
ines
s re
view
Gov
erna
nce
Fin
anci
al s
tate
men
ts
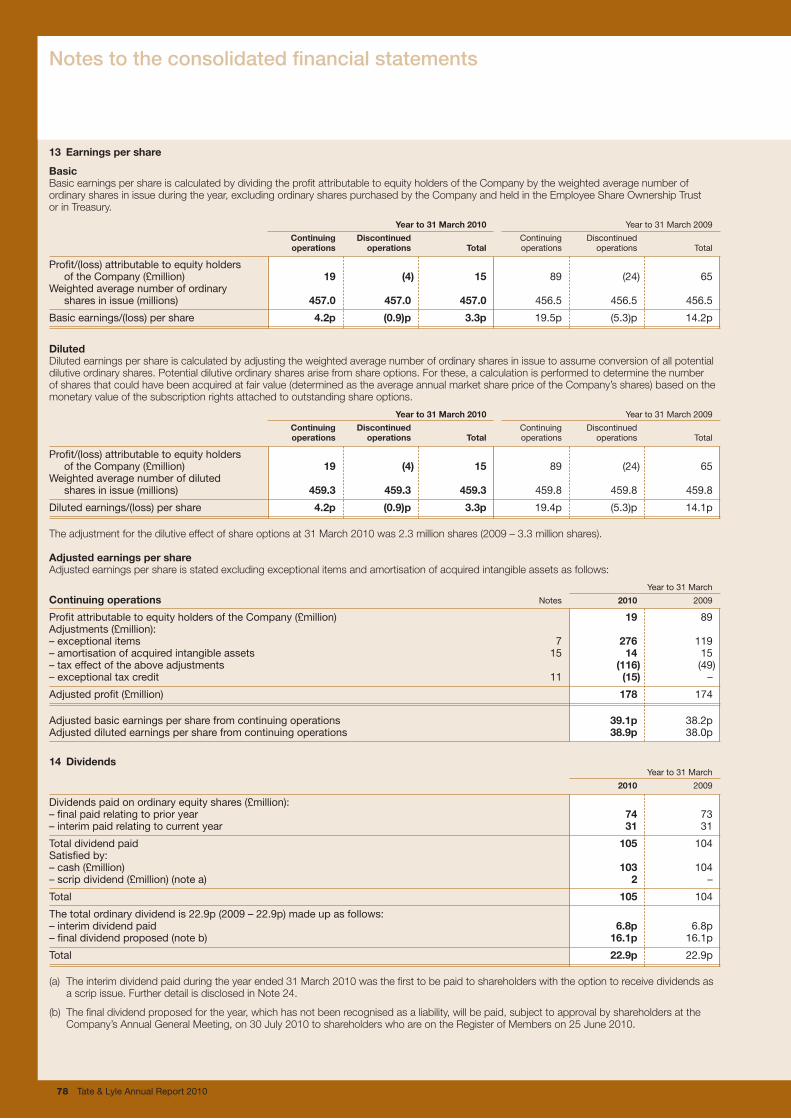
78 Tate & Lyle Annual Report 2010
13 Earnings per share
BasicBasic earnings per share is calculated by dividing the profit attributable to equity holders of the Company by the weighted average number of ordinary shares in issue during the year, excluding ordinary shares purchased by the Company and held in the Employee Share Ownership Trust or in Treasury.
Year to 31 March 2010 Year to 31 March 2009 Continuing Discontinued Continuing Discontinued operations operations Total operations operations Total
Profit/(loss) attributable to equity holders of the Company (£million) 19 (4) 15 89 (24) 65Weighted average number of ordinary shares in issue (millions) 457.0 457.0 457.0 456.5 456.5 456.5
Basic earnings/(loss) per share 4.2p (0.9)p 3.3p 19.5p (5.3)p 14.2p
DilutedDiluted earnings per share is calculated by adjusting the weighted average number of ordinary shares in issue to assume conversion of all potential dilutive ordinary shares. Potential dilutive ordinary shares arise from share options. For these, a calculation is performed to determine the number of shares that could have been acquired at fair value (determined as the average annual market share price of the Company’s shares) based on the monetary value of the subscription rights attached to outstanding share options.
Year to 31 March 2010 Year to 31 March 2009 Continuing Discontinued Continuing Discontinued operations operations Total operations operations Total
Profit/(loss) attributable to equity holders of the Company (£million) 19 (4) 15 89 (24) 65Weighted average number of diluted shares in issue (millions) 459.3 459.3 459.3 459.8 459.8 459.8
Diluted earnings/(loss) per share 4.2p (0.9)p 3.3p 19.4p (5.3)p 14.1p
The adjustment for the dilutive effect of share options at 31 March 2010 was 2.3 million shares (2009 – 3.3 million shares).
Adjusted earnings per shareAdjusted earnings per share is stated excluding exceptional items and amortisation of acquired intangible assets as follows:
Year to 31 March
Continuing operations Notes 2010 2009
Profit attributable to equity holders of the Company (£million) 19 89Adjustments (£million):– exceptional items 7 276 119– amortisation of acquired intangible assets 15 14 15– tax effect of the above adjustments (116) (49)– exceptional tax credit 11 (15) –
Adjusted profit (£million) 178 174
Adjusted basic earnings per share from continuing operations 39.1p 38.2pAdjusted diluted earnings per share from continuing operations 38.9p 38.0p
14 Dividends Year to 31 March
2010 2009
Dividends paid on ordinary equity shares (£million):– final paid relating to prior year 74 73– interim paid relating to current year 31 31
Total dividend paid 105 104Satisfied by:– cash (£million) 103 104– scrip dividend (£million) (note a) 2 –
Total 105 104
The total ordinary dividend is 22.9p (2009 – 22.9p) made up as follows:– interim dividend paid 6.8p 6.8p– final dividend proposed (note b) 16.1p 16.1p
Total 22.9p 22.9p
(a) The interim dividend paid during the year ended 31 March 2010 was the first to be paid to shareholders with the option to receive dividends as a scrip issue. Further detail is disclosed in Note 24.
(b) The final dividend proposed for the year, which has not been recognised as a liability, will be paid, subject to approval by shareholders at the Company’s Annual General Meeting, on 30 July 2010 to shareholders who are on the Register of Members on 25 June 2010.
Notes to the consolidated financial statements
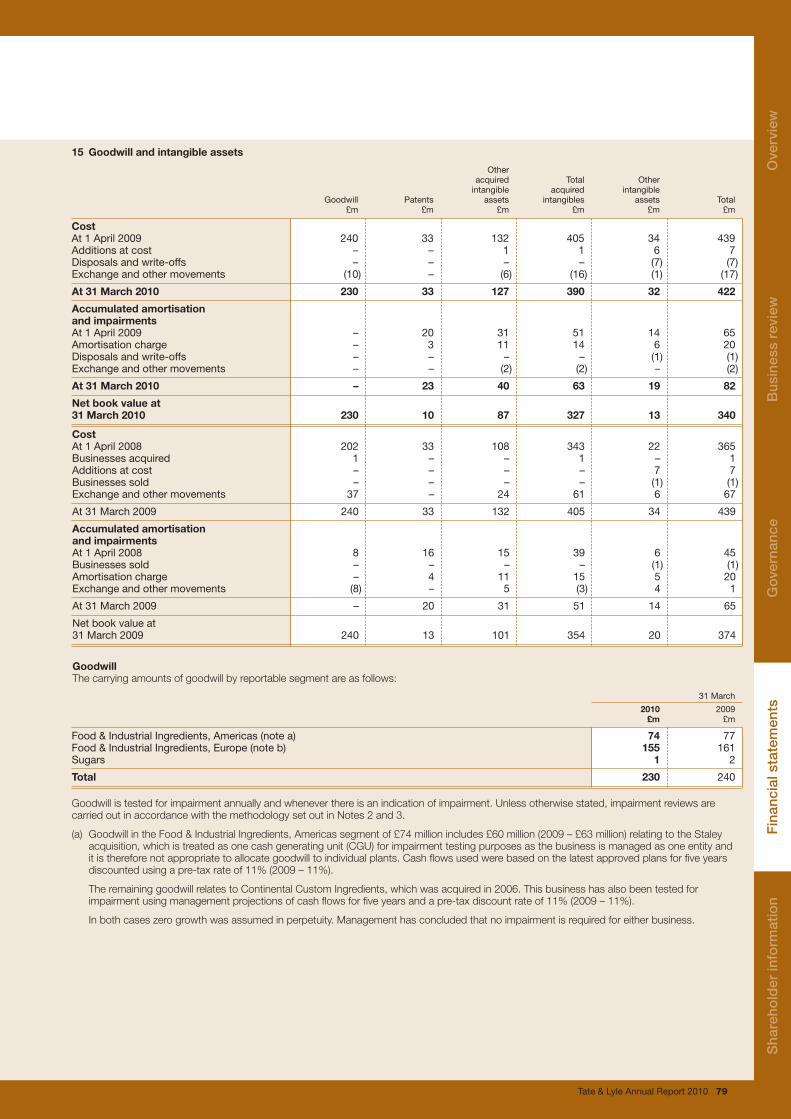
Tate & Lyle Annual Report 2010 79
15 Goodwill and intangible assets
Other acquired Total Other intangible acquired intangible Goodwill Patents assets intangibles assets Total £m £m £m £m £m £m CostAt 1 April 2009 240 33 132 405 34 439Additions at cost – – 1 1 6 7Disposals and write-offs – – – – (7) (7)Exchange and other movements (10) – (6) (16) (1) (17)
At 31 March 2010 230 33 127 390 32 422
Accumulated amortisationand impairmentsAt 1 April 2009 – 20 31 51 14 65Amortisation charge – 3 11 14 6 20Disposals and write-offs – – – – (1) (1)Exchange and other movements – – (2) (2) – (2)
At 31 March 2010 – 23 40 63 19 82
Net book value at 31 March 2010 230 10 87 327 13 340
CostAt 1 April 2008 202 33 108 343 22 365Businesses acquired 1 – – 1 – 1Additions at cost – – – – 7 7Businesses sold – – – – (1) (1)Exchange and other movements 37 – 24 61 6 67
At 31 March 2009 240 33 132 405 34 439
Accumulated amortisationand impairmentsAt 1 April 2008 8 16 15 39 6 45Businesses sold – – – – (1) (1)Amortisation charge – 4 11 15 5 20Exchange and other movements (8) – 5 (3) 4 1
At 31 March 2009 – 20 31 51 14 65
Net book value at 31 March 2009 240 13 101 354 20 374
GoodwillThe carrying amounts of goodwill by reportable segment are as follows:
31 March
2010 2009 £m £m
Food & Industrial Ingredients, Americas (note a) 74 77Food & Industrial Ingredients, Europe (note b) 155 161Sugars 1 2
Total 230 240
Goodwill is tested for impairment annually and whenever there is an indication of impairment. Unless otherwise stated, impairment reviews are carried out in accordance with the methodology set out in Notes 2 and 3.
(a) Goodwill in the Food & Industrial Ingredients, Americas segment of £74 million includes £60 million (2009 – £63 million) relating to the Staley acquisition, which is treated as one cash generating unit (CGU) for impairment testing purposes as the business is managed as one entity and it is therefore not appropriate to allocate goodwill to individual plants. Cash flows used were based on the latest approved plans for five years discounted using a pre-tax rate of 11% (2009 – 11%).
The remaining goodwill relates to Continental Custom Ingredients, which was acquired in 2006. This business has also been tested for impairment using management projections of cash flows for five years and a pre-tax discount rate of 11% (2009 – 11%).
In both cases zero growth was assumed in perpetuity. Management has concluded that no impairment is required for either business.
Sha
reho
lder
info
rmat
ion
Ove
rvie
wB
usin
ess
revi
ewG
over
nanc
eF
inan
cial
sta
tem
ents

80 Tate & Lyle Annual Report 2010
15 Goodwill and intangible assets (continued)
(b) Goodwill in the Food & Industrial Ingredients, Europe segment of £155 million includes £89 million (2009 – £91 million) relating to the acquisition in 2000 of the minority of 34% of shares of the former Amylum business. Although cash flows have been identified for certain individual plants for the purposes of assessing the recoverable amounts of property, plant and equipment (as described in Note 16) the business is managed as a network, with a large amount of interdependency between plants and centralised decision-making. Consequently, goodwill is monitored at a divisional level and allocated to a group of plant CGUs for the purposes of impairment testing. The remaining goodwill in the former Amylum business has been tested for impairment using management projections of cash flows for five years and a pre-tax discount rate of 11% (2009 – 11%). Zero growth was assumed in perpetuity. Management has concluded that no impairment is required.
In addition, goodwill includes £41 million (2009 – £42 million) relating to the acquisition of G.C. Hahn & Co. in June 2007. This business has been tested for impairment using management projections of cash flows for five years and a pre-tax discount rate of 11% (2009 – 11%). Zero growth was assumed in perpetuity. Management has concluded that no impairment is required.
The remaining goodwill relates to a number of smaller acquisitions, each of which has been tested for impairment using management projections for five years, pre-tax discount rates of 11% (2009 – 11%), and zero growth assumed in perpetuity. Management has concluded that no impairment is required.
16 Property, plant and equipment
Assets in the Land and Plant and course of buildings machinery construction Total £m £m £m £m
Cost At 1 April 2009 591 2 394 345 3 330Additions at cost 2 12 68 82Transfers on completion 6 44 (50) –Disposals and write-offs (1) (13) (1) (15)Exchange and other movements (20) (88) (17) (125)
At 31 March 2010 578 2 349 345 3 272
Accumulated depreciation and impairmentsAt 1 April 2009 288 1 493 1 1 782Depreciation charge 15 101 – 116Impairment losses and write-downs – 31 209 240Disposals and write-offs (1) (13) – (14)Exchange and other movements (10) (48) (2) (60)
At 31 March 2010 292 1 564 208 2 064
Net book value at 31 March 2010 286 785 137 1 208
Cost At 1 April 2008 466 1 815 222 2 503Additions at cost 6 15 208 229Transfers on completion 27 134 (161) –Businesses sold (6) (32) – (38)Disposals and write-offs (18) (37) (6) (61)Exchange and other movements 116 499 82 697
At 31 March 2009 591 2 394 345 3 330
Accumulated depreciation and impairmentsAt 1 April 2008 219 1 088 – 1 307Depreciation charge 18 94 – 112Impairment losses 18 87 1 106Businesses sold (4) (32) – (36)Disposals and write-offs (15) (34) – (49)Exchange and other movements 52 290 – 342
At 31 March 2009 288 1 493 1 1 782
Net book value at 31 March 2009 303 901 344 1 548
Additions to fixed assets includes capitalised borrowing costs of £2 million (2009 – £11 million).
Impairment lossesIt is the Group’s policy to test assets for impairment whenever events or changes in circumstances indicate that their carrying amounts may not be recoverable.
(a) ImpactofchangestotheEUSugarRegimeThe Group continues to monitor the impact of the announced changes to the EU Sugar Regime, which were implemented in July 2006 and significantly reduce both EU refined sugar prices, raw sugar prices, and EU subsidised exports of sugar.
The UK and Portuguese Sugars businesses are impacted by the changes to the EU Sugar Regime. Management’s impairment review of these businesses was based on internal forecasts of future cash flows for the next five years, a pre-tax discount rate of 11% (2009 – 11%) and a zero growth rate assumed in perpetuity. This did not result in an impairment in either the year ended 31 March 2010 or 31 March 2009.
Notes to the consolidated financial statements
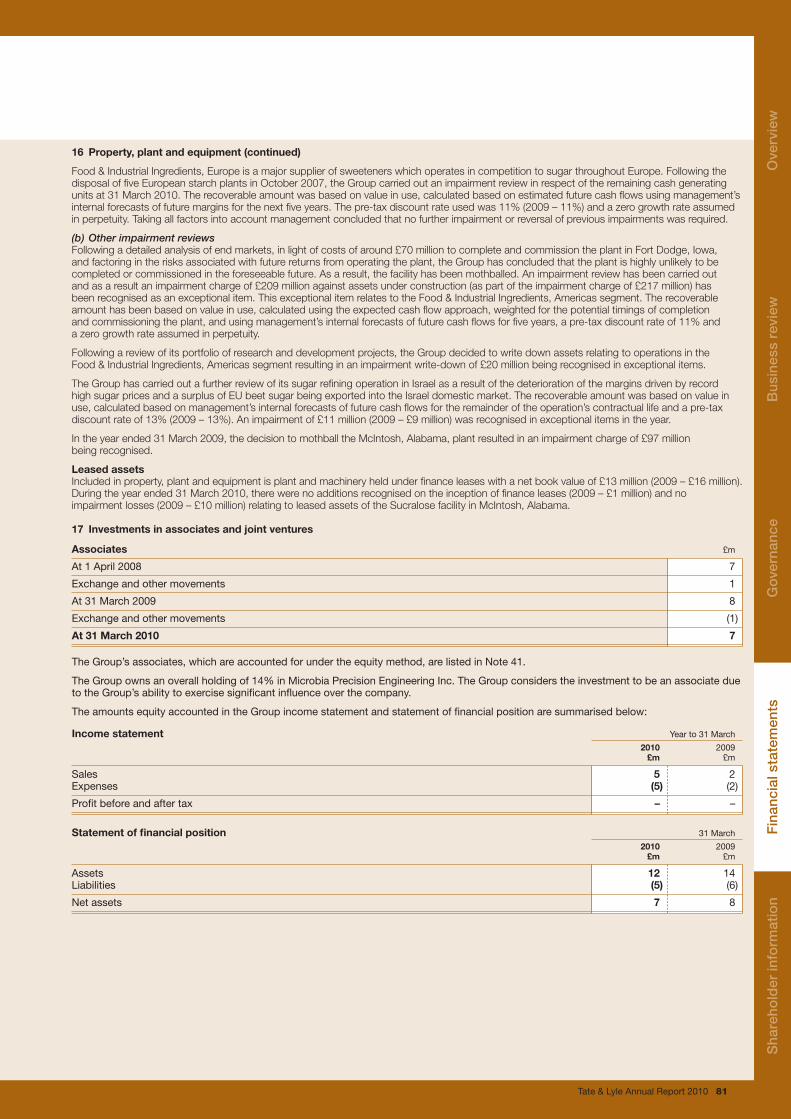
Tate & Lyle Annual Report 2010 81
16 Property, plant and equipment (continued)
Food & Industrial Ingredients, Europe is a major supplier of sweeteners which operates in competition to sugar throughout Europe. Following the disposal of five European starch plants in October 2007, the Group carried out an impairment review in respect of the remaining cash generating units at 31 March 2010. The recoverable amount was based on value in use, calculated based on estimated future cash flows using management’s internal forecasts of future margins for the next five years. The pre-tax discount rate used was 11% (2009 – 11%) and a zero growth rate assumed in perpetuity. Taking all factors into account management concluded that no further impairment or reversal of previous impairments was required.
(b)OtherimpairmentreviewsFollowing a detailed analysis of end markets, in light of costs of around £70 million to complete and commission the plant in Fort Dodge, Iowa, and factoring in the risks associated with future returns from operating the plant, the Group has concluded that the plant is highly unlikely to be completed or commissioned in the foreseeable future. As a result, the facility has been mothballed. An impairment review has been carried out and as a result an impairment charge of £209 million against assets under construction (as part of the impairment charge of £217 million) has been recognised as an exceptional item. This exceptional item relates to the Food & Industrial Ingredients, Americas segment. The recoverable amount has been based on value in use, calculated using the expected cash flow approach, weighted for the potential timings of completion and commissioning the plant, and using management’s internal forecasts of future cash flows for five years, a pre-tax discount rate of 11% and a zero growth rate assumed in perpetuity.
Following a review of its portfolio of research and development projects, the Group decided to write down assets relating to operations in the Food & Industrial Ingredients, Americas segment resulting in an impairment write-down of £20 million being recognised in exceptional items.
The Group has carried out a further review of its sugar refining operation in Israel as a result of the deterioration of the margins driven by record high sugar prices and a surplus of EU beet sugar being exported into the Israel domestic market. The recoverable amount was based on value in use, calculated based on management’s internal forecasts of future cash flows for the remainder of the operation’s contractual life and a pre-tax discount rate of 13% (2009 – 13%). An impairment of £11 million (2009 – £9 million) was recognised in exceptional items in the year.
In the year ended 31 March 2009, the decision to mothball the McIntosh, Alabama, plant resulted in an impairment charge of £97 million being recognised.
Leased assetsIncluded in property, plant and equipment is plant and machinery held under finance leases with a net book value of £13 million (2009 – £16 million). During the year ended 31 March 2010, there were no additions recognised on the inception of finance leases (2009 – £1 million) and no impairment losses (2009 – £10 million) relating to leased assets of the Sucralose facility in McIntosh, Alabama.
17 Investments in associates and joint ventures Associates £m
At 1 April 2008 7
Exchange and other movements 1
At 31 March 2009 8
Exchange and other movements (1)
At 31 March 2010 7
The Group’s associates, which are accounted for under the equity method, are listed in Note 41.
The Group owns an overall holding of 14% in Microbia Precision Engineering Inc. The Group considers the investment to be an associate due to the Group’s ability to exercise significant influence over the company.
The amounts equity accounted in the Group income statement and statement of financial position are summarised below:
Income statement Year to 31 March
2010 2009 £m £m
Sales 5 2Expenses (5) (2)
Profit before and after tax – –
Statement of financial position 31 March
2010 2009 £m £m
Assets 12 14Liabilities (5) (6)
Net assets 7 8
Sha
reho
lder
info
rmat
ion
Ove
rvie
wB
usin
ess
revi
ewG
over
nanc
eF
inan
cial
sta
tem
ents
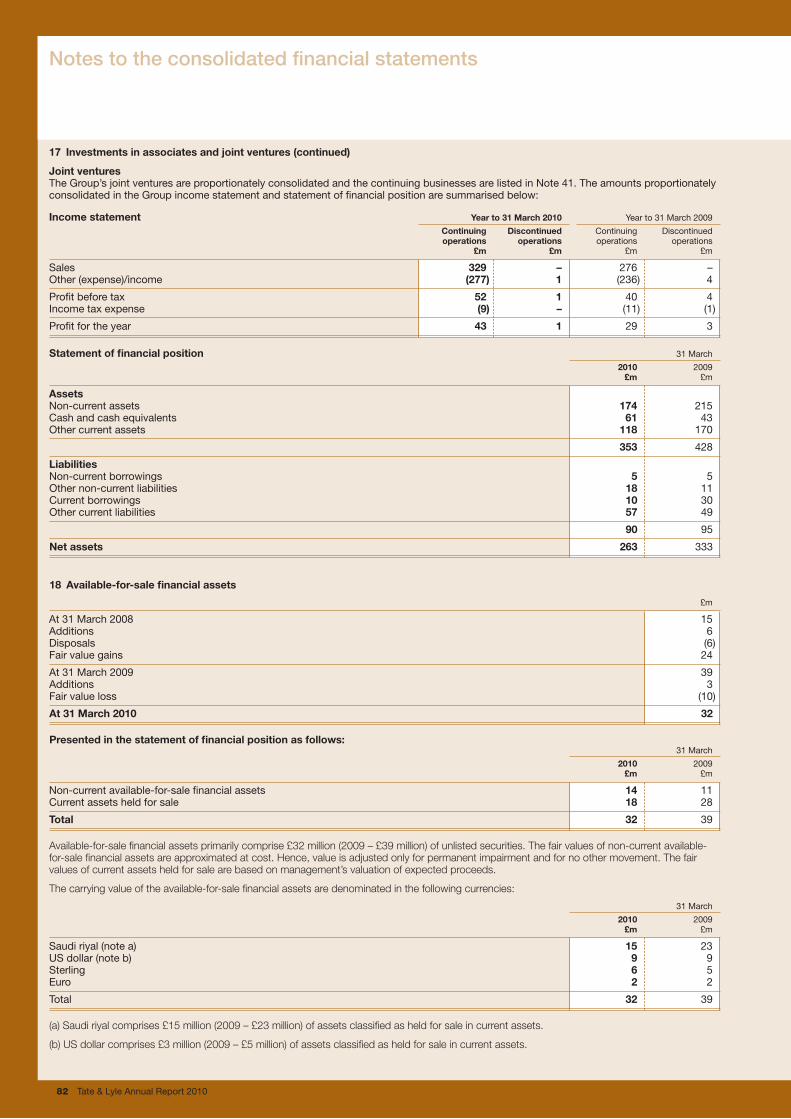
82 Tate & Lyle Annual Report 2010
17 Investments in associates and joint ventures (continued)
Joint venturesThe Group’s joint ventures are proportionately consolidated and the continuing businesses are listed in Note 41. The amounts proportionately consolidated in the Group income statement and statement of financial position are summarised below:
Income statement Year to 31 March 2010 Year to 31 March 2009
Continuing Discontinued Continuing Discontinued operations operations operations operations £m £m £m £m
Sales 329 – 276 –Other (expense)/income (277) 1 (236) 4
Profit before tax 52 1 40 4Income tax expense (9) – (11) (1)
Profit for the year 43 1 29 3
Statement of financial position 31 March
2010 2009 £m £m
AssetsNon-current assets 174 215Cash and cash equivalents 61 43Other current assets 118 170
353 428
LiabilitiesNon-current borrowings 5 5Other non-current liabilities 18 11Current borrowings 10 30Other current liabilities 57 49
90 95
Net assets 263 333
18 Available-for-sale financial assets
£m
At 31 March 2008 15Additions 6Disposals (6)Fair value gains 24
At 31 March 2009 39Additions 3Fair value loss (10)
At 31 March 2010 32
Presented in the statement of financial position as follows: 31 March
2010 2009 £m £m
Non-current available-for-sale financial assets 14 11Current assets held for sale 18 28
Total 32 39
Available-for-sale financial assets primarily comprise £32 million (2009 – £39 million) of unlisted securities. The fair values of non-current available-for-sale financial assets are approximated at cost. Hence, value is adjusted only for permanent impairment and for no other movement. The fair values of current assets held for sale are based on management’s valuation of expected proceeds.
The carrying value of the available-for-sale financial assets are denominated in the following currencies:
31 March
2010 2009 £m £m
Saudi riyal (note a) 15 23US dollar (note b) 9 9Sterling 6 5Euro 2 2
Total 32 39
(a) Saudi riyal comprises £15 million (2009 – £23 million) of assets classified as held for sale in current assets.
(b) US dollar comprises £3 million (2009 – £5 million) of assets classified as held for sale in current assets.
Notes to the consolidated financial statements
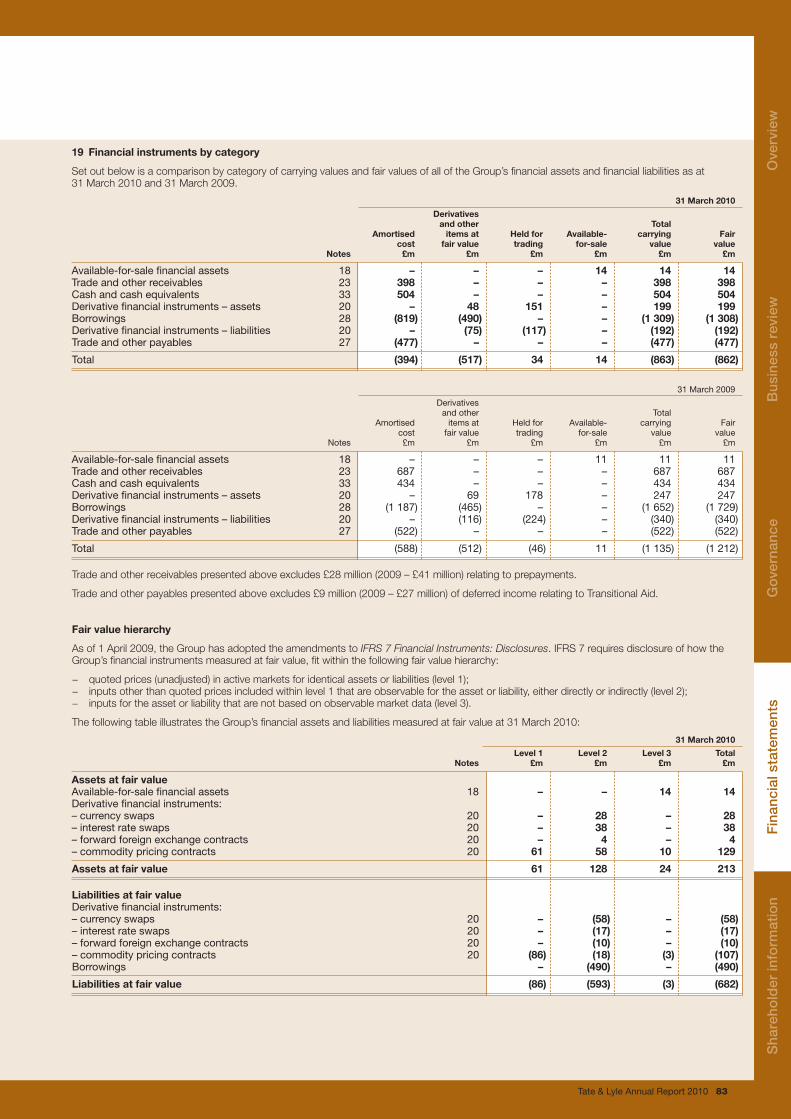
Tate & Lyle Annual Report 2010 83
19 Financial instruments by category
Set out below is a comparison by category of carrying values and fair values of all of the Group’s financial assets and financial liabilities as at 31 March 2010 and 31 March 2009.
31 March 2010
Derivatives and other Total Amortised items at Held for Available- carrying Fair cost fair value trading for-sale value value Notes £m £m £m £m £m £m
Available-for-sale financial assets 18 – – – 14 14 14Trade and other receivables 23 398 – – – 398 398Cash and cash equivalents 33 504 – – – 504 504Derivative financial instruments – assets 20 – 48 151 – 199 199Borrowings 28 (819) (490) – – (1 309) (1 308)Derivative financial instruments – liabilities 20 – (75) (117) – (192) (192)Trade and other payables 27 (477) – – – (477) (477)
Total (394) (517) 34 14 (863) (862)
31 March 2009
Derivatives and other Total Amortised items at Held for Available- carrying Fair cost fair value trading for-sale value value Notes £m £m £m £m £m £m
Available-for-sale financial assets 18 – – – 11 11 11Trade and other receivables 23 687 – – – 687 687Cash and cash equivalents 33 434 – – – 434 434Derivative financial instruments – assets 20 – 69 178 – 247 247Borrowings 28 (1 187) (465) – – (1 652) (1 729)Derivative financial instruments – liabilities 20 – (116) (224) – (340) (340)Trade and other payables 27 (522) – – – (522) (522)
Total (588) (512) (46) 11 (1 135) (1 212)
Trade and other receivables presented above excludes £28 million (2009 – £41 million) relating to prepayments.
Trade and other payables presented above excludes £9 million (2009 – £27 million) of deferred income relating to Transitional Aid.
Fair value hierarchy
As of 1 April 2009, the Group has adopted the amendments to IFRS 7 Financial Instruments: Disclosures. IFRS 7 requires disclosure of how the Group’s financial instruments measured at fair value, fit within the following fair value hierarchy:
− quoted prices (unadjusted) in active markets for identical assets or liabilities (level 1);− inputs other than quoted prices included within level 1 that are observable for the asset or liability, either directly or indirectly (level 2);− inputs for the asset or liability that are not based on observable market data (level 3).
The following table illustrates the Group’s financial assets and liabilities measured at fair value at 31 March 2010:
31 March 2010
Level 1 Level 2 Level 3 Total Notes £m £m £m £m
Assets at fair valueAvailable-for-sale financial assets 18 – – 14 14Derivative financial instruments:– currency swaps 20 – 28 – 28– interest rate swaps 20 – 38 – 38– forward foreign exchange contracts 20 – 4 – 4– commodity pricing contracts 20 61 58 10 129
Assets at fair value 61 128 24 213
Liabilities at fair valueDerivative financial instruments:– currency swaps 20 – (58) – (58)– interest rate swaps 20 – (17) – (17)– forward foreign exchange contracts 20 – (10) – (10)– commodity pricing contracts 20 (86) (18) (3) (107)Borrowings – (490) – (490)
Liabilities at fair value (86) (593) (3) (682)
Sha
reho
lder
info
rmat
ion
Ove
rvie
wB
usin
ess
revi
ewG
over
nanc
eF
inan
cial
sta
tem
ents
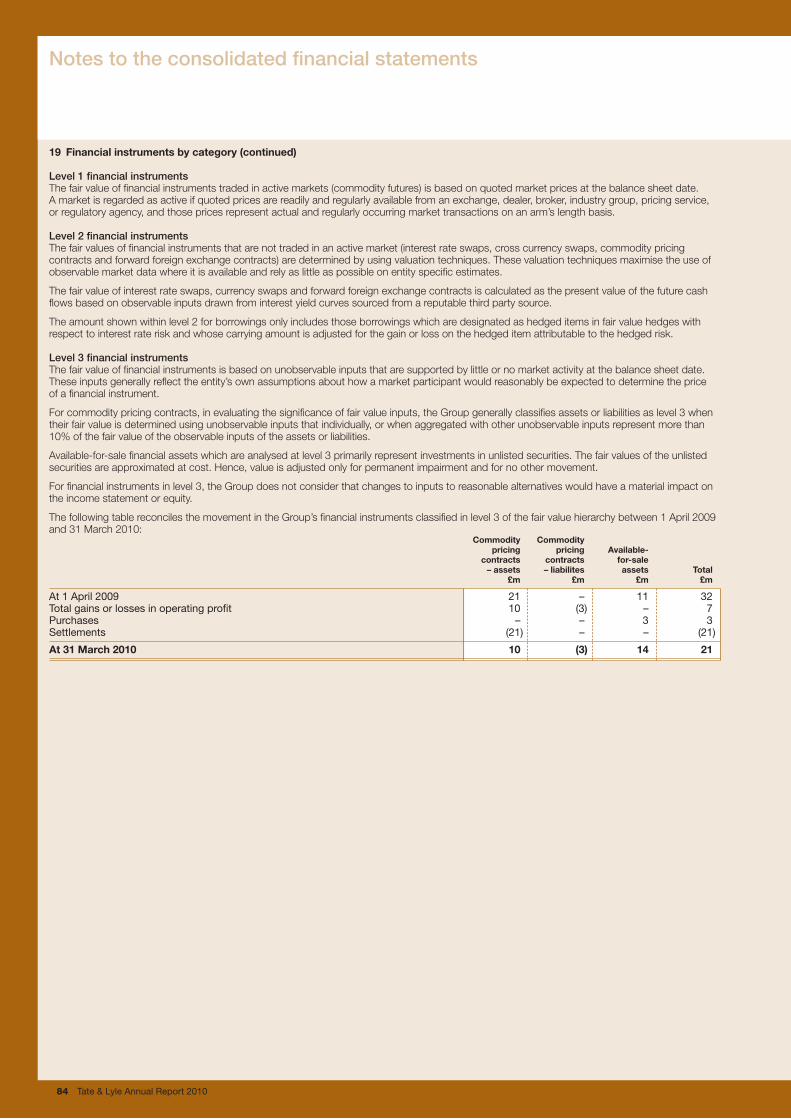
Notes to the consolidated financial statements
84 Tate & Lyle Annual Report 2010
19 Financial instruments by category (continued)
Level 1 financial instrumentsThe fair value of financial instruments traded in active markets (commodity futures) is based on quoted market prices at the balance sheet date. A market is regarded as active if quoted prices are readily and regularly available from an exchange, dealer, broker, industry group, pricing service, or regulatory agency, and those prices represent actual and regularly occurring market transactions on an arm’s length basis.
Level 2 financial instrumentsThe fair values of financial instruments that are not traded in an active market (interest rate swaps, cross currency swaps, commodity pricing contracts and forward foreign exchange contracts) are determined by using valuation techniques. These valuation techniques maximise the use of observable market data where it is available and rely as little as possible on entity specific estimates.
The fair value of interest rate swaps, currency swaps and forward foreign exchange contracts is calculated as the present value of the future cash flows based on observable inputs drawn from interest yield curves sourced from a reputable third party source.
The amount shown within level 2 for borrowings only includes those borrowings which are designated as hedged items in fair value hedges with respect to interest rate risk and whose carrying amount is adjusted for the gain or loss on the hedged item attributable to the hedged risk.
Level 3 financial instrumentsThe fair value of financial instruments is based on unobservable inputs that are supported by little or no market activity at the balance sheet date. These inputs generally reflect the entity’s own assumptions about how a market participant would reasonably be expected to determine the price of a financial instrument.
For commodity pricing contracts, in evaluating the significance of fair value inputs, the Group generally classifies assets or liabilities as level 3 when their fair value is determined using unobservable inputs that individually, or when aggregated with other unobservable inputs represent more than 10% of the fair value of the observable inputs of the assets or liabilities.
Available-for-sale financial assets which are analysed at level 3 primarily represent investments in unlisted securities. The fair values of the unlisted securities are approximated at cost. Hence, value is adjusted only for permanent impairment and for no other movement.
For financial instruments in level 3, the Group does not consider that changes to inputs to reasonable alternatives would have a material impact on the income statement or equity.
The following table reconciles the movement in the Group’s financial instruments classified in level 3 of the fair value hierarchy between 1 April 2009 and 31 March 2010: Commodity Commodity pricing pricing Available- contracts contracts for-sale – assets – liabilites assets Total £m £m £m £m
At 1 April 2009 21 – 11 32Total gains or losses in operating profit 10 (3) – 7Purchases – – 3 3Settlements (21) – – (21)
At 31 March 2010 10 (3) 14 21

Notes to the consolidated financial statements
Tate & Lyle Annual Report 2010 85
20 Derivative financial instruments
31 March 2010 31 March 2009
Assets Liabilities Assets Liabilities £m £m £m £m
Non-current derivative financial instruments used to manage the Group’s net debt profileCurrency swaps – fair value, net investment and cash flow hedges – (51) 5 (45)Currency swaps – held for trading 16 (2) – –Interest rate swaps – fair value hedges 22 (3) 29 (7)Interest rate swaps – held for trading 9 (11) 13 (15)
47 (67) 47 (67)
Current derivative financial instruments used to manage the Group’s net debt profileCurrency swaps – accrued interest 12 (5) 10 (3)Interest rate swaps – accrued interest 7 (3) 3 (3)
19 (8) 13 (6)
Total derivative financial instruments used to manage the Group’s net debt profile 66 (75) 60 (73)
Other non-current derivative financial instrumentsForward foreign exchange contracts – cash flow hedges 1 – – (2)Commodity pricing contracts – cash flow hedges 1 – – (3)
2 – – (5)
Other current derivative financial instrumentsForward foreign exchange contracts – cash flow hedges 3 (6) 12 (23)Forward foreign exchange contracts – held for trading – (4) – –Commodity pricing contracts – cash flow hedges 2 (7) 10 (30)Commodity pricing contracts – held for trading 126 (100) 165 (209)
131 (117) 187 (262)
Total other derivative financial instruments 133 (117) 187 (267)
Total derivative financial instruments 199 (192) 247 (340)
Presented in the statement of financial position as follows:Non-current derivative financial instruments 49 (67) 47 (72)Current derivative financial instruments 150 (125) 200 (268)
199 (192) 247 (340)
The comparative information has been re-presented as set out in Note 1.
The ineffective portion recognised in operating profit that arises from cash flow hedges amounts to a loss of £3 million (2009 – £4 million gain).
The ineffective portion recognised in operating profit that arises from net investment hedges amounts to a gain of £1 million (2009 – £1 million loss).
The ineffective portion recognised in net finance expense that arises from fair value hedges amounts to a gain of £1 million (2009 – £2 million loss).
In accordance with IAS 1 (revised) the Group has re-presented certain held for trading derivatives from current to non-current as set out in Note 1. As at 1 April 2008, £4 million of assets and £5 million of liabilities have been re-presented. There was no overall effect on the Group’s equity. The re-presented comparatives as at 1 April 2008 are as follows:
1 April 2008
Assets Liabilites re-presented re-presented £m £m
Non-current 40 (35)Current 271 (262)
Total 311 (297)
Sha
reho
lder
info
rmat
ion
Ove
rvie
wB
usin
ess
revi
ewG
over
nanc
eF
inan
cial
sta
tem
ents
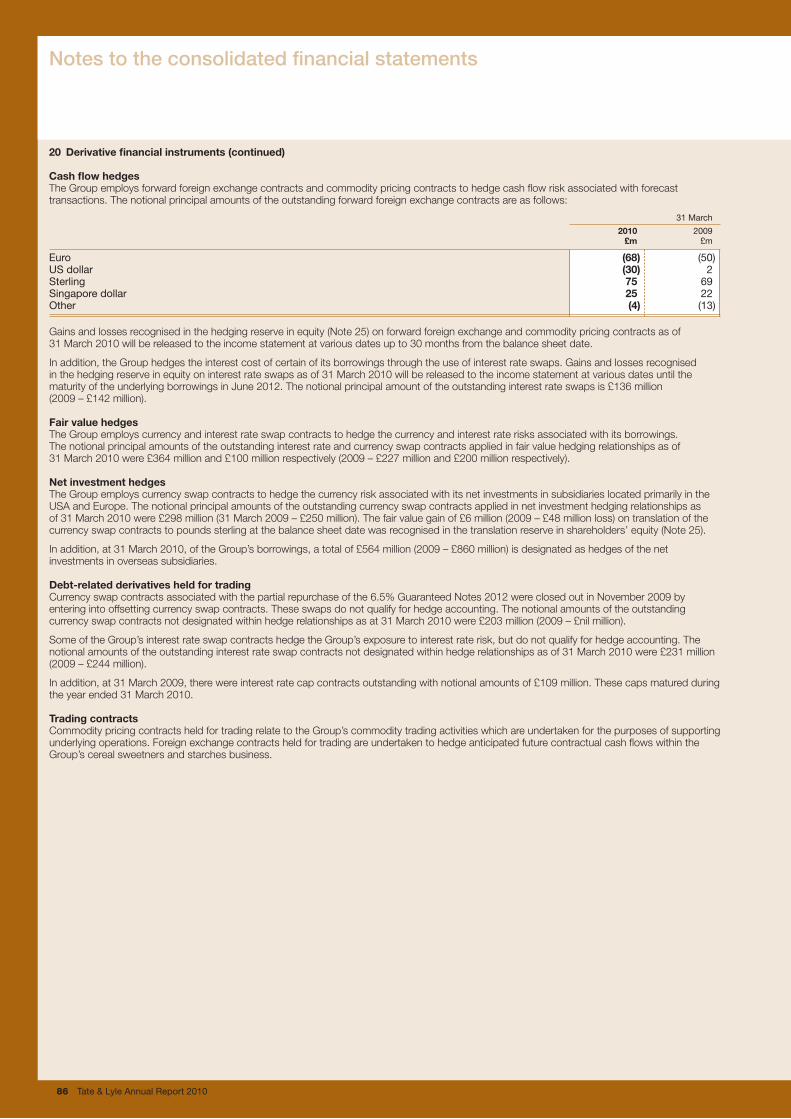
86 Tate & Lyle Annual Report 2010
20 Derivative financial instruments (continued)
Cash flow hedgesThe Group employs forward foreign exchange contracts and commodity pricing contracts to hedge cash flow risk associated with forecast transactions. The notional principal amounts of the outstanding forward foreign exchange contracts are as follows:
31 March
2010 2009 £m £m
Euro (68) (50)US dollar (30) 2Sterling 75 69Singapore dollar 25 22Other (4) (13)
Gains and losses recognised in the hedging reserve in equity (Note 25) on forward foreign exchange and commodity pricing contracts as of 31 March 2010 will be released to the income statement at various dates up to 30 months from the balance sheet date.
In addition, the Group hedges the interest cost of certain of its borrowings through the use of interest rate swaps. Gains and losses recognised in the hedging reserve in equity on interest rate swaps as of 31 March 2010 will be released to the income statement at various dates until the maturity of the underlying borrowings in June 2012. The notional principal amount of the outstanding interest rate swaps is £136 million (2009 – £142 million).
Fair value hedgesThe Group employs currency and interest rate swap contracts to hedge the currency and interest rate risks associated with its borrowings. The notional principal amounts of the outstanding interest rate and currency swap contracts applied in fair value hedging relationships as of 31 March 2010 were £364 million and £100 million respectively (2009 – £227 million and £200 million respectively).
Net investment hedgesThe Group employs currency swap contracts to hedge the currency risk associated with its net investments in subsidiaries located primarily in the USA and Europe. The notional principal amounts of the outstanding currency swap contracts applied in net investment hedging relationships as of 31 March 2010 were £298 million (31 March 2009 – £250 million). The fair value gain of £6 million (2009 – £48 million loss) on translation of the currency swap contracts to pounds sterling at the balance sheet date was recognised in the translation reserve in shareholders’ equity (Note 25).
In addition, at 31 March 2010, of the Group’s borrowings, a total of £564 million (2009 – £860 million) is designated as hedges of the net investments in overseas subsidiaries.
Debt-related derivatives held for tradingCurrency swap contracts associated with the partial repurchase of the 6.5% Guaranteed Notes 2012 were closed out in November 2009 by entering into offsetting currency swap contracts. These swaps do not qualify for hedge accounting. The notional amounts of the outstanding currency swap contracts not designated within hedge relationships as at 31 March 2010 were £203 million (2009 – £nil million).
Some of the Group’s interest rate swap contracts hedge the Group’s exposure to interest rate risk, but do not qualify for hedge accounting. The notional amounts of the outstanding interest rate swap contracts not designated within hedge relationships as of 31 March 2010 were £231 million (2009 – £244 million).
In addition, at 31 March 2009, there were interest rate cap contracts outstanding with notional amounts of £109 million. These caps matured during the year ended 31 March 2010.
Trading contractsCommodity pricing contracts held for trading relate to the Group’s commodity trading activities which are undertaken for the purposes of supporting underlying operations. Foreign exchange contracts held for trading are undertaken to hedge anticipated future contractual cash flows within the Group’s cereal sweetners and starches business.
Notes to the consolidated financial statements
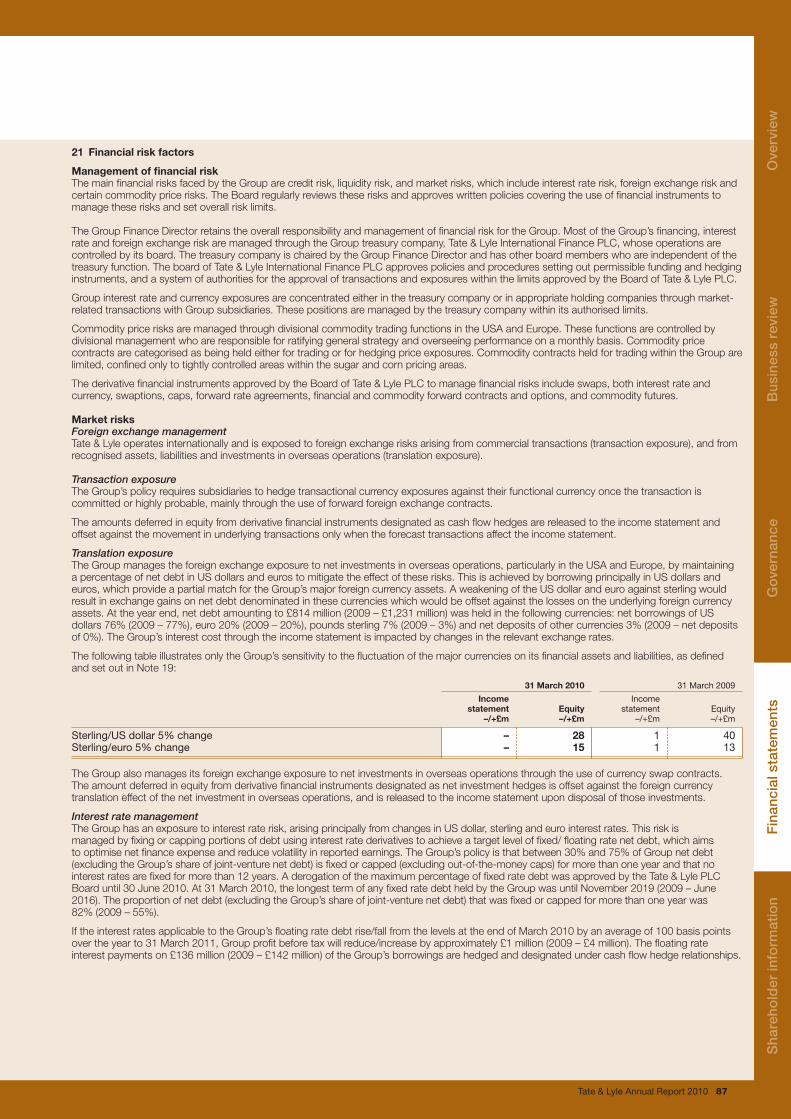
Tate & Lyle Annual Report 2010 87
21 Financial risk factors
Management of financial riskThe main financial risks faced by the Group are credit risk, liquidity risk, and market risks, which include interest rate risk, foreign exchange risk and certain commodity price risks. The Board regularly reviews these risks and approves written policies covering the use of financial instruments to manage these risks and set overall risk limits.
The Group Finance Director retains the overall responsibility and management of financial risk for the Group. Most of the Group’s financing, interest rate and foreign exchange risk are managed through the Group treasury company, Tate & Lyle International Finance PLC, whose operations are controlled by its board. The treasury company is chaired by the Group Finance Director and has other board members who are independent of the treasury function. The board of Tate & Lyle International Finance PLC approves policies and procedures setting out permissible funding and hedging instruments, and a system of authorities for the approval of transactions and exposures within the limits approved by the Board of Tate & Lyle PLC.
Group interest rate and currency exposures are concentrated either in the treasury company or in appropriate holding companies through market-related transactions with Group subsidiaries. These positions are managed by the treasury company within its authorised limits.
Commodity price risks are managed through divisional commodity trading functions in the USA and Europe. These functions are controlled by divisional management who are responsible for ratifying general strategy and overseeing performance on a monthly basis. Commodity price contracts are categorised as being held either for trading or for hedging price exposures. Commodity contracts held for trading within the Group are limited, confined only to tightly controlled areas within the sugar and corn pricing areas.
The derivative financial instruments approved by the Board of Tate & Lyle PLC to manage financial risks include swaps, both interest rate and currency, swaptions, caps, forward rate agreements, financial and commodity forward contracts and options, and commodity futures.
Market risksForeignexchangemanagementTate & Lyle operates internationally and is exposed to foreign exchange risks arising from commercial transactions (transaction exposure), and from recognised assets, liabilities and investments in overseas operations (translation exposure).
TransactionexposureThe Group’s policy requires subsidiaries to hedge transactional currency exposures against their functional currency once the transaction is committed or highly probable, mainly through the use of forward foreign exchange contracts.
The amounts deferred in equity from derivative financial instruments designated as cash flow hedges are released to the income statement and offset against the movement in underlying transactions only when the forecast transactions affect the income statement.
TranslationexposureThe Group manages the foreign exchange exposure to net investments in overseas operations, particularly in the USA and Europe, by maintaining a percentage of net debt in US dollars and euros to mitigate the effect of these risks. This is achieved by borrowing principally in US dollars and euros, which provide a partial match for the Group’s major foreign currency assets. A weakening of the US dollar and euro against sterling would result in exchange gains on net debt denominated in these currencies which would be offset against the losses on the underlying foreign currency assets. At the year end, net debt amounting to £814 million (2009 – £1,231 million) was held in the following currencies: net borrowings of US dollars 76% (2009 – 77%), euro 20% (2009 – 20%), pounds sterling 7% (2009 – 3%) and net deposits of other currencies 3% (2009 – net deposits of 0%). The Group’s interest cost through the income statement is impacted by changes in the relevant exchange rates.
The following table illustrates only the Group’s sensitivity to the fluctuation of the major currencies on its financial assets and liabilities, as defined and set out in Note 19:
31 March 2010 31 March 2009
Income Income statement Equity statement Equity –/+£m –/+£m –/+£m –/+£m Sterling/US dollar 5% change – 28 1 40Sterling/euro 5% change – 15 1 13
The Group also manages its foreign exchange exposure to net investments in overseas operations through the use of currency swap contracts. The amount deferred in equity from derivative financial instruments designated as net investment hedges is offset against the foreign currency translation effect of the net investment in overseas operations, and is released to the income statement upon disposal of those investments.
InterestratemanagementThe Group has an exposure to interest rate risk, arising principally from changes in US dollar, sterling and euro interest rates. This risk is managed by fixing or capping portions of debt using interest rate derivatives to achieve a target level of fixed/ floating rate net debt, which aims to optimise net finance expense and reduce volatility in reported earnings. The Group’s policy is that between 30% and 75% of Group net debt (excluding the Group’s share of joint-venture net debt) is fixed or capped (excluding out-of-the-money caps) for more than one year and that no interest rates are fixed for more than 12 years. A derogation of the maximum percentage of fixed rate debt was approved by the Tate & Lyle PLC Board until 30 June 2010. At 31 March 2010, the longest term of any fixed rate debt held by the Group was until November 2019 (2009 – June 2016). The proportion of net debt (excluding the Group’s share of joint-venture net debt) that was fixed or capped for more than one year was 82% (2009 – 55%).
If the interest rates applicable to the Group’s floating rate debt rise/fall from the levels at the end of March 2010 by an average of 100 basis points over the year to 31 March 2011, Group profit before tax will reduce/increase by approximately £1 million (2009 – £4 million). The floating rate interest payments on £136 million (2009 – £142 million) of the Group’s borrowings are hedged and designated under cash flow hedge relationships.
Sha
reho
lder
info
rmat
ion
Ove
rvie
wB
usin
ess
revi
ewG
over
nanc
eF
inan
cial
sta
tem
ents
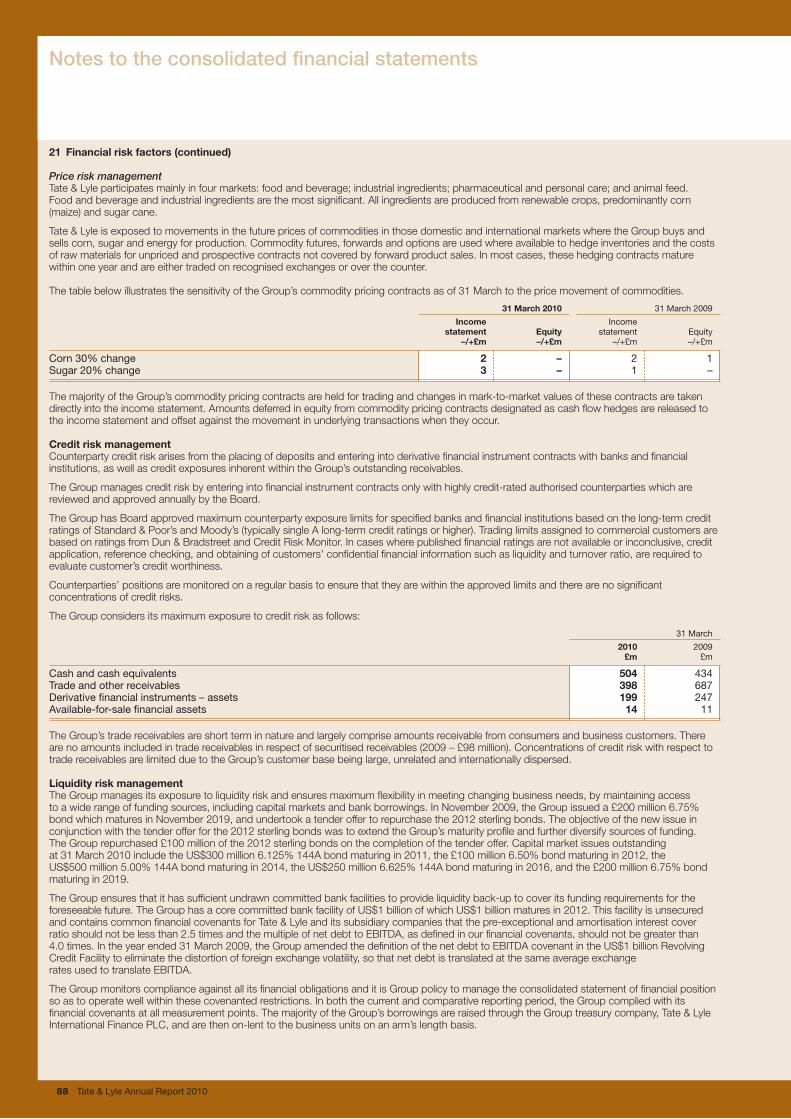
88 Tate & Lyle Annual Report 2010
21 Financial risk factors (continued)
PriceriskmanagementTate & Lyle participates mainly in four markets: food and beverage; industrial ingredients; pharmaceutical and personal care; and animal feed. Food and beverage and industrial ingredients are the most significant. All ingredients are produced from renewable crops, predominantly corn (maize) and sugar cane.
Tate & Lyle is exposed to movements in the future prices of commodities in those domestic and international markets where the Group buys and sells corn, sugar and energy for production. Commodity futures, forwards and options are used where available to hedge inventories and the costs of raw materials for unpriced and prospective contracts not covered by forward product sales. In most cases, these hedging contracts mature within one year and are either traded on recognised exchanges or over the counter.
The table below illustrates the sensitivity of the Group’s commodity pricing contracts as of 31 March to the price movement of commodities.
31 March 2010 31 March 2009
Income Income statement Equity statement Equity –/+£m –/+£m –/+£m –/+£m
Corn 30% change 2 – 2 1Sugar 20% change 3 – 1 –
The majority of the Group’s commodity pricing contracts are held for trading and changes in mark-to-market values of these contracts are taken directly into the income statement. Amounts deferred in equity from commodity pricing contracts designated as cash flow hedges are released to the income statement and offset against the movement in underlying transactions when they occur.
Credit risk managementCounterparty credit risk arises from the placing of deposits and entering into derivative financial instrument contracts with banks and financial institutions, as well as credit exposures inherent within the Group’s outstanding receivables.
The Group manages credit risk by entering into financial instrument contracts only with highly credit-rated authorised counterparties which are reviewed and approved annually by the Board.
The Group has Board approved maximum counterparty exposure limits for specified banks and financial institutions based on the long-term credit ratings of Standard & Poor’s and Moody’s (typically single A long-term credit ratings or higher). Trading limits assigned to commercial customers are based on ratings from Dun & Bradstreet and Credit Risk Monitor. In cases where published financial ratings are not available or inconclusive, credit application, reference checking, and obtaining of customers’ confidential financial information such as liquidity and turnover ratio, are required to evaluate customer’s credit worthiness.
Counterparties’ positions are monitored on a regular basis to ensure that they are within the approved limits and there are no significant concentrations of credit risks.
The Group considers its maximum exposure to credit risk as follows:
31 March
2010 2009 £m £m
Cash and cash equivalents 504 434Trade and other receivables 398 687Derivative financial instruments – assets 199 247Available-for-sale financial assets 14 11
The Group’s trade receivables are short term in nature and largely comprise amounts receivable from consumers and business customers. There are no amounts included in trade receivables in respect of securitised receivables (2009 – £98 million). Concentrations of credit risk with respect to trade receivables are limited due to the Group’s customer base being large, unrelated and internationally dispersed.
Liquidity risk managementThe Group manages its exposure to liquidity risk and ensures maximum flexibility in meeting changing business needs, by maintaining access to a wide range of funding sources, including capital markets and bank borrowings. In November 2009, the Group issued a £200 million 6.75% bond which matures in November 2019, and undertook a tender offer to repurchase the 2012 sterling bonds. The objective of the new issue in conjunction with the tender offer for the 2012 sterling bonds was to extend the Group’s maturity profile and further diversify sources of funding. The Group repurchased £100 million of the 2012 sterling bonds on the completion of the tender offer. Capital market issues outstanding at 31 March 2010 include the US$300 million 6.125% 144A bond maturing in 2011, the £100 million 6.50% bond maturing in 2012, the US$500 million 5.00% 144A bond maturing in 2014, the US$250 million 6.625% 144A bond maturing in 2016, and the £200 million 6.75% bond maturing in 2019.
The Group ensures that it has sufficient undrawn committed bank facilities to provide liquidity back-up to cover its funding requirements for the foreseeable future. The Group has a core committed bank facility of US$1 billion of which US$1 billion matures in 2012. This facility is unsecured and contains common financial covenants for Tate & Lyle and its subsidiary companies that the pre-exceptional and amortisation interest cover ratio should not be less than 2.5 times and the multiple of net debt to EBITDA, as defined in our financial covenants, should not be greater than 4.0 times. In the year ended 31 March 2009, the Group amended the definition of the net debt to EBITDA covenant in the US$1 billion Revolving Credit Facility to eliminate the distortion of foreign exchange volatility, so that net debt is translated at the same average exchange rates used to translate EBITDA.
The Group monitors compliance against all its financial obligations and it is Group policy to manage the consolidated statement of financial position so as to operate well within these covenanted restrictions. In both the current and comparative reporting period, the Group complied with its financial covenants at all measurement points. The majority of the Group’s borrowings are raised through the Group treasury company, Tate & Lyle International Finance PLC, and are then on-lent to the business units on an arm’s length basis.
Notes to the consolidated financial statements
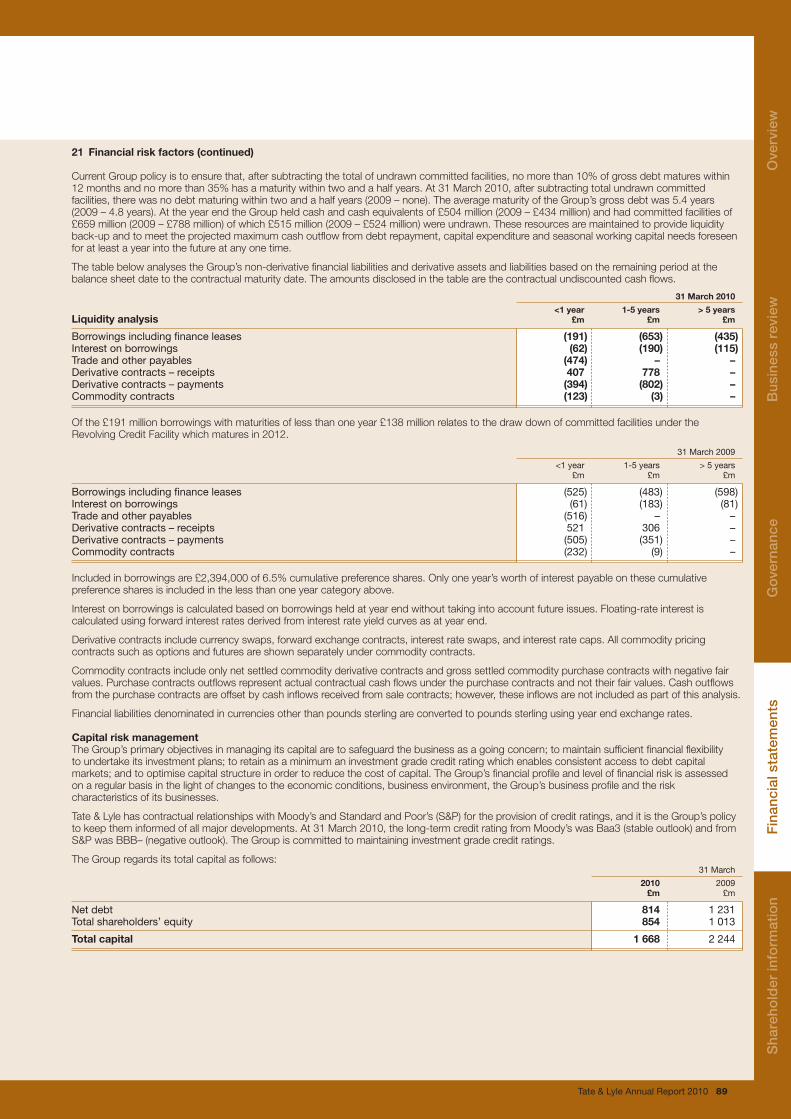
Tate & Lyle Annual Report 2010 89
21 Financial risk factors (continued)
Current Group policy is to ensure that, after subtracting the total of undrawn committed facilities, no more than 10% of gross debt matures within 12 months and no more than 35% has a maturity within two and a half years. At 31 March 2010, after subtracting total undrawn committed facilities, there was no debt maturing within two and a half years (2009 – none). The average maturity of the Group’s gross debt was 5.4 years (2009 – 4.8 years). At the year end the Group held cash and cash equivalents of £504 million (2009 – £434 million) and had committed facilities of £659 million (2009 – £788 million) of which £515 million (2009 – £524 million) were undrawn. These resources are maintained to provide liquidity back-up and to meet the projected maximum cash outflow from debt repayment, capital expenditure and seasonal working capital needs foreseen for at least a year into the future at any one time.
The table below analyses the Group’s non-derivative financial liabilities and derivative assets and liabilities based on the remaining period at the balance sheet date to the contractual maturity date. The amounts disclosed in the table are the contractual undiscounted cash flows.
31 March 2010
<1 year 1-5 years > 5 yearsLiquidity analysis £m £m £m
Borrowings including finance leases (191) (653) (435)Interest on borrowings (62) (190) (115)Trade and other payables (474) – –Derivative contracts – receipts 407 778 –Derivative contracts – payments (394) (802) –Commodity contracts (123) (3) –
Of the £191 million borrowings with maturities of less than one year £138 million relates to the draw down of committed facilities under the Revolving Credit Facility which matures in 2012.
31 March 2009
<1 year 1-5 years > 5 years £m £m £m
Borrowings including finance leases (525) (483) (598)Interest on borrowings (61) (183) (81)Trade and other payables (516) – –Derivative contracts – receipts 521 306 –Derivative contracts – payments (505) (351) –Commodity contracts (232) (9) –
Included in borrowings are £2,394,000 of 6.5% cumulative preference shares. Only one year’s worth of interest payable on these cumulative preference shares is included in the less than one year category above.
Interest on borrowings is calculated based on borrowings held at year end without taking into account future issues. Floating-rate interest is calculated using forward interest rates derived from interest rate yield curves as at year end.
Derivative contracts include currency swaps, forward exchange contracts, interest rate swaps, and interest rate caps. All commodity pricing contracts such as options and futures are shown separately under commodity contracts.
Commodity contracts include only net settled commodity derivative contracts and gross settled commodity purchase contracts with negative fair values. Purchase contracts outflows represent actual contractual cash flows under the purchase contracts and not their fair values. Cash outflows from the purchase contracts are offset by cash inflows received from sale contracts; however, these inflows are not included as part of this analysis.
Financial liabilities denominated in currencies other than pounds sterling are converted to pounds sterling using year end exchange rates.
Capital risk managementThe Group’s primary objectives in managing its capital are to safeguard the business as a going concern; to maintain sufficient financial flexibility to undertake its investment plans; to retain as a minimum an investment grade credit rating which enables consistent access to debt capital markets; and to optimise capital structure in order to reduce the cost of capital. The Group’s financial profile and level of financial risk is assessed on a regular basis in the light of changes to the economic conditions, business environment, the Group’s business profile and the risk characteristics of its businesses.
Tate & Lyle has contractual relationships with Moody’s and Standard and Poor’s (S&P) for the provision of credit ratings, and it is the Group’s policy to keep them informed of all major developments. At 31 March 2010, the long-term credit rating from Moody’s was Baa3 (stable outlook) and from S&P was BBB– (negative outlook). The Group is committed to maintaining investment grade credit ratings.
The Group regards its total capital as follows: 31 March
2010 2009 £m £m
Net debt 814 1 231Total shareholders’ equity 854 1 013
Total capital 1 668 2 244
Sha
reho
lder
info
rmat
ion
Ove
rvie
wB
usin
ess
revi
ewG
over
nanc
eF
inan
cial
sta
tem
ents
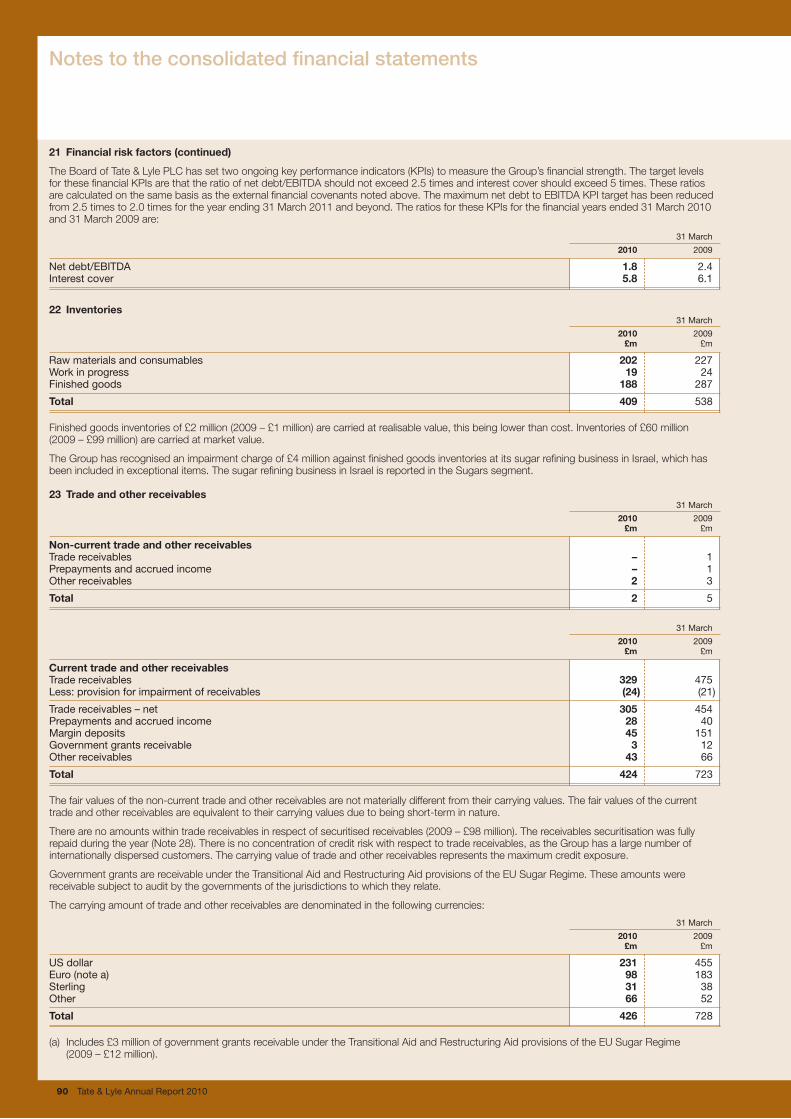
90 Tate & Lyle Annual Report 2010
21 Financial risk factors (continued)
The Board of Tate & Lyle PLC has set two ongoing key performance indicators (KPIs) to measure the Group’s financial strength. The target levels for these financial KPIs are that the ratio of net debt/EBITDA should not exceed 2.5 times and interest cover should exceed 5 times. These ratios are calculated on the same basis as the external financial covenants noted above. The maximum net debt to EBITDA KPI target has been reduced from 2.5 times to 2.0 times for the year ending 31 March 2011 and beyond. The ratios for these KPIs for the financial years ended 31 March 2010 and 31 March 2009 are:
31 March
2010 2009
Net debt/EBITDA 1.8 2.4Interest cover 5.8 6.1
22 Inventories 31 March
2010 2009 £m £m
Raw materials and consumables 202 227Work in progress 19 24Finished goods 188 287
Total 409 538
Finished goods inventories of £2 million (2009 – £1 million) are carried at realisable value, this being lower than cost. Inventories of £60 million (2009 – £99 million) are carried at market value.
The Group has recognised an impairment charge of £4 million against finished goods inventories at its sugar refining business in Israel, which has been included in exceptional items. The sugar refining business in Israel is reported in the Sugars segment.
23 Trade and other receivables 31 March
2010 2009 £m £m
Non-current trade and other receivablesTrade receivables – 1Prepayments and accrued income – 1Other receivables 2 3
Total 2 5
31 March
2010 2009 £m £m
Current trade and other receivablesTrade receivables 329 475Less: provision for impairment of receivables (24) (21)
Trade receivables – net 305 454Prepayments and accrued income 28 40Margin deposits 45 151Government grants receivable 3 12Other receivables 43 66
Total 424 723
The fair values of the non-current trade and other receivables are not materially different from their carrying values. The fair values of the current trade and other receivables are equivalent to their carrying values due to being short-term in nature.
There are no amounts within trade receivables in respect of securitised receivables (2009 – £98 million). The receivables securitisation was fully repaid during the year (Note 28). There is no concentration of credit risk with respect to trade receivables, as the Group has a large number of internationally dispersed customers. The carrying value of trade and other receivables represents the maximum credit exposure.
Government grants are receivable under the Transitional Aid and Restructuring Aid provisions of the EU Sugar Regime. These amounts were receivable subject to audit by the governments of the jurisdictions to which they relate.
The carrying amount of trade and other receivables are denominated in the following currencies:
31 March
2010 2009 £m £m
US dollar 231 455Euro (note a) 98 183Sterling 31 38Other 66 52
Total 426 728
(a) Includes £3 million of government grants receivable under the Transitional Aid and Restructuring Aid provisions of the EU Sugar Regime (2009 – £12 million).
Notes to the consolidated financial statements

Tate & Lyle Annual Report 2010 91
23 Trade and other receivables (continued)
Provision for impairment of receivables 31 March
2010 2009 £m £m
At 1 April (21) (9)Charge for the year (3) (14)Reversal of impairment 1 3Disposal of businesses – 2Exchange (1) (3)
At 31 March (24) (21)
The creation and release of provision for impaired receivables have been included in the income statement.
The Group recognised a loss of £3 million (2009 – £14 million) for impairment of its trade receivables during the year. Of this loss £3 million (2009 – £2 million) from continuing operations and £nil million (2009 – £3 million) from discontinued operations has been included in operating profit in the income statement (Note 6) and £nil million (2009 – £9 million) has been included in exceptional items.
As at 31 March 2010, trade receivables of £63 million (2009 – £66 million) were past due but not impaired. The ageing analysis of these trade receivables is as follows:
31 March
2010 2009 £m £m
Up to 30 days past due 42 371-3 months past due 4 16Over 3 months past due 17 13
Total 63 66
24 Share capital and share premium Ordinary Share share capital premium Total £m £m £m
At 1 April 2008 114 404 518Proceeds from issuance of ordinary shares 1 – 1
At 31 March 2009 115 404 519Proceeds from issuance of ordinary shares – 1 1
At 31 March 2010 115 405 520
Ordinary shares carry the right to participate in dividends and each share entitles the holder to one vote on matters requiring shareholder approval.
Authorised equity share capital 31 March
2010 2009 £m £m
790,424,000 ordinary shares of 25p each (2009 – 790,424,000) 198 198
Allotted, called up and fully paid equity share capital 31 March 2010 31 March 2009
Shares £m Shares £m At 1 April 460 012 801 115 459 910 466 114Allotted under share option schemes 48 287 – 102 335 1Scrip dividend shares issued 514 612 – – –
At 31 March 460 575 700 115 460 012 801 115
Treasury shares and shares held in ESOP trustAs at 31 March 2010, the Group held 512,490 shares (2009 – 1,328,502 shares) in Treasury.
During the year 816,012 shares (2009 – 1,426,571 shares) were released from Treasury to satisfy share options exercised.
The shares held in Treasury at 31 March 2010 represent 0.1% (2009 – 0.3%) of the Parent company’s share capital at the year end, and have a nominal value of £0.1 million (2009 – £0.3 million).
As at 31 March 2010, the Group held 3,141,100 shares (2009 – 1,840,801 shares) in an ESOP trust at a nominal value of 25p and a market value of 454.2p (2009 – 260.5p).
During the year ended 31 March 2010, shareholders were given the option to receive the interim dividends in the form of a scrip issue. On 8 January 2010, the Group issued 514,612 shares for scrip at a nominal value per share of 25p and a cash equivalent value of £4.25.
Sha
reho
lder
info
rmat
ion
Ove
rvie
wB
usin
ess
revi
ewG
over
nanc
eF
inan
cial
sta
tem
ents
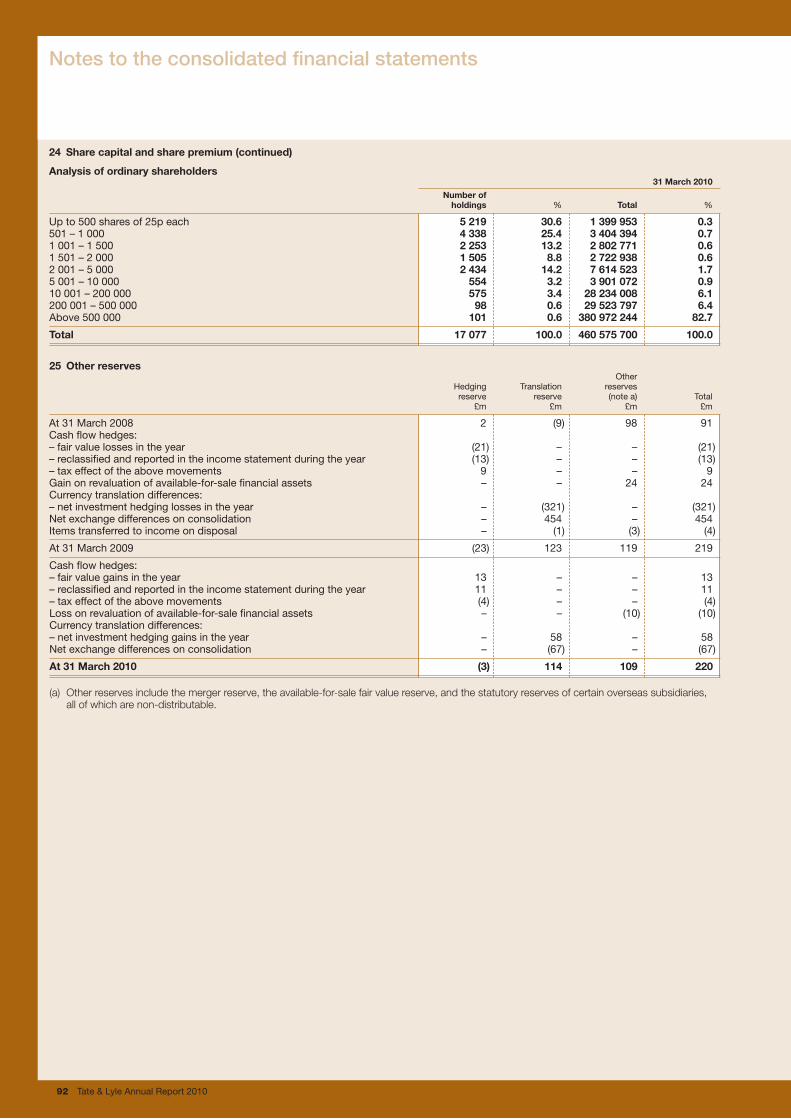
92 Tate & Lyle Annual Report 2010
24 Sharecapitalandsharepremium(continued)
Analysisofordinaryshareholders 31March2010 Numberof holdings % Total %
Up to 500 shares of 25p each 5219 30.6 1399953 0.3501 – 1 000 4338 25.4 3404394 0.71 001 – 1 500 2253 13.2 2802771 0.61 501 – 2 000 1505 8.8 2722938 0.62 001 – 5 000 2434 14.2 7614523 1.75 001 – 10 000 554 3.2 3901072 0.910 001 – 200 000 575 3.4 28234008 6.1200 001 – 500 000 98 0.6 29523797 6.4Above 500 000 101 0.6 380972244 82.7
Total 17077 100.0 460575700 100.0
25 Otherreserves Other Hedging Translation reserves reserve reserve (note a) Total £m £m £m £m
At 31 March 2008 2 (9) 98 91Cash flow hedges:– fair value losses in the year (21) – – (21)– reclassified and reported in the income statement during the year (13) – – (13)– tax effect of the above movements 9 – – 9Gain on revaluation of available-for-sale financial assets – – 24 24Currency translation differences:– net investment hedging losses in the year – (321) – (321)Net exchange differences on consolidation – 454 – 454Items transferred to income on disposal – (1) (3) (4)
At 31 March 2009 (23) 123 119 219
Cash flow hedges:– fair value gains in the year 13 – – 13– reclassified and reported in the income statement during the year 11 – – 11– tax effect of the above movements (4) – – (4)Loss on revaluation of available-for-sale financial assets – – (10) (10)Currency translation differences:– net investment hedging gains in the year – 58 – 58Net exchange differences on consolidation – (67) – (67)
At31March2010 (3) 114 109 220
(a) Otherreservesincludethemergerreserve,theavailable-for-salefairvaluereserve,andthestatutoryreservesofcertainoverseassubsidiaries,allofwhicharenon-distributable.
Notes to the consolidated financial statements
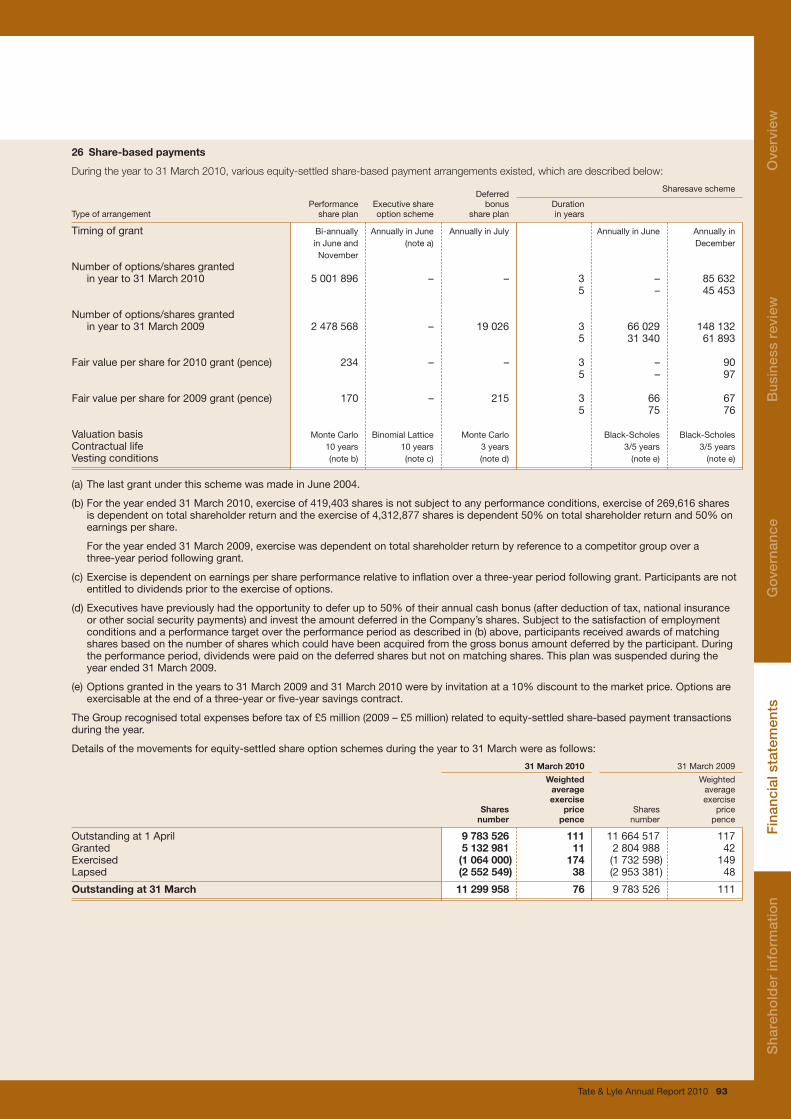
Tate & Lyle Annual Report 2010 93
26 Share-basedpayments
Duringtheyearto31March2010,variousequity-settledshare-basedpaymentarrangementsexisted,whicharedescribedbelow:
Deferred Sharesave scheme
Performance Executive share bonus Duration Type of arrangement share plan option scheme share plan in years
Timing of grant Bi-annually Annually in June Annually in July Annually in June Annually in in June and (note a) December November Number of options/shares granted in year to 31 March 2010 5 001 896 – – 3 – 85 632 5 – 45 453
Number of options/shares granted in year to 31 March 2009 2 478 568 – 19 026 3 66 029 148 132 5 31 340 61 893
Fair value per share for 2010 grant (pence) 234 – – 3 – 90 5 – 97
Fair value per share for 2009 grant (pence) 170 – 215 3 66 67 5 75 76
Valuation basis Monte Carlo Binomial Lattice Monte Carlo Black-Scholes Black-ScholesContractual life 10 years 10 years 3 years 3/5 years 3/5 yearsVesting conditions (note b) (note c) (note d) (note e) (note e)
(a) The last grant under this scheme was made in June 2004.
(b) For the year ended 31 March 2010, exercise of 419,403 shares is not subject to any performance conditions, exercise of 269,616 shares is dependent on total shareholder return and the exercise of 4,312,877 shares is dependent 50% on total shareholder return and 50% on earnings per share.
For the year ended 31 March 2009, exercise was dependent on total shareholder return by reference to a competitor group over a three-year period following grant.
(c) Exercise is dependent on earnings per share performance relative to inflation over a three-year period following grant. Participants are not entitled to dividends prior to the exercise of options.
(d) Executives have previously had the opportunity to defer up to 50% of their annual cash bonus (after deduction of tax, national insurance or other social security payments) and invest the amount deferred in the Company’s shares. Subject to the satisfaction of employment conditions and a performance target over the performance period as described in (b) above, participants received awards of matching shares based on the number of shares which could have been acquired from the gross bonus amount deferred by the participant. During the performance period, dividends were paid on the deferred shares but not on matching shares. This plan was suspended during the year ended 31 March 2009.
(e) Options granted in the years to 31 March 2009 and 31 March 2010 were by invitation at a 10% discount to the market price. Options are exercisable at the end of a three-year or five-year savings contract.
The Group recognised total expenses before tax of £5 million (2009 – £5 million) related to equity-settled share-based payment transactions during the year.
Details of the movements for equity-settled share option schemes during the year to 31 March were as follows:
31March2010 31 March 2009
Weighted Weighted average average exercise exercise Shares price Shares price number pence number pence
Outstanding at 1 April 9783526 111 11 664 517 117Granted 5132981 11 2 804 988 42Exercised (1064000) 174 (1 732 598) 149Lapsed (2552549) 38 (2 953 381) 48
Outstandingat31March 11299958 76 9 783 526 111
Sha
reho
lder
info
rmat
ion
Ove
rvie
wB
usin
ess
revi
ewG
over
nanc
eF
inan
cial
sta
tem
ents
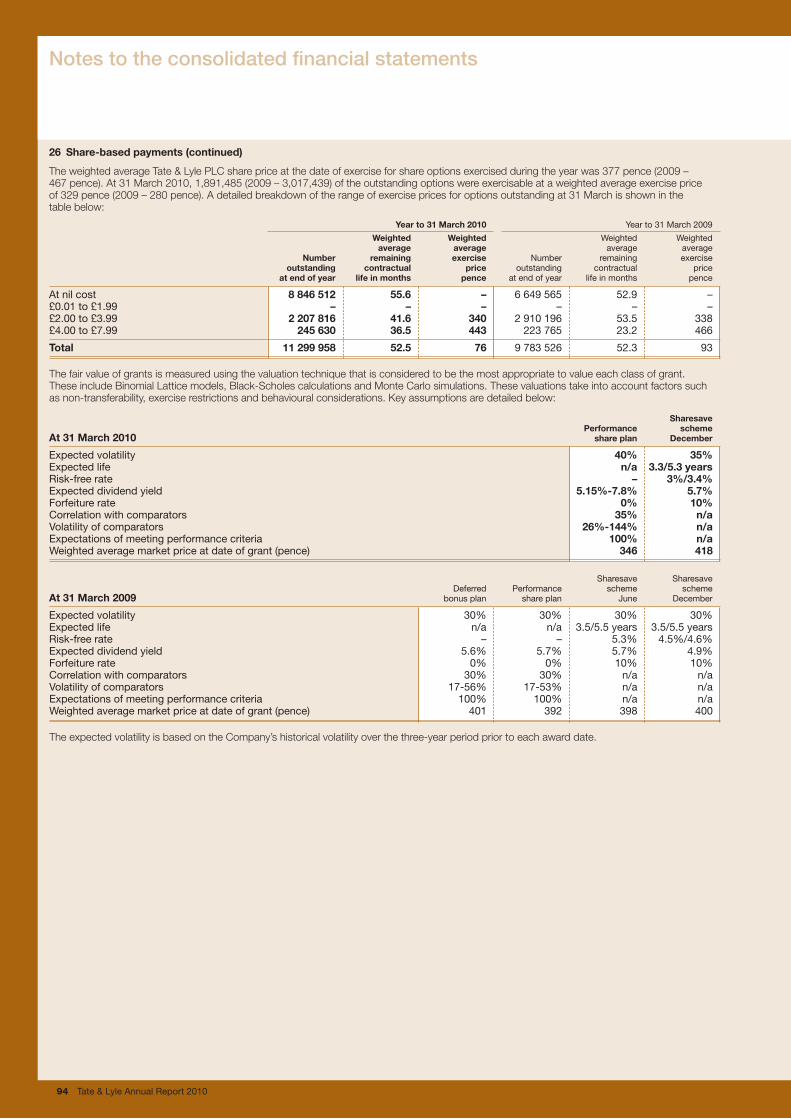
94 Tate & Lyle Annual Report 2010
26 Share-basedpayments(continued)
TheweightedaverageTate&LylePLCsharepriceatthedateofexerciseforshareoptionsexercisedduringtheyearwas377pence(2009–467 pence).At31March2010,1,891,485(2009–3,017,439)oftheoutstandingoptionswereexercisableataweightedaverageexercisepriceof329pence(2009–280pence).Adetailedbreakdownoftherangeofexercisepricesforoptionsoutstandingat31Marchisshowninthetablebelow:
Yearto31March2010 Year to 31 March 2009 Weighted Weighted Weighted Weighted average average average average Number remaining exercise Number remaining exercise outstanding contractual price outstanding contractual price atendofyear lifeinmonths pence at end of year life in months pence
At nil cost 8846512 55.6 – 6 649 565 52.9 –£0.01 to £1.99 – – – – – –£2.00 to £3.99 2207816 41.6 340 2 910 196 53.5 338£4.00 to £7.99 245630 36.5 443 223 765 23.2 466
Total 11299958 52.5 76 9 783 526 52.3 93
Thefairvalueofgrantsismeasuredusingthevaluationtechniquethatisconsideredtobethemostappropriatetovalueeachclassofgrant.TheseincludeBinomialLatticemodels,Black-ScholescalculationsandMonteCarlosimulations.Thesevaluationstakeintoaccountfactorssuchasnon-transferability,exerciserestrictionsandbehaviouralconsiderations.Keyassumptionsaredetailedbelow:
Sharesave Performance schemeAt31March2010 shareplan December
Expected volatility 40% 35%Expected life n/a 3.3/5.3yearsRisk-free rate – 3%/3.4%Expected dividend yield 5.15%-7.8% 5.7%Forfeiture rate 0% 10%Correlation with comparators 35% n/aVolatility of comparators 26%-144% n/aExpectations of meeting performance criteria 100% n/aWeighted average market price at date of grant (pence) 346 418
Sharesave Sharesave Deferred Performance scheme schemeAt31March2009 bonus plan share plan June December
Expected volatility 30% 30% 30% 30%Expected life n/a n/a 3.5/5.5 years 3.5/5.5 yearsRisk-free rate – – 5.3% 4.5%/4.6%Expected dividend yield 5.6% 5.7% 5.7% 4.9%Forfeiture rate 0% 0% 10% 10%Correlation with comparators 30% 30% n/a n/aVolatility of comparators 17-56% 17-53% n/a n/aExpectations of meeting performance criteria 100% 100% n/a n/aWeighted average market price at date of grant (pence) 401 392 398 400
TheexpectedvolatilityisbasedontheCompany’shistoricalvolatilityoverthethree-yearperiodpriortoeachawarddate.
Notes to the consolidated financial statements

Tate & Lyle Annual Report 2010 95
27 Tradeandotherpayables 31 March
2010 2009 £m £m
Non-currentpayablesAccruals and deferred income (note a) – 10Other payables 1 1
Total 1 11
31 March
2010 2009 £m £m
CurrentpayablesTrade payables 302 295Social security 12 9Deferred consideration (note b) 7 28Accruals and deferred income (note c) 126 178Other payables 38 28
Total 485 538
(a) Includesgovernmentgrantdeferredincomeof£nilmillion(2009–£9million)undertheTransitionalAidprovisionsoftheEUSugarRegime.
(b) DeferredconsiderationrelatestotheacquisitionofG.C.Hahn&Co.(Note37).
(c) Includesgovernmentgrantdeferredincomeof£9million(2009–£18million)undertheTransitionalAidprovisionsoftheEUSugarRegime.
28 Borrowings
Non-currentborrowings 31 March
2010 2009 £m £m
Unsecuredborrowings2,394,000 6.5% cumulative preference shares of £1 each (2009 – £2,394,000) (note a) 2 2Industrial Revenue Bonds 2016-2036 (US$92,000,000) 61 646.125% Guaranteed Notes 2011 (US$300,000,000) 200 2146.5% Guaranteed Notes 2012 (£100,000,000) (note b) 106 2155.0% Guaranteed Notes 2014 (US$500,000,000) 346 3666.625% Guaranteed Notes 2016 (US$250,000,000) 176 1896.75% Guaranteed Notes 2019 (£200,000,000) 200 –
1091 1 050
BankloansVariable unsecured loans (US$) 6 7Variable unsecured loans (euro) – 47
6 54
OtherborrowingsObligations under finance leases 22 25
22 25
Totalnon-currentborrowings 1119 1 129
(a) Onareturnofcapitalonawinding-up,theholdersof6.5%cumulativepreferencesharesshallbeentitledto£1pershare,inpreferencetoallotherclassesofshareholders.Holdersofthesesharesareentitledtovoteatmeetings,exceptonthefollowingmatters:anyquestionastothedisposalofthesurplusprofitsafterthedividendontheseshareshasbeenprovidedfor;theelectionofdirectors;theirremuneration;anyagreementbetweenthedirectorsandtheCompany;orthealterationoftheArticlesofAssociationdealingwithanysuchmatters.
(b) Duringtheyearended31March2010,theGroupredeemed£100millionofthe6.5%GuaranteedNotesmaturinginJune2012.
Sha
reho
lder
info
rmat
ion
Ove
rvie
wB
usin
ess
revi
ewG
over
nanc
eF
inan
cial
sta
tem
ents
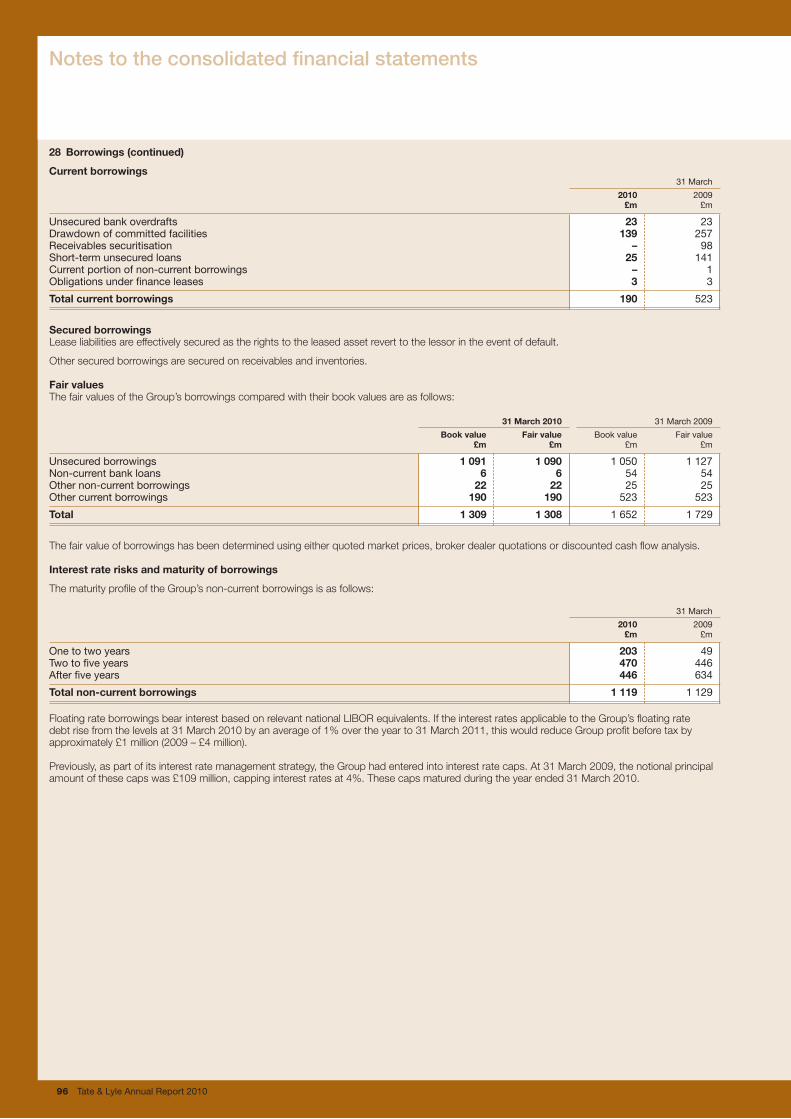
96 Tate & Lyle Annual Report 2010
28 Borrowings(continued)
Currentborrowings 31 March
2010 2009 £m £m
Unsecured bank overdrafts 23 23Drawdown of committed facilities 139 257Receivables securitisation – 98Short-term unsecured loans 25 141Current portion of non-current borrowings – 1Obligations under finance leases 3 3
Totalcurrentborrowings 190 523
SecuredborrowingsLeaseliabilitiesareeffectivelysecuredastherightstotheleasedassetreverttothelessorintheeventofdefault.
Othersecuredborrowingsaresecuredonreceivablesandinventories.
FairvaluesThefairvaluesoftheGroup’sborrowingscomparedwiththeirbookvaluesareasfollows:
31March2010 31 March 2009
Bookvalue Fairvalue Book value Fair value £m £m £m £m
Unsecured borrowings 1091 1090 1 050 1 127Non-current bank loans 6 6 54 54Other non-current borrowings 22 22 25 25Other current borrowings 190 190 523 523
Total 1309 1308 1 652 1 729
Thefairvalueofborrowingshasbeendeterminedusingeitherquotedmarketprices,brokerdealerquotationsordiscountedcashflowanalysis.
Interestraterisksandmaturityofborrowings
ThematurityprofileoftheGroup’snon-currentborrowingsisasfollows:
31 March
2010 2009 £m £m
One to two years 203 49Two to five years 470 446After five years 446 634
Totalnon-currentborrowings 1119 1 129
FloatingrateborrowingsbearinterestbasedonrelevantnationalLIBORequivalents.IftheinterestratesapplicabletotheGroup’sfloatingratedebtrisefromthelevelsat31March2010byanaverageof1%overtheyearto31March2011,thiswouldreduceGroupprofitbeforetaxbyapproximately£1million(2009–£4million).
Previously,aspartofitsinterestratemanagementstrategy,theGrouphadenteredintointerestratecaps.At31March2009,thenotionalprincipalamountofthesecapswas£109million,cappinginterestratesat4%.Thesecapsmaturedduringtheyearended31March2010.
Notes to the consolidated financial statements
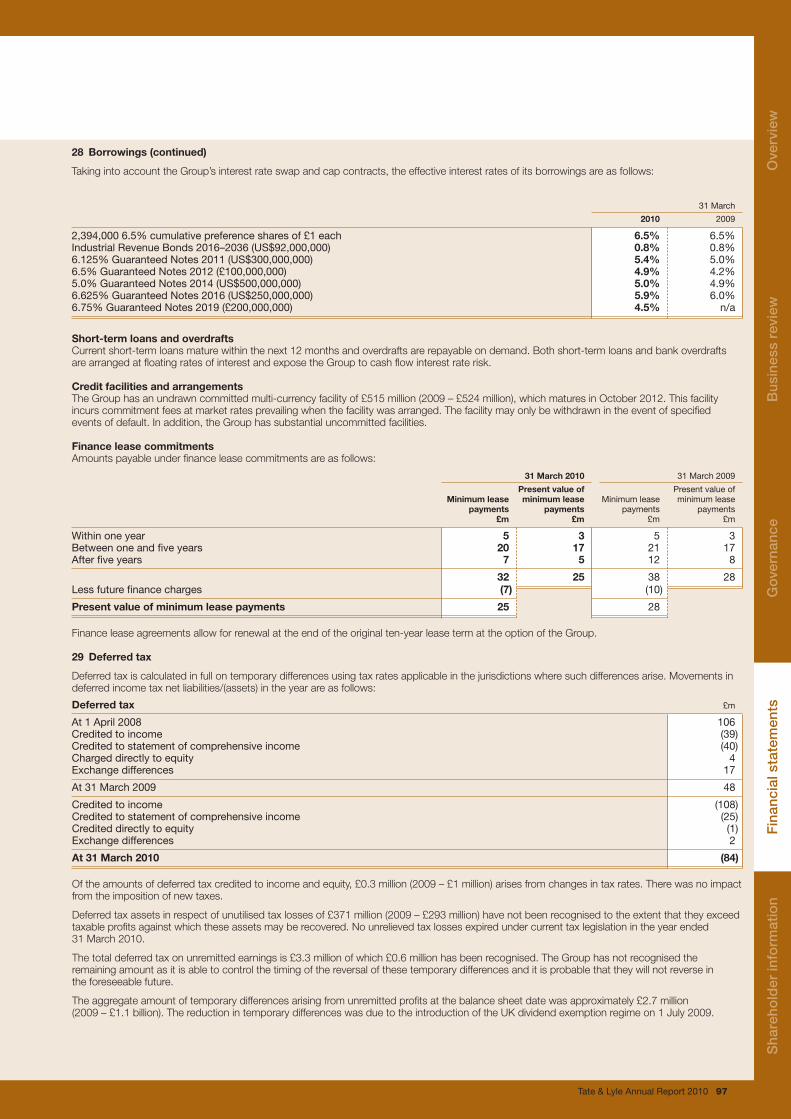
Tate & Lyle Annual Report 2010 97
28 Borrowings(continued)
TakingintoaccounttheGroup’sinterestrateswapandcapcontracts,theeffectiveinterestratesofitsborrowingsareasfollows:
31 March
2010 2009
2,394,000 6.5% cumulative preference shares of £1 each 6.5% 6.5%Industrial Revenue Bonds 2016–2036 (US$92,000,000) 0.8% 0.8%6.125% Guaranteed Notes 2011 (US$300,000,000) 5.4% 5.0%6.5% Guaranteed Notes 2012 (£100,000,000) 4.9% 4.2%5.0% Guaranteed Notes 2014 (US$500,000,000) 5.0% 4.9%6.625% Guaranteed Notes 2016 (US$250,000,000) 5.9% 6.0%6.75% Guaranteed Notes 2019 (£200,000,000) 4.5% n/a
Short-termloansandoverdraftsCurrentshort-termloansmaturewithinthenext12monthsandoverdraftsarerepayableondemand.Bothshort-termloansandbankoverdraftsarearrangedatfloatingratesofinterestandexposetheGrouptocashflowinterestraterisk.
CreditfacilitiesandarrangementsTheGrouphasanundrawncommittedmulti-currencyfacilityof£515million(2009–£524million),whichmaturesinOctober2012.Thisfacilityincurscommitmentfeesatmarketratesprevailingwhenthefacilitywasarranged.Thefacilitymayonlybewithdrawnintheeventofspecifiedeventsofdefault.Inaddition,theGrouphassubstantialuncommittedfacilities.
FinanceleasecommitmentsAmountspayableunderfinanceleasecommitmentsareasfollows:
31March2010 31 March 2009
Presentvalueof Present value of Minimumlease minimumlease Minimum lease minimum lease payments payments payments payments £m £m £m £m
Within one year 5 3 5 3Between one and five years 20 17 21 17After five years 7 5 12 8
32 25 38 28Less future finance charges (7) (10)
Presentvalueofminimumleasepayments 25 28
Financeleaseagreementsallowforrenewalattheendoftheoriginalten-yearleasetermattheoptionoftheGroup.
29 Deferredtax
Deferredtaxiscalculatedinfullontemporarydifferencesusingtaxratesapplicableinthejurisdictionswheresuchdifferencesarise.Movementsindeferredincometaxnetliabilities/(assets)intheyearareasfollows:
Deferredtax £m
At 1 April 2008 106Credited to income (39)Credited to statement of comprehensive income (40)Charged directly to equity 4Exchange differences 17At 31 March 2009 48
Credited to income (108)Credited to statement of comprehensive income (25)Credited directly to equity (1)Exchange differences 2
At31March2010 (84)
Oftheamountsofdeferredtaxcreditedtoincomeandequity,£0.3million(2009–£1million)arisesfromchangesintaxrates.Therewasnoimpactfromtheimpositionofnewtaxes.
Deferredtaxassetsinrespectofunutilisedtaxlossesof£371million(2009–£293million)havenotbeenrecognisedtotheextentthattheyexceedtaxableprofitsagainstwhichtheseassetsmayberecovered.Nounrelievedtaxlossesexpiredundercurrenttaxlegislationintheyearended31March2010.
Thetotaldeferredtaxonunremittedearningsis£3.3millionofwhich£0.6millionhasbeenrecognised.TheGrouphasnotrecognisedtheremainingamountasitisabletocontrolthetimingofthereversalofthesetemporarydifferencesanditisprobablethattheywillnotreverseintheforeseeablefuture.
Theaggregateamountoftemporarydifferencesarisingfromunremittedprofitsatthebalancesheetdatewasapproximately£2.7million(2009–£1.1billion).ThereductionintemporarydifferenceswasduetotheintroductionoftheUKdividendexemptionregimeon1July2009.
Sha
reho
lder
info
rmat
ion
Ove
rvie
wB
usin
ess
revi
ewG
over
nanc
eF
inan
cial
sta
tem
ents
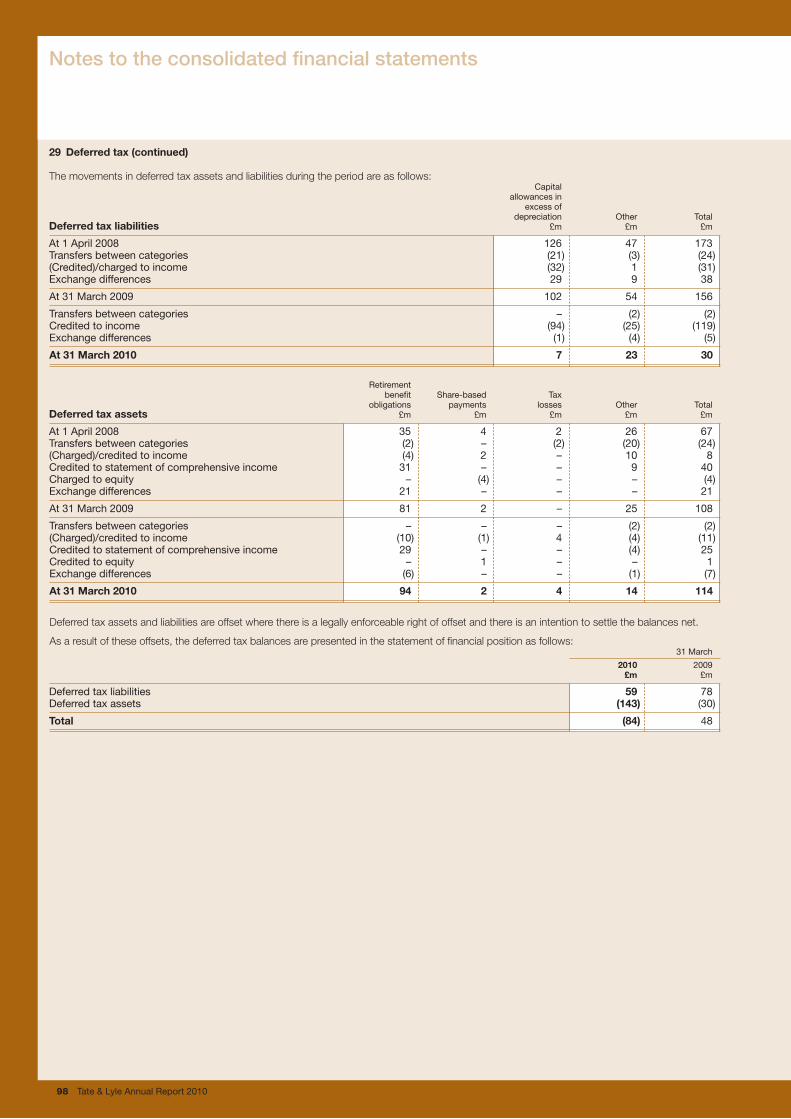
98 Tate & Lyle Annual Report 2010
29 Deferredtax(continued)
Themovementsindeferredtaxassetsandliabilitiesduringtheperiodareasfollows: Capital allowances in excess of depreciation Other TotalDeferredtaxliabilities £m £m £m
At 1 April 2008 126 47 173Transfers between categories (21) (3) (24)(Credited)/charged to income (32) 1 (31)Exchange differences 29 9 38
At 31 March 2009 102 54 156
Transfers between categories – (2) (2)Credited to income (94) (25) (119)Exchange differences (1) (4) (5)
At31March2010 7 23 30
Retirement benefit Share-based Tax obligations payments losses Other Total Deferredtaxassets £m £m £m £m £m
At 1 April 2008 35 4 2 26 67Transfers between categories (2) – (2) (20) (24)(Charged)/credited to income (4) 2 – 10 8Credited to statement of comprehensive income 31 – – 9 40Charged to equity – (4) – – (4)Exchange differences 21 – – – 21
At 31 March 2009 81 2 – 25 108
Transfers between categories – – – (2) (2)(Charged)/credited to income (10) (1) 4 (4) (11)Credited to statement of comprehensive income 29 – – (4) 25Credited to equity – 1 – – 1Exchange differences (6) – – (1) (7)
At31March2010 94 2 4 14 114
Deferredtaxassetsandliabilitiesareoffsetwherethereisalegallyenforceablerightofoffsetandthereisanintentiontosettlethebalancesnet.
Asaresultoftheseoffsets,thedeferredtaxbalancesarepresentedinthestatementoffinancialpositionasfollows: 31 March
2010 2009 £m £m
Deferred tax liabilities 59 78Deferred tax assets (143) (30)
Total (84) 48
Notes to the consolidated financial statements

Tate & Lyle Annual Report 2010 99
30 Retirementbenefitobligations
(a) PlaninformationTheGroupmaintainspensionplansforitsoperationsthroughouttheworld.Someofthesearrangementsaredefinedbenefitpensionschemeswithretirement,disability,deathandterminationincomebenefits.Theretirementincomebenefitsaregenerallyafunctionofyearsofemploymentandfinalsalary.
Theprincipalschemesarefundedandtheirassetsheldinseparatetrustee-administeredfunds.Theschemesarefundedinlinewithlocalpracticeandcontributionsareassessedinaccordancewithlocalindependentactuarialadvice.TheschemesoperatedbytheGrouparesubjecttoindependentactuarialvaluationatregularintervalsusingconsistentassumptionsappropriatetoconditionsprevailingintherelevantcountry.Themostrecentactuarialvaluationsofplanassetsandthepresentvalueofthedefinedbenefitobligationswerecarriedoutasat31March2007byindependentactuaries.
TheGroupalsomaintainsdefinedcontributionpensionschemesandsomefullyinsuredpensionschemes.
On1April2002,themainUnitedKingdomschemewasclosedtonewmembers.AdefinedcontributionpensionschemehasbeenestablishedtoprovidepensionbenefitstonewUnitedKingdomemployees.Undertheprojectedunitmethod,theservicecostoftheclosedschemewillincreaseasthemembersapproachretirement.
Duringtheyear,theGroupinitiatedaconsultationprocessontheproposalthatthemainUnitedKingdompensionschemebeclosedtofutureaccrualfrom6April2011.Atthesametime,thedecisionthattheGroupwouldnolongerfundearlyretirementswascommunicatedtomembers.TheproposaltoclosetofutureaccrualwasconfirmedbytheGroupon31March2010.Thesechangesgiverisetoexceptionalitemsintheincomestatementfortheyearended31March2010(Note7).
TheGroup’ssubsidiariesintheUSAprovideunfundedretirementmedicalandlifeassurancebenefitstotheiremployees.
TheGroupexpectstocontributeapproximately£38milliontoitsdefinedbenefitplansintheyearto31March2011.
(b)PrincipalassumptionsTheprincipalassumptionsusedforthepurposeoftheactuarialvaluationswereasfollows:
PensionbenefitsMedical
Yearto31March2010 UK US Others benefits
Inflation rate 3.7% 2.5% 2.0% 2.5%Expected rate of salary increases 4.5% 3.5% 2.0% n/aExpected rate of pension increases 3.5% n/a 1.3% n/aDiscount rate 5.5% 5.7% 4.8% 5.6%Expected return on plan assets (total) 5.9% 7.5% 6.3% n/aExpected equity return on plan assets 8.1% 8.4% 7.5% n/a
Pension benefits Medical
Yearto31March2009 UK US Others benefits
Inflation rate 2.7% 2.5% 2.0% 2.5%Expected rate of salary increases 3.5% 3.5% 2.0% n/aExpected rate of pension increases 2.7% n/a 1.0% n/aDiscount rate 6.9% 7.3% 6.3% 7.1%Expected return on plan assets (total) 6.6% 7.9% 5.9% n/aExpected equity return on plan assets 8.5% 8.8% 7.0% n/a
Expectedlongevitypostage65
Mortalityassumptions–Yearto31March2010 UK US
Male aged 65 now 21years 19yearsMale aged 65 in 20 years’ time 24years 19yearsFemale aged 65 now 22years 21yearsFemale aged 65 in 20 years’ time 24years 21years
Expected longevity post age 60
Mortalityassumptions–Yearto31March2009 UK US
Male aged 60 now 26 years 23 yearsMale aged 60 in 15 years’ time 28 years 23 yearsFemale aged 60 now 27 years 25 yearsFemale aged 60 in 15 years’ time 29 years 25 years
Theexpectedretirementageassumptionhasbeenchangedto65duetotheremovalofthediscretionaryearlyretirementtermsasdescribedin(a)above.
Shorterlongevityassumptionsareusedformemberswhoretireongroundsofill-health.
Theexpectedratesofreturnonindividualcategoriesofplanassetsareestimatedbyreferencetoindicespublishedbytherelevantexchanges.Theoverallexpectedrateofreturniscalculatedbyweightingtheindividualratesinaccordancewiththeanticipatedbalanceintheplan’sinvestmentportfolio.Theactualrateofreturnontheplanassetsfortheyearwaspositive26.5%(2009–negative15.4%),andamountedtoagainof£258million(2009–£171millionloss).
Sha
reho
lder
info
rmat
ion
Ove
rvie
wB
usin
ess
revi
ewG
over
nanc
eF
inan
cial
sta
tem
ents

100 Tate & Lyle Annual Report 2010
30 Retirementbenefitobligations(continued)
Medicalcosttrendratesareestimatedat10%perannum(2009–between8.5%-10.5%),gradingdownto5%by2020.Ifmedicalcosttrendratesweretoincreaseordecreaseby1%,theeffectsareestimatedasfollows:
31March2010 31 March 2009
Increase Decrease Increase Decrease £m £m £m £m
Increase/(decrease) in medical benefits current service and interest cost 1 (1) 1 (1)Increase/(decrease) in medical benefits obligation 8 (7) 7 (6)
(c) Amountsrecognisedintheincomestatement
Pensionbenefits Medical
UK US Others Total benefits TotalYearto31March2010 £m £m £m £m £m £m
Current service cost charged to operating profit 3 5 1 9 2 11Exceptional items (Note 7):– negative past service cost (32) – – (32) – (32)– curtailment benefit (10) – – (10) – (10)
Total (credited)/charged to operating profit (39) 5 1 (33) 2 (31)
Interest cost 46 22 2 70 6 76Expected return on plan assets (42) (13) (2) (57) – (57)
Charged to finance expense 4 9 – 13 6 19
Total (35) 14 1 (20) 8 (12)
Pension benefits Medical
UK US Others Total benefits TotalYearto31March2009 £m £m £m £m £m £m
Current service cost charged to operating profit 5 6 1 12 2 14
Interest cost 52 20 2 74 5 79Expected return on plan assets (55) (19) (2) (76) – (76)
(Credited)/charged to finance expense (3) 1 – (2) 5 3
Total 2 7 1 10 7 17
Currentservicecostsarepresentedinstaffcosts(Note9);expectedreturnonplanassetsandinterestcostarepresentedinnetfinanceexpense(Note10).
(d)Amountsrecognisedinthestatementoffinancialposition
Pensionbenefits
UK US Others Total
%of %of %of %of Medical plan plan plan plan benefits TotalAt31March2010 assets £m assets £m assets £m assets £m £m £m
Fair value of plan assets: Equities 29% 249 54% 131 32% 16 34% 396 – 396 Bonds 34% 301 29% 72 44% 22 34% 395 – 395 Property and other 37% 327 17% 42 24% 12 32% 381 – 381
877 245 50 1172 – 1172Present value of funded obligations (872) (357) (57) (1286) – (1286)Present value of unfunded obligations – (42) – (42) (101) (143)
Net asset/(liability) recognised in the statement of financial position 5 (154) (7) (156) (101) (257)
Disclosed in the statement of financial position as: Retirement benefit surplus 15 – 1 16 – 16 Retirement benefit obligations (10) (154) (8) (172) (101) (273)
Notes to the consolidated financial statements
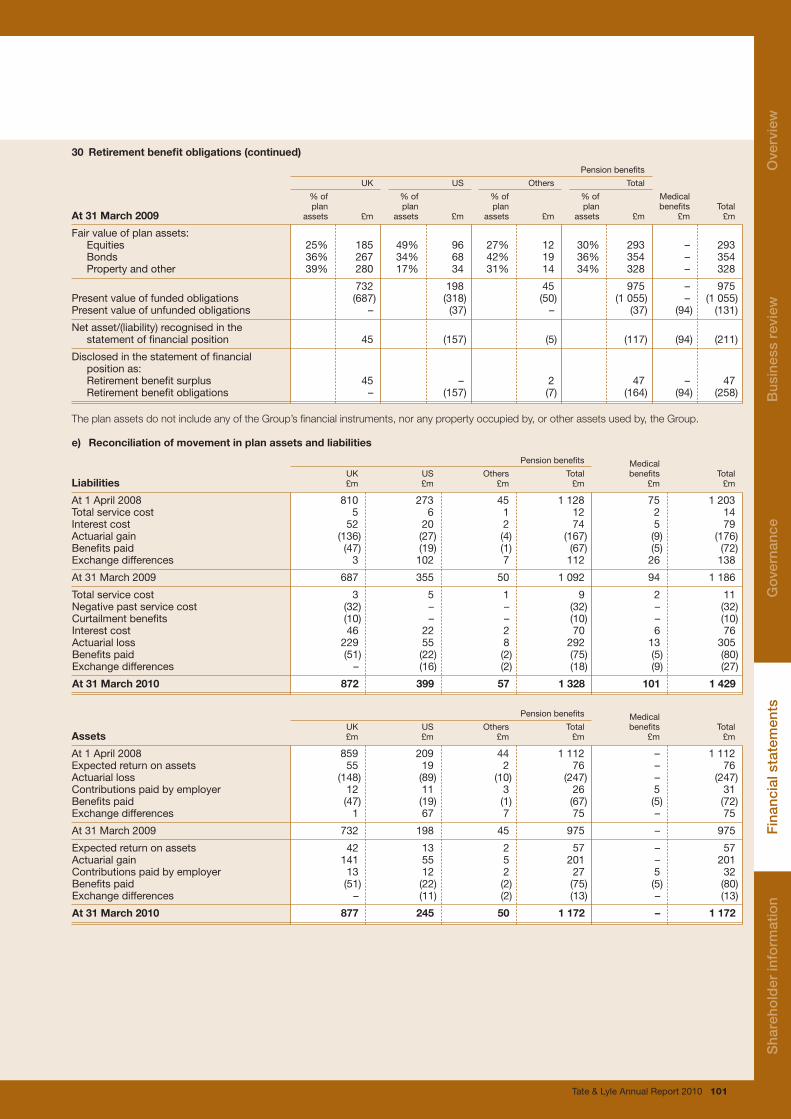
Tate & Lyle Annual Report 2010 101
30 Retirementbenefitobligations(continued)
Pension benefits
UK US Others Total
% of % of % of % of Medical plan plan plan plan benefits TotalAt31March2009 assets £m assets £m assets £m assets £m £m £m
Fair value of plan assets: Equities 25% 185 49% 96 27% 12 30% 293 – 293 Bonds 36% 267 34% 68 42% 19 36% 354 – 354 Property and other 39% 280 17% 34 31% 14 34% 328 – 328
732 198 45 975 – 975Present value of funded obligations (687) (318) (50) (1 055) – (1 055)Present value of unfunded obligations – (37) – (37) (94) (131)
Net asset/(liability) recognised in the statement of financial position 45 (157) (5) (117) (94) (211)
Disclosed in the statement of financial position as: Retirement benefit surplus 45 – 2 47 – 47 Retirement benefit obligations – (157) (7) (164) (94) (258)
TheplanassetsdonotincludeanyoftheGroup’sfinancialinstruments,noranypropertyoccupiedby,orotherassetsusedby,theGroup.
e) Reconciliationofmovementinplanassetsandliabilities
Pension benefits Medical
UK US Others Total benefits TotalLiabilities £m £m £m £m £m £m
At 1 April 2008 810 273 45 1 128 75 1 203Total service cost 5 6 1 12 2 14Interest cost 52 20 2 74 5 79Actuarial gain (136) (27) (4) (167) (9) (176)Benefits paid (47) (19) (1) (67) (5) (72)Exchange differences 3 102 7 112 26 138
At 31 March 2009 687 355 50 1 092 94 1 186
Total service cost 3 5 1 9 2 11Negative past service cost (32) – – (32) – (32)Curtailment benefits (10) – – (10) – (10)Interest cost 46 22 2 70 6 76Actuarial loss 229 55 8 292 13 305Benefits paid (51) (22) (2) (75) (5) (80)Exchange differences – (16) (2) (18) (9) (27)
At31March2010 872 399 57 1328 101 1429
Pension benefits Medical
UK US Others Total benefits TotalAssets £m £m £m £m £m £m
At 1 April 2008 859 209 44 1 112 – 1 112Expected return on assets 55 19 2 76 – 76Actuarial loss (148) (89) (10) (247) – (247)Contributions paid by employer 12 11 3 26 5 31Benefits paid (47) (19) (1) (67) (5) (72)Exchange differences 1 67 7 75 – 75
At 31 March 2009 732 198 45 975 – 975
Expected return on assets 42 13 2 57 – 57Actuarial gain 141 55 5 201 – 201Contributions paid by employer 13 12 2 27 5 32Benefits paid (51) (22) (2) (75) (5) (80)Exchange differences – (11) (2) (13) – (13)
At31March2010 877 245 50 1172 – 1172
Sha
reho
lder
info
rmat
ion
Ove
rvie
wB
usin
ess
revi
ewG
over
nanc
eF
inan
cial
sta
tem
ents
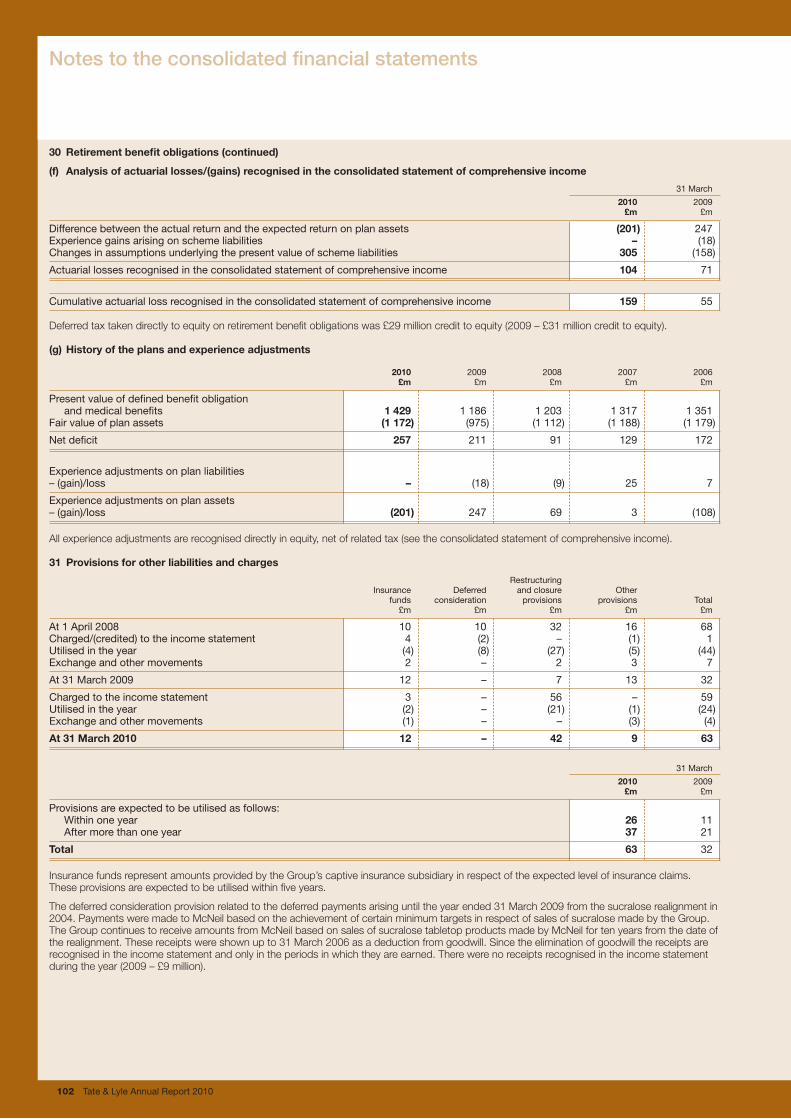
102 Tate & Lyle Annual Report 2010
30 Retirementbenefitobligations(continued)
(f) Analysisofactuariallosses/(gains)recognisedintheconsolidatedstatementofcomprehensiveincome
31 March
2010 2009 £m £m
Difference between the actual return and the expected return on plan assets (201) 247 Experience gains arising on scheme liabilities – (18)Changes in assumptions underlying the present value of scheme liabilities 305 (158)
Actuarial losses recognised in the consolidated statement of comprehensive income 104 71
Cumulative actuarial loss recognised in the consolidated statement of comprehensive income 159 55
Deferredtaxtakendirectlytoequityonretirementbenefitobligationswas£29millioncredittoequity(2009–£31millioncredittoequity).
(g)Historyoftheplansandexperienceadjustments
2010 2009 2008 2007 2006 £m £m £m £m £m
Present value of defined benefit obligation and medical benefits 1429 1 186 1 203 1 317 1 351Fair value of plan assets (1172) (975) (1 112) (1 188) (1 179)
Net deficit 257 211 91 129 172
Experience adjustments on plan liabilities – (gain)/loss – (18) (9) 25 7Experience adjustments on plan assets – (gain)/loss (201) 247 69 3 (108)
Allexperienceadjustmentsarerecogniseddirectlyinequity,netofrelatedtax(seetheconsolidatedstatementofcomprehensiveincome).
31 Provisionsforotherliabilitiesandcharges
Restructuring Insurance Deferred and closure Other funds consideration provisions provisions Total £m £m £m £m £m
At 1 April 2008 10 10 32 16 68Charged/(credited) to the income statement 4 (2) – (1) 1 Utilised in the year (4) (8) (27) (5) (44)Exchange and other movements 2 – 2 3 7
At 31 March 2009 12 – 7 13 32
Charged to the income statement 3 – 56 – 59Utilised in the year (2) – (21) (1) (24)Exchange and other movements (1) – – (3) (4)
At31March2010 12 – 42 9 63
31 March
2010 2009 £m £m
Provisions are expected to be utilised as follows: Within one year 26 11 After more than one year 37 21
Total 63 32
InsurancefundsrepresentamountsprovidedbytheGroup’scaptiveinsurancesubsidiaryinrespectoftheexpectedlevelofinsuranceclaims.Theseprovisionsareexpectedtobeutilisedwithinfiveyears.
Thedeferredconsiderationprovisionrelatedtothedeferredpaymentsarisinguntiltheyearended31March2009fromthesucraloserealignmentin2004.PaymentsweremadetoMcNeilbasedontheachievementofcertainminimumtargetsinrespectofsalesofsucralosemadebytheGroup.TheGroupcontinuestoreceiveamountsfromMcNeilbasedonsalesofsucralosetabletopproductsmadebyMcNeilfortenyearsfromthedateoftherealignment.Thesereceiptswereshownupto31March2006asadeductionfromgoodwill.Sincetheeliminationofgoodwillthereceiptsarerecognisedintheincomestatementandonlyintheperiodsinwhichtheyareearned.Therewerenoreceiptsrecognisedintheincomestatementduringtheyear(2009–£9million).
Notes to the consolidated financial statements

Tate & Lyle Annual Report 2010 103
31 Provisionsforotherliabilitiesandcharges(continued)
RestructuringandclosureprovisionsprimarilyrelatetobusinessesandplantswhichhavebeenclosedandtoareorganisationasaresultofthedisposalofthefivestarchplantsinEurope.Itisexpectedthattheprovisionswillbefullyutilisedwithinthenextthreeyears.Theamountchargedtotheincomestatementincludes£55millioninrelationtothedecisiontomothballthesucralosemanufacturingfacilityinMcIntosh,Alabama.
Therewasnochargetotheincomestatementinrelationtotheunwindingofdiscounts(2009–£1million).
32 Changeinworkingcapital 31 March
2010 2009 £m £m
Decrease in inventories 113 113Decrease in receivables 126 47Increase/(decrease) in payables 84 (84)Decrease in derivative financial instruments (excluding debt-related derivatives) 8 6Decrease in provisions for other liabilities and charges (19) (34)Decrease in retirement benefit obligations (21) (17)
Decreaseinworkingcapital(continuingoperations) 291 31
Excludedfromthemovementinretirementbenefitobligationsisanactuariallossof£104million(2009–£71million).
33 Cashandcashequivalents 31 March
2010 2009 £m £m
Cash at bank and in hand 142 102Short-term bank deposits 362 332
Total 504 434
Theeffectiveinterestrateonshort-termdepositswas0.4%(2009–3.0%),withanaveragematurityof6days(2009–24days).
Thecarryingamountofcashandcashequivalentsaredenominatedinthefollowingcurrencies: 31 March
2010 2009 £m £m
Euro 136 161US dollar 322 235Sterling 2 4Other 44 34
Total 504 434
34 Netdebt
ThecomponentsoftheGroup’snetdebtareasfollows: 31 March
2010 2009 Notes £m £m
Non-current borrowings 28 (1119) (1 129)Current borrowings and overdrafts (note a) 28 (190) (523)Debt-related derivative instruments (note b) 20 (9) (13)Cash and cash equivalents 33 504 434
Netdebt (814) (1 231)
(a) Currentborrowingsandoverdraftsat31March2010doesnotincludeanyamounts(2009–£98million)inrespectofsecuritisedreceivables.
(b) Derivativefinancialinstrumentspresentedwithinassetsandliabilitiesinthestatementoffinancialpositionof£7millionnetassetcomprisenetdebt-relatedinstrumentsof£9millionliabilityandnetnon-debt-relatedinstrumentsof£16millionasset(2009–£93millionnetliabilitycomprisingnetdebt-relatedinstrumentsof£13millionliabilityandnetnon-debt-relatedinstrumentsof£80millionliability).
Sha
reho
lder
info
rmat
ion
Ove
rvie
wB
usin
ess
revi
ewG
over
nanc
eF
inan
cial
sta
tem
ents

104 Tate & Lyle Annual Report 2010
34 Netdebt(continued)
Netdebtisdenominatedinthefollowingcurrencies: 31 March
2010 2009 £m £m
Euro (161) (250)US dollar (620) (947)Sterling (60) (38)Other 27 4
Total (814) (1 231)
MovementsintheGroup’snetdebtareasfollows:
2010 2009 £m £m
At 1 April (1 231) (1 041)
Increase in cash and cash equivalents in the year 80 229Cash outflow from net decrease in borrowings 267 16Debt transferred on disposal of subsidiaries – 8Inception of finance leases – (1)Trade finance recognised as debt (16) (55)Fair value and other movements 7 (9)Exchange differences 79 (378)
Decrease/(increase) in net debt in the year 417 (190)
At31March (814) (1 231)
35 Contingentliabilities 31 March
2010 2009 £m £m
Guarantees of loans and overdrafts of joint ventures and associates – 9Trade guarantees 13 22
InadditiontotheabovewehaveguaranteedtheobligationsofcertainsubsidiariesandjointventurestoPaymentAgenciesinconnectionwithRestructuringAid.TheGroup’sshareoftheseguaranteesis£6million(2009–£66million).
OthertradeguaranteeshavebeengiveninthenormalcourseofbusinessbytheGroupatboth31March2010and31March2009.TheseareexcludedfromthefiguresgivenaboveandareinrespectofRevenueandCustomsandtheRuralPaymentsAgencyforAgriculturalProducebonds,ECGDrecourseagreements,lettersofcreditandtenderandperformancebonds.
TheGroupissubjecttoclaimsandlitigationgenerallyarisingintheordinarycourseofitsbusiness,someofwhichareforsubstantialamounts.AllsuchactionsarestrenuouslydefendedbutprovisionismadeforliabilitiesthatareconsideredlikelytoariseonthebasisofcurrentinformationandlegaladviceandaftertakingintoaccounttheGroup’sinsurancearrangements.
Whilethereisalwaysuncertaintyastotheoutcomeofanyclaimorlitigation,itisnotexpectedthatclaimsandlitigationexistingatthebalancesheetdatewillhaveamaterialadverseeffectontheGroup’sfinancialposition.
36 Commitments
Capitalcommitments 31 March
2010 2009 £m £m
Commitments for the acquisition of property, plant and equipment 8 29
Operating lease arrangementsOperatingleasepaymentsrepresentrentalspayablebytheGroupforcertainofitsland,buildings,plantandequipment.CertainoperatingleaseagreementsallowforrenewalattheendoftheoriginaltermattheoptionoftheGroup.
AtthebalancesheetdatetheGrouphasoutstandingcommitmentsundernon-cancellableoperatingleaseswhichfalldueasfollows:
31 March
2010 2009 £m £m
Within one year 31 34Later than one year and no later than five years 84 105After five years 80 98
Total 195 237
Notes to the consolidated financial statements

Tate & Lyle Annual Report 2010 105
37 Acquisitionsanddisposals
AcquisitionsDuringtheyearended31March2008,theGroupacquired80%oftheissuedsharecapitalofG.C.Hahn&Co.(Hahn)fromGeorgHahnFamilienGmbH(theHahnFamily).AstheGroupeffectivelybearsalltherisksandrewardsfor100%ofthisbusiness,nominorityinterestisrecognisedintheGroup’sfinancialstatements.
TheacquisitionagreementallowedfortheGrouptoacquiretheremaining20%oftheissuedsharecapitalofHahnpriorto1January2020throughputandcalloptions.Duringtheyearto31March2010aputoptionwasexercisedfor75%oftheremaining20%foratotalconsiderationof£21 millionwhichwaspaidbytheGroupon31March2010.TheGroupcanacquiretheremaining5%oftheissuedsharecapitalofHahnpriorto1January2020throughputandcalloptions.At31March2010deferredconsiderationof£7millionisrecognisedintradeandotherpayables(Note27).
Intheyearended31March2009,theGrouppaid£1millionofdeferredconsiderationrelatingtotheacquisitionofTate&LyleSouthAfricaintheyearended31March2005.Thepaymentrepresentedanadjustmenttothepurchasepriceandwasrecognisedasanadditiontogoodwillintheyear.
Disposals
International Sugar TradingIntheyearto31March2009,theGroupdisposedofitsinternationalSugarTradingbusinesstoBungeLimited(Bunge)fortotalconsideration,netofdisposalcostsof£57million.Followingagreementofcompletionadjustments,theGrouprepaid£26milliontoBungeduringtheyearto31 March2010.Asummaryofthedisposalisprovidedbelow: Year to 31 March
2010 2009 £m £m
Total consideration, net of costs (26) 57 Net assets disposed – (14)Trade and other payables repaid/(assumed) 26 (43)Other items, including risk transfer payments and fair value adjustments – (22)
Loss on disposal – (22)
Cash flows: Cash consideration, net of costs (26) 57
Cash (used in)/generated from disposals (26) 57
AnumberofminorityinterestsrelatingtotheinternationalSugarTradingbusinesswerenotincludedintheinitialsaleandarebeingaddressedseparatelyinaccordancewiththerelevantshareholders’agreements.TheGroupanticipatescompletionofdisposaloftheseminorityinterests,intheyearto31March2011.Theseminorityinterestsareclassifiedascurrentassetsheldforsaleinthestatementoffinancialpositionandarestatedat£18millionasat31March2010(2009–£28million).
Other DisposalsIntheyearended31March2009,theGroupdisposedofitsshareholdinginOrsanUKLtd,theholdingcompanyofitsChinesemonosodiumglutamatebusiness.Totalconsideration,netofprovisioninganddisposalcostswas£1millionandtheprofitondisposalwas£2million.Thecashimpactofthedisposalwasanoutflowof£4million.
Sha
reho
lder
info
rmat
ion
Ove
rvie
wB
usin
ess
revi
ewG
over
nanc
eF
inan
cial
sta
tem
ents
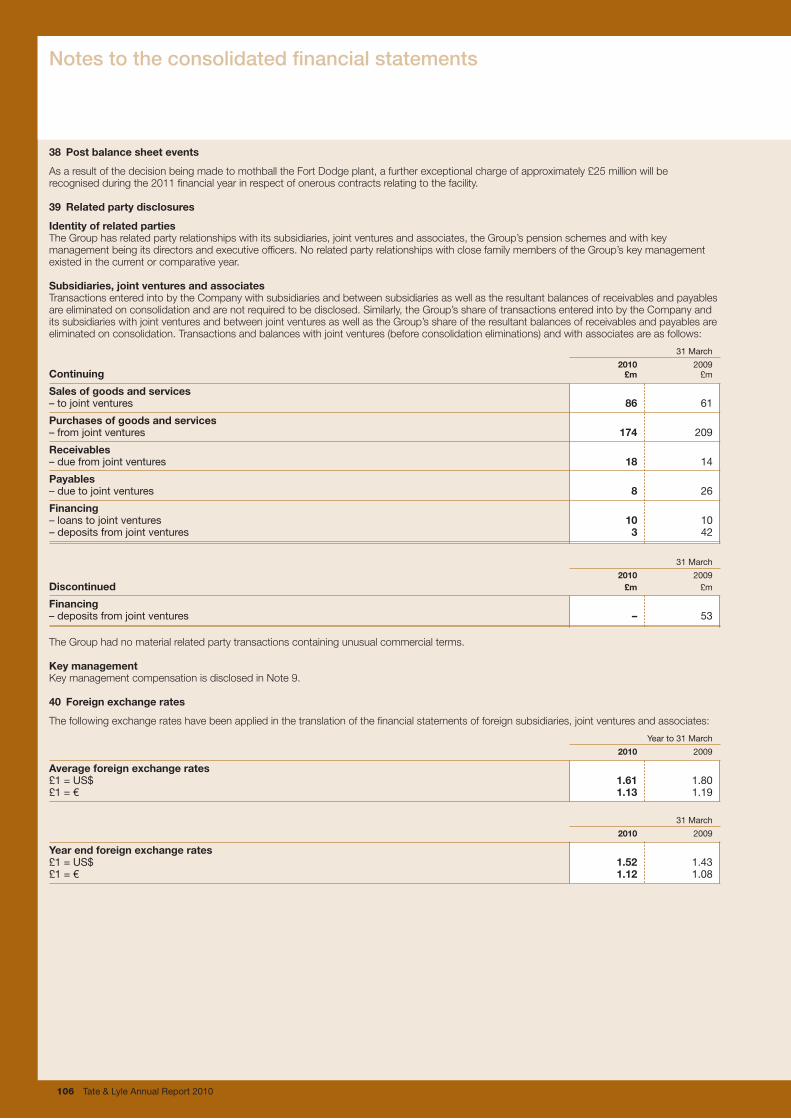
106 Tate & Lyle Annual Report 2010
38 Postbalancesheetevents
AsaresultofthedecisionbeingmadetomothballtheFortDodgeplant,afurtherexceptionalchargeofapproximately£25millionwillberecognisedduringthe2011financialyearinrespectofonerouscontractsrelatingtothefacility.
39 Relatedpartydisclosures
IdentityofrelatedpartiesTheGrouphasrelatedpartyrelationshipswithitssubsidiaries,jointventuresandassociates,theGroup’spensionschemesandwithkeymanagementbeingitsdirectorsandexecutiveofficers.NorelatedpartyrelationshipswithclosefamilymembersoftheGroup’skeymanagementexistedinthecurrentorcomparativeyear.
Subsidiaries,jointventuresandassociatesTransactionsenteredintobytheCompanywithsubsidiariesandbetweensubsidiariesaswellastheresultantbalancesofreceivablesandpayablesareeliminatedonconsolidationandarenotrequiredtobedisclosed.Similarly,theGroup’sshareoftransactionsenteredintobytheCompanyanditssubsidiarieswithjointventuresandbetweenjointventuresaswellastheGroup’sshareoftheresultantbalancesofreceivablesandpayablesareeliminatedonconsolidation.Transactionsandbalanceswithjointventures(beforeconsolidationeliminations)andwithassociatesareasfollows:
31 March
2010 2009Continuing £m £m
Salesofgoodsandservices– to joint ventures 86 61
Purchasesofgoodsandservices– from joint ventures 174 209
Receivables– due from joint ventures 18 14
Payables– due to joint ventures 8 26
Financing– loans to joint ventures 10 10– deposits from joint ventures 3 42
31 March
2010 2009Discontinued £m £m
Financing– deposits from joint ventures – 53
TheGrouphadnomaterialrelatedpartytransactionscontainingunusualcommercialterms.
KeymanagementKeymanagementcompensationisdisclosedinNote9.
40 Foreignexchangerates
Thefollowingexchangerateshavebeenappliedinthetranslationofthefinancialstatementsofforeignsubsidiaries,jointventuresandassociates:
Year to 31 March
2010 2009
Averageforeignexchangerates£1 = US$ 1.61 1.80£1 = € 1.13 1.19
31 March
2010 2009
Yearendforeignexchangerates£1 = US$ 1.52 1.43£1 = € 1.12 1.08
Notes to the consolidated financial statements

Tate & Lyle Annual Report 2010 107
41 Mainsubsidiariesandinvestments Percentage of equity attributable toSubsidiariesbasedintheUnitedKingdom1 Type of business Tate & Lyle PLC
G.C. Hahn & Co. Limited2 Blending 100Molasses Trading Company Limited Holding company 100Tate & Lyle Holdings Limited3 Holding company 100Tate & Lyle Industries Limited See below 100Tate & Lyle International Finance PLC3 In-house treasury company 100Tate & Lyle Investments Limited3 Holding company 100Tate & Lyle Investments (Gulf States) Limited Holding company 100Tate & Lyle LLC Holding company 100United Molasses (Ireland) Limited4 Molasses 50
1 RegisteredinEnglandandWales,exceptUnitedMolasses(Ireland)Limited,whichisregisteredinNorthernIrelandandTate&LyleLLCwhichisregisteredinDelaware,USA.2 TheGroupholds95%oftheissuedcapitalofHahnandhastherighttoacquiretheremaining5%throughputandcalloptions.Howeverduetothestructureoftheacquisition
agreement,theGroupeffectivelybearsalltherisksandrewardsfor100%ofthebusinessandthereforenominorityinterestisrecognised.3 DirectsubsidiariesofTate&LylePLC.4 Non-coterminousyearend.
MainoperatingunitsofTate&LyleIndustriesLimited Type of business
Tate & Lyle Sugars , Europe Sugar refiningTate & Lyle Molasses and Storage Molasses and bulk liquid storage
Subsidiariesoperatingoverseas Percentage of equity attributable toCountry of incorporation or registration Company Type of business Tate & Lyle PLC
Argentina Tate & Lyle Argentina SA Cereal sweeteners & starches, Sucralose distribution 100Australia G.C. Hahn & Co. (Australia) Pty. Ltd.2 Blending 100 Tate & Lyle ANZ Pty Sucralose distribution 100Belgium Tate & Lyle Molasses Belgium NV Molasses 100 Tate & Lyle Services Belgium NV Holding company 100Bermuda Tate & Lyle Management & Finance Limited Management & finance 100Brazil Tate & Lyle Brasil do SA¹ Citric acid, Sucralose distribution 100BritishVirginIslands Anglo Vietnam Sugar Investments Limited Holding company 75Chile Tate & Lyle Chile Commercial Ltda Cereal sweeteners & starches, Sucralose distribution 100China Tate & Lyle Trading (Shanghai) Limited Sucralose distribution 100France France Melasse SA1 Molasses 66.6 Société Européenne des Mélasses SA1 Holding company 66.6Germany Tate & Lyle Molasses Germany GmbH Molasses 100 G.C. Hahn & Co. Stabilisierungstechnik GmbH2 Blending 100 Cesalpinia Germany GmbH Blending 100Gibraltar Tate & Lyle Insurance (Gilbraltar) Limited Reinsurance 100HongKong Tate & Lyle Asia Limited Sucralose distribution 100Italy Tate & Lyle Molasses Italy SrL Molasses - Tate & Lyle Italia Spa Blending 100Israel Tate & Lyle Gadot Manufacturing Sugar refining 65 Tate & Lyle Israel Limited Sugar trading 100Mauritius The Mauritius Molasses Company Limited Molasses 66.7Mexico Continental Colloids Mexicana SA Blending 100 Mexama SA de CV Citric acid 65 Tate & Lyle Mexico SA de CV Holding company 100Morocco Tate & Lyle Morocco SA Cereal sweeteners & starches 100Mozambique Companhia Exportadora de Melaços Molasses 100Netherlands Tate & Lyle Biomaterials BV Bio-development 100 Tate & Lyle Molasses Holland BV Molasses 100 Tate & Lyle Holland BV Holding company 100 Tate & Lyle Netherlands BV Cereal sweetners & starches, Sucralose distribution 100 Nederlandse Glucose Industrie BV Holding company 100Norway Tate & Lyle Norge A/S Sugar distribution 100Portugal Alcântara Empreendimentos SGPS, SA¹ Holding company 100 Tate & Lyle Açucares Portugal, SA¹ Sugar refining 100 Tate & Lyle Molasses Portugal Ltda Molasses 100Singapore Tate & Lyle Singapore Pte Ltd High Intensity sweeteners 100SouthAfrica Tate & Lyle South Africa (Pty) Limited Blending 100Spain Tate & Lyle Molasses Spain SA Molasses 100Trinidad Caribbean Bulk Storage and Trading Company Limited¹ Molasses 100
Sha
reho
lder
info
rmat
ion
Ove
rvie
wB
usin
ess
revi
ewG
over
nanc
eF
inan
cial
sta
tem
ents
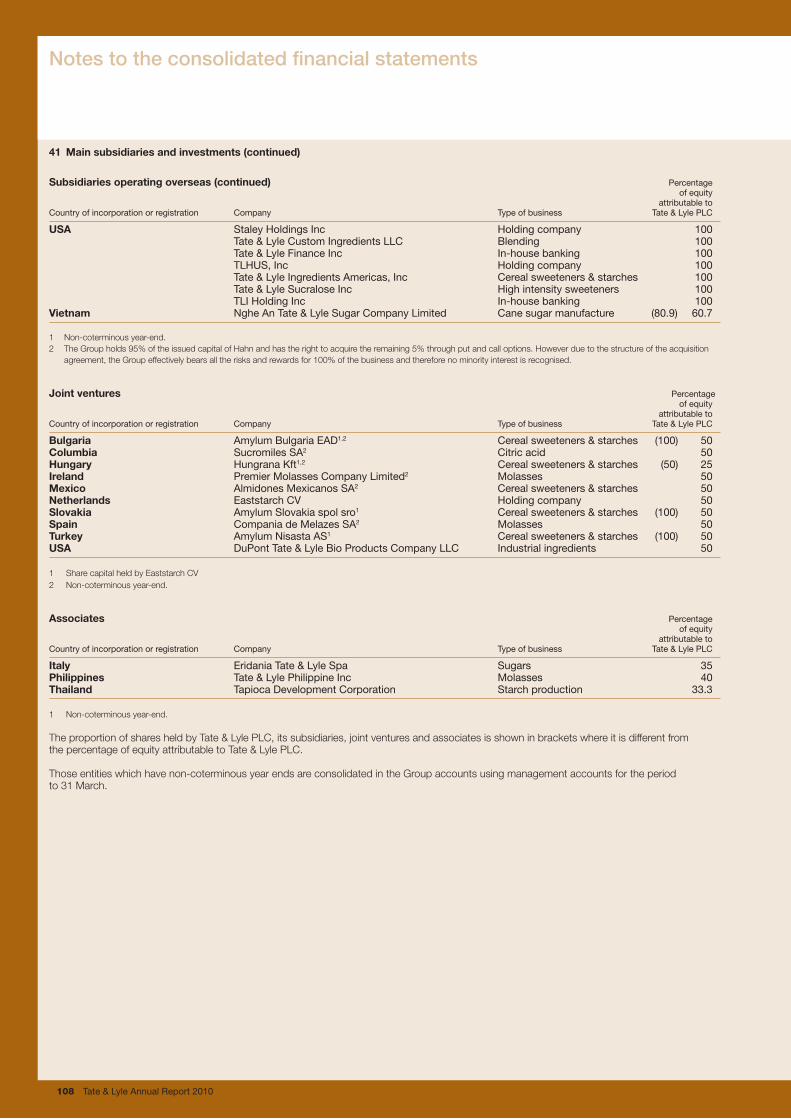
108 Tate & Lyle Annual Report 2010
41 Mainsubsidiariesandinvestments(continued)
Subsidiariesoperatingoverseas(continued) Percentage of equity attributable toCountry of incorporation or registration Company Type of business Tate & Lyle PLC
USA Staley Holdings Inc Holding company 100 Tate & Lyle Custom Ingredients LLC Blending 100 Tate & Lyle Finance Inc In-house banking 100 TLHUS, Inc Holding company 100 Tate & Lyle Ingredients Americas, Inc Cereal sweeteners & starches 100 Tate & Lyle Sucralose Inc High intensity sweeteners 100 TLI Holding Inc In-house banking 100Vietnam Nghe An Tate & Lyle Sugar Company Limited Cane sugar manufacture (80.9) 60.7
1 Non-coterminousyear-end.2 TheGroupholds95%oftheissuedcapitalofHahnandhastherighttoacquiretheremaining5%throughputandcalloptions.Howeverduetothestructureoftheacquisition
agreement,theGroupeffectivelybearsalltherisksandrewardsfor100%ofthebusinessandthereforenominorityinterestisrecognised.
Jointventures Percentage of equity attributable toCountry of incorporation or registration Company Type of business Tate & Lyle PLC
Bulgaria Amylum Bulgaria EAD1,2 Cereal sweeteners & starches (100) 50Columbia Sucromiles SA2 Citric acid 50Hungary Hungrana Kft1,2 Cereal sweeteners & starches (50) 25Ireland Premier Molasses Company Limited2 Molasses 50Mexico Almidones Mexicanos SA2 Cereal sweeteners & starches 50Netherlands Eaststarch CV Holding company 50Slovakia Amylum Slovakia spol sro1 Cereal sweeteners & starches (100) 50Spain Compania de Melazes SA2 Molasses 50Turkey Amylum Nisasta AS1 Cereal sweeteners & starches (100) 50USA DuPont Tate & Lyle Bio Products Company LLC Industrial ingredients 50
1 SharecapitalheldbyEaststarchCV2 Non-coterminousyear-end.
Associates Percentage of equity attributable toCountry of incorporation or registration Company Type of business Tate & Lyle PLC
Italy Eridania Tate & Lyle Spa Sugars 35Philippines Tate & Lyle Philippine Inc Molasses 40Thailand Tapioca Development Corporation Starch production 33.3
1 Non-coterminousyear-end.
TheproportionofsharesheldbyTate&LylePLC,itssubsidiaries,jointventuresandassociatesisshowninbracketswhereitisdifferentfromthepercentageofequityattributabletoTate&LylePLC.
Thoseentitieswhichhavenon-coterminousyearendsareconsolidatedintheGroupaccountsusingmanagementaccountsfortheperiodto31March.
Notes to the consolidated financial statements
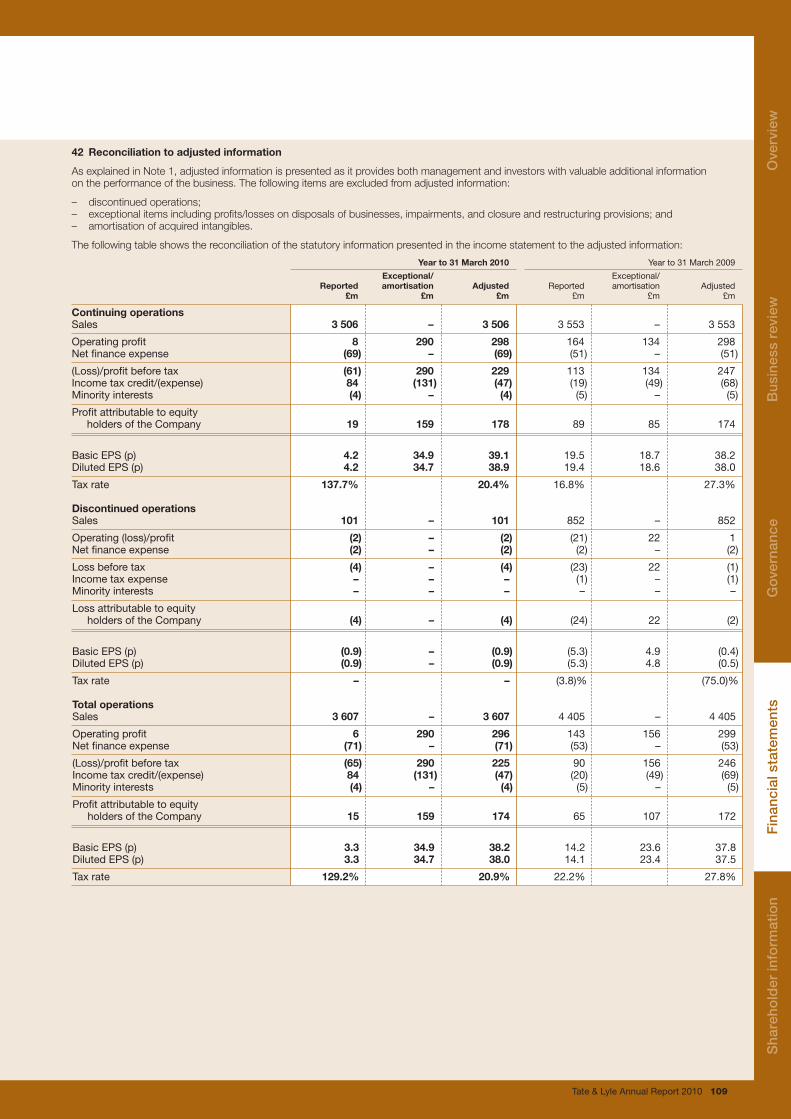
Tate & Lyle Annual Report 2010 109
42 Reconciliationtoadjustedinformation
AsexplainedinNote1,adjustedinformationispresentedasitprovidesbothmanagementandinvestorswithvaluableadditionalinformationontheperformanceofthebusiness.Thefollowingitemsareexcludedfromadjustedinformation:
– discontinuedoperations;– exceptionalitemsincludingprofits/lossesondisposalsofbusinesses,impairments,andclosureandrestructuringprovisions;and– amortisationofacquiredintangibles.
Thefollowingtableshowsthereconciliationofthestatutoryinformationpresentedintheincomestatementtotheadjustedinformation:
Yearto31March2010 Year to 31 March 2009 Exceptional/ Exceptional/ Reported amortisation Adjusted Reported amortisation Adjusted £m £m £m £m £m £m
ContinuingoperationsSales 3506 – 3506 3 553 – 3 553
Operating profit 8 290 298 164 134 298Net finance expense (69) – (69) (51) – (51)
(Loss)/profit before tax (61) 290 229 113 134 247Income tax credit/(expense) 84 (131) (47) (19) (49) (68)Minority interests (4) – (4) (5) – (5)
Profit attributable to equity holders of the Company 19 159 178 89 85 174
Basic EPS (p) 4.2 34.9 39.1 19.5 18.7 38.2 Diluted EPS (p) 4.2 34.7 38.9 19.4 18.6 38.0
Tax rate 137.7% 20.4% 16.8% 27.3%
DiscontinuedoperationsSales 101 – 101 852 – 852
Operating (loss)/profit (2) – (2) (21) 22 1Net finance expense (2) – (2) (2) – (2)
Loss before tax (4) – (4) (23) 22 (1) Income tax expense – – – (1) – (1)Minority interests – – – – – –
Loss attributable to equity holders of the Company (4) – (4) (24) 22 (2)
Basic EPS (p) (0.9) – (0.9) (5.3) 4.9 (0.4) Diluted EPS (p) (0.9) – (0.9) (5.3) 4.8 (0.5)
Tax rate – – (3.8)% (75.0)%
TotaloperationsSales 3607 – 3607 4 405 – 4 405
Operating profit 6 290 296 143 156 299Net finance expense (71) – (71) (53) – (53)
(Loss)/profit before tax (65) 290 225 90 156 246 Income tax credit/(expense) 84 (131) (47) (20) (49) (69)Minority interests (4) – (4) (5) – (5)
Profit attributable to equity holders of the Company 15 159 174 65 107 172
Basic EPS (p) 3.3 34.9 38.2 14.2 23.6 37.8Diluted EPS (p) 3.3 34.7 38.0 14.1 23.4 37.5
Tax rate 129.2% 20.9% 22.2% 27.8%
Sha
reho
lder
info
rmat
ion
Ove
rvie
wB
usin
ess
revi
ewG
over
nanc
eF
inan
cial
sta
tem
ents

110 Tate & Lyle Annual Report 2010
WehaveauditedtheParentcompanyfinancialstatementsofTate&LylePLCfortheyearended31March2010whichcomprisetheParentcompanybalancesheetandtheNotestotheParentcompanyfinancialstatements.ThefinancialreportingframeworkthathasbeenappliedintheirpreparationisapplicablelawandUnitedKingdomAccountingStandards(UnitedKingdomGenerallyAcceptedAccountingPractice).
RespectiveresponsibilitiesofdirectorsandauditorsAsexplainedmorefullyintheDirectors’statementofresponsibilitiessetoutonpage57,thedirectorsareresponsibleforthepreparationoftheParentcompanyfinancialstatementsandforbeingsatisfiedthattheygiveatrueandfairview.OurresponsibilityistoaudittheParentcompanyfinancialstatementsinaccordancewithapplicablelawandInternationalStandardsonAuditing(UKandIreland).ThosestandardsrequireustocomplywiththeAuditingPracticesBoard’sEthicalStandardsforAuditors.
Thisreport,includingtheopinions,hasbeenpreparedforandonlyforthecompany’smembersasabodyinaccordancewithChapter3ofPart16oftheCompaniesAct2006andfornootherpurpose.Wedonot,ingivingtheseopinions,acceptorassumeresponsibilityforanyotherpurposeortoanyotherpersontowhomthisreportisshownorintowhosehandsitmaycomesavewhereexpresslyagreedbyourpriorconsentinwriting.
ScopeoftheauditofthefinancialstatementsAnauditinvolvesobtainingevidenceabouttheamountsanddisclosuresinthefinancialstatementssufficienttogivereasonableassurancethatthefinancialstatementsarefreefrommaterialmisstatement,whethercausedbyfraudorerror.Thisincludesanassessmentof:whethertheaccountingpoliciesareappropriatetotheParentcompany’scircumstancesandhavebeenconsistentlyappliedandadequatelydisclosed;thereasonablenessofsignificantaccountingestimatesmadebythedirectors;andtheoverallpresentationofthefinancialstatements.
OpiniononfinancialstatementsInouropiniontheParentcompanyfinancialstatements:
n giveatrueandfairviewofthestateofthecompany’saffairsasat31March2010;
n havebeenproperlypreparedinaccordancewithUnitedKingdomGenerallyAcceptedAccountingPractice;and
n havebeenpreparedinaccordancewiththerequirementsoftheCompaniesAct2006.
OpiniononothermattersprescribedbytheCompaniesAct2006Inouropinion:
n thepartofthedirectors’remunerationreporttobeauditedhasbeenproperlypreparedinaccordancewiththeCompaniesAct2006;and
n theinformationgiveninthedirectors’reportforthefinancialyearforwhichtheParentcompanyfinancialstatementsarepreparedisconsistentwiththeParentcompanyfinancialstatements.
MattersonwhichwearerequiredtoreportbyexceptionWehavenothingtoreportinrespectofthefollowingmatterswheretheCompaniesAct2006requiresustoreporttoyouif,inouropinion:
n adequateaccountingrecordshavenotbeenkeptbytheParentcompany,orreturnsadequateforouraudithavenotbeenreceivedfrombranchesnotvisitedbyus;or
n theParentcompanyfinancialstatementsandthepartofthedirectors’remunerationreporttobeauditedarenotinagreementwiththeaccountingrecordsandreturns;or
n certaindisclosuresofdirectors’remunerationspecifiedbylawarenotmade;or
n wehavenotreceivedalltheinformationandexplanationswerequireforouraudit.
OthermatterWehavereportedseparatelyontheGroupfinancialstatementsofTate & LylePLCfortheyearended31March2010.
Paul Cragg(SeniorStatutoryAuditor)forandonbehalfofPricewaterhouseCoopers LLPCharteredAccountantsandStatutoryAuditors1EmbankmentPlaceLondonWC2N6RH26 May 2010Note:themaintenanceandintegrityoftheTate&LylePLCwebsiteistheresponsibilityofthedirectors;theworkcarriedoutbytheauditorsdoesnotinvolveconsiderationofthesemattersand,accordingly,theauditorsacceptnoresponsibilityforanychangesthatmayhaveoccurredtothefinancialstatementssincetheywereinitiallypresentedonthewebsite.
Independent Auditors’ Report to the Members of Tate & Lyle PLC: Parent company financial statements
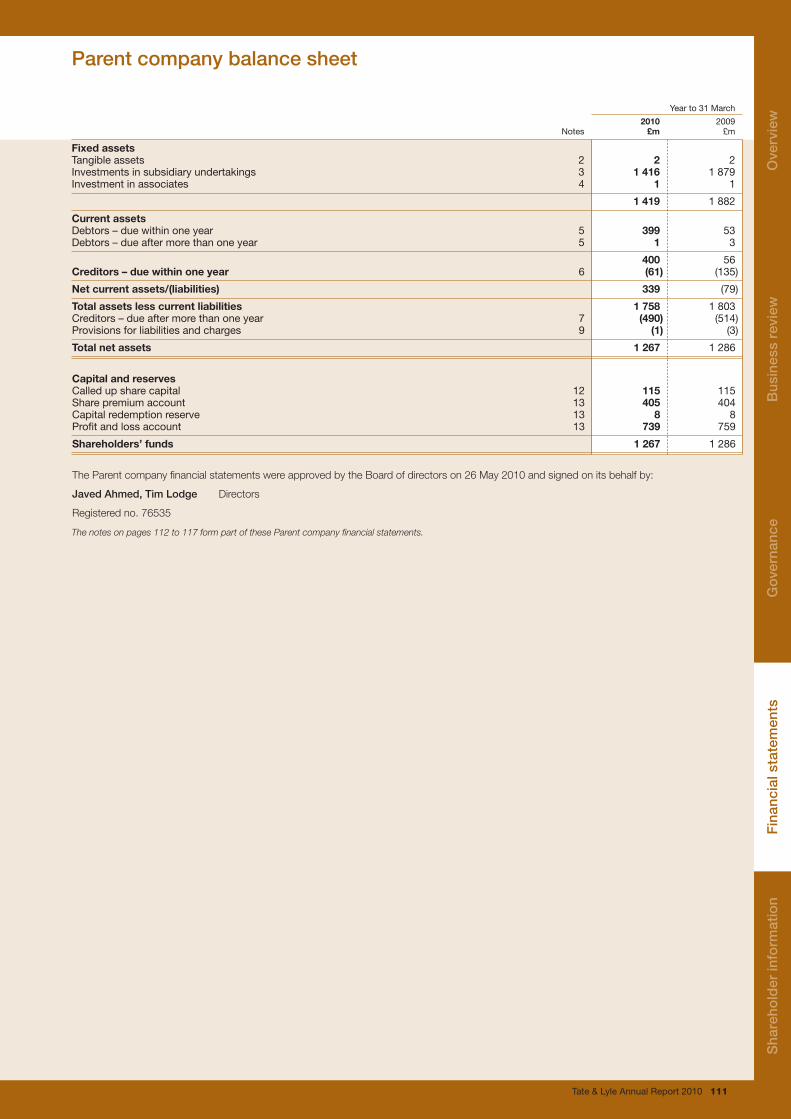
Tate & Lyle Annual Report 2010 111
Year to 31 March
2010 2009 Notes £m £m
FixedassetsTangible assets 2 2 2Investments in subsidiary undertakings 3 1416 1 879Investment in associates 4 1 1
1419 1 882
CurrentassetsDebtors – due within one year 5 399 53Debtors – due after more than one year 5 1 3
400 56Creditors–duewithinoneyear 6 (61) (135)
Netcurrentassets/(liabilities) 339 (79)
Totalassetslesscurrentliabilities 1758 1 803Creditors – due after more than one year 7 (490) (514)Provisions for liabilities and charges 9 (1) (3)
Totalnetassets 1267 1 286
CapitalandreservesCalled up share capital 12 115 115Share premium account 13 405 404Capital redemption reserve 13 8 8Profit and loss account 13 739 759
Shareholders’funds 1267 1 286
TheParentcompanyfinancialstatementswereapprovedbytheBoardofdirectorson26May2010andsignedonitsbehalfby:
Javed Ahmed, Tim Lodge Directors
Registeredno.76535
The notes on pages 112 to 117 form part of these Parent company financial statements.
Parent company balance sheet
Sha
reho
lder
info
rmat
ion
Ove
rvie
wB
usin
ess
revi
ewG
over
nanc
eF
inan
cial
sta
tem
ents
112 Tate & Lyle Annual Report 2010
1 Parentcompanyaccountingpolicies
Accounting basis TheParentcompanyfinancialstatementsarepreparedunderthehistoricalcostconventioninaccordancewiththeCompaniesAct2006andapplicableUKaccountingstandards.AspermittedbySection408(2)oftheCompaniesAct2006,theCompany’sprofitandlossaccountandstatementoftotalrecognisedgainsandlossesarenotpresentedinthesefinancialstatements.TheTate&LylePLCconsolidatedfinancialstatementsfortheyearended31March2010containaconsolidatedstatementofcashflows.ConsequentlytheCompanyhastakentheexemptionavailableinFRS1(Revised1996)Cash flow statements,andhasnotpresenteditsowncashflowstatement.
New UK standards and interpretations adoptedThefollowingnewstandards,amendmentsandinterpretationswereadoptedbytheCompanyintheyear.Adoptionhadnoeffectontheresults,financialpositionoftheCompanyoritsdisclosures.
– AmendmenttoFRS8Related Party Disclosures– AmendmenttoFRS20Share-based Payment – Vesting
conditionsandcancellations– UITFAbstract46Hedges of a Net Investment in a
Foreign Operation
New UK standards and interpretations not adoptedThefollowingamendmentstoFinancialReportingStandardshavebeenissuedbuthavenotbeenadoptedyetbytheCompany:
– AmendmenttoFRS25Financial Instruments: Presentation–Puttablefinancialinstrumentsandobligationsarisingonliquidation
– AmendmenttoFRS26Financial Instruments: Recognition and Measurement–Eligiblehedgeditems
– ImprovementstoFinancialReportingStandards– AmendmentstoFRS29Financial Instruments: Disclosures– AmendmenttoFRS20Share-based payment –Groupcash-
settledshare-basedpaymenttransactions
TheamendmentstoFRS25,FRS26andtheimprovementstoFinancialReportingStandardsareeffectivefortheCompanyinitsaccountingperiodbeginningon1April2010.
TheadoptionoftheseamendmentsisnotexpectedtohaveamaterialimpactontheCompany’sprofitfortheyearorequity.TheadoptionsmayaffectdisclosuresintheCompany’sfinancialstatements.
Tangible fixed assetsDepreciationisprovidedonastraight-linebasistowriteoffthecostoftangiblefixedassetsovertheirestimatedusefullife.Thetangiblefixedassetscompriseplantandmachineryandcomputersoftwarewhicharedepreciatedoveraperiodof3to28years.Impairmentreviewsareundertakenifthereareindicationsthatthecarryingvaluesmaynotberecoverable.
InvestmentsUnlesstheyarefinancedbyforeigncurrencyborrowingsanddesignatedasafairvaluehedgingrelationship,investmentsinsubsidiariesandassociatesareshownatcostlessamountswrittenoffwherethereisapermanentdiminutioninvalue.Investmentsinsharesinoverseasundertakingsthatarefinancedbyforeigncurrencyborrowingsanddesignatedasafairvaluehedgingrelationshipareretranslatedintopoundssterlingattheexchangeraterulingatthebalancesheetdateandtheresultingexchangegainsandlossesarerecognisedintheprofitandlossaccount.ExchangegainsandlossesontherelatedforeigncurrencyborrowingsarealsorecognisedintheprofitandlossaccountinaccordancewithFRS23The Effects of Changes in Foreign Exchange Rates.
AnundertakingisregardedasasubsidiaryundertakingiftheCompanyhascontroloveritsoperatingandfinancialpolicies.
AnundertakingisregardedasanassociateiftheCompanyholdsaparticipatinginterestandhassignificantinfluence,butnotcontrol,overitsoperatingandfinancialpolicies.SignificantinfluencegenerallyexistswheretheCompanyholdsmorethan20%andlessthan50%oftheshareholders’votingrights.
Allloansandreceivablestoandfromsubsidiaryundertakingsareshownatcostlessamountswrittenoffwheredeemedunrecoverable.
LeasesOperatingleasecostsarechargedtoprofitasincurred.
Research and developmentAllexpenditureonresearchanddevelopmentischargedtoprofitasincurred.
Notes to the Parent company financial statements

Tate & Lyle Annual Report 2010 113
1 Parentcompanyaccountingpolicies(continued)
Retirement benefitsTheCompanycontributestotheGrouppensionplanoperatedintheUK.DetailsoftheplanareincludedwithinNote30oftheGroupfinancialstatements.AspermittedunderFRS17RetirementBenefits,theplanisaccountedforasadefinedcontributionplan,astheemployercannotidentifyitsshareoftheunderlyingassetsandliabilitiesoftheplan.Theemployer’scontributionsrelatetothecurrentserviceperiodonlyandarechargedtotheincomestatementastheyareincurred.
Deferred taxDeferredtaxisrecognisedonafullprovisionbasisontimingdifferencesbetweentherecognitionofgainsandlossesintheaccountsandtheirrecognitionfortaxpurposesthathavearisenbutnotreversedatthebalancesheetdate.Deferredtaxisnotrecognisedonpermanentdifferencesorontimingdifferencesarisingonunremittedprofitsofoverseassubsidiaries.Deferredtaxassetsarerecognisedonlytotheextentthatitisconsideredmorelikelythannotthattherewillbesufficientfuturetaxableprofitstopermittaxreliefoftheunderlyingtimingdifferences.
Foreign currenciesAssetsandliabilitiesinforeigncurrenciesaretranslatedintopoundssterlingattheratesofexchangerulingonthelastdayofthefinancialperiod(theclosingrate).Profitsandlossesaretranslatedintopoundssterlingattheprevailingrateatthetimeoftransactionandcreditedorchargedtotheprofitandlossaccount.
Share-based compensationTheCompanyoperatesanumberofequity-settled,share-basedcompensationplans.DetailsoftheplansareincludedwithinNote26oftheGroupfinancialstatements.Thefairvalueofemployeeservicesreceivedinexchangeforthegrantoftheoptionsisrecognisedasanexpense.Thetotalamounttobeexpensedoverthevestingperiodisdeterminedbyreferencetothefairvalueoftheoptionsgranted,excludingtheimpactofanynon-marketvestingconditions(forexample,earningstargets).Non-marketvestingconditionsareincludedinassumptionsaboutthenumberofoptionsthatareexpectedtobecomeexercisable.Ateachbalancesheetdate,foroptionsgrantedwithnon-marketvestingconditions,theCompanyrevisesitsestimatesofthenumberofoptionsthatareexpectedtobecomeexercisable.Itrecognisestheimpactoftherevisionoforiginalestimates,ifany,intheprofitandlossaccount,andacorrespondingadjustmenttoequity.Theproceedsreceivednetofanydirectlyattributabletransactioncostsarecreditedtosharecapitalandsharepremiumwhentheoptionsareexercised.
Dividend distributionFinaldividenddistributionstotheCompany’sequityholdersarerecognisedasaliabilityintheGroup’sfinancialstatementsintheperiodinwhichthedividendsareapprovedbytheCompany’sshareholders,whileinterimdividenddistributionsarerecognisedintheperiodinwhichthedividendsaredeclaredandpaid.Whereascripalternativeisofferedandtaken,thedistributioniseffectedthroughanissueofbonussharesfromthesharepremiumaccount.
Share capitalOrdinarysharesareclassifiedasequity.Incrementalcostsdirectlyattributabletotheissueofnewsharesoroptionsareshowninequityasadeduction,netoftax,fromtheproceeds.
WhereanyGroupcompanypurchasestheCompany’sequitysharecapitalandholdsthatshareeitherdirectlyastreasurysharesorindirectlywithinanESOPtrust,theconsiderationpaid,includinganydirectlyattributableincrementalcosts(netofincometaxes),isdeductedfromequityattributabletotheCompany’sequityholdersuntilthesharesarecancelled,reissuedordisposedof.Wheresuchsharesaresubsequentlysoldorreissued,anyconsiderationreceived,netofanydirectlyattributableincrementaltransactioncostsandtherelatedincometaxeffects,isincludedinequityattributabletotheCompany’sequityholders.ThesesharesareusedtosatisfyshareoptionsgrantedtoemployeesundertheGroup’sshareoptionschemes.ThetrusteepurchasestheCompany’ssharesontheopenmarketusingloansmadebytheCompanyorotherloansguaranteedbytheCompany.
Sha
reho
lder
info
rmat
ion
Ove
rvie
wB
usin
ess
revi
ewG
over
nanc
eF
inan
cial
sta
tem
ents
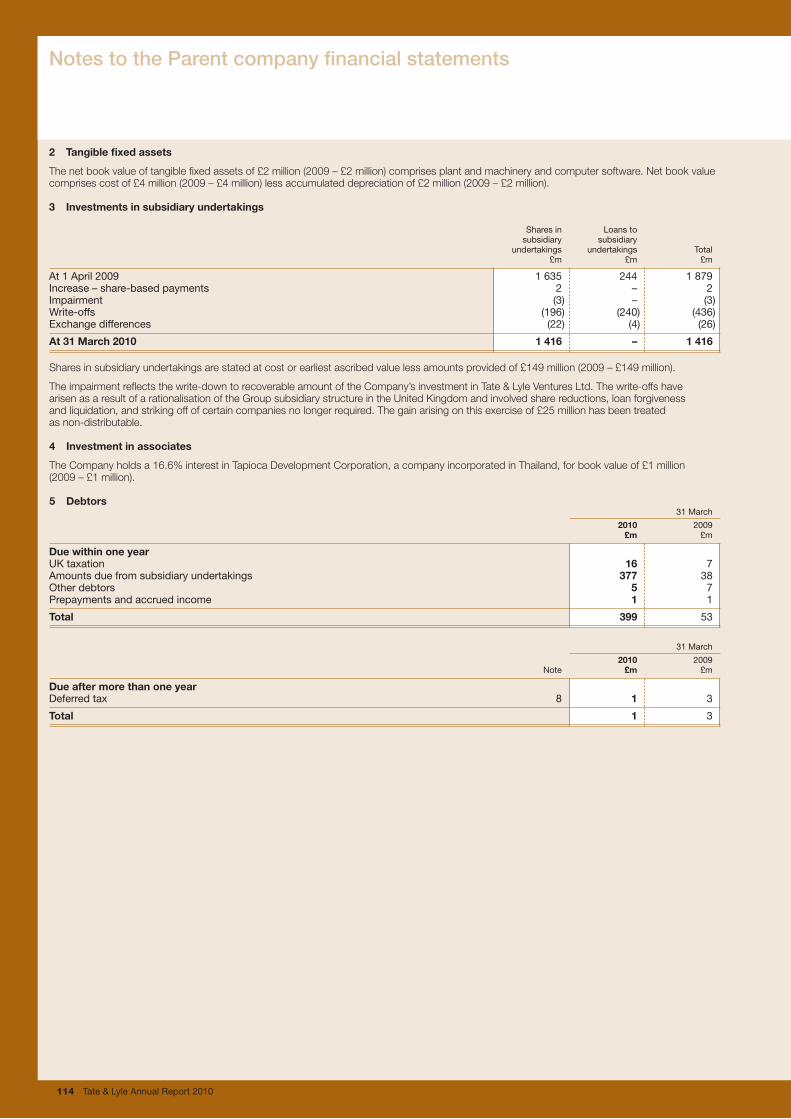
114 Tate & Lyle Annual Report 2010
Notes to the Parent company financial statements
2 Tangiblefixedassets
Thenetbookvalueoftangiblefixedassetsof£2million(2009–£2million)comprisesplantandmachineryandcomputersoftware.Netbookvaluecomprisescostof£4million(2009–£4million)lessaccumulateddepreciationof£2million(2009–£2million).
3 Investmentsinsubsidiaryundertakings
Shares in Loans to subsidiary subsidiary undertakings undertakings Total £m £m £m
At 1 April 2009 1 635 244 1 879Increase – share-based payments 2 – 2Impairment (3) – (3)Write-offs (196) (240) (436)Exchange differences (22) (4) (26)
At31March2010 1416 – 1416
Sharesinsubsidiaryundertakingsarestatedatcostorearliestascribedvaluelessamountsprovidedof£149million(2009–£149million).
Theimpairmentreflectsthewrite-downtorecoverableamountoftheCompany’sinvestmentinTate&LyleVenturesLtd.Thewrite-offshavearisenasaresultofarationalisationoftheGroupsubsidiarystructureintheUnitedKingdomandinvolvedsharereductions,loanforgivenessandliquidation,andstrikingoffofcertaincompaniesnolongerrequired.Thegainarisingonthisexerciseof£25millionhasbeentreatedasnon-distributable.
4 Investmentinassociates
TheCompanyholdsa16.6%interestinTapiocaDevelopmentCorporation,acompanyincorporatedinThailand,forbookvalueof£1 million(2009–£1million).
5 Debtors 31 March
2010 2009 £m £m
DuewithinoneyearUK taxation 16 7Amounts due from subsidiary undertakings 377 38Other debtors 5 7Prepayments and accrued income 1 1
Total 399 53
31 March
2010 2009 Note £m £m
DueaftermorethanoneyearDeferred tax 8 1 3
Total 1 3
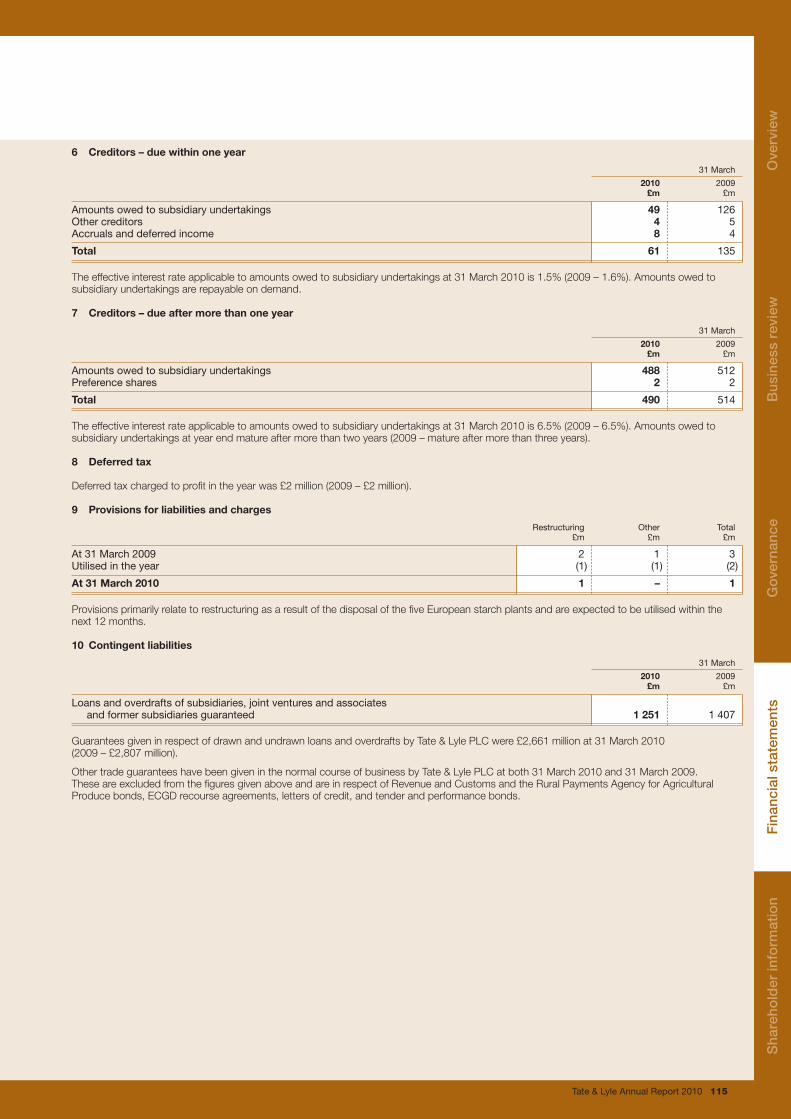
Tate & Lyle Annual Report 2010 115
6 Creditors–duewithinoneyear
31 March
2010 2009 £m £m
Amounts owed to subsidiary undertakings 49 126Other creditors 4 5Accruals and deferred income 8 4
Total 61 135
Theeffectiveinterestrateapplicabletoamountsowedtosubsidiaryundertakingsat31March2010is1.5%(2009–1.6%).Amountsowedtosubsidiaryundertakingsarerepayableondemand.
7 Creditors–dueaftermorethanoneyear
31 March
2010 2009 £m £m
Amounts owed to subsidiary undertakings 488 512Preference shares 2 2
Total 490 514
Theeffectiveinterestrateapplicabletoamountsowedtosubsidiaryundertakingsat31March2010is6.5%(2009–6.5%).Amountsowedtosubsidiaryundertakingsatyearendmatureaftermorethantwoyears(2009–matureaftermorethanthreeyears).
8 Deferredtax
Deferredtaxchargedtoprofitintheyearwas£2million(2009–£2million).
9 Provisionsforliabilitiesandcharges
Restructuring Other Total £m £m £m
At 31 March 2009 2 1 3Utilised in the year (1) (1) (2)
At31March2010 1 – 1
ProvisionsprimarilyrelatetorestructuringasaresultofthedisposalofthefiveEuropeanstarchplantsandareexpectedtobeutilisedwithinthenext12months.
10 Contingentliabilities
31 March
2010 2009 £m £m
Loans and overdrafts of subsidiaries, joint ventures and associates and former subsidiaries guaranteed 1251 1 407
GuaranteesgiveninrespectofdrawnandundrawnloansandoverdraftsbyTate&LylePLCwere£2,661millionat31March2010(2009–£2,807million).
OthertradeguaranteeshavebeengiveninthenormalcourseofbusinessbyTate&LylePLCatboth31March2010and31March2009.TheseareexcludedfromthefiguresgivenaboveandareinrespectofRevenueandCustomsandtheRuralPaymentsAgencyforAgriculturalProducebonds,ECGDrecourseagreements,lettersofcredit,andtenderandperformancebonds.
Sha
reho
lder
info
rmat
ion
Ove
rvie
wB
usin
ess
revi
ewG
over
nanc
eF
inan
cial
sta
tem
ents
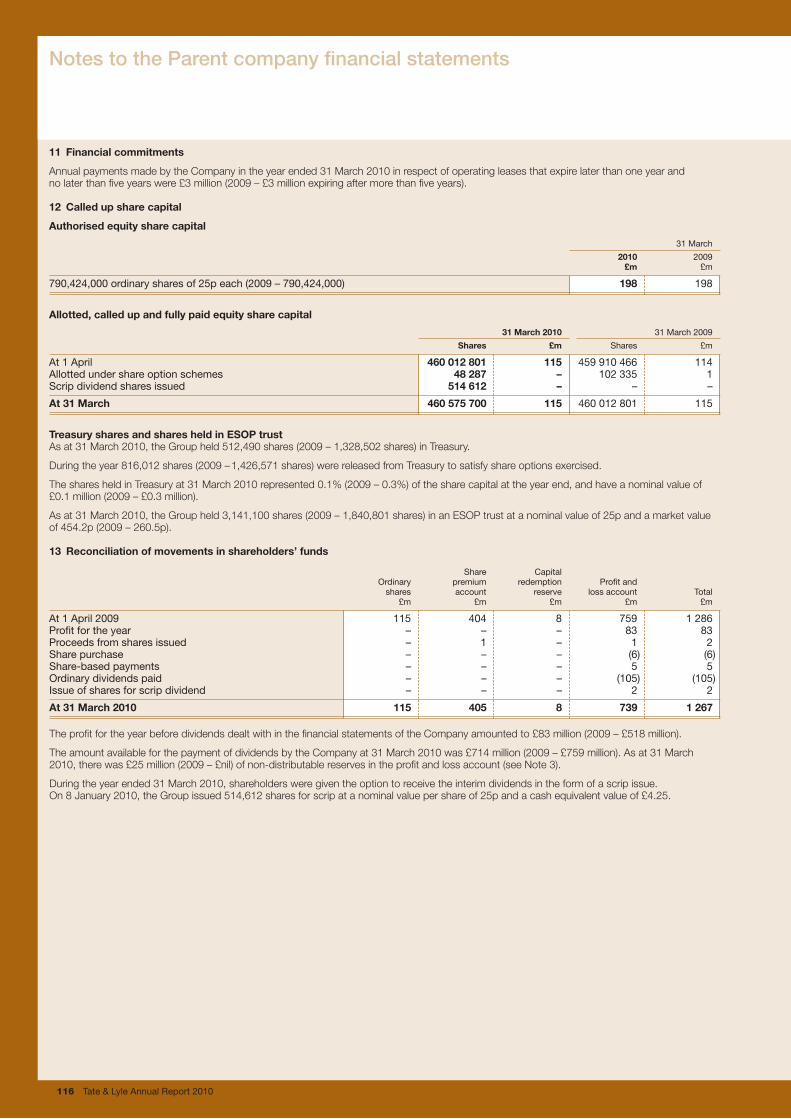
116 Tate & Lyle Annual Report 2010
Notes to the Parent company financial statements
11 Financialcommitments
AnnualpaymentsmadebytheCompanyintheyearended31March2010inrespectofoperatingleasesthatexpirelaterthanoneyearandnolaterthanfiveyearswere£3million(2009–£3millionexpiringaftermorethanfiveyears).
12 Calledupsharecapital
Authorisedequitysharecapital
31 March
2010 2009 £m £m
790,424,000 ordinary shares of 25p each (2009 – 790,424,000) 198 198
Allotted,calledupandfullypaidequitysharecapital
31March2010 31 March 2009
Shares £m Shares £m
At 1 April 460012801 115 459 910 466 114Allotted under share option schemes 48287 – 102 335 1Scrip dividend shares issued 514612 – – –
At31March 460575700 115 460 012 801 115
TreasurysharesandsharesheldinESOPtrustAsat31March2010,theGroupheld512,490shares(2009–1,328,502shares)inTreasury.
Duringtheyear816,012shares(2009–1,426,571shares)werereleasedfromTreasurytosatisfyshareoptionsexercised.
ThesharesheldinTreasuryat31March2010represented0.1%(2009–0.3%)ofthesharecapitalattheyearend,andhaveanominalvalueof£0.1 million(2009–£0.3million).
Asat31March2010,theGroupheld3,141,100shares(2009–1,840,801shares)inanESOPtrustatanominalvalueof25pandamarketvalueof454.2p(2009–260.5p).
13 Reconciliationofmovementsinshareholders’funds
Share Capital Ordinary premium redemption Profit and shares account reserve loss account Total £m £m £m £m £m
At 1 April 2009 115 404 8 759 1 286Profit for the year – – – 83 83Proceeds from shares issued – 1 – 1 2Share purchase – – – (6) (6)Share-based payments – – – 5 5Ordinary dividends paid – – – (105) (105)Issue of shares for scrip dividend – – – 2 2
At31March2010 115 405 8 739 1267
TheprofitfortheyearbeforedividendsdealtwithinthefinancialstatementsoftheCompanyamountedto£83million(2009–£518million).
TheamountavailableforthepaymentofdividendsbytheCompanyat31March2010was£714million(2009–£759million).Asat31March2010,therewas£25million(2009–£nil)ofnon-distributablereservesintheprofitandlossaccount(seeNote3).
Duringtheyearended31March2010,shareholdersweregiventheoptiontoreceivetheinterimdividendsintheformofascripissue.On8 January2010,theGroupissued514,612sharesforscripatanominalvaluepershareof25pandacashequivalentvalueof£4.25.

Tate & Lyle Annual Report 2010 117
14 Relatedparties
AspermittedbyFRS8Related Party Disclosures,disclosureofrelatedpartytransactionswithothercompaniescontrolledbyTate&LylePLCisnotprovidedandtherewerenoreportabletransactionswithotherrelatedparties.
15 Profitandlossaccountdisclosures
AspermittedbySection408(2)oftheCompaniesAct2006,theCompanyhasnotpresenteditsownprofitandlossaccount.
TheCompanyemployed94staffincludingdirectors(2009–90)andthetotalstaffcostsareshownbelow:
31 March
2010 2009 £m £m
Wages and salaries 11 11Social security 1 1Retirement benefits 1 1
Total 13 13
Directors’emolumentsdisclosuresareprovidedinthedirectors’remunerationreportonpages47to56ofthisannualreportandinNote9oftheGroupfinancialstatements.
16 Dividends
DetailsoftheCompany’sdividendsaresetoutinNote14oftheGroupfinancialstatements.
Find out more about Tate & Lyle at www.tateandlyle.com S
hare
hold
er in
form
atio
nO
verv
iew
Bus
ines
s re
view
Gov
erna
nce
Fin
anci
al s
tate
men
ts
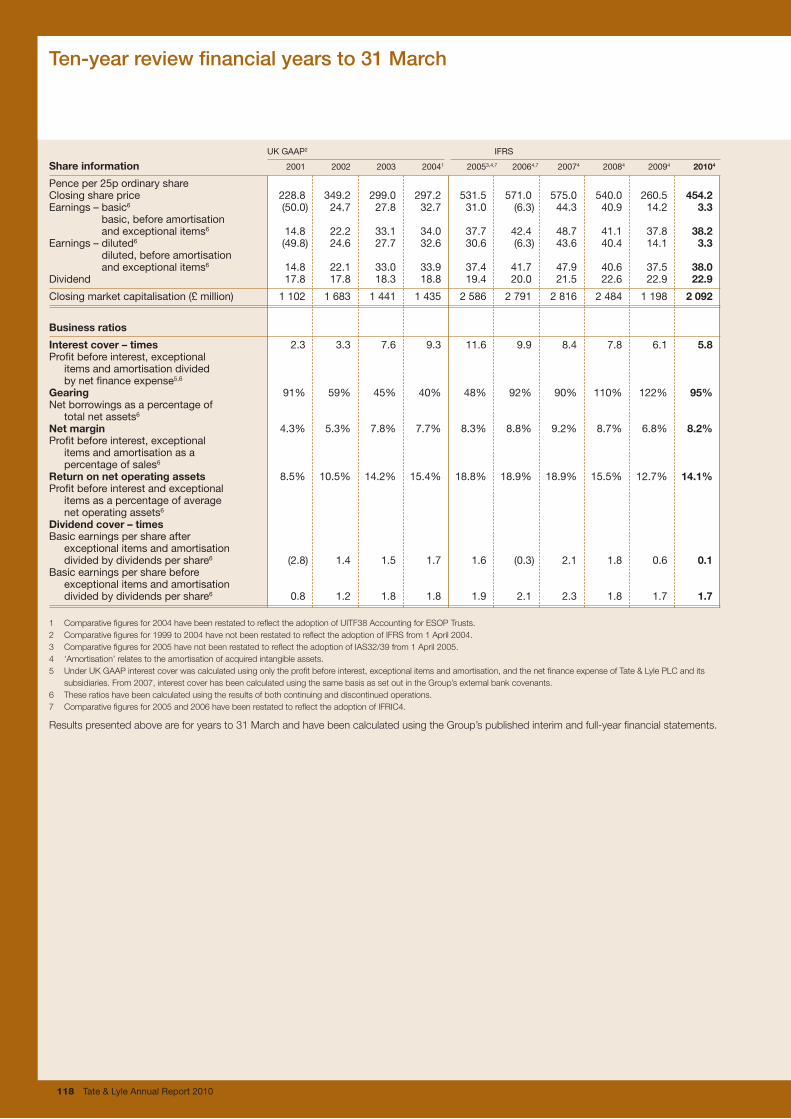
118 Tate & Lyle Annual Report 2010
Ten-year review financial years to 31 March
UK GAAP2 IFRS
Shareinformation 2001 2002 2003 20041 20053,4,7 20064,7 20074 20084 20094 20104
Pence per 25p ordinary shareClosing share price 228.8 349.2 299.0 297.2 531.5 571.0 575.0 540.0 260.5 454.2Earnings – basic6 (50.0) 24.7 27.8 32.7 31.0 (6.3) 44.3 40.9 14.2 3.3
basic, before amortisation and exceptional items6 14.8 22.2 33.1 34.0 37.7 42.4 48.7 41.1 37.8 38.2
Earnings – diluted6 (49.8) 24.6 27.7 32.6 30.6 (6.3) 43.6 40.4 14.1 3.3diluted, before amortisation and exceptional items6 14.8 22.1 33.0 33.9 37.4 41.7 47.9 40.6 37.5 38.0
Dividend 17.8 17.8 18.3 18.8 19.4 20.0 21.5 22.6 22.9 22.9
Closing market capitalisation (£ million) 1 102 1 683 1 441 1 435 2 586 2 791 2 816 2 484 1 198 2092
Businessratios
Interestcover–times 2.3 3.3 7.6 9.3 11.6 9.9 8.4 7.8 6.1 5.8Profit before interest, exceptional items and amortisation divided by net finance expense5,6
Gearing 91% 59% 45% 40% 48% 92% 90% 110% 122% 95%Net borrowings as a percentage of total net assets6
Netmargin 4.3% 5.3% 7.8% 7.7% 8.3% 8.8% 9.2% 8.7% 6.8% 8.2%Profit before interest, exceptional items and amortisation as a percentage of sales6
Returnonnetoperatingassets 8.5% 10.5% 14.2% 15.4% 18.8% 18.9% 18.9% 15.5% 12.7% 14.1%Profit before interest and exceptional items as a percentage of average net operating assets6
Dividendcover–timesBasic earnings per share after exceptional items and amortisation divided by dividends per share6 (2.8) 1.4 1.5 1.7 1.6 (0.3) 2.1 1.8 0.6 0.1Basic earnings per share before exceptional items and amortisation divided by dividends per share6 0.8 1.2 1.8 1.8 1.9 2.1 2.3 1.8 1.7 1.7
1 Comparativefiguresfor2004havebeenrestatedtoreflecttheadoptionofUITF38AccountingforESOPTrusts.2 Comparativefiguresfor1999to2004havenotbeenrestatedtoreflecttheadoptionofIFRSfrom1April2004.3 Comparativefiguresfor2005havenotbeenrestatedtoreflecttheadoptionofIAS32/39from1April2005.4 ‘Amortisation’relatestotheamortisationofacquiredintangibleassets.5 UnderUKGAAPinterestcoverwascalculatedusingonlytheprofitbeforeinterest,exceptionalitemsandamortisation,andthenetfinanceexpenseofTate&LylePLCandits
subsidiaries.From2007,interestcoverhasbeencalculatedusingthesamebasisassetoutintheGroup’sexternalbankcovenants.6 Theseratioshavebeencalculatedusingtheresultsofbothcontinuinganddiscontinuedoperations.7 Comparativefiguresfor2005and2006havebeenrestatedtoreflecttheadoptionofIFRIC4.
Resultspresentedaboveareforyearsto31MarchandhavebeencalculatedusingtheGroup’spublishedinterimandfull-yearfinancialstatements.
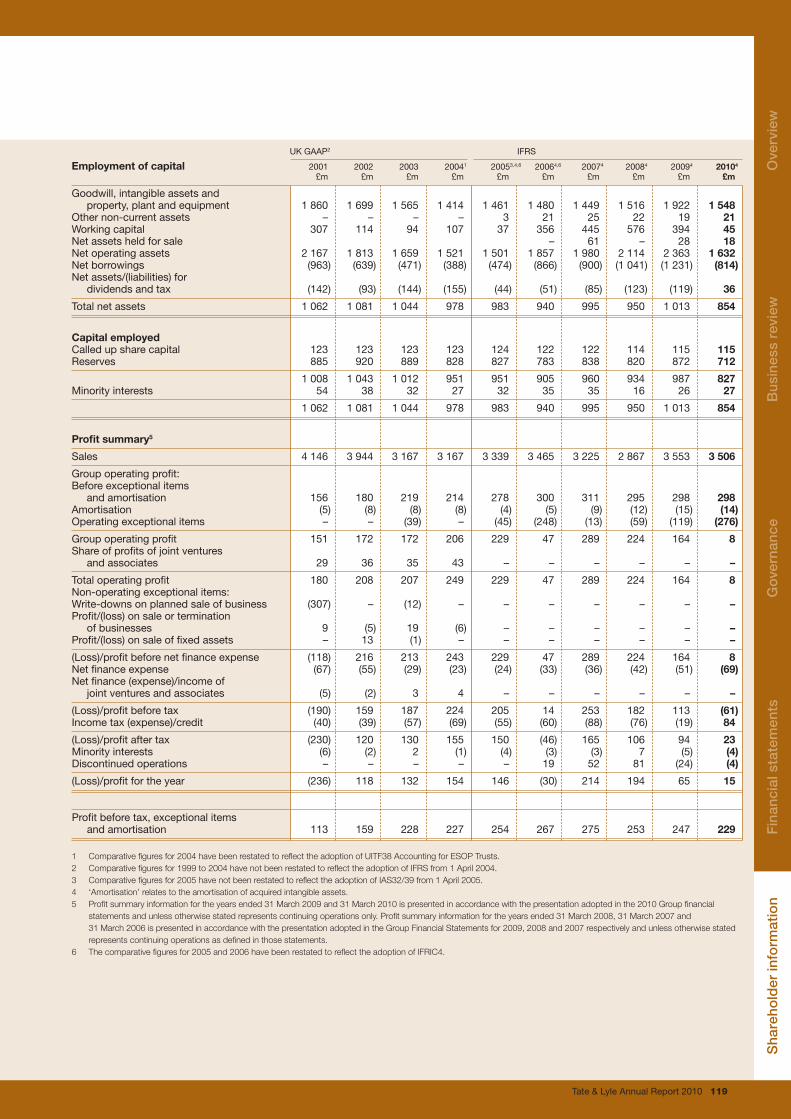
Tate & Lyle Annual Report 2010 119
UK GAAP2 IFRS
Employmentofcapital 2001 2002 2003 20041 20053,4,6 20064,6 20074 20084 20094 20104
£m £m £m £m £m £m £m £m £m £m
Goodwill, intangible assets and property, plant and equipment 1 860 1 699 1 565 1 414 1 461 1 480 1 449 1 516 1 922 1548Other non-current assets – – – – 3 21 25 22 19 21Working capital 307 114 94 107 37 356 445 576 394 45Net assets held for sale – 61 – 28 18Net operating assets 2 167 1 813 1 659 1 521 1 501 1 857 1 980 2 114 2 363 1632Net borrowings (963) (639) (471) (388) (474) (866) (900) (1 041) (1 231) (814)Net assets/(liabilities) for dividends and tax (142) (93) (144) (155) (44) (51) (85) (123) (119) 36
Total net assets 1 062 1 081 1 044 978 983 940 995 950 1 013 854
CapitalemployedCalled up share capital 123 123 123 123 124 122 122 114 115 115Reserves 885 920 889 828 827 783 838 820 872 712
1 008 1 043 1 012 951 951 905 960 934 987 827Minority interests 54 38 32 27 32 35 35 16 26 27
1 062 1 081 1 044 978 983 940 995 950 1 013 854
Profitsummary5
Sales 4 146 3 944 3 167 3 167 3 339 3 465 3 225 2 867 3 553 3506
Group operating profit: Before exceptional items and amortisation 156 180 219 214 278 300 311 295 298 298Amortisation (5) (8) (8) (8) (4) (5) (9) (12) (15) (14)Operating exceptional items – – (39) – (45) (248) (13) (59) (119) (276)
Group operating profit 151 172 172 206 229 47 289 224 164 8Share of profits of joint ventures and associates 29 36 35 43 – – – – – –
Total operating profit 180 208 207 249 229 47 289 224 164 8Non-operating exceptional items:Write-downs on planned sale of business (307) – (12) – – – – – – –Profit/(loss) on sale or termination of businesses 9 (5) 19 (6) – – – – – –Profit/(loss) on sale of fixed assets – 13 (1) – – – – – – –
(Loss)/profit before net finance expense (118) 216 213 243 229 47 289 224 164 8Net finance expense (67) (55) (29) (23) (24) (33) (36) (42) (51) (69)Net finance (expense)/income of joint ventures and associates (5) (2) 3 4 – – – – – –
(Loss)/profit before tax (190) 159 187 224 205 14 253 182 113 (61)Income tax (expense)/credit (40) (39) (57) (69) (55) (60) (88) (76) (19) 84
(Loss)/profit after tax (230) 120 130 155 150 (46) 165 106 94 23Minority interests (6) (2) 2 (1) (4) (3) (3) 7 (5) (4)Discontinued operations – – – – – 19 52 81 (24) (4)
(Loss)/profit for the year (236) 118 132 154 146 (30) 214 194 65 15
Profit before tax, exceptional items and amortisation 113 159 228 227 254 267 275 253 247 229
1 Comparativefiguresfor2004havebeenrestatedtoreflecttheadoptionofUITF38AccountingforESOPTrusts.2 Comparativefiguresfor1999to2004havenotbeenrestatedtoreflecttheadoptionofIFRSfrom1April2004.3 Comparativefiguresfor2005havenotbeenrestatedtoreflecttheadoptionofIAS32/39from1April2005.4 ‘Amortisation’relatestotheamortisationofacquiredintangibleassets.5 Profitsummaryinformationfortheyearsended31March2009and31March2010ispresentedinaccordancewiththepresentationadoptedinthe2010Groupfinancial
statementsandunlessotherwisestatedrepresentscontinuingoperationsonly.Profitsummaryinformationfortheyearsended31March2008,31March2007and31 March 2006ispresentedinaccordancewiththepresentationadoptedintheGroupFinancialStatementsfor2009,2008and2007respectivelyandunlessotherwisestatedrepresentscontinuingoperationsasdefinedinthosestatements.
6 Thecomparativefiguresfor2005and2006havebeenrestatedtoreflecttheadoptionofIFRIC4.
Ove
rvie
wB
usin
ess
revi
ewG
over
nanc
eF
inan
cial
sta
tem
ents
Sha
reho
lder
info
rmat
ion
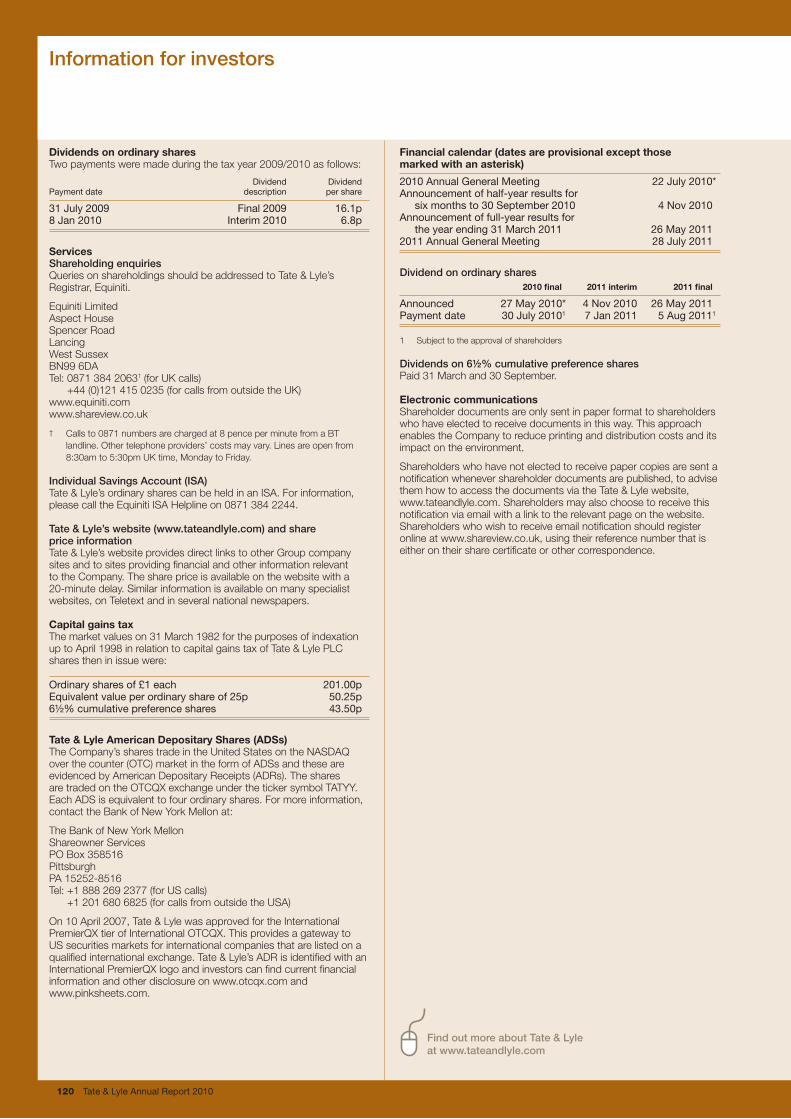
120 Tate & Lyle Annual Report 2010
Information for investors
DividendsonordinarysharesTwopaymentsweremadeduringthetaxyear2009/2010asfollows:
Dividend DividendPayment date description per share
31 July 2009 Final 2009 16.1p8 Jan 2010 Interim 2010 6.8p
ServicesShareholding enquiriesQueriesonshareholdingsshouldbeaddressedtoTate & Lyle’sRegistrar,Equiniti.
EquinitiLimitedAspectHouseSpencerRoadLancingWestSussexBN996DATel:08713842063†(forUKcalls)
+44(0)1214150235(forcallsfromoutsidetheUK)www.equiniti.comwww.shareview.co.uk
† Callsto0871numbersarechargedat8penceperminutefromaBTlandline.Othertelephoneproviders’costsmayvary.Linesareopenfrom8:30amto5:30pmUKtime,MondaytoFriday.
Individual Savings Account (ISA)Tate&Lyle’sordinarysharescanbeheldinanISA.Forinformation,pleasecalltheEquinitiISAHelplineon08713842244.
Tate & Lyle’s website (www.tateandlyle.com) and share price informationTate&Lyle’swebsiteprovidesdirectlinkstootherGroupcompanysitesandtositesprovidingfinancialandotherinformationrelevanttotheCompany.Thesharepriceisavailableonthewebsitewitha20-minutedelay.Similarinformationisavailableonmanyspecialistwebsites,onTeletextandinseveralnationalnewspapers.
CapitalgainstaxThemarketvalueson31March1982forthepurposesofindexationuptoApril1998inrelationtocapitalgainstaxofTate&LylePLCsharestheninissuewere:
Ordinary shares of £1 each 201.00pEquivalent value per ordinary share of 25p 50.25p6½% cumulative preference shares 43.50p
Tate&LyleAmericanDepositaryShares(ADSs)TheCompany’ssharestradeintheUnitedStatesontheNASDAQoverthecounter(OTC)marketintheformofADSsandtheseareevidencedbyAmericanDepositaryReceipts(ADRs).ThesharesaretradedontheOTCQXexchangeunderthetickersymbolTATYY.EachADSisequivalenttofourordinaryshares.Formoreinformation,contacttheBankofNewYorkMellonat:
TheBankofNewYorkMellonShareownerServicesPOBox358516PittsburghPA15252-8516Tel:+18882692377(forUScalls)
+12016806825(forcallsfromoutsidetheUSA)
On10April2007,Tate&LylewasapprovedfortheInternationalPremierQXtierofInternationalOTCQX.ThisprovidesagatewaytoUSsecuritiesmarketsforinternationalcompaniesthatarelistedonaqualifiedinternationalexchange.Tate&Lyle’sADRisidentifiedwithanInternationalPremierQXlogoandinvestorscanfindcurrentfinancialinformationandotherdisclosureonwww.otcqx.comandwww.pinksheets.com.
Financialcalendar(datesareprovisionalexceptthosemarkedwithanasterisk)
2010 Annual General Meeting 22 July 2010*Announcement of half-year results for six months to 30 September 2010 4 Nov 2010Announcement of full-year results for the year ending 31 March 2011 26 May 20112011 Annual General Meeting 28 July 2011
Dividend on ordinary shares 2010final 2011interim 2011final
Announced 27 May 2010* 4 Nov 2010 26 May 2011Payment date 30 July 20101 7 Jan 2011 5 Aug 20111
1 Subjecttotheapprovalofshareholders
Dividends on 6½% cumulative preference shares Paid31Marchand30September.
ElectroniccommunicationsShareholderdocumentsareonlysentinpaperformattoshareholderswhohaveelectedtoreceivedocumentsinthisway.ThisapproachenablestheCompanytoreduceprintinganddistributioncostsanditsimpactontheenvironment.
Shareholderswhohavenotelectedtoreceivepapercopiesaresentanotificationwhenevershareholderdocumentsarepublished,toadvisethemhowtoaccessthedocumentsviatheTate&Lylewebsite,www.tateandlyle.com.Shareholdersmayalsochoosetoreceivethisnotificationviaemailwithalinktotherelevantpageonthewebsite.Shareholderswhowishtoreceiveemailnotificationshouldregisteronlineatwww.shareview.co.uk,usingtheirreferencenumberthatiseitherontheirsharecertificateorothercorrespondence.
Find out more about Tate & Lyle at www.tateandlyle.com

Directors’ report Overview 1 Performance highlights 2 Chairman’s statement 3 Chief Executive’s review
Business review 8 What we do 18 Performance 18 Group financial results 21 Food & Industrial Ingredients, Americas 23 Food & Industrial Ingredients, Europe 24 Sugars 26 Sucralose 27 Other financial information 32 Corporate social responsibility
Governance 38 Board of directors 40 Executive management 41 Corporate governance 47 Directors’ remuneration report 56 Other statutory and governance information 57 Directors’ statement of responsibilities
Financial statements and other information
Financial statements 58 Independent Auditors’ Report to the
Members of Tate & Lyle PLC 59 Consolidated income statement 60 Consolidated statement of
comprehensive income 61 Consolidated statement of financial position 62 Consolidated statement of cash flows 63 Consolidated statement of changes in
shareholders’ equity 64 Notes to the consolidated financial statements 110 Parent company financial statements
Shareholder information 118 Ten-year review 120 Information for investors
A new way of reportingYou will notice that we have changed the way we report this year. The focus of this annual report is to fulfil our statutory obligations to report on the performance and prospects of the Company to our shareholders. For everything else you would like to know about Tate & Lyle, please go to our new website, www.tateandlyle.com.
www.tateandlyle.com
Contents
Tate & Lyle is a global provider of ingredients and solutions to the food, beverage and other industries. We transform raw materials into distinctive, high-quality ingredients for our customers which are consumed or used by millions of people every day.
Cautionary statementPlease read the full cautionary and non-reliance statements which can be found on page 121.
DefinitionsIn this report, ‘Company’ means Tate & Lyle PLC; ‘Tate & Lyle’ or ‘Group’ means Tate & Lyle PLC and its subsidiary and joint-venture companies.
TrademarksSPLENDA® and the SPLENDA® logo are trademarks of McNeil Nutritionals, LLC.
The DuPont Oval logo, DuPont™ and Sorona® are trademarks or registered trademarks of E. I. du Pont de Nemours and Company.
Primary and value added productsValue added products are those that utilise technology or intellectual property enabling our customers to produce distinctive products and Tate & Lyle to obtain a price premium and/or sustainable higher margins. Other products from our commodity corn milling and sugar businesses are classified as primary.
Basis of preparationUnless stated otherwise, the Group’s financial statements are prepared in accordance with International Financial Reporting Standards (IFRSs) as adopted by the EU. Information prior to 2005 is shown under Generally Accepted Accounting Practice in the UK (UK GAAP).
Adjusted operating profit and adjusted earnings per shareUnless stated otherwise, adjusted operating profit and adjusted earnings per share in this annual report and accounts exclude discontinued operations and are before exceptional items and amortisation of acquired intangible assets.
AmortisationUnless stated otherwise, the use of the word ‘amortisation’ on pages 1 to 57 in this annual report relates to the amortisation of acquired intangible assets.
Continuing operationsUnless stated otherwise, all comments in this annual report and accounts refer to the continuing operations adjusted to exclude exceptional items and amortisation of acquired intangible assets. A reconciliation of reported and adjusted information is included in Note 42 on page 109.
Non-reliance statementThis annual report and accounts has been prepared solely to provide additional information to shareholders to assess the Group’s strategy and the potential of that strategy to succeed and should not be relied upon by any other party or for any other purpose.
Cautionary statementThis annual report and accounts contains certain forward-looking statements with respect to the financial condition, results, operations and businesses of Tate & Lyle PLC. These statements and forecasts involve risk and uncertainty because they relate to events and depend upon circumstances that may occur in the future. There are a number of factors that could cause actual results or developments to differ materially from those expressed or implied by these forward-looking statements and forecasts. Nothing in this annual report and accounts should be construed as a profit forecast.
Tate & Lyle PLCTate & Lyle PLC is a public limited company listed on the London Stock Exchange and registered in England. This is the report and accounts for the year ended 31 March 2010. More information about Tate & Lyle can be found on our website at www.tateandlyle.com.
Environmental statementThis report is printed on ‘Look!’ paper and has been independently certified on behalf of the Forest Stewardship Council (FSC).
Printed at St Ives Westerham Press Ltd, ISO14001, FSC certified and CarbonNeutral®
Registered officeTate & Lyle PLCSugar Quay Lower Thames StreetLondon EC3R 6DQTel: +44 (0)20 7626 6525Fax: +44 (0)20 7623 5213Company number: 76535
www.tateandlyle.com
CreditsDesigned, typeset and produced bywww.berghindjoseph.com
Photography by David Rees
Tate & Lyle Annual Report 2010 121
Ove
rvie
wB
usin
ess
revi
ewG
over
nanc
eF
inan
cial
sta
tem
ents
Sha
reho
lder
info
rmat
ion

www.tateandlyle.com
Tate & Lyle A
nnual Rep
ort 2010
Annual Report 2010


