The Journal of Neuroscience, June 1, 1996, 76(11):3601-3619 Tau Is Enriched on Dynamic Microtubules in the Distal Region of Growing Axons Mark M. Black,’ Theresa Slaughter,’ Simon Moshiach,’ Maria Obrocka,* and ltzhak Fischer* 1 Department of Anatomy and Cell Biology, Temple University School of Medicine, Philadelphia, Pennsylvania 19 740, and *Department of Neurobiology and Anatomy, Medical College of Pennsylvania and Hahnemann University, Philadelphia, Pennsylvania 19 129 It is widely held that tau determines the stability of microtubules in growing axons, although direct evidence supporting this hypothesis is lacking. Previous studies have shown that the microtubule polymer in the distal axon and growth cone is the most dynamic of growing axons; it turns over more rapidly and is more sensitive to microtubule depolymerizing drugs than the polymer situated proximally. We reasoned that if the stability of axonal microtubules is directly related to their content of tau, then the polymer in the distal axon should have less tau than the polymer in the proximal axon. We tested this proposition by measuring the relative tau content of microtubules along grow- ing axons of cultured sympathetic neurons immunostained for tau and tubulin. Our results show that the tau content of microtubules varies along the axon, but in the opposite way predicted. Specifically, the relative tau content of microtubules increases progressively along the axon to reach a peak near the growth cone that is severalfold greater than that observed proximally. Thus, tau is most enriched on the most dynamic polymer of the axon. We also show that the gradient in tau content of microtubules does not generate corresponding gra- dients in the extent of tubulin assembly or in the sensitivity of axonal microtubules to nocodazole. On the basis of these findings, we propose that tau in growing axons has functions other than promoting microtubule assembly and stability and that key sites for these functions are the distal axon and growth cone. Key words: microtubule-associated proteins; cytoskeleton; axon growth; quantitative digital image analysis; cultured sym- pathetic neurons Tau is a developmentally regulated microtubule-associated pro- tein (MAP). Tau is encoded by a single gene, but because of alternative splicing and phosphorylation, it shows multiple iso- forms (for review, see Wiche et al., 1991). During neuronal differentiation tau undergoes a transition from immature to ma- ture forms that involves a dramatic increase in the number of isoforms (for review, see Schoenfeld and Obar, 1994). A role for tau in axon growth was initially suggested by studies that demon- strated a temporal correlation between the expression of tau, microtubule (MT) assembly, and axon extension (Drubin et al., 1985). More recently, studies that have altered tau expression either upward or downward have reinforced the view that tau participates in axon growth. Specifically, suppressing tau expres- sion can prevent axon growth, whereas overexpressing tau can promote the elaboration of neurite-like processes that contain arrays of parallel MTs in cells that normally do not elaborate such processes (for review, see Hirokawa, 1994). Although the importance of tau in axon growth is well estab- lished, its specific functions are unknown. Because tau binds MTs, its functions presumably involve, at least in part, binding to MTs. On the basis of its ability to promote MT assembly and stability in vitro, tau has been proposed to promote MT assembly and stabi- lization in growing axons (Brandt and Lee, 1993; see also refer- Rcccivcd Feb. 8, 1YYh; rcviscd March 5, 1996; accepted March 6, 1996. This work was supported by National Institutes of Health Grants NS17681 (M.M.B.) and NS24275 and NS24707 (I.F.). We thank Jonathan Fischer for his skilled technical assistancewith comwtcr analvses of gel images. Correspondence should be addr&sed to dr. Mari M. Biack, Department of Anatomy and Cell Biology, Temple University School of Medicine, 3400 North Broad S&et, Philadelphia; PA 19140. Copyright 0 1996Society for Neuroscience 0270.6474/96/1636(X-19$05.00/O ences therein). However, most studies on tau function have used tau purified from adult brain. This tau is very different from tau in developing neurons, and some of the differences influence the ability of tau to bind and stabilize MTs. For example, the MT binding domain of tau in developing neurons consists of three MT binding repeats whereas adult tau has four repeats. Experiments using recombinant tau have shown that three-repeat tau is a relatively weak stabilizer of MTs whereas four-repeat tau is a potent stabilizer (Goode and Feinstein, 1994; Trinczek et al., 1995). Furthermore, tau in developing neurons is subject to phos- phorylation events that substantially reduce its assembly promot- ing activity (Bramblett et al., 1993). These findings question whether tau functions to promote MT assembly or stability in developing axons. Several recent observations have shown that the stability of MTs varies along the length of growing axons. Specifically, the polymer located distally near the growth cone turns over more rapidly and is more sensitive to treatments with MT depolymer- izing drugs than the polymer situated elsewhere in the axon (Lim et al., 1989; Brown et al., 1992; Ahmad et al., 1993; Baas et al., 1993; Edson et al., 1993; Li and Black, 1996). This naturally occurring spatial variation in the stability properties of MTs in growing axons must reflect a corresponding variation in the fac- tors that promote MT stability. If tau is a significant MT stabilizer in growing axons, then the polymer in the proximal axon will contain more tau than the polymer in the distal axon. We have used quantitative immunofluorescence procedures to test this prediction. Our results show that the tau content of MTs varies along the axon, but in a manner that is opposite to that expected on the basis of the hypothesis that tau promotes MT stability.
Transcript
The Journal of Neuroscience, June 1, 1996, 76(11):3601-3619
Tau Is Enriched on Dynamic Microtubules in the Distal Region of Growing Axons
Mark M. Black,’ Theresa Slaughter,’ Simon Moshiach,’ Maria Obrocka,* and ltzhak Fischer*
1 Department of Anatomy and Cell Biology, Temple University School of Medicine, Philadelphia, Pennsylvania 19 7 40, and *Department of Neurobiology and Anatomy, Medical College of Pennsylvania and Hahnemann University, Philadelphia, Pennsylvania 19 129
It is widely held that tau determines the stability of microtubules in growing axons, although direct evidence supporting this hypothesis is lacking. Previous studies have shown that the microtubule polymer in the distal axon and growth cone is the most dynamic of growing axons; it turns over more rapidly and is more sensitive to microtubule depolymerizing drugs than the polymer situated proximally. We reasoned that if the stability of axonal microtubules is directly related to their content of tau, then the polymer in the distal axon should have less tau than the polymer in the proximal axon. We tested this proposition by measuring the relative tau content of microtubules along grow- ing axons of cultured sympathetic neurons immunostained for tau and tubulin. Our results show that the tau content of microtubules varies along the axon, but in the opposite way predicted. Specifically, the relative tau content of microtubules
increases progressively along the axon to reach a peak near the growth cone that is severalfold greater than that observed proximally. Thus, tau is most enriched on the most dynamic polymer of the axon. We also show that the gradient in tau content of microtubules does not generate corresponding gra- dients in the extent of tubulin assembly or in the sensitivity of axonal microtubules to nocodazole. On the basis of these findings, we propose that tau in growing axons has functions other than promoting microtubule assembly and stability and that key sites for these functions are the distal axon and growth cone.
Tau is a developmentally regulated microtubule-associated pro- tein (MAP). Tau is encoded by a single gene, but because of alternative splicing and phosphorylation, it shows multiple iso- forms (for review, see Wiche et al., 1991). During neuronal differentiation tau undergoes a transition from immature to ma- ture forms that involves a dramatic increase in the number of isoforms (for review, see Schoenfeld and Obar, 1994). A role for tau in axon growth was initially suggested by studies that demon- strated a temporal correlation between the expression of tau, microtubule (MT) assembly, and axon extension (Drubin et al., 1985). More recently, studies that have altered tau expression either upward or downward have reinforced the view that tau participates in axon growth. Specifically, suppressing tau expres- sion can prevent axon growth, whereas overexpressing tau can promote the elaboration of neurite-like processes that contain arrays of parallel MTs in cells that normally do not elaborate such processes (for review, see Hirokawa, 1994).
Although the importance of tau in axon growth is well estab- lished, its specific functions are unknown. Because tau binds MTs, its functions presumably involve, at least in part, binding to MTs. On the basis of its ability to promote MT assembly and stability in vitro, tau has been proposed to promote MT assembly and stabi- lization in growing axons (Brandt and Lee, 1993; see also refer-
Rcccivcd Feb. 8, 1YYh; rcviscd March 5, 1996; accepted March 6, 1996. This work was supported by National Institutes of Health Grants NS17681
(M.M.B.) and NS24275 and NS24707 (I.F.). We thank Jonathan Fischer for his skilled technical assistance with comwtcr analvses of gel images.
Correspondence should be addr&sed to dr. Mari M. Biack, Department of Anatomy and Cell Biology, Temple University School of Medicine, 3400 North Broad S&et, Philadelphia; PA 19140. Copyright 0 1996 Society for Neuroscience 0270.6474/96/1636(X-19$05.00/O
ences therein). However, most studies on tau function have used tau purified from adult brain. This tau is very different from tau in developing neurons, and some of the differences influence the ability of tau to bind and stabilize MTs. For example, the MT binding domain of tau in developing neurons consists of three MT binding repeats whereas adult tau has four repeats. Experiments using recombinant tau have shown that three-repeat tau is a relatively weak stabilizer of MTs whereas four-repeat tau is a potent stabilizer (Goode and Feinstein, 1994; Trinczek et al., 1995). Furthermore, tau in developing neurons is subject to phos- phorylation events that substantially reduce its assembly promot- ing activity (Bramblett et al., 1993). These findings question whether tau functions to promote MT assembly or stability in developing axons.
Several recent observations have shown that the stability of MTs varies along the length of growing axons. Specifically, the polymer located distally near the growth cone turns over more rapidly and is more sensitive to treatments with MT depolymer- izing drugs than the polymer situated elsewhere in the axon (Lim et al., 1989; Brown et al., 1992; Ahmad et al., 1993; Baas et al., 1993; Edson et al., 1993; Li and Black, 1996). This naturally occurring spatial variation in the stability properties of MTs in growing axons must reflect a corresponding variation in the fac- tors that promote MT stability. If tau is a significant MT stabilizer in growing axons, then the polymer in the proximal axon will contain more tau than the polymer in the distal axon. We have used quantitative immunofluorescence procedures to test this prediction. Our results show that the tau content of MTs varies along the axon, but in a manner that is opposite to that expected on the basis of the hypothesis that tau promotes MT stability.
3602 J. Neurosci., June 1, 1996, 76(11):3601-3619 Black et al. . Tau in Growing Axons
MATERIALS AND METHODS Materials. Culture media were obtained from Gibco (Grand Island, NY). Supplements for culture media were obtained from either Gibco or Sigma (St. Louis, MO), except for NGF, which was purified from mouse salivary glands according to Mobley et al. (1976). Nocodazole was obtained from Aldrich (Milwaukee, WI), and other reagents were obtained from Sigma unless otherwise indicated.
Cell culture. All experiments reported here used rat sympathetic neu- rons dissociated from the SCGs of newborn pups as described by Black and Kurdyla (1983). For immunostaining analyses, neurons were plated at relatively low density onto glass coverslips coated with polylysine and laminin (obtained from Collaborative Biomedical Products, Bedford, MA) as described previously (Brown et al., 1992; Black et al., 1994). All of the studies presented here were performed on cultures that varied between 17 and 25 hr in age from the time of plating. By this time, most of the neurons had extended one or more axons but no dendrites; typical axons ranged in length from -300 to -700 Frn. For biochemical analyses, neurons were plated onto plastic dishes coated with polylysine and laminin as described above except that the medium was supplemented with 3% FCS (HyClone, Logan, UT). Cells were plated at a density of 2 ganglia per dish and used the following day. At this time, the cultures consisted principally of neurons that had elaborated relatively long, branched axons.
Preparation of polyclonal antibodies aguinst tuu. Two polyclonal anti- bodies against tau were prepared against fusion protein constructs con- taining discrete regions near the N terminus or C terminus of the protein (see Fig. 1.4). Two cDNA clones encoding the N- and C-terminal ends of tau were prepared by RT-PCR using two sets of primers dcsigncd on the basis of the sequence of the high molecular weight isoform of rat tau (Goedert et al., 1992), with the addition of restriction sites (BarnHI and EcoRI) for directional cloning. The 5TA and 5TB primers (scnsc and antisense sequences from the 5’ end of the tau cDNA) spanned the N terminus at aa 2-113, whereas the 3TA and 3TB primers (sense and antisense sequences from the 3’ end of the tau cDNA) spanned the C terminus at aa 616-686. RNA was prepared from adult rat brain (Chom- cynski and Sacchi, 1987), and the corresponding cDNA was reversed transcribed using either oligo(dT) or random hexamer primers. The cDNA and the two sets of primers were used for PCR amplification to obtain the corresponding products of tau. The N-terminal fragment of tau (336 bp encoding 112 aa) was designated tau-5’, whereas the C-terminal fragment (210 bp encoding 70 aa) was designated tau-3’. The PCR oroducts were digested with Ban~H1 and EcoRI and subcloned into the pGEX-2T expresgion vector (Pharmacia, Piscataway, NJ). This vector has the glutathione S-transferase (GST) gene fusion system that can be induced by IPTG. The GST-tau fusion proteins containing the recombi- nant fragments of tau protein were expressed in Escherichia coli and then affinity-purified using glutathioneeSepharose. Rabbits were injected with 200-500 pg of the recombinant tau fusion protein using complete Freund’s adjuvant followed by three booster injections of 100 pg of protein in incomplete Freund’s adjuvant. Specificity of the resulting antibodies for tau was confirmed by immunoblotting against extracts from brain (see Fig. 1).
Fixation and extraction of neurons. Cultured neurons were processed for immunofluorescence localization of tubulin and tau according to one of the following four procedures. For procedure 1, cells were rinsed once with PBS, once with PHEM (60 mM PIPES, 25 mM HEPES, 10 mrvt EGTA, 2 mM M&I,, pH 6.9; Schliwa and van Blerkom, 1981), and then simultaneously fixedand extracted by incubation with PHEM containing 0.2% (w/v) saponin (Sigma), 4.0% paraformaldehyde (EM Sciences, Gibbstown, NJ), and 0.1% glutaraldehyde (Polysciences, Warrington, PA) for 10 min. After fixation, the cells were rinsed with PBS and then uermeabihzed bv incubation with 0.1% Triton X-100 (in PBS) for 2 min. ‘For procedure 2: cells were fixed without extraction by incubation in 4.0% paraformaldehyde and 0.1% glutaraldehyde in PBS. After fixation, the cells were rinsed with PBS and then permeabilized by incubation with 0.1% Triton X-100 (in PBS) for 2 min. Procedure 3 was the combined tixation and extraction procedure described by Lee and Rook (1992). Cells were rinsed once with PBS and once with PEM (80 mM PIPES, 5 mM EGTA, I mM MgCl,, pH 6.8) and then incubated with PEM con- taining 0.5% (w/v) NP-40 and 0.3% glutaraldehyde for 10 min. After fixation, the cells were rinsed with PBS and then further permeabilized by incubation with 0.5% Triton X-100 in PBS for 10 min. Procedure 4 involved fixation without extraction in PEM containing 0.3% glutaralde- hyde for 10 min. After fixation, the cells were rinsed with PBS and then permeabilized by incubation with 0.5% Triton X-100 (in PBS) for 15 min.
For some experiments, cells were extracted before fixation using con- ditions that stabilize existing MTs and remove unassembled tubulin. Neurons were rinsed once with PBS, once with PHEM or PEM, and then extracted at room temperature for 2 min in PHEM or PEM containing 0.2% saponin and 10 PM taxol (a gift from Ms. Nancita Lomax of the National Cancer Institute); variations from this basic protocol are de- scribed in Results. Tax01 was made as a 10 mtvt stock solution in DMSO, and appropriate volumes were added to the extraction buffer immediately before use. The extraction solution also contained a mixture of protease inhibitors (0.5 mM PMSF, 0.2 trypsin inhibitory units/ml aprotinin, and 10 pg/ml each leupeptin, chymostatin, and antipain). After extraction, the cells were tixed using procedure 1, 3, or 4 as described above.
After fixation and permeabilization, the dishes were rinsed with PBS, treated with sodium borohydride (10 mgiml in PBS for 7 min), incubated with 0.1 M glycine in PBS for 20 min, rinsed with PBS again, and then incubated with blocking solution for 30 min. Blocking solution consisted of either 4% normal donkey serum in PBS or 1% nonfat dry milk + 0.1% Tween-20 in PBS. The cells were then double-stained to reveal tau and tubulin (see below). All antibodies were diluted in blocking solution and then clarified before use by centrifugation at 200,000 X g for 10 min in a Beckman TL-100 ultracentrifuge (Beckman Instruments, Palo Alto, CA). After incubation with secondary antibody, cells wcrc rinsed extensively with PBS and then mounted in 80% (w/v) glycerol in PBS containing 10 mg/ml n-propyl gallale.
Immtmofluorescence procedures. Cells were double-stained for tubulin and tau using one of the following conditions. Staining condition I: cells wcrc incubated first with a mouse monoclonal anti-P-tubulin antibody [purchased from Amcrsham (Arlington Heights, IL; Blosc ct al., 19841 for 45 min at 37°C rinsed twice with blocking solution, and then incubated with one of the rabbit polyclonal antibodies against tau (most cxperi- mcnts used the antibody against the N-terminal region, tau-5’) for 2 hr at room temperature; the polyclonal antibodies were typically used at a dilution of l:lOOO, although similar results were obtained with dilutions ranging from 1:200 to 1:3000. After extensive rinsing with PBS and then reblocking, cells were incubated simultaneously with FITC-conjugated goat anti-mouse antibody, at a dilution of l:lOO, and lissamine-conjugated donkey anti-rabbit antibody, at a dilution of 1:lOO. All secondary anti- bodies were purchased from Jackson Immunoresearch Laboratories (West Grove, PA, AffiniPure grade, preadsorbed for minimum cross- reactivity). In some experiments, cells were double-stained for /3-tubulin and either MT-associated protein 2 (MAP2) or MT-associated protein lb (MAPlb). These experiments used the same protocol described for staining condition 1 but used either a polyclonal antibody against MAPlb (Black et al., 1994) or MAP2 (Fischer and Romano-Clarke, 1991) in place of the polyclonal antibody against tau. Staining condition 2: cells were incubated with a rabbit polyclonal antibody against tau overnight at 4°C rinsed with blocking solution, and then incubated with the monoclonal anti-P-tubulin antibody for 2 hr at 37°C. After extensive rinsing with PBS and then reblocking, the cells were incubated with secondary antibodies as described above. Staining condition 3: cells were double-stained for tubulin and tau using mouse monoclonal antibodies against tau and a rabbit polyclonal antibody against tyrosinated a-tubulin (diluted 1:400, generously provided by Dr. Chloe Bulinski, Columbia University School of Medicine, New York, NY) (Gundersen et al., 1984). Cells were first incubated with the anti-tubulin antibody for 45 min at 37°C. rinsed with blocking solution, and then incubated with a cocktail of mouse monoclo- nal antibodies against tau consisting of taul, taul4, and tau60 for 2 hr at room temperature (tau14 and tau60 were generously provided by Dr. Virginia Lee, Department of Pathology, University of Pennsylvania, Philadelphia, PA; taul was generously provided by Dr. Lester Binder, Northwestern University Medical School, Chicago, IL). After extensive rinsing and reblocking, the cells were incubated simultaneously with FITC-conjugated donkey anti-rabbit antibody and lissamine-conjugated donkey anti-mouse antibody, both diluted 1:lOO.
For some experiments, the rabbit polyclonal antibody against the N-terminal region of tau (tau-5’) was preincubated with boiled MAPS prepared from brains of newborn rat pups. MTs were assembled from a high-speed supernate of the brains using taxol, and then the MAPS were isolated from the MTs using NaCl extraction followed by incubation at 100°C for 5 min (Vallee, 1982; Peng et al., 1985). For preadsorption experiments, the polyclonal antibody was incubated with either the MAP preparation or the NaCl-containing buffer used to extract MAPS from MTs for 15 min at room temperature, clarified by centrifugation, and then used for immunostaining as described above.
Image acquisition and analysis. Neurons were observed by epifuores-
Black et al. l Tau in Growing Axons J. Neurosci., June 1, 1996, 16(11):3601-3619 3603
A tau cDNA 5’
tau protein
recombinant protein
antibodies
STA 5TB
,-y-l - - -
336 bp
4a exon 3TA 3TB ++
3’
210 bp
2 113
I I
112aa
A A 616 686
tau-5’
B
HMW tau +
LMW tau
C
71 aa
tall-3’
D
Figure 1. Characterization of polyclonal antibodies against tau.A shows a schematic of the tau cDNA, the primers used for RT-PCR, and the constructs used to prepare fusion proteins for use in antibody production. The sequences of the primers, from 5’ to 3’, are as follows: primer 5TA, CTC GGA TCC GCT GAA CCC CCC CAG GAG ‘ITT; primer 5TB, CTC GAA TIC CTT GAG TCA CAT GCC CAG CAG C; primer 3TA, CTC GGA TX GAA ACC CAC AAG CTG ACC; primer 3TB, CTC GAA TIC ACA AAC CCT GCT TGG CCA A. B-D show portions of blots of soluble extracts of immature rat brain, adult rat brain, and cultured sympathetic neurons (lanes 1, 2, and 3, respectively) probed by the tau-3’ polyclonal (B), taul + tau49 monoclonal (C), and tau-5’ polyclonal (0) antibodies against tau; -10-30 yg of each type of type was applied to the gels. The polyclonal and monoclonal antibodies recognize the same set of bands in each type of sample.
cence microscopy using a Zeiss Axiovert 135 inverted microscope (Zeiss, Thornwood, NY), and images were obtained with a CH250 cooled CCD camera (Photometrics Ltd., Tucson, AZ) equipped with a Thompson 7883 CCD chip. The details of the imaging system have been described previously (Brown et al., 1992; Black et al., 1994; Li and Black, 1996). Images were acquired using the full usable area of the CCD chip, which measured 382 X 576 pixels, and stored in full 1Zbit format on magneto-
optical disks using Pinnacle optical disk drives (Pinnacle Micro, Irvine, CA). Before capturing a series of images, an instantaneous readout of the bias voltage offset on the chip was saved and subsequently subtracted from each exposed image. Dark current (0.133 ADU/sec) was not signif- icant for the exposure times used in these studies. The magnification of the CCD images was calibrated using a stage micrometer. For maximum precision, all measurements of fluorescence intensity (see below) were
3604 J. Neurosci., June 1, 1996, 16(11):3601-3619 Black et al. . Tau in Growing Axons
performed on the 12.bit images. For presentation, images were scaled to 8 bits.
To evaluate the overall distribution of tubulin and tau in growing axons, cells were imaged using a 25X10.8 N.A. plan neofluar oil- immersion objective to capture the entire length of the axons in single images. To examine MT staining for tubulin and tau at higher resolution, cells were imaged with a 100X11.3 N.A. plan neofluar oil-immersion objective. We used the segmented mask procedure to quantify the inten- sity of tubulin and tau staining along the length of individual axons (Brown et al., 1992). For these analyses, we selected axons with relatively simple morphology, having no more than one branch point. Briefly, the P-tubulin image was used to generate a mask of the axon that extended from the cell body to the tip of the axon. The mask was divided into consecutive -6.4~pm-long segments beginning at the cell body-axon transition and continuing to the axon tip; the growth cone was contained in the most distal one or two segments. The segmented mask was then overlaid on the original fluorescent images depicting the distribution of tau and P-tubulin. This allowed us to define segments in the fluorescent images that corresponded to the segments in the mask. To correct for background fluoresccncc in each image, an average background pixel intensity was calculated for each segment and then subtracted from each pixel within that segment. Then, the total fluorescence intensity for the segments in each image was calculated by summing the corrected inten- sities of the pixels comprising each segment. The fluorcsccncc intensity of each segment, measured as arbitrary analog-to-digital units (ADU), was then plotted against distance along the axon (see Figs. 6, I I). These procedures have been incorporated into a single intcractivc application program written in the Oncor Imaging programming language. A synop- sis of these proccdurcs is prcscnted in Brown et al. (1992), and a more detailed description will be provided on rcqucst.
Meusurements of uxonul volume. Measurements of volume along the length of axons were based on P-tubulin stained images of cells fixed without extraction (according to procedure 4) and double-stained for P-tubulin and tau. Briefly, the segmented mask procedure, in addition to measuring fluorescence intensity for each axon segment also provides a measure of the area of each segment in pixels. Each segment is approx- imately rectangular in shape, with a length that is specified by the user as part of the analysis. We calculated the width of each segment based on its specified length and measured area, converted the value for the width from pixels into micrometers, and then, assuming that the axon is cylin- drical in shape, used the width of each segment as a measure of its diameter to compute segment volume. We chose a cylindrical model because cross sections of axons of cultured neurons have a circular contour (Black et al., 1984). This model is adequate for most of the axon, except at branch points and at the growth cone. The axons that we studied branched minimally along their length, and the growth cone was con- tained in the most distal one or two segments of the axon. We have not corrected our volume determinations for segments containing branch points or the growth cone for deviations from a cylindrical shape. The resulting volume measurements were used to generate plots of volume as a function of position along the axon and to normalize the fluorescence intensity for P-tubulin and tau along the axon to axon volume (see Results and Fig. 7).
Preparation of extracts of cultuwd neurons for biochemical analyses. Total tau as well as tau in cytoskeletal and soluble fractions of cultured neurons were prepared for analysis by immunoblotting. For total tau, whole-cell SDS extracts were prepared by scraping cultured neurons into 1% SDS plus a cocktail of protease inhibitors that included 0.2 trypsin inhibitory units/ml of aprotinin and 10 &ml each leupeptin, chymostatin, and antipain, and 0.5 mM PMSF. The extracts were incubated at 100°C for 5 min and then clarified by ccntrifugation in the TL100.2 rotor (Beckman Instruments) at 75,000 rpm for 15 min at 22°C.
To prepare soluble and cytoskeletal fractions from cultures, cultures were rinsed once with PBS, once with PHEM or PEM, and then scraped into PHEM or PEM supplemented with 0.2% Triton X-100 or 0.2% saponin, respectively, IO FM taxol, and protease inhibitors (all buffers were at room temperature). Soluble and cytoskeletal fractions were obtained by ccntrifugation of cell extracts at 75,000 rpm for 10 min at 22°C in the TL100.2 rotor. The soluble fraction was removed and its protein precipitated by the addition of -8 volumes of cold methanol. The resulting methanol-precipitated material was collected by centrifugation, air-dried, dissolved in 1% SDS, and then incubated at 100°C for 5 min. The cytoskeletal pellet was rinsed once with PHEM or PEM + 10 FM
taxol and then dissolved directly in 1% SDS, and then incubated at 100°C
for 5 min. The resulting materials were then analyzed by SDS-PAGE and immunoblotting.
SDS-PAGE and immunoblotting Protein samples were resolved in 4-10% SDS-PAGE gels and then transferred onto nitrocellulose mem- branes (1000 mA for 3 hr at 4°C). The transfers were then incubated with primary antibodies followed by HRP-conjugated secondary antibodies and detection by chemiluminescence using ECL reagents (Amersham). The antibodies against the recombinant tau fragments (tau-3’ and tau-5’) were used at l:lOO,OOO, the monoclonal antibodies against tau (a cocktail consisting of taul and tau49) were used at a dilution of 1:4000 and secondary antibodies at 1:4000. Quantification of immunoreactivity was performed using the ONE-DSCAN software package (Scanalytics, Bil- lerica, MA). Immunoblot images obtained on x-ray film after detection by chemiluminescence were scanned on a Sharp JX330 color image scanner at a resolution of 600 X 600 dpi. The images were analyzed by calculating the integrated density of each band determined by fitting the density profile with multiple Gaussian peaks.
RESULTS The present experiments examine the tau content of MTs in axons
and growth cones of cultured sympathetic neurons, and the effects of tau on MT stability and the extent of MT assembly in growing axons of these neurons. In a previous study, we used quantitative
immunofluoresccnce procedures to evaluate the MAPlb content of MTs along the length of growing axons (Black et al., 1994). These studies showed that MAPlb bound avidly to MTs all along the axon and that it was highly enriched on MTs in the distal part of the axon contiguous with the growth cone. In designing the present experiments, we expected that the procedures that worked well in our analyses of MAP1 b would also work for tau. However, this was not the case. In fact, the binding of tau to MTs is very labile to several conditions of fixation and extraction that preserve MAPlb (and MAP2) interactions with MTs. In the following sections, we first document the specificity of the tau polyclonal antibodies used in the present experiments. Then, we present our results on the sensitivity of tau binding to MTs, followed by our findings concerning tau localization and tau content of MT in growing axons. Finally, we show that the varia- tions in the tau content of MTs that naturally occur in growing neurons do not generate corresponding variations in MT sensitiv- ity to MT depolymerizing drugs or the extent of MT assembly.
Characterization of antibody reagents against tau
The present studies used two polyclonal antibodies raised against distinct regions of the tau molecule. One antibody (tau-5’) was directed against the N terminus, and the other (tau-3’) was directed against the C terminus of tau (see Materials and Meth- ods). The specificity of the antibodies was examined by Western blot analyses with whole-cell extracts prepared from immature and adult rat brain and cultures of rat sympathetic neurons. In homogenates of immature rat brain, both antibodies recognized a single band of -45 kDa, whereas in extracts of adult rat brain, both antibodies recognized at least six tau isoforms ranging from 45 to 65 kDa in molecular mass (Fig. l&D); no other bands were recognized by either antibody. The same set of bands was also recognized in preparations of cycled MTs (data not shown) and by various well characterized monoclonal antibodies against tau (Fig. 1C). These results indicate that both tau-5’ and tau-3’ are highly specific for tau and recognize all tau isoforms, including high molecular weight tau (see below).
We used the polyclonal antibodies (tau-3’ and tau-5’) as well as a mix of monoclonal antibodies (taul and tau49) to identify tau in sympathetic neurons cultured for 1 d. In whole-cell SDS extracts, both tau-3’ and tau-5’ recognized a complex set of bands that was also revealed by the monoclonal antibodies against tau (Fig.
Black et al. l Tau in Growing Axons J. Neurosci., June 1, 1996, 76(11):3601-3619 3605
l&D). These bands included -6 tau isoforms that ranged in molecular mass from 45 to 60 kDa and a higher molecular mass species of 110 kDa. The high molecular weight tau bands account for -12% (n = 9, range 5--25%) of the total immunoreactivity in these blots. Note that the lower molecular weight tau expressed by these neurons is compositionally more complex than that present in immature rat brain and closely resembles tau of adult brain in overall profile. A similar pattern of tau was also detected in 2-week-old cultures using these polyclonal antibodies (data not shown) as well as the taul monoclonal antibody (Peng et al., ‘198.5), except that the high molecular weight tau was more abun- dant relative to the low molecular weight species (the high mo- lecular weight tau comprised -50% of the total tau) and the faster migrating species of the low molecular weight taus were not apparent in older neurons.
The association of tau with MTs is very sensitive to conditions of fixation and extraction In our previous studies (Black et al., 1994), many features of MAPlb localization and MT binding were revealed especially clearly by immunostaining of neurons processed by a combined fixation and extraction protocol using PHEM containing 2% para- formaldehyde, 0.05% glutaraldehyde, and 0.5% Triton X-100 (see Figs. 1 and 6 in Black et al., 1994). Surprisingly, when this same .procedure was used to visualize tau in growing axons, we observed little specific tau staining at all, even though MTs were well preserved and strongly stained for p-tubulin and MAPlb (data not shown). The same negative results were also obtained when the fixative concentrations were doubled to 4% paraformaldehyde + 0.1% glutaraldehyde. The lack of tau staining under these conditions is attributable to the quantitative extraction of tau from the neurons. This conclusion derives from biochemical analyses of neurons extracted with Triton X-100 under MT stabilizing condi- tions; ~99% of the tau was Triton-soluble whereas, by compari- son, only -54% of MAPlb was Triton-soluble (Fig. 2). Many possible explanations can account for the lack of tau association with MTs under these conditions. As we document below, tau binding to MTs in these neurons is very labile to a variety of conditions of fixation and extraction that preserve MTs and MAPlb association with MTs.
We tested several different procedures to visualize tau in cul- tured neurons using immunofluorescence procedures. Figure 3A-F shows representative results obtained with a modified com- bined fixation and extraction procedure in which 0.2% saponin was used in place of 0.5% Triton X-100 (procedure 1); compara- ble results were also obtained when cells were fixed in the absence of detergent and then permeabilized using procedure 2 or the PBS/sucrose fixative described by Mandell and Bankler (1995) (data not shown), All of these procedures resulted in strong staining for tubulin and tau in the cell body and all along the axon, and the tau staining could be completely blocked by preincubating the anti-tau antibody with a boiled MAP fraction prepared from neonatal rat brain (data not shown). However, in spread regions where MTs were clearly visible by tubulin staining, tau staining was diffuse and did not colocalize with the MTs (see Fig. 3C-F). This lack of colocalization was observed wherever MTs could be seen, including in lamellapodial expansions of the cell body, in spread regions that occurred occasionally along the axon shaft, and in the growth cone. Using this same combined fixation and extraction procedure, MAPlb clearly and unambiguously colocal- ized with axonal MTs (see Fig. 3G-J), as did MAP2 in immature
Tau MAPlb
Figure 2. Immunoblot analyses of tau partitioning during extraction with an MT-stabilizing buffer containing Triton X-100. Cells were extracted with PHEM + 0.2% Triton X-100 + 10 pM taxol as described in Materials and Methods to obtain Triton-soluble and Triton-insoluble fractions, which contain unassembled and assembled MT proteins, respectively. The entire T&on-soluble and Triton-insoluble fractions were resolved on 4-10% gradient gels and then transferred to nitrocellulose. The transfer was first probed with the tau monoclonal cocktail and then, after obtaining the necessary exposures, the transfer was stripped and reprobed with the anti-MAF’lb polyclonal antibody. Shown are portions of the resulting exposures showing the partitioning of tau and MAPlb between the Triton- soluble (S) and Triton-insoluble (9 fractions. Note that the middle portion of the immunoblot is shown for tau, whereas the top portion is shown for MAPlb.
axons (Fig. 4C,D); tau did not localize to MTs in such immature axons (data not shown).
One possible interpretation for the lack of tau localization to MTs is that little or none of the tau associates with MTs. It is also possible that tau associates with MTs but that the conditions of fixation and extraction, while preserving tau in the cells, did not preserve its association with MTs. Because tau is a known MT binding protein (for review, see Wiche et al., 1991), we favored the latter possibility. This view was confirmed in subsequent experiments that processed cells by combined fixation and extrac- tion using PEM + 0.5% NP-40 + 0.3% glutaraldehyde (Lee and Rook, 1992). When cultured sympathetic neurons were processed according to this procedure (procedure 3 in Materials and Meth- ods) and then double-stained for tubulin and tau, tau clearly and unambiguously colocalized with MTs in the growth cone (Fig. 5C,D; see also Fig. 8) and also in spread regions that occurred along the axon (data not shown) (see also DiTella et al., 1994). Tau also localized to MTs in cells fixed with PEM + 0.3% glutaraldehyde without detergent (procedure 4, see Fig. 5G,H). With these latter conditions, the MT localization of tubulin and
3606 J. Neurosci., June 1, 1996, 76(11):3601-3619 Black et al. l Tau in Growing Axons
Figure 3. Double-staining of neurons for tubulin and either tau (A-F) or MAPlb (G-J). The cells were processed according to procedure 1 an stained using staining condition 1. A, C, E, G, and I show tubulin staining; L3, D, and F show tau staining; and H and J show MAPlb staining. A show Ic )w-magnification images (scale bar, 56 pm) depicting the overall distribution of tubulin and tau in the neurons, whereas the remaining panel higher- magnification views that reveal details of MT staining for tubulin, tau, and MAPlb under these fixation and staining conditions. Note that 1 and tat 1 are distributed throughout the axon but that tau does not colocalize with MTs in the growth cone, whereas MAPlb clearly decorates MTs growth cone to or near their tips (see also Black et al., 1994). Scale bar: A, B, 56 pm; C, 0, G, H, 13 pm; E, F, I, J, 3 pm.
tau wa LS superimposed on a diffuse background due presumably to unasse :mbled tubulin and tau. Because this diffuse staining was much less apparent in cells fixed in the presence of detergent (Figs. 5, compare C and D with G and H), we assume that
unassembled tubulin and tau are at least partially removed the cells during fixation in the presence of detergent [experi using MT depolymerizing agents confirm this interpretatio below)]. With fixation in the presence or absence of dete
d then and B s show .ubulin , in the
I from
n (see rgent,
Black et al. l Tau in Growing Axons J. Neurosci., June 1, 1996, 16(11):3601-3619 3607
Tubulin MAP2
Figure 4. Double-staining of neurons for B-tub&n (A. C) and MAP2 (B. Dl. The’ cells werk processed accorc&g to procedure 1 and then processed using staining condition 1. A and B show low- magnification views (scale bar, 56 pm) of typical neurons in l-d-old cultures stained for tubulin and MAP2; the ar- rowheads identify the tip of the axon. Only faint staining of the axon for MAP2 is apparent, and this is seen in the proximal part of the axon. However, some neurons have relatively short ax- ons with large growth cones that we pre- sume are relatively immature. In these axons (C, D), MAP2 staining is more apparent than in the more typical axons, and it clearly colocalizes with MTs in spread regions where MTs can be visu- alized. ‘Iau staining of similar axons does not show MT colocalization. Scale bar: C, D, 13 pm.
individual MTs stained uniformly along their length for P-tubulin. However, MT staining for tau exhibited a patchy appearance that presumably reflects the periodicity of tau binding along the length of the MTs.
The above results were obtained with the rabbit antibody against the N-terminal region of tau (tau-.5’), and qualitatively similar results were obtained when the antibody was used at dilutions ranging from I:200 to 1:3000. That the staining pattern is specific for tau is further indicated by the observations that qualitatively similar staining patterns were also obtained with a polyclonal antibody against tau directed against its C-terminal
region (tau-3’) and with monoclonal antibodies against tau (a cocktail consisting of taul, tau14, and tau60; data not shown). We note, however, that staining with the monoclonal antibodies was less intense than that obtained with the polyclonal antibodies.
The procedures that resulted in strong tau staining without MT colocalization used PHEM + saponin as the basic buffer and a mixture of glutaraldehyde and paraformaldehyde (0.1 and 4%, respectively) for fixation, whereas the procedures that resulted in both strong staining and clear colocalization of tau with MT used PEM + NP40 as the buffer and only glutaraldehyde, at 0.3%, as the fixative. We tested different combinations of these buffers and
3606 J. Neurosci., June 1, 1996, 76(11):3601-3619 Black et al. . Tau in Growing Axons
Figure 5. Double-staining of neurons for tubulin (A, C, E, G) and tau (B, D, F, H) in cells processed according to staining condition 2. A-D show low- and high-magnification views of cells processed using the combined fixation and extraction procedure of Lee and Rook (1992) (procedure 3). E-H show low- and high-magnification views of cells fixed without extraction according to procedure 4. Both procedures reveal that tau and tubulin staining are more intense in the distal part of the axon compared to its more proximal regions (see text for additional details), and that tau colocalizes with MTs in the growth cone (see C. D. G. and H and Fig. 8). Scale bar in A = 56 Frn and indicates scale in all low-magnification views (A, B, E, F). Scale bar in C = T?,rn and indicates scale in all high-magnification views (C, D, G, H).
fixatives to determine how they influence tau staining. Using the combination of glutaraldehyde and paraformaldehyde always re- sulted in diffuse tau staining without MT colocalization, regardless of the buffer used, and increasing the glutaraldehyde concentra- tion to 0.3 or 0.5% did not change this result. Using 0.3% glutaraldehyde in PEM or PHEM resulted in clear tau colocal- ization to MTs. Although we did not pursue these experiments in detail, the available information indicates that paraformaldehyde interferes with the preservation of tau in cultured sympathetic neurons, even in the presence of more potent fixatives such as glutaraldehyde, such that the association of tau with MTs is lost even though tau is fixed in the cells.
The above findings show that the specific staining patterns obtained for tau depend on the specific conditions of fixation and extraction and that conditions that preserve MTs and reveal MAPlb and MAP2 localization to MTs do not necessarily reveal tau or tau binding to MTs. Indeed, we have identified conditions that result in clear MAPlb localization to MTs and either no tau staining whatsoever, or strong tau staining but no apparent colo- calization with MTs. It is only with procedures 3 and 4 that we have been able to visualize tau associated with MTs. Whereas these results are primarily technical in nature, they also indicate
that the interaction of tau with MTs differs from that of MAPlb and MAP2. Such differences are not unexpected for tau and MAPlb because they have very different MT binding domains (for review, see Wiche et al., 1991). However, tau and MAP2 have highly homologous MT binding domains, and it would have been reasonable to expect that they would behave similarly under the experimental conditions tested above. The finding that tau local- ization to MTs is more sensitive to the conditions of extraction and fixation than MAPlb or MAP2 suggests that tau has a more labile interaction with MTs in these growing axons than does MAPlb or MAP2. It is not known whether this reflects intrinsic differences between tau and these other MAPS or the action of regulatory mechanisms that differentially influence the interac- tions of these MAPS with MTs. In this regard, tau in immature CNS neurons only contains three MT binding repeats (for review, see Wiche et al., 1991) and also undergoes posttranslational modifications that reduce its affinity for MTs (Bramblett et al., 1993).
Given the sensitivity of tau localization patterns to fixation conditions, it is not possible to determine how accurately any given procedure reflects the true localization within the cell. We assume that of all the methods tested, the picture of tau localiza-
Black et al. l Tau in Growing Axons J. Neurosci., June 1, 1996, 76(11):3601-3619 3609
6000
C 0 1’1’1 I I ’ I ’ II I’
0 50 loo 150 200 250 300 350 4 Distance from cell body (pm)
3
6000 I I I I I I I I I I I I
0 B-tubulin
‘2
0 tau B
100 200 300 400 500 600 Distance from cell body (pm)
Figure 6. Quantitative analyses of the relative amounts of total tubulin and total tau along the axon. Cells fixed and then permeabilized (according to procedure 4) were double-stained for P-tubulin and tau according to staining condition 2. Images of the cells were obtained with the cooled CCD camera and then analyzed using the segmented mask procedure. Data from two representative neurons are shown. A and D show computer-generated tracings of these neurons; scale bar, 56 pm. B and E show the Ruorescence intensity for tubulin and tau plotted against distance from the cell body. C and F show the ratio of tau fluorescence-to-tubulin fluorescence plotted against distance from the cell body. The U~WV in A identifies the axon subjected to quantitative analysis. The U~KWS in D-F indicate branch points, while the awowheads indicate where two axons cross over each other.
tion provided by procedures 3 and 4 provides the most reliable Tau localization in growing axons picture of tau localization in growing axons because of its ability to consistently reveal tau association with MTs. Accordingly, we We quantified several parameters of tubulin and tau distribution
have used these procedures to examine in detail the localization in growing axons based on low-magnification images of neurons and MT association of tau in growing axons. fixed and then permeabilized (procedure 4). Representative im-
3610 J. Neurosci.. June 1, 1996, 76(11):3601-3619 Black et al. l Tau in Growing Axons
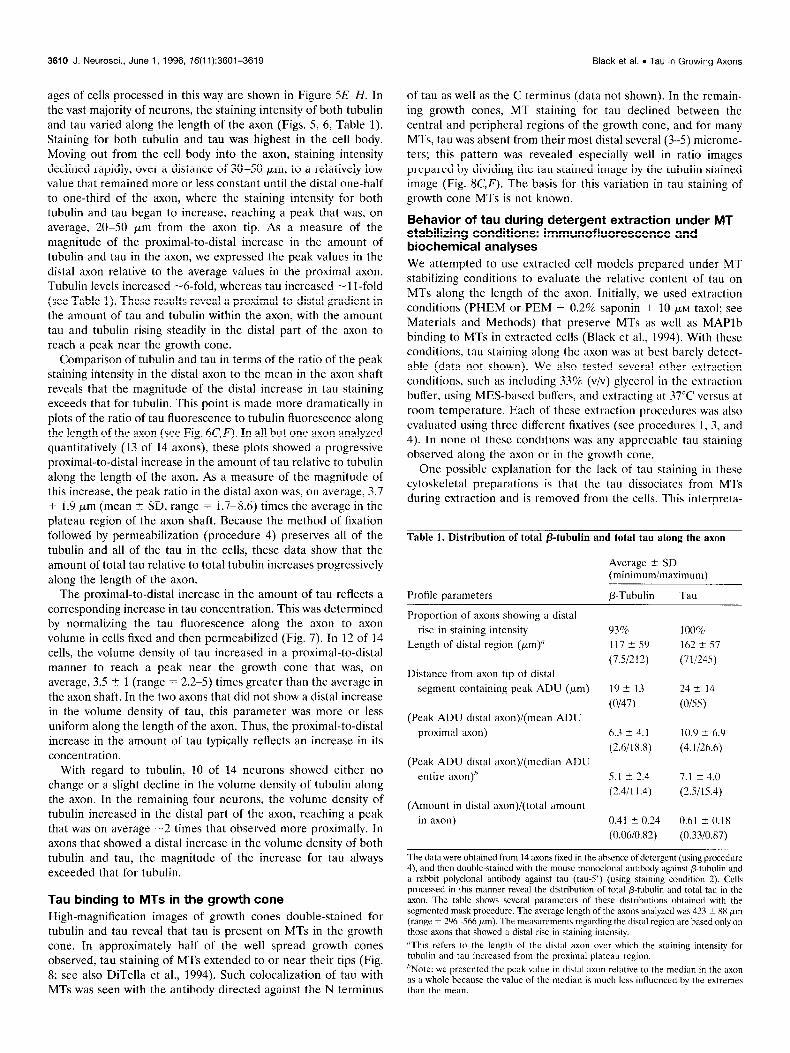
ages of cells processed in this way are shown in Figure 5E-H. In the vast majority of neurons, the staining intensity of both tubulin and tau varied along the length of the axon (Figs. 5, 6, Table 1). Staining for both tubulin and tau was highest in the cell body. Moving out from the cell body into the axon, staining intensity declined rapidly, over a distance of 30-50 pm, to a relatively low value that remained more or less constant until the distal one-half to one-third of the axon, where the staining intensity for both tubulin and tau began to increase, reaching a peak that was, on average, 20-50 pm from the axon tip. As a measure of the magnitude of the proximal-to-distal increase in the amount of tubulin and tau in the axon, we expressed the peak values in the distal axon relative to the average values in the proximal axon. Tubulin levels increased -h-fold, whereas tau increased -1 l-fold (see Table 1). These results reveal a proximal-to-distal gradient in the amount of tau and tubulin within the axon, with the amount tau and tub&n rising steadily in the distal part of the axon to reach a peak near the growth cone.
Comparison of tubulin and tau in terms of the ratio of the peak staining intensity in the distal axon to the mean in the axon shaft reveals that the magnitude of the distal increase in tau staining exceeds that for tubulin. This point is made more dramatically in plots of the ratio of tau fluorescence to tubulin fluorescence along the length of the axon (see Fig. 6C,F). In all but one axon analyzed quantitatively (13 of 14 axons), these plots showed a progressive proximal-to-distal increase in the amount of tau relative to tuhulin along the length of the axon. As a measure of the magnitude of this increase, the peak ratio in the distal axon was, on average, 3.7 + 1.9 pm (mean 2 SD, range = 1.7-8.6) times the average in the plateau region of the axon shaft. Because the method of fixation followed by permeabilization (procedure 4) preserves all of the tubulin and all of the tau in the cells, these data show that the amount of total tau relative to total tubulin increases progressively along the length of the axon.
The proximal-to-distal increase in the amount of tau reflects a corresponding increase in tau concentration. This was determined by normalizing the tau fluorescence along the axon to axon volume in cells fixed and then permeabilized (Fig. 7). In 12 of 14 cells, the volume density of tau increased in a proximal-to-distal manner to reach a peak near the growth cone that was, on average, 3.5 t 1 (range = 2.2-5) times greater than the average in the axon shaft. In the hvo axons that did not show a distal increase in the volume density of tau, this parameter was more or less uniform along the length of the axon. Thus, the proximal-to-distal increase in the amount of tau typically reflects an increase in its concentration.
With regard to tubulin, 10 of 14 neurons showed either no change or a slight decline in the volume density of tubulin along the axon. In the remaining four neurons, the volume density of tubulin increased in the distal part of the axon, reaching a peak that was on average -2 times that observed more proximally. In axons that showed a distal increase in the volume density of both tubulin and tau, the magnitude of the increase for tau always exceeded that for tubulin.
Tau binding to MTs in the growth cone
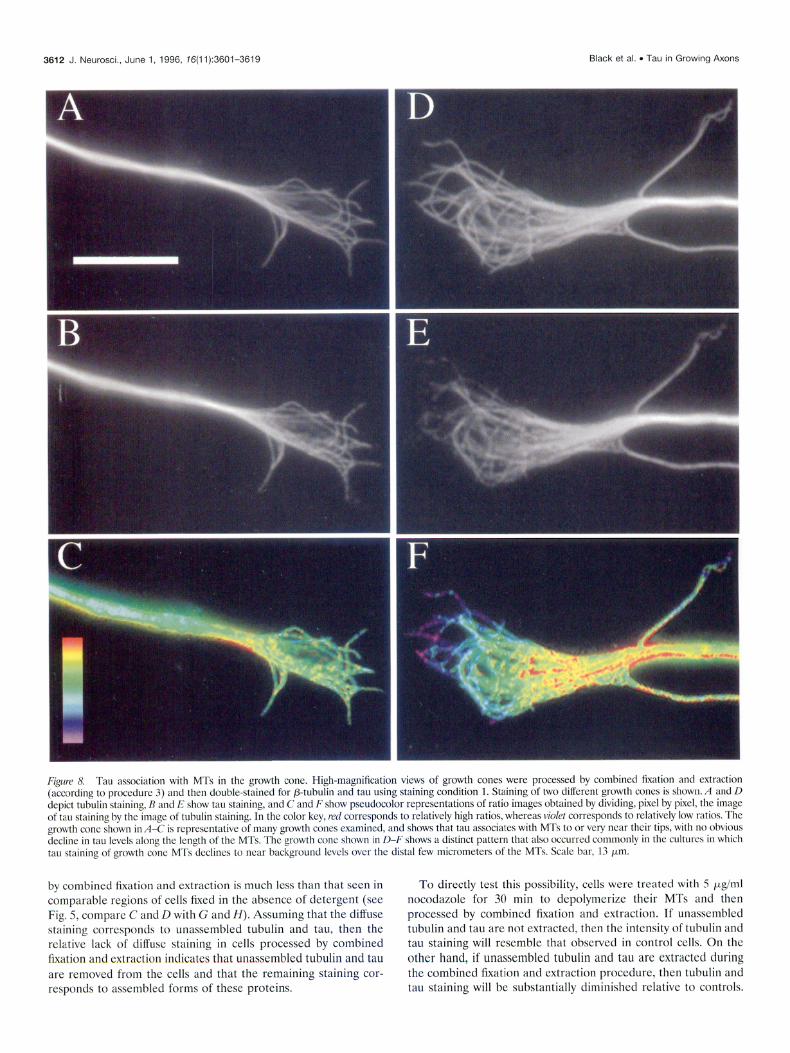
High-magnification images of growth cones double-stained for tubulin and tau reveal that tau is present on MTs in the growth cone. In approximately half of the well spread growth cones observed, tau staining of MTs extended to or near their tips (Fig. 8; see also DiTella et al., 1994). Such colocalization of tau with MTs was seen with the antibody directed against the N terminus
of tau as well as the C terminus (data not shown). In the remain- ing growth cones, MT staining for tau declined between the central and peripheral regions of the growth cone, and for many MTs, tau was absent from their most distal several (3-5) microme- ters; this pattern was revealed especially well in ratio images prepared by dividing the tau stained image by the tubulin stained image (Fig. K,F). The basis for this variation in tau staining of growth cone MTs is not known.
Behavior of tau during detergent extraction under MT stabilizing conditions: immunofluorescence and biochemical analyses
We attempted to use extracted cell models prepared under MT stabilizing conditions to evaluate the relative content of tau on MTs along the length of the axon. Initially, we used extraction conditions (PHEM or PEM + 0.2% saponin + 10 FM taxol; see
Materials and Methods) that preserve MTs as well as MAPlb binding to MTs in extracted cells (Black et al., 1994). With these conditions, tau staining along the axon was at best barely detect- able (data not shown). We also tested several other extraction conditions, such as including 33% (v/v) glycerol in the extraction buffer, using MES-based buffers, and extracting at 37°C versus at room temperature. Each of these extraction procedures was also evaluated using three different fixatives (see procedures I, 3, and 4). In none of thcsc conditions was any apprcciahlc tau staining observed along the axon or in the growth cone.
One possible explanation for the lack of tau staining in these cytoskeletal preparations is that the tau dissociates from MTs during extraction and is removed from the cells. This interpreta-
Table 1. Distribution of total P-tubulin and total tau along the axon
Average t SD (minimum/maximum)
Profile parameters a-Tubulin Tall
Proportion of axons showing a distal
rise in staining intensity
Length of distal region (pm)n
Distance from axon tip of distal segment containing peak ADU (pm)
(Peak ADU distal axon)/(mean ADU proximal axon)
(Peak ADU distal axon)/(median ADU
entire axon)”
(Amount in distal axon)/(total amount
in axon)
93%
117 t 59
(7.51212)
I9 -c I3
(0147)
6.3 -t 4.1
(2.Wl8.8)
5.1 i- 2.4
(2.411 I ,4)
0.41 + 0.24
(0.WO.82)
100% I62 t 57 (711245)
24rt I4
(0155)
10.9 t 6.0
(4.1126.6)
7.1 -c 4.0
(25115.4)
0.61 !z 0.18
(0.3310.87)
The data were obtained from 14 axons fixed in the absence of detergent (usingproccdure 4), and then double-stained with the mouse monoclonal antibody against P-tubulin and
a rabbit polyclonal antibody against tau (tau-5’) (using staining condition 2). Cells processed in this manner reveal the distribution of total P-tuhulin and total tau in the axon. The table shows several parameters of these distributions ohtaincd with the
segmented mask procedure. The average length of the axons analyzed was 423 -t XX pm (range = 296-566 pm). The measurements regarding the distal region are hased only on those axons that showed a distal rise in staining intensity.
“This refers to the length of the distal axon over which the staining intensity for tubulin and tau increased from the proximal plateau region.
“Note: we presented the peak value in distal axon relative to the median in the axon as a whole because the value of the median is much less influenced hy the extremes than the mean.
Black et al. l Tau in Growing Axons J. Neurosci., June 1, 1996, 76(11):3601-3619 3611
400
300
200 0
100
0
-I 140
105
70
35
0
(
0
0
0 B-tubulin 0
& tau
0’ 0 50 100 150 200 250 300 350 400
Distance from cell body (pm)
120 I I I I I I I I I ,A I
D 0 B-tubulin 0 tau
0
90
60
30
0 0 100 200 300 400 500 600 71
Distance from cell body (pm) Kl
F@re 7. Quantitative analyses of the volume densities of tubulin and tau along the axon. Cells fixed and then permeabilized (according to procedure 4) were double-stained for /3-tubulin and tau according to staining condition 2. Images of the cells were obtained with the cooled CCD camera and then analyzed using the segmented mask procedure. For each axon analyzed, we determined the volume (in pm’), the fluorescence intensity of P-tubulin, and the fluorescence intensity of tau for each axon segment. To calculate the volume densities of P-tubulin and tau for each axon segment, the fluorescence intensities attributable to P-tubulin and tau for each segment were divided by segment volume. The resulting segment volumes and volume densities were plotted against distance from the cell body. Data from two representative neurons are shown. A and B show the data from one neuron (the same neuron shown in Fig. G-C), whereas C and D show the results from a different neuron (the same neuron shown in Fig. 9-F). A and C show the volume of each segment plotted against distance from the cell body. B and D show the volume densities of P-tubulin and tau plotted against distance from the cell body. The LWVSVS and arrowheads in C and II are as defined for Figure 5 D-F.
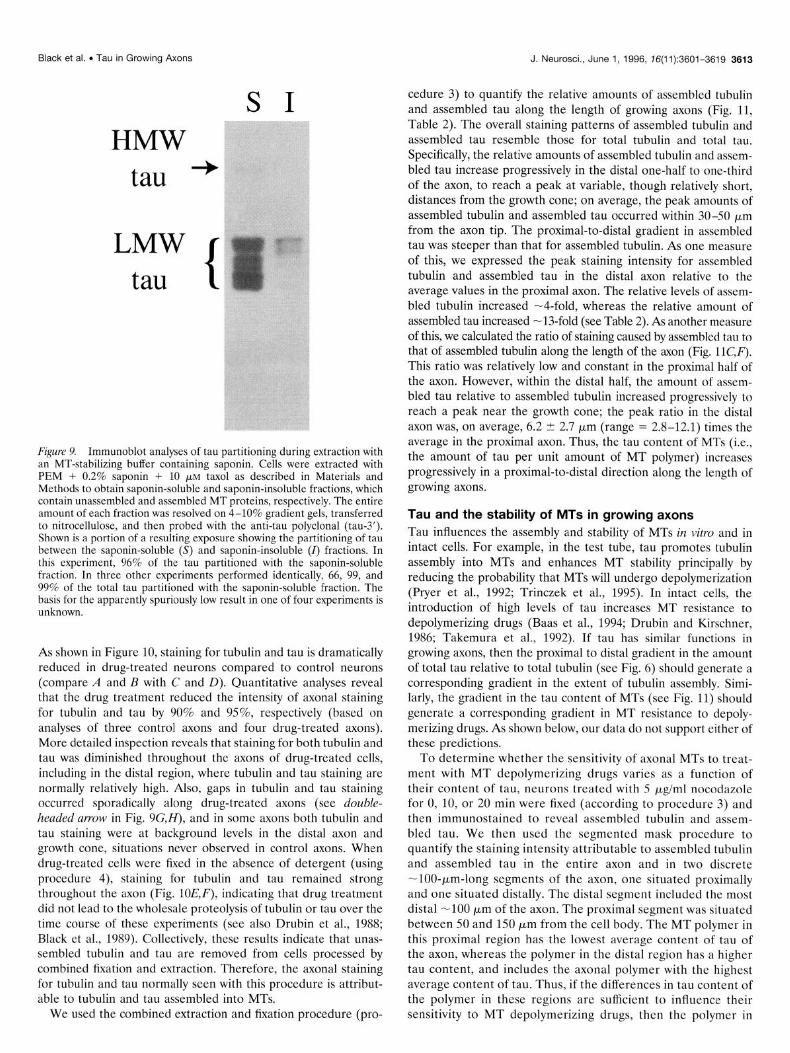
tion is also consistent with the finding that tau binding to MTs is lost under a variety of conditions of combined fixation and extrac- tion (see Fig. 3 and above). Previously we showed that a portion of the tau in lo- to 14-d-old cultures of sympthetic neurons partions with MTs during extraction under MT stabilizing condi- tions (Peng et al., 1985). However, these experiments did not examine the proportion of total tau that partitioned with MTs versus soluble fraction. In the present experiments, we used bio- chemical procedures to evaluate the partitioning of tau between soluble and cytoskeletal fractions. As shown in Figure 9, the vast majority of the tau was soluble after extraction with PEM con- taining 0.2% saponin + taxol. Quantitative analyses reveal that 90% (mean, n = 4) of the total tau is solubilized under these conditions, whereas only 10% remains associated with MTs (or other insoluble components). It is highly unlikely that this rela-
tively small amount of the total tau represents the actual amount associated with MTs in the axon given that staining of MTs for tau is so much stronger than that observed in regions devoid of MTs (see Fig. 5G,H). Thus, the biochemical data support the interpre- tation that tau dissociates from MTs during extraction with non- ionic detergents [Triton X-100 (Fig. 2) and saponin] and is then removed from the cells.
Tau is enriched on MTs in the distal part of the axon
Although we could not evaluate tau assembled into MTs using extracted cell models, the following results indicate that in cells processed by combined fixation and extraction (procedure 3), the staining for tau and tubulin is attributable principally to tau and tubulin assembled into MTs. First, the amount of diffuse staining for tubulin and tau observed in spread regions of cells processed
3612 J. Neurosci., June 1, 1996, 76(11):3601-3619 Black et al. . Tau in Growing Axons
E 1
FLOUR 8, Tau a\soclation with MT5 in the growth cone. High-magnification views of growth cones were processed by combined fixation and extraction (according to proccdurc 3) and then double-stained for P-tubulin and tau using staining condition 1. Staining of two different growth conch is shown. A and D depict tubulm stainmg, R and E show tau staining, and C and F show pseudocolor representations of ratio images obtained by dividing, pixel by pixel, the image of tau staining by the Imnge ot tuhulin staming. In the color key, r-ed corresponds to relatively high ratios, whereas ~ro/e~ corresponds to rclativcly low r&o\. The growth cone +)wn in A-C I\ ~cprc~ntative of many growth cones examined, and shows that tau a\jociates with MTs to or very near then tip\, with no obvlou\ declmc in tau lcvcls along the length of the MTs. The growth cone shown in II-F \howS a distinct pattern that also occu~rcd commonly in the culttnc\ in which tau stammg ot growth cone MT\ tlcclinc\ to near backyround level\ over the distal tew micromctcrs of the MTs. Scnlc bar, I3 km.
by combined fixation and extraction is much less than that seen in comparable regions of ceils fixed in the absence of detergent (see Fig. 5, compare C and D with G and H). Assuming that the diffuse staining corresponds to unassembled tubulin and tau, then the relative lack of diffuse staining in cells proccsscd by combined fixation and extraction indicates that unassembled tubulin and tau are removed from the cells and that the remaining staining cor- responds to assembled forms of these proteins.
To directly test this possibility, cells were trcatcd with 5 &ml nocodazolc for 30 min to depolymerizc their MTs and then processed by combined fixation and extraction. If unassembled tubulin and tau are not extracted, then the intensity of tubulin and tau staining will resemble that observed in control cells. On the other hand, if unassembled tubulin and tau arc extracted during the combined fixation and extraction proccdurc, then tubulin and tau staining will be substantially diminished relative to controls.
Black et al. . Tau in Growing Axons J. Neurosci., June 1, 1996, 76(11):3601-3619 3613
s I HMW
tau
LMW tau
Figure 9. Immunoblot analyses of tau partitioning during extraction with an MT-stabilizing buffer containing saponin. Cells were extracted with PEM + 0.2% saponin + 10 pM taxol as described in Materials and Methods to obtain saponin-soluble and saponin-insoluble fractions, which contain unassembled and assembled MT proteins, respectively. The entire amount of each fraction was resolved on 4-10% gradient gels, transferred to nitrocellulose, and then probed with the anti-tau polyclonal (tau-3’). Shown is a portion of a resulting exposure showing the partitioning of tau between the saponin-soluble (S) and saponin-insoluble (4 fractions. In this experiment, 96% of the tau partitioned with the saponin-soluble fraction. In three other experiments performed identically, 66, 99, and 99% of the total tau partitioned with the saponin-soluble fraction. The basis for the apparently spuriously low result in one of four experiments is unknown.
As shown in Figure 10, staining for tubulin and tau is dramatically reduced in drug-treated neurons compared to control neurons (compare A and B with C and D). Quantitative analyses reveal that the drug treatment reduced the intensity of axonal staining for tubulin and tau by 90% and 95%, respectively (based on analyses of three control axons and four drug-treated axons). More detailed inspection reveals that staining for both tubulin and tau was diminished throughout the axons of drug-treated cells, including in the distal region, where tubulin and tau staining are normally relatively high. Also, gaps in tubulin and tau staining occurred sporadically along drug-treated axons (see double- headed arrow in Fig. 9G,H), and in some axons both tubulin and tau staining were at background levels in the distal axon and growth cone, situations never observed in control axons. When drug-treated cells were hxed in the absence of detergent (using procedure 4), staining for tubulin and tau remained strong throughout the axon (Fig. lOE,F), indicating that drug treatment did not lead to the wholesale proteolysis of tubulin or tau over the time course of these experiments (see also Drubin et al., 1988; Black et al., 1989). Collectively, these results indicate that unas- sembled tubulin and tau are removed from cells processed by combined fixation and extraction. Therefore, the axonal staining for tubulin and tau normally seen with this procedure is attribut- able to tubulin and tau assembled into MTs.
We used the combined extraction and fixation procedure (pro-
cedure 3) to quantify the relative amounts of assembled tubulin and assembled tau along the length of growing axons (Fig. 11, Table 2). The overall staining patterns of assembled tubulin and assembled tau resemble those for total tubulin and total tau. Specifically, the relative amounts of assembled tubulin and assem- bled tau increase progressively in the distal one-half to one-third of the axon, to reach a peak at variable, though relatively short, distances from the growth cone; on average, the peak amounts of assembled tubulin and assembled tau occurred within 30-50 pm from the axon tip. The proximal-to-distal gradient in assembled tau was steeper than that for assembled tubulin. As one measure of this, we expressed the peak staining intensity for assembled tubulin and assembled tau in the distal axon relative to the average values in the proximal axon. The relative levels of assem- bled tubulin increased -4-fold, whereas the relative amount of assembled tau increased -13-fold (see Table 2). As another measure of this, we calculated the ratio of staining caused by assembled tau to that of assembled tubulin along the length of the axon (Fig. llC,F). This ratio was relatively low and constant in the proximal half of the axon. However, within the distal half, the amount of assem- bled tau relative to assembled tubulin increased progressively to reach a peak near the growth cone; the peak ratio in the distal axon was, on average, 6.2 I: 2.7 pm (range = 2.8-12.1) times the average in the proximal axon. Thus, the tau content of MTs (i.e., the amount of tau per unit amount of MT polymer) increases progressively in a proximal-to-distal direction along the length of growing axons.
Tau and the stability of MTs in growing axons Tau influences the assembly and stability of MTs in vitro and in intact cells. For example, in the test tube, tau promotes tubulin assembly into MTs and enhances MT stability principally by reducing the probability that MTs will undergo depolymerization (Pryer et al., 1992; Trinczek et al., 1995). In intact cells, the introduction of high levels of tau increases MT resistance to depolymerizing drugs (Baas et al., 1994; Drubin and Kirschner, 1986; Takemura et al., 1992). If tau has similar functions in growing axons, then the proximal to distal gradient in the amount of total tau relative to total tubulin (see Fig. 6) should generate a corresponding gradient in the extent of tubulin assembly. Simi- larly, the gradient in the tau content of MTs (see Fig. 11) should generate a corresponding gradient in MT resistance to depoly- merizing drugs. As shown below, our data do not support either of these predictions.
To determine whether the sensitivity of axonal MTs to treat- ment with MT depolymerizing drugs varies as a function of their content of tau, neurons treated with 5 pg/ml nocodazole for 0, 10, or 20 min were fixed (according to procedure 3) and then immunostained to reveal assembled tubulin and assem- bled tau. We then used the segmented mask procedure to quantify the staining intensity attributable to assembled tubulin and assembled tau in the entire axon and in two discrete -lOO-Frn-long segments of the axon, one situated proximally and one situated distally. The distal segment included the most distal -100 pm of the axon. The proximal segment was situated between 50 and 150 pm from the cell body. The MT polymer in this proximal region has the lowest average content of tau of the axon, whereas the polymer in the distal region has a higher tau content, and includes the axonal polymer with the highest average content of tau. Thus, if the differences in tau content of the polymer in these regions are sufficient to influence their sensitivity to MT depolymerizing drugs, then the polymer in
3614 J. Neurosci., June 1, 1996, 16(11):3601-3619 Black et al. l Tau in Growing Axons
Figure 10. Effects of nocodazole on the intensity of axonal staining for tubulin and tau. Cells were treated with or without nocodazole (5 &ml) for 30 min, and then processed by combined extraction and fixation (procedure 3, A-D, G, H> or by fixation without extraction (procedure 4, E, F), and then double-stained for tubulin (A, C, ~5, G) and tau (B, D, F, H) using staining condition 1.A and B show a control cell demonstrating typical staining patterns for tubulin and tau, respectively. The intensity of staining in drug-treated cells is dependent on the conditions of fixation. With combined fixation and extraction (C, D), tubulin and tau staining is reduced to negligible levels compared to controls, whereas with futation without extraction, tubulin and tau staining is strong. The cell shown in C and D is shown again in G and H, but scaled to better reveal the dim staining remaining in this cell. Entirely similar results were also obtained using a modified procedure 3 in which the Triton X-100 treatment after fixation was omitted. Note that staining for tubulin and tau is at or near background in the distal 30-40 pm of the axon (see C, D, G, H). The arrowheads identify non-neuronal cells (non-neuronal cells processed by combined fixation and extraction and then viewed at higher magnification contain a few wavy MTs; data not shown), the single-headed arrows identify the axon tip in drug-treated cells, and the double-headed arrows identify a gap in staining along the length of a drug-treated axon.
these two regions will decline at distinctly different rates in the prcscnce of such drugs. However, as shown in Figure 12, the amount of polymer in the entire axon as well as in proximal and distal regions decline in the presence of drug, and the time course of the decline in the distal axon is indistinguishable from that in the proximal axon. Thus, in spite of the severalfold difference in tau content, the MT polymer in the proximal and distal axon exhibit very similar sensitivities to nocodazole.
Drug treatment also did not detectably affect the ratio of tau fluorescence to tubulin fluorescence in axonal MTs. We evaluated this by measuring the average tau-to-tubulin ratio and the maximum tau-to-tubulin ratio for the entire axon, and for the proximal and
distal regions described above. In control axons, the average values for this ratio for the entire axon and for the proximal and distal regions described above were 0.43 ~fr 0.20 (mean t SD), 0.25 t 0.13, and 0.82 2 0.42, respectively, whereas the maximum values were 1.26 2 0.64, 0.36 t 0.19, and 1.26 t 0.64, respectively. In axons treated with nocodazole for 20 min, the corresponding average values were 0.54 + 0.22, 0.28 + 0.12, and 0.83 t 0.53, whereas the maximum values were 1.37 t 0.64, 0.48 f 0.17, and 1.13 t 0.65. If the tau content of axonal MTs influences the time course of polymer loss in the presence of drug, then this parameter, as measured by the tau-to-tubulin ratio, should change as a function of time in drug. For example, if MT polymer with a relatively high tau content depoly-
Black et al. . Tau in Growing Axons J. Neurosci., June 1, 1996, 76(11):3601-3619 3615
600
1.8 ’ I I I I 0 G3
J
C 0 I I I I I
0 100 200 300 400 5 Distance from cell body (pm)
3
0.6
I I I I
0 100 200 300 400 51 Distance from cell body (pm)
lo
Figure II. Quantitative analyses of the relative amounts of assembled tubulin and assembled tau along the axon. Cells processed by combined fixation and extraction (according to procedure 3) were double-stained for P-tubulin and tau according to staining condition 2. Images of the cells were obtained with the cooled CCD camera and then analyzed using the segmented mask procedure. Data from two representative neurons are shown. A and D show computer-generated tracing of these neurons; scale bar, 56 Frn. R and E show the fluorescence intensity for tubulin and tau plotted against distance from the cell body. C and F show the ratio of tau fluorescence-to-tubulin fluorescence plotted against distance from the cell body. The nrr0w.7 in D-F indicate branch points.
merized slower than polymer with a relatively low content, then the The proximal-to-distal gradient in the amount of tau average and maximum values for the tau-to-tubulin ratio would relative to tubulin does not generate a corresponding increase with time in drug. Clearly, this is not the case over the time gradient in the tubulin monomer-to-polymer ratio
course of the present experiments. This result further reinforces the To obtain information on the possible effects of tau on the conclusion that the naturally occurring variation in the tau content of assembly of MTs in growing axons, we evaluated whether the the MT polymer in growing axons does not influence the sensitivity proportion of tubulin in polymer increases along the axon in of this polymer to nocodazole-induced depolymerization. parallel with the proximal-to-distal increase in the tau-to-tubulin
3616 J. Neurosci., June 1, 1996, 16(11):3601-3619 Black et al. l Tau in Growing Axons
Table 2. Distribution of assembled /3-tubulin and assembled tau along the axon
Average 5 SD ~minimumimaximum~
Profile oarameters B-Tubulin Tau
Proportion of axons showing a distal
rise in staining intensity
Length of distal region (pm)”
Distance from axon tip of distal
segment containing peak ADU (wm)
(Peak ADU distal axon)/(mean ADU
proximal axon)
(Peak ADU distal axon)/(median ADU
entire axon)
(Amount in distal axon)/(total amount
in axon)
69%
189 IT 80
(551358)
51 +- 65
(131251)
4.0 k 2.6
(1.4110.2)
3.5 z 2.2
(1.218.3)
0.48 2 0.2
(0.110.75)
94%
198 2 71
(901345)
29 t 19
(8174)
13.4 k 9.7
(2.7132.4)
10.1 5 8.8
(1.8129.0)
0.66 -c 0.15
(0.3210.85)
The data wcrc obtained from I h axons processed by combined extraction and fixation (according to procedure 3), double-steincd with the mouse monoclonal antibody against P-tuhulin and a r&hit polyclonal antibody against tat! (&u-5’, according to staining condition 2). As described in the text, the tuhulin and tau staining in axons processed in this manner rcflccts spcciticidly tuhulin and tau asscmhlcd into MTs. The table shows several parameters of thcsc distributions obtained with the seg- mented mask procedure. The avcragc length of the axons analyzed was 504 + 104 pm (range = 306-635 bm). The measurements regarding the distal region arc based only on those axons that showed a distal rise in staining intensity.
To facilitate the comparison of the distribution of total tubulin and total tau along the axon (Table 1) with that of assembled tubulin and assembled tau (Table 2), the quantitative data shown in both tables were obtained from a single experiment using sister cultures. The staining procedures used on all cells were identical and were performed in parallel using the same reagents. Also, the images of the cells on which the quantitative analyses were based were obtained using the same exposure times. Thus, we have controlled for as many variables as possible so that the specific quantitative results obtained with the two hation procedures can he reliably com- pared with each other. “This refers to the length of the distal axon over which the staining intensity for tuhulin and tau increased from the proximal plateau region.
ratio. We used an indirect analysis based on the following consid- erations. Quantitative analyses of tubulin staining indicates that the amounts of total tub&n (Fig. 6, Table 1) and of assembled tubulin (Fig. 11, Table 2) increase in a proximal-to-distal manner for most axons. If the proportion of the total tubulin pool that is assembled increases along the length of the axon, then the mag- nitude of the proximal-to-distal increase in staining for assembled tubulin (seen in cells processed by combined fixation and extrac- tion according to procedure 3) will be greater than that observed for total tubulin (seen in cells fixed and then permeabilized according to procedure 4). To evaluate this, we calculated two parameters, the ratio of the peak staining for tubulin in the distal axon to the mean staining in the proximal axon and the ratio of the peak staining for tubulin in the distal axon to the median staining for the entire axon (see Tables 1 and 2). For total tubulin, these ratios were 6.3 + 4.1 and 5.1 ? 2.4, respectively, whereas for assembled tubulin they were 4 ? 2.6 and 3.5 ? 2.2, respectively. Whereas considerable cell-to-cell variation exists in the values obtained for these parameters, there is no indication that the values for the assembled tubulin pool are, overall, greater than (or less than) those for the total tubulin pool. Thus, the tubulin monomer-to-polymer ratio does not appear to vary systematically along the axon in relation to the tau-to-tubulin ratio. This in turn
indicates that the proximal-to-distal increase in the tau-to-tubulin ratio (see Fig. 6 and above) is not reflected in the extent of tubulin assembly within these axons.
DISCUSSION
Tau has a nonuniform distribution in axons of cultured sympa- thetic neurons. Its levels are relatively low and constant in the proximal half of the axon. However, within the distal half, the amount of total tau and assembled tau undergoes a progressive proximal-to-distal increase, reaching a peak near the growth cone that is -lo-fold greater than that observed proximally. The vol- ume of the axon also increases proximodistally. However, the proximodistal increase in total tau exceeds by severalfold that of axon volume, indicating that the concentration of tau increases progressively along the axon. The amounts of total tubulin and assembled tubulin also exhibit a proximodistal increase. However, the gradients of total tau and assembled tau are steeper than those of tubulin. Thus, the ratio of total tau to total tubulin and the tau content of MTs increases progressively between the proximal axon and the axon tip (Figs. 6, 11).
We have taken advantage of the naturally occurring gradient in the tau content of MTs and in the ratio of total tau to total tubulin to cvaluatc whcthcr tau promotes MT assembly and stability in growing axons. Functional studies of tau in the test tube and in non-neuronal cells transfected with tau have revealed several activities of tau, most notably the ability to promote the assembly of tubulin into MTs and to enhance the stability of MTs (for review, see Hirokawa, 1994). Based on these activities, it has been proposed that tau promotes the assembly and stabilization of MTs required for axon growth (Caceres et al., 1992; Brandt and Lee, 1993; Esmaeli-Azad et al., 1994). If the stability of axonal MTs is a direct function of their content of tau, then the most stable polymer of the axon should have the highest content of tau, and conversely, the most dynamic polymer should have the least tau. Furthermore, the proximal-to-distal gradient in the amount of total tau to total tubulin should generate a corresponding gradient in the proportion of total tubulin assembled into MTs. Our data do not support either of these predictions. First, the polymer with the highest content of tau is located in the distal part of the axon and in the growth cone. This polymer is also among the most dynamic of the entire axon as measured by its turnover behavior (Lim et al., 1989; Edson et al., 1993; Li and Black, 1996), its relative content of tyrosinated cr-tubulin (Brown et al., 1992), and its sensitivity to MT depolymerizing drugs (Baas et al., 1993). Second, the distribution of tubulin between monomer and poly- mer is similar in the proximal and distal parts of the axon, in spite of the severalfold difference in the amount of total tau relative to total tubulin and in the tau content of the MT polymer in these regions. Clearly, the stability of MTs in axons of cultured sympa- thetic neurons is not directly related to their relative content of tau, nor is the extent of tubulin assembly along the axon related to the tau-to-tubulin ratio.
Other observations also question whether tau promotes MT assembly and stability in growing axons. First, if tau stabilizes axonal MTs, then it should have a reasonably stable interaction with these MTs (Trinczek et al., 1995). However, we found that the interaction of tau with MTs is quite labile under a variety of conditions that preserve MTs and the interaction of MAPlb and MAP2 with MTs. Second, if tau is crucial for MT assembly and stability, then changing the levels of tau should have concomitant effects on MT polymer levels. In several cases, however, this was not observed. For example, suppression of tau expression in
Black et al. . Tau r Growing Axons J. Neurosci., June 1, 1996, 76(11):3601-3619 3617
cultured cerebellar neurons using antisense probes had minimal effect on MT polymer levels (Caceres et al., 1992), whereas overexpressing tau had no effect on the tubulin monomer-poly- mer distribution in PC12 cells grown without NGF (Esmaeli-Azad et al., 1994) and in non-neuronal cells (Barlow et al., 1994). In other cases, a positive correlation between changing levels of tau expression and MT assembly and stability has been reported. Most notably, in PC12 cells treated with NGF, the amounts of tau and MTs increase over a similar time course (Drubin et al., 1985; Esmaeli-Azad et al., 1994). However, many other changes occur in these cells during this time, including enhanced expression and phosphorylation of other MAPS (Drubin et al., 1985; Black et al., 1986; Brugg and Matus, 1988). Thus, the contribution of the enhanced expression of tau to the increase in MT mass is uncertain.
Given that tau promotes MT assembly and stability in vitro (for review, see Hirokawa, 1994), it is unexpected that the proximo- distal gradient in the tau content of MTs does not generate a corresponding gradient in the stability of axonal MTs. Perhaps the molar ratio of tau to tubulin is too low to appreciably affect MT dynamics in growing axons. However, when measured in cells extending axons (Drubin et al., 1985; Ferreira et al., 1989), this parameter was within the effective range for promoting assembly in vitro. Another possibility relates to the developmental regula- tion of tau. Tau consists of a variety of isoforms caused by alternative splicing and phosphorylation (for review, see Wiche et al., 1991). Both the alternative splicing and phosphorylation of tau are developmentally regulated such that tau in immature neurons differs dramatically in composition from that in mature neurons.
Most studies that have examined tau in vitro have used tau from adult brain. This tau may be very different from tau in immature neurons in terms of its assembly promoting and stabilizing activ- ities. In this regard, one of the alternative splicing events that is developmentally regulated affects the MT binding domain of tau such that its intrinsic affinity for MTs is greater in mature neurons compared to immature neurons (Goode and Feinstein, 1994; Trinczek et al., 1995). Also, some of the sites preferentially phosphorylated in immature neurons reduce the assembly com- petence of tau in vitro (Bramblett et al., 1993). Thus, tau in growing neurons is subject to multiple regulatory mechanisms that reduce its affinity for MTs and its assembly promoting and stabi- lizing activities. This in turn may contribute to the observed lability of tau’s interaction with MTs, and to its apparently limited affect on MT assembly and stability in growing axons. Implicit in this view is that in mature axons, tau does influence MT assembly and stability. Whereas this possibility provides an attractive expla- nation for the limited effects of tau on MT assembly and stability observed in growing axons, tau in young cultures of sympathetic neurons is more like that of adult brain than fetal brain in its gel profile. Thus, it is unclear exactly how tau in these neurons differs from that in mature brain. Finally, it is also possible that the functions of tau in viva differ from those inferred from test tube experiments. In this regard, gene disruption experiments indicate that tau is not essential to generate axons that contain an appar- ently normal MT array (Harada et al., 1994).
The issues concerning whether tau promotes MT assembly and stability in growing axons also apply to other MAPS. Tau is only one of several MAPS in growing axons (Black and Smith, 1988),
120
100
80
60
40
20
0
Assembled Tubulin Assembled Tau
entire axon loo 100 loo
0 uroximal 100 urn _ bistal 100 pm’
10 ’ 20 Time in drug (min)
10 Time in drug (min)
F@re 12. Quantitative analyses of the time course of nocodazole effects on the amount of MT polymer in the axon. Cultures were treated with 5 &ml nocodazole for 0, 10, or 20 min and processed by combined extraction and fixation using procedure 3. The cells were then double-stained for tubulin and tau using staining condition 1. Images were obtained from the resulting cells and subjected to the segmented mask procedure to quantify tubulin and tau staining along the length of the axon. We then computed the total staining intensity of tubulin and tau for the entire axon, and for a 100 +m segment located proximally, and a 100 pm segment located distally (10 or 11 axons were measured for each drug treatment condition). The proximal segment was situated between 50 and 150 wrn from the cell body and contains the polymer that has the lowest average content of tau in the axon. The distal segment included the most distal 100 pm of the axon and contains polymer that has a much higher tau content than the polymer in the proximal segment, and includes the axonal polymer with the highest average content of tau. The staining intensity for tubulin and tau of drug-treated axons is expressed as a percentage of the intensity in control axons. These analyses show that the time course of polymer loss is the same in the proximal and distal axonal regions in spite of the severalfold difference in tau content of the polymer in these regions.
3618 J. Neurosci., June 1, 1996, 76(11):3601-3619 Black et al. . Tau in Growing Axons
and at least one other MAP, namely MAPlb, is also enriched by severalfold on MTs in the distal part of growing axons (Black et al., 1994). In fact, most and possibly all MTs in the growth cone contain both MAPlb and tau (Figs. 3, 5, 8; Black et al., 1994). Thus, in this region, both tau and MAPlb are present on the same MTs, and at severalfold higher levels than on MTs situated more proximally in the axon. In spite of their relatively high levels of at least two different MAPS, the MT polymer in the distal axon is not endowed with enhanced stability compared to the polymer situ- ated more proximally. Indeed, just the opposite is observed; this polymer is the most dynamic of the entire axon. Thus, binding of tau and MAPlb to MTs at the levels that naturally occur in the distal axon and growth cone does not preclude this polymer from undergoing relatively dynamic behavior.
What are the functional specializations of tau and MAPlb in growing axons? The answer still remains a mystery. Given that both MAPlb and tau are MT binding proteins, it seems reason- able that their functions in axon growth are MT dependent and involve at least in part binding to MTs. In addition, both tau and MAPlb have sidearm domains that project away from the surface of the MT. Through their sidearm domains, tau and MAPlb influence the packing density of MTs (Bloom ct al., 1985; Black, 1988; Chen ct al., lY92) and may also interact with other struc- tures including MTs, intermediate filaments, microfilaments, the plasma membrane, and internal membrane systems (DiTella et al., 1994; Brandt et al., lYY5) (for review, Schoenfeld and Obar, 1994). This variety of potential binding partners in viva raises the possibility that tau and other MAPS function to integrate MTs with other cytoplasmic structures. The observations that tau, MAPlb, and possibly other MAPS are preferentially concentrated in the distal axon and growth cone and that the MT polymer in this region is especially enriched in these MAPS focus attention on these distal regions as key sites of MAP function in elongating axons. The distal region of growing axons is the most newly formed part of the axon. Perhaps tau and other MAPS, by medi- ating the interaction of MTs with other structures, help to con- solidate the internal architecture of the newly formed axon so that it can continue to elongate.
REFERENCES Ahmad FJ, Pienkowski TP, Baas PW (1993) Regional differences in
microtubulc dynamics in the axon. J Ncurosci 13:856-866. Baas PW, Ahmad FJ, Pienkowski TP, Brown A, Black MM (1993) Sites
of stabilization for axonal microtubules. J Ncurosci 13:2177-21X5. Baas PW, Pienkowski TP, Cimhalnik KA, Toyama K, Bakalis S, Ahmad
FJ, Kosik KS (1994) Tau confers drug-stability but not cold-stability to microtubulcs in living cells. J Cell Sci 107:135-143.
Barlow S, Gonzalez-Garay ML, West RR, Olmsted JB, Cabral F (1994) Stable expression of hctcrologous microtubule-associated proteins (MAPS) in chincsc hamster ovary cells: evidence for differing roles of MAPS in microtubule organization. J Cell Biol 126:1017-1029.
Black MM (1987) Comparison of MAP-2 and tau on the packing density of asscmblcd microtubules. Proc Nat1 Acad Sci USA 84:7783-7787.
Black MM (1994) Microtubule assembly and transport cooperate to gen- erate the microtubule array of the axon. Prog Brain Rcs 102:61-77.
Black MM, Kurdyla JT (1983) Microtubule-associated proteins of neu- rons. J Ccl1 Biol 97:1020-102X.
Black MM, Smith W (1988) Regional differentiation of the ncuronal cytoskclcton, with an appendix: ditiusion of proteins in the neuron cell body: mathematical approximations and computer simulations. In: In- trinsic dctcrminants of ncuronal form and function (Lasek RJ, Black MM, eds), pp 463-486. New York: Liss.
Black MM, Cochran JM, Kurdyla JT (1984) Solubility properties of neu- ronal tubulin: evidence for labile and stable microtubules. Brain Res 2951255-263.
Black MM, Aletta J, Greene LA (1986) Regulation of microtubule com- position and stability during nerve growth factor-promoted outgrowth. J Cell Biol 103:545-557.
Black MM, Baas PW, Humphreys S (1989) Dynamics of ol-tubulin deacetylation in cultured neurons. J Neurosci 9:358-368.
Black MM, Slaughter T, Fischer I (1994) Microtubule-associated protein Ib (MAPlb) is concentrated in the distal region of growing axons. J Neurosci 14:857-870.
Bloom GS, Luca FC, Vallee RB (1985) Microtubule associated protein IB: identification of a major component of the neuronal cytoskeleton. Proc Nat1 Acad Sci USA 82:5404-5408.
Blose SH, Meltzer DJ, Feramisco JR (1984) 10 nm filaments are induced to collapse in living cells microinjected with monoclonal and polyclonal antibodies against tubulin. J Cell Biol 98:847-858.
Bramblett CT, Goedert M, Jakes R, Merrick SE, Trojanowski JQ, Lee VM-Y (1993) Abnormal tau phosphorylation at Se?“” in Alzheimer’s disease recapitulates development anmd contributes to reduced micro- tubule binding. Neuron 10:1089-1099.
Brandt R, Lee G (1993) The balance between tau protein’s microtubule growth and nucleation activities: implications for the formation of axonal microtubules. J Neurochcm 61:997-1005.
Brandt R, Lcger J, Lee G (1995) Interaction of tau with the neural plasma membrane mediated by tau’s amino-terminal projection do- main. J Ccl1 Biol 131:1327-1340.
Brown A, Slaughter T, Black MM (1992) Newly assembled microtubulcs are concentrated in the proximal and distal regions of growing axons. J Cell Biol Il9:867-882.
Brown A, Li Y, Slaughter T, Black MM (1993) Composite microtubulcs of the axon: quantitative analysis of tyrosinatcd and acctylatcd cu-tubulin along axonal microtuhulcs. J Cell Sci 104:339-352.
Caceres A, Kosik KS (1990) Inhibition of neurite polarity by tau antisense oligonucleotides in primary cerebellar neurons. Nature 3431461-463.
Caceres A, Mautino J, Kosik KS (1992) Suppression of MAP2 in cul- tured cerebellar macroneurons inhibits minor neurite foramtion. Neu- ron 9:607-618.
Carlier MF, Simon C, Cassoly R, Pradel LA (1984) Interactions between microtubule-associated protein tau and spectrin. Biochimie 66:305-311.
Chen J, Kanai Y, Cowan NJ, Hirokawa N (1992) Projection domains of MAP2 and tau determine spacings between microtubules in axons and dendrites. Nature 360:674-677.
Chomcynski P, Sacchi N (1987) Single step method for RNA isolation by acid guanidinium thiocyanate-phenol-chloroform extraction. Anal Bio- chcm 162:156-159.
DiTella M, Feiguin F, Morfini G, Caceres A (1994) Microfilament- associated growth cone component depends upon tau for its intracellu- lar localization. Cell Motil Cytoskelcton 29:117-130.
Drubin DC, Kirschner M W (1986) Tau protein function in living cells. J Cell Biol 103:2739-2746.
Drubin DC, Feinstein SC, Shooter EM, Kirschncr MW (1985) Nerve growth factor induced outgrowth in PC12 cells involves the coordinate induction of microtubule assembly and assembly promoting factors. J Cell Biol 101:1799-1807.
Drubin D, Kobayashi S, Kellogg D, Kirschncr M (1988) Regulation of microtubule protein levels during cellular morphogcncsis in nerve growth factor-treated PC12 cells. J Cell Biol 106:1583-1591.
Edson KJ, Lim S-S, Borisy GG, Letourneau PC (1993) FRAP analysis of the stability of the microtubule population along the neurites of chick sensory neurons. Cell Motil Cytoskeleton 25:59-72.
Esmaeli-Azad B, McCarty JH, Feinstein SC (1994) Sense and anti-sense transfection analysis of tau function: tau influences net microtubulc assembly, neurite outgrowth, and neuritic stability. J Cell Sci 107:869-879.
Ferreira A, Busciglio J, Caceres A (1989) Microtubule foramtion and neurite growth in cerebellar macroneurons which develop in virro: evidence for the involvement of microtubule associate proteins MAPla, HMW-MAPZ, and tau. Dev Brain Res 49:215-228.
Fischer I, Romano-Clarke G (1991) Association of microtubule-associated protein (MAPIB) with growing axons in cultured hippocampal neurons. Mol Cell Neurosci 2:39-51.
Black et al. . Tau in Growing Axons J. Neurosci., June 1, 1996, 16(11):3601-3619 3619
Goedert M, Spillantini MG, Crowther RA (1992) Cloning of big tau microtubule-associated protein characteristic of the peripheral nervous system. Proc Nat1 Acad Sci USA 89:1983-1987.
Goode BL, Feinstein SC (1994) Identfication of a novel microtubule binding ans assembly domain in the developmentally regulated inter- repeat region of tau. J Cell Biol 124:769-782.
Griffith H, Pollard TD (1982) The interactin of actin filaments with microtubules and microtubule associated proteins. J Biol Chem 257:9143-9151.
Gundersen GG, Khawaja S, Bulinski JC (1987) Post-polymerization de- tyrosination of a-tubulin: a mechanism for subcellular differentiation of microtubules. J Cell Biol 10.5:251-264.
Hanemaaijer R, Ginzberg I (1991) Involvement of mature tau isoforms in the stabilization of neurites in PC12 cells. J Neurosci Res 30:163-171.
Harada H, Oguuchi K, Okabe S, Kuno J, Terada S, Oshima T, Sato- Yoshitake R, Take1 Y, Noda T, Hirokawa N (1994) Altered microtu- bule organization in small-caliber axons of mice lacking tau protein. Nature 369:488-491.
Hirokawa N (1994) Microtuble organization and dynamics dependent on microtubule-associated proteins.-Curr Opin Cell- Biol 6:74-81.
Knops J, Kosik KS, Lee G, Pardee JD, Cohen GL, McConlogus L (1991) Overexpression of tau in nonneuronal cells induces long cellular pro- cesses. J Cell Biol 114:725-733.
KotamS. Hishida E. Kumaaai H. Sakai H (1985) Calmodulin inhibits the - \ , interaction of actin with MAP2 and tau, two major microtubule asso- ciated proteins. J Biol Chem 260: 10779-107X3.
Lee G (1993) Non-motor microtubule-associated proteins. Curr Opin Cell Biol 5:88-94.
Lee G, Rook SL (1992) Expression of tau protein in nonncuronal cells: microtubule hinding and stabilization. J Ccl1 Sci 102:227-237.
Leger JG, Brandt R, Lee G (1994) Identification of tau protein regions required for process formation in PC12 cells. J Cell Sci 107:3403-3412.
Li Y, Black MM (1996) Microtubule assembly and turnover in growing axons. J Neurosci 15:531-544.
Lim S-S, Sammak PJ, Borisy GG (1989) Progressive and spatially differ- entiated stability of microtubules in developing neuronal cells. J Cell Biol 109:253-263.
Mandell JW, Banker GA (1995) The microtubule cytoskeleton and the development of neuronal polarity. Neurobiol Aging 16:229-238.
Matus A (1991) Mictubule-associated proteins and neuronal morpho- genesis. J Cell Sci [Suppl] 15:61-67.
Miyata Y, Hoshi M, Nishida E, Minami Y, Sakai H (1986) Binding of microtubule-associated protein 2 and tau to the intermediate filaments reassembled from neurofilament 70-fDa subunit protein. J Biol Chem 261:13026-13030.
Moble WC, Shenker A, Shooter EM (1976) Characterization and isola- tion of proteolytically modified nerve growth factor. Biochemistry 15:5543-5551.
Noble M, Lewis SA, Cowan NJ (1989) The microtuble binding domain of microtubule associated protein lb contains a repeated sequence motif unrelated to that of MAP2 and tau. J Cell Biol 109:3367-3376.
Peng I, Binder LI, Black MM (1985) Cultured neurons contain a variety of microtubule-associated proteins. Brain Res 36 1:200-2 11.
Pryer NK, Walker RA, Skeen VP, Bourns BD, Soboeiro MF, Salmon ED (1992) Brain microtubule-associated proteins modulate microtubule dynamic instability in vitro. Real-time observations using video micros- copy. J Cell Sci 103:965-976.
Schliwa M, van Blerkom JJ (1981) Structural interactions of cytoskelctal components. J Cell Biol 90:222-235.
Schoenfeld TA, Obar RA (19’34) D’ averse distribution and function of fibrous microtubule-associated proteins in the nervous system. Int Rev Cytol 151:67-137.
Seldon SC, Pollard TD (1983) Phosphorylation of microtubule- associated proteins regulates their interaction with microfilaments. J Biol Chem 258:7064-707 I.
Takemura R, Okabc S, Umcyama T, Kanai Y, Cowan NJ. Hirokawa N (1992) Increased microtubulc stability and alpha-tubulin acctylation in cells transfected with microtubulc-associated proteins MAPIB, MAP2 or tau. J Ccl1 Sci 103:953-964.
Trinczck B, Bicrnat J, Baumann K, Mandclkow E, Mandclkow E (19Y5) Domains of tau protein, differential phosphorylation, and dynamic instability of microtubules. Mel Biol Cell 6: 1887-1902.
Tucker RP (1990) The role of microtubule-associated proteins in brain morphogcnesis: a review. Brain Res Rev 15:109-120.
Vallee RB (1982) A taxol-dependent procedure for the isolation of mi- crotubules and microtubule-associated proteins (MAPS). J Cell Biol 92~435-442.
Wiche G, Oberkanins C, Himmler A (1991) Molecular structure and function of microtubule-associated proteins. Int Rev Cytol 1241217-273.