33
Taubman Centers, Inc. Investor Presentation March 2016
| Date post: | 23-Aug-2019 |
| Category: |
Documents |
| Upload: | trinhxuyen |
| View: | 214 times |
| Download: | 0 times |
Taubman Centers, Inc.Investor Presentation
March 2016
2
Who We Are – Over 65 Years in Business!
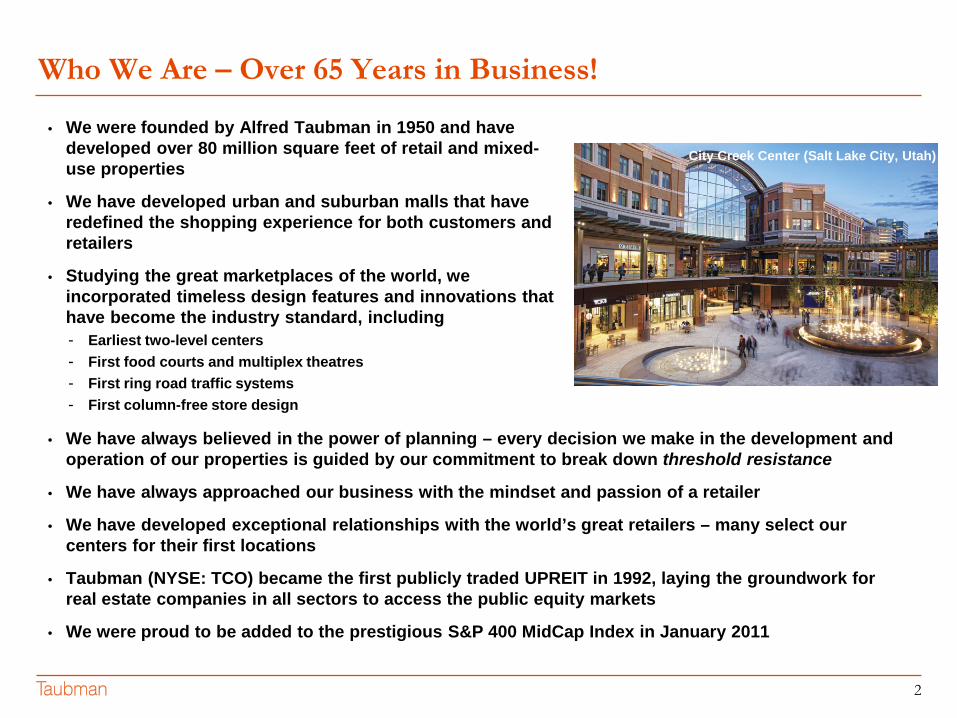
• We were founded by Alfred Taubman in 1950 and have developed over 80 million square feet of retail and mixed-use properties
• We have developed urban and suburban malls that have redefined the shopping experience for both customers and retailers
• Studying the great marketplaces of the world, we incorporated timeless design features and innovations that have become the industry standard, including - Earliest two-level centers- First food courts and multiplex theatres- First ring road traffic systems - First column-free store design
• We have always believed in the power of planning – every decision we make in the development and operation of our properties is guided by our commitment to break down threshold resistance
• We have always approached our business with the mindset and passion of a retailer
• We have developed exceptional relationships with the world’s great retailers – many select our centers for their first locations
• Taubman (NYSE: TCO) became the first publicly traded UPREIT in 1992, laying the groundwork for real estate companies in all sectors to access the public equity markets
• We were proud to be added to the prestigious S&P 400 MidCap Index in January 2011
The Mall at Millenia (Orlando, Fla.)
City Creek Center (Salt Lake City, Utah)
3
Our Mission and Values
The Taubman Mission
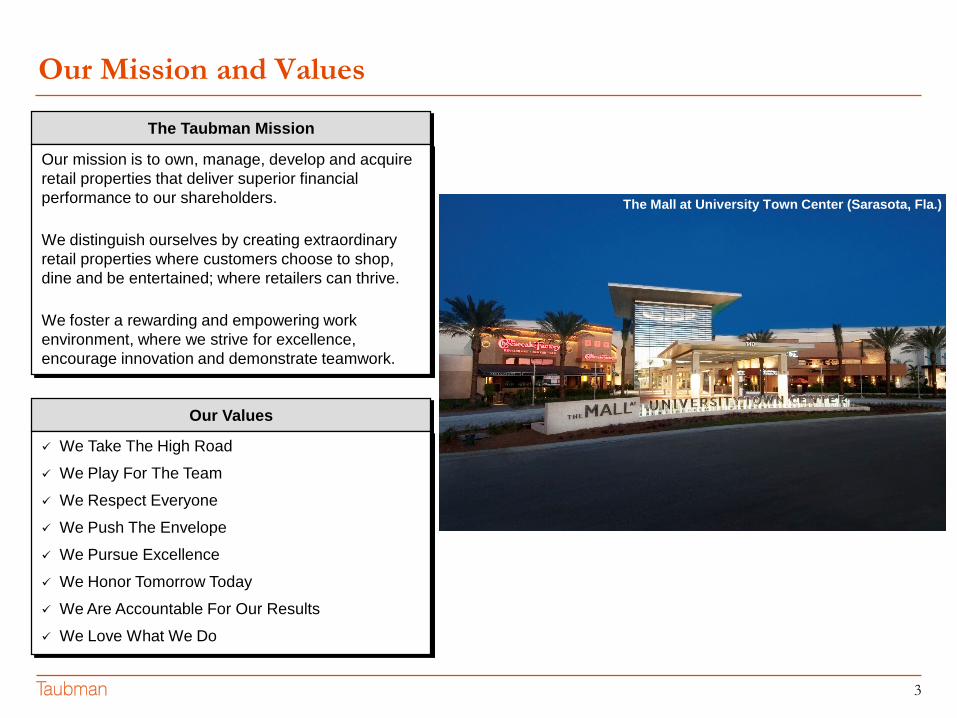
Our mission is to own, manage, develop and acquire retail properties that deliver superior financial performance to our shareholders.
We distinguish ourselves by creating extraordinary retail properties where customers choose to shop, dine and be entertained; where retailers can thrive.
We foster a rewarding and empowering work environment, where we strive for excellence, encourage innovation and demonstrate teamwork.
Our Values
We Take The High Road We Play For The Team We Respect Everyone We Push The Envelope We Pursue Excellence We Honor Tomorrow Today We Are Accountable For Our Results We Love What We Do
The Mall at University Town Center (Sarasota, Fla.)
4
Our Points of Difference
• Retailing is in our DNA - Our approach is with a deep respect for and
knowledge of our customers – both shoppers and retailers
• We have an experienced, cycle-tested management team - Members of the Operating Committee have
been with Taubman for, on average, 15 years• We strive for quality rather than sheer size
- Our portfolio is large enough to give us important economies of scale and solidify our relationships with the world’s best retailers
- Yet not so large that we can’t maximize the potential of every property – every asset receives the attention of senior management
• We sweat every detail of the plan- While cultures vary from place to place, there
are universal elements to the way people shop, move through and experience retail environments
- Getting the development planning right to maximize productivity is one of Taubman’s most valuable and exportable strengths
• We intensively manage every center- We continually reinvest in our assets – since
2008 we have renovated, expanded or built from scratch over half of our centers
- Rising rent from new tenants and lease rollovers is the most significant element of our organic growth
- Income is further bolstered by “non-traditional” and innovative sources such as corporate sponsorships, kiosks and temporary tenants
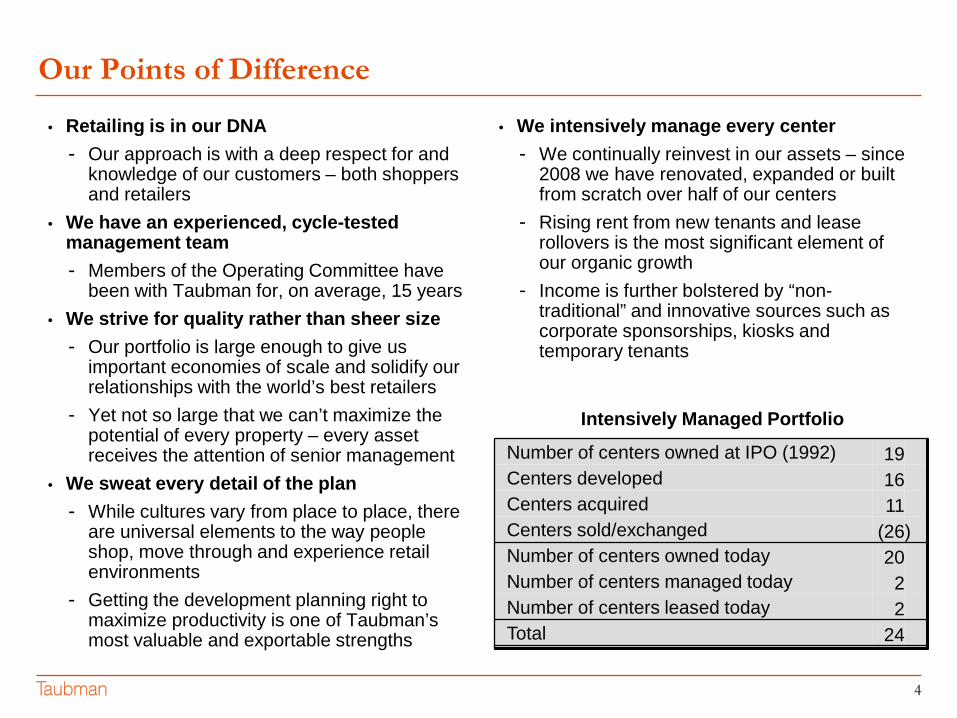
Intensively Managed Portfolio
Number of centers owned at IPO (1992) 19 Centers developed 16Centers acquired 11Centers sold/exchanged (26)Number of centers owned today 20Number of centers managed today 2Number of centers leased today 2Total 24
5
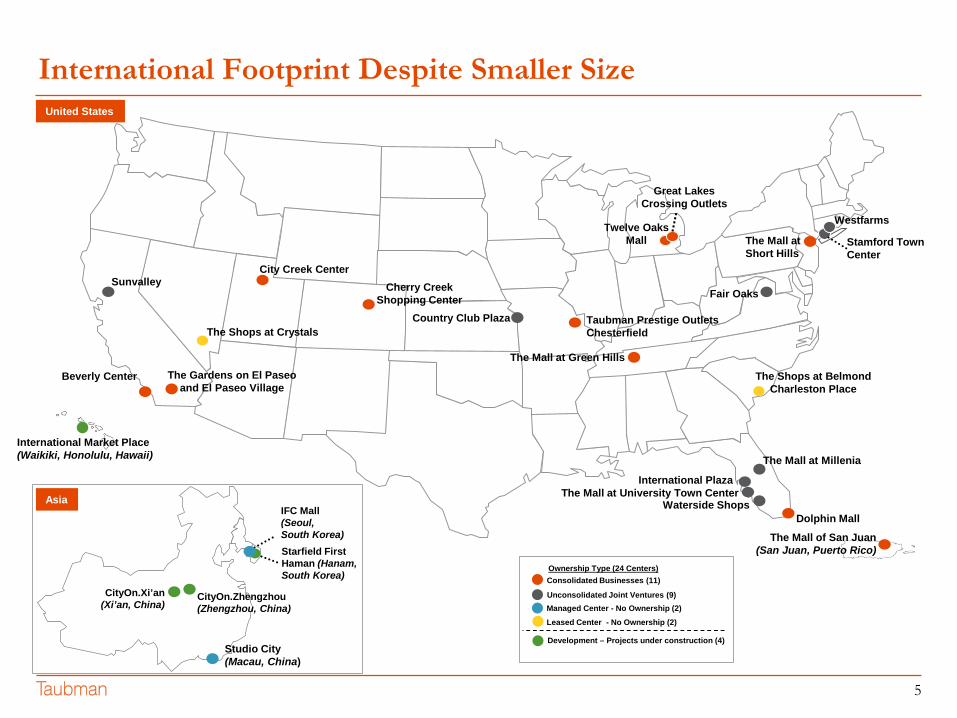
International Footprint Despite Smaller Size
Great Lakes Crossing Outlets
WestfarmsTwelve Oaks Mall
Sunvalley
Beverly Center
Cherry Creek Shopping Center
The Mall at Short Hills
Fair Oaks
Stamford Town Center
The Mall at Millenia
Dolphin MallWaterside Shops
International Plaza
The Shops at Crystals
The Shops at Belmond Charleston Place
City Creek Center
Ownership Type (24 Centers)
Unconsolidated Joint Ventures (9)
Consolidated Businesses (11)
Managed Center - No Ownership (2)Leased Center - No Ownership (2)
Development – Projects under construction (4)
The Gardens on El Paseo and El Paseo Village
The Mall at Green Hills
The Mall at University Town Center
Taubman Prestige Outlets Chesterfield
The Mall of San Juan(San Juan, Puerto Rico)
CityOn.Xi’an(Xi’an, China)
IFC Mall(Seoul, South Korea)Starfield First Haman (Hanam, South Korea)
CityOn.Zhengzhou(Zhengzhou, China)
International Market Place (Waikiki, Honolulu, Hawaii)
United States
Asia
Studio City(Macau, China)
Country Club Plaza
6
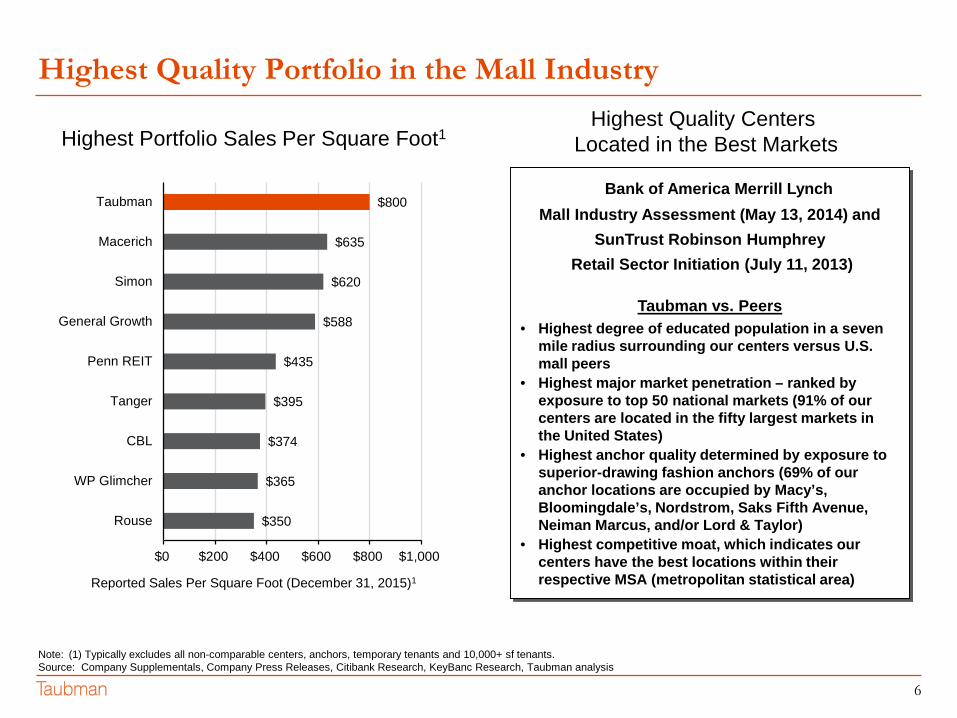
Highest Quality Portfolio in the Mall Industry
Note: (1) Typically excludes all non-comparable centers, anchors, temporary tenants and 10,000+ sf tenants. Source: Company Supplementals, Company Press Releases, Citibank Research, KeyBanc Research, Taubman analysis
Reported Sales Per Square Foot (December 31, 2015)1
Highest Portfolio Sales Per Square Foot1Highest Quality Centers
Located in the Best Markets
$350
$365
$374
$395
$435
$588
$620
$635
$800
$0 $200 $400 $600 $800 $1,000
Rouse
WP Glimcher
CBL
Tanger
Penn REIT
General Growth
Simon
Macerich
TaubmanBank of America Merrill Lynch
Mall Industry Assessment (May 13, 2014) andSunTrust Robinson Humphrey
Retail Sector Initiation (July 11, 2013)
Taubman vs. Peers• Highest degree of educated population in a seven
mile radius surrounding our centers versus U.S. mall peers
• Highest major market penetration – ranked by exposure to top 50 national markets (91% of our centers are located in the fifty largest markets in the United States)
• Highest anchor quality determined by exposure to superior-drawing fashion anchors (69% of our anchor locations are occupied by Macy’s, Bloomingdale’s, Nordstrom, Saks Fifth Avenue, Neiman Marcus, and/or Lord & Taylor)
• Highest competitive moat, which indicates our centers have the best locations within their respective MSA (metropolitan statistical area)
7
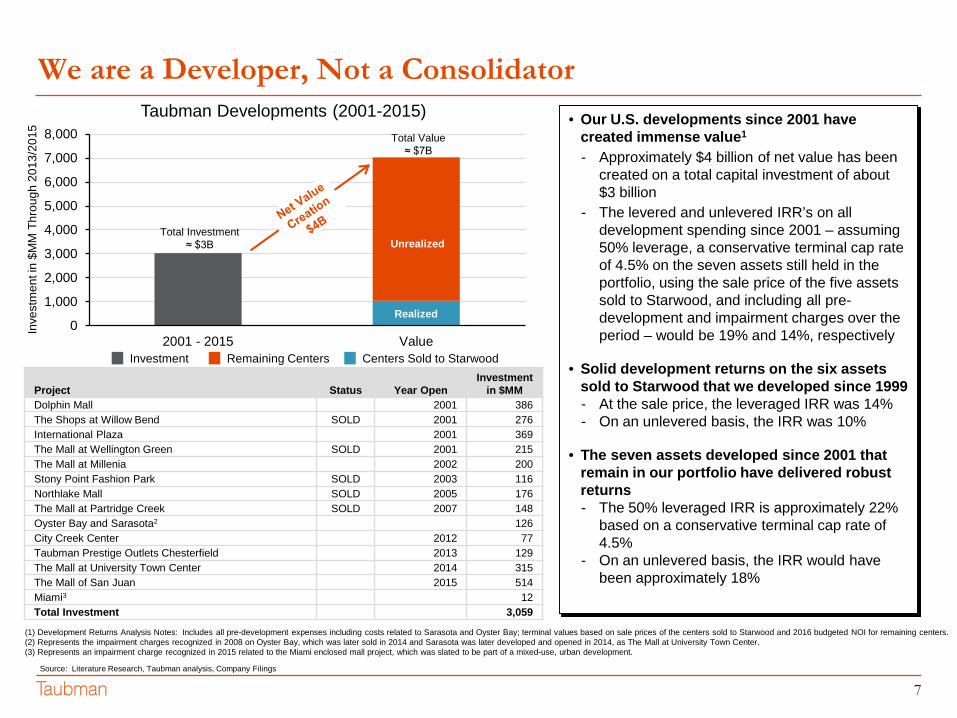
We are a Developer, Not a Consolidator
Project Status Year OpenInvestment
in $MMDolphin Mall 2001 386The Shops at Willow Bend SOLD 2001 276International Plaza 2001 369The Mall at Wellington Green SOLD 2001 215The Mall at Millenia 2002 200Stony Point Fashion Park SOLD 2003 116Northlake Mall SOLD 2005 176The Mall at Partridge Creek SOLD 2007 148Oyster Bay and Sarasota2 126City Creek Center 2012 77Taubman Prestige Outlets Chesterfield 2013 129The Mall at University Town Center 2014 315The Mall of San Juan 2015 514Miami3 12Total Investment 3,059
Taubman Developments (2001-2015) • Our U.S. developments since 2001 have created immense value1
- Approximately $4 billion of net value has been created on a total capital investment of about $3 billion
- The levered and unlevered IRR’s on all development spending since 2001 – assuming 50% leverage, a conservative terminal cap rate of 4.5% on the seven assets still held in the portfolio, using the sale price of the five assets sold to Starwood, and including all pre-development and impairment charges over the period – would be 19% and 14%, respectively
• Solid development returns on the six assets sold to Starwood that we developed since 1999- At the sale price, the leveraged IRR was 14% - On an unlevered basis, the IRR was 10%
• The seven assets developed since 2001 that remain in our portfolio have delivered robust returns - The 50% leveraged IRR is approximately 22%
based on a conservative terminal cap rate of 4.5%
- On an unlevered basis, the IRR would have been approximately 18%
Source: Literature Research, Taubman analysis, Company Filings
0
1,000
2,000
3,000
4,000
5,000
6,000
7,000
8,000
2001 - 2015 Value
Inve
stm
ent i
n $M
M T
hrou
gh 2
013/
2015
Total Investment ≈ $3B
Total Value ≈ $7B
Investment Remaining Centers Centers Sold to Starwood
Realized
Unrealized
(1) Development Returns Analysis Notes: Includes all pre-development expenses including costs related to Sarasota and Oyster Bay; terminal values based on sale prices of the centers sold to Starwood and 2016 budgeted NOI for remaining centers.(2) Represents the impairment charges recognized in 2008 on Oyster Bay, which was later sold in 2014 and Sarasota was later developed and opened in 2014, as The Mall at University Town Center.(3) Represents an impairment charge recognized in 2015 related to the Miami enclosed mall project, which was slated to be part of a mixed-use, urban development.
8
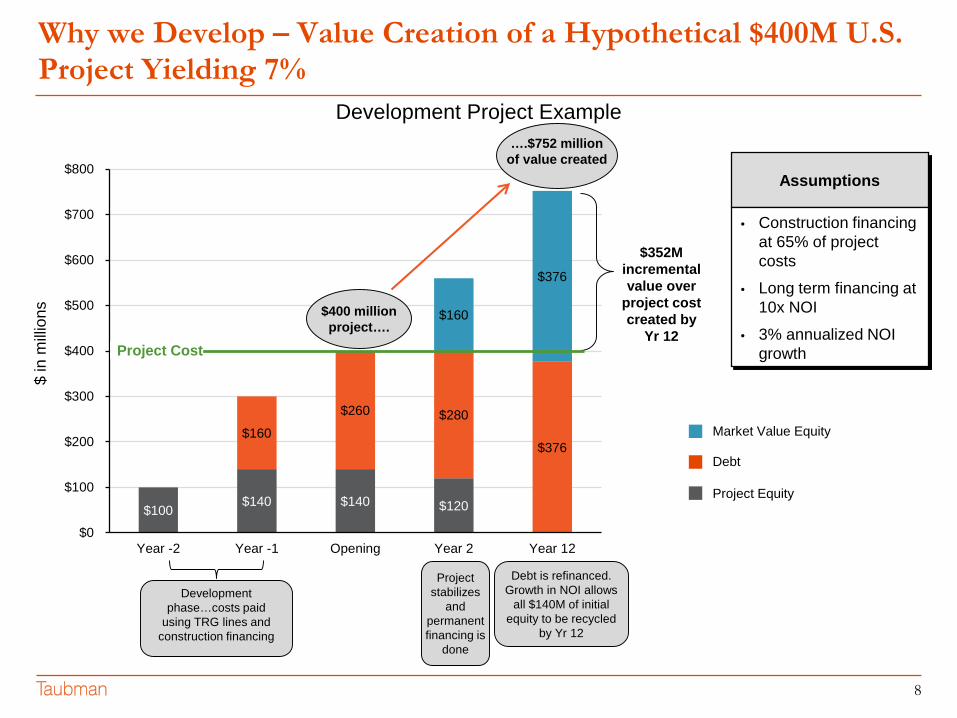
Why we Develop – Value Creation of a Hypothetical $400M U.S. Project Yielding 7%
$100 $140 $140 $120
$160
$260 $280
$376
$160
$376
$0
$100
$200
$300
$400
$500
$600
$700
$800
Year -2 Year -1 Opening Year 2 Year 12
$352M incremental value over
project cost created by
Yr 12
$ in
milli
ons
Market Value Equity
Debt
Project Equity
Project Cost
$400 million project….
….$752 million of value created
Debt is refinanced. Growth in NOI allows
all $140M of initial equity to be recycled
by Yr 12
Project stabilizes
and permanent financing is
done
Development phase…costs paid
using TRG lines and construction financing
Assumptions
• Construction financing at 65% of project costs
• Long term financing at 10x NOI
• 3% annualized NOI growth
Development Project Example
9
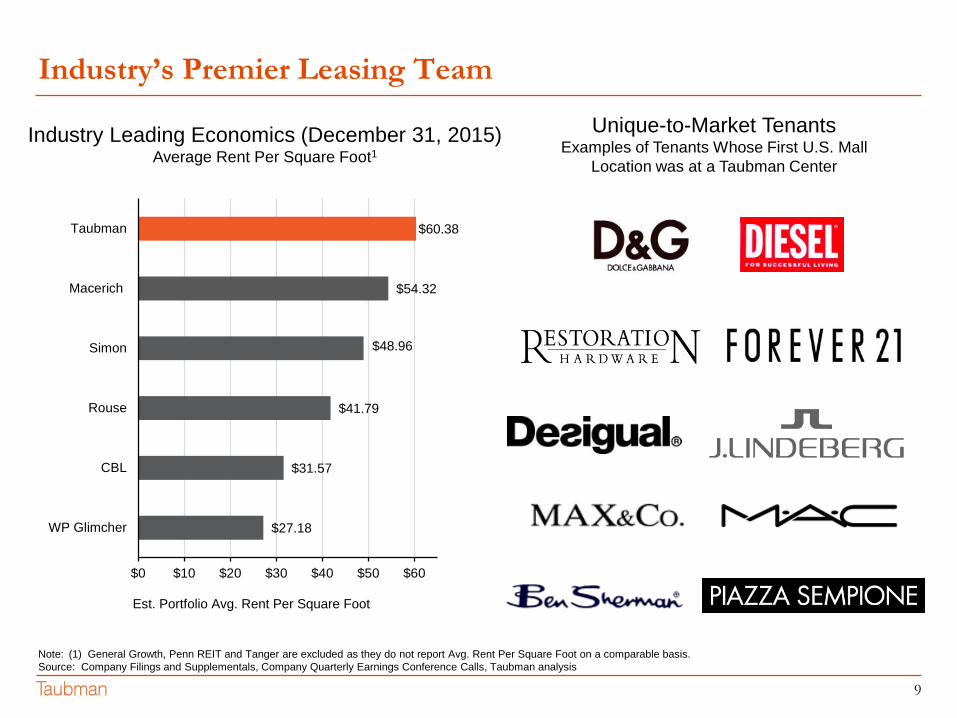
Industry’s Premier Leasing Team
Industry Leading Economics (December 31, 2015)Average Rent Per Square Foot1
Note: (1) General Growth, Penn REIT and Tanger are excluded as they do not report Avg. Rent Per Square Foot on a comparable basis.Source: Company Filings and Supplementals, Company Quarterly Earnings Conference Calls, Taubman analysis
Unique-to-Market TenantsExamples of Tenants Whose First U.S. Mall
Location was at a Taubman Center
Est. Portfolio Avg. Rent Per Square Foot
$27.18
$31.57
$41.79
$48.96
$54.32
$60.38
$0 $10 $20 $30 $40 $50 $60
WP Glimcher
CBL
Rouse
Simon
Macerich
Taubman
10
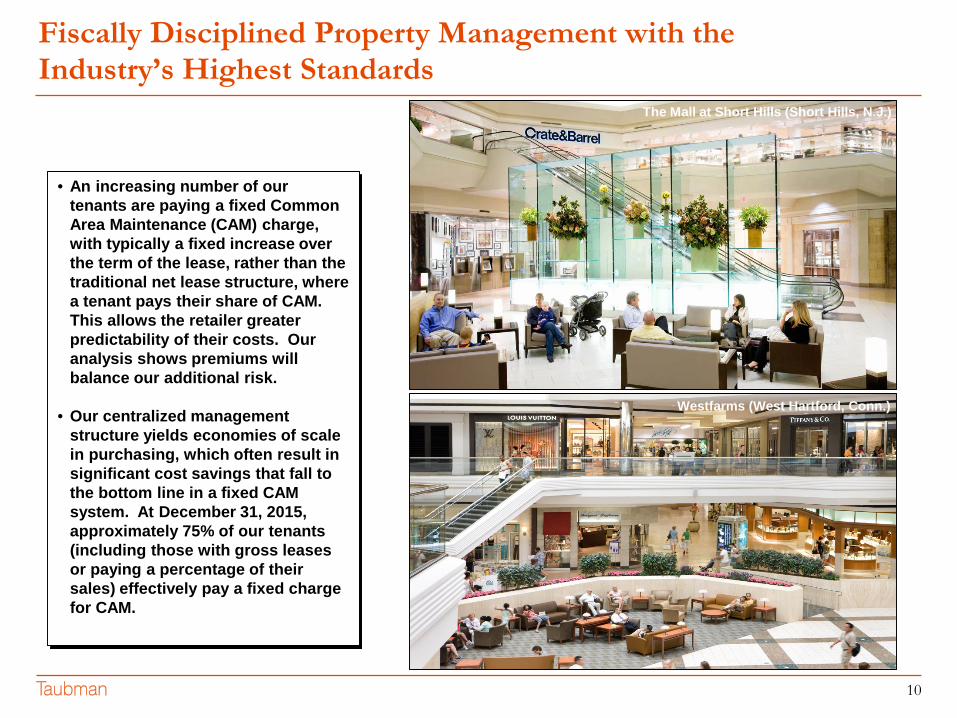
Fiscally Disciplined Property Management with the Industry’s Highest Standards
The Mall at Short Hills (Short Hills, N.J.)
• An increasing number of our tenants are paying a fixed Common Area Maintenance (CAM) charge, with typically a fixed increase over the term of the lease, rather than the traditional net lease structure, where a tenant pays their share of CAM. This allows the retailer greater predictability of their costs. Our analysis shows premiums will balance our additional risk.
• Our centralized management structure yields economies of scale in purchasing, which often result in significant cost savings that fall to the bottom line in a fixed CAM system. At December 31, 2015, approximately 75% of our tenants (including those with gross leases or paying a percentage of their sales) effectively pay a fixed charge for CAM.
Westfarms (West Hartford, Conn.)
11
0%
1%
2%
3%
4%
5%
6%
7%
8%
2011 2012 2013 2014 2015
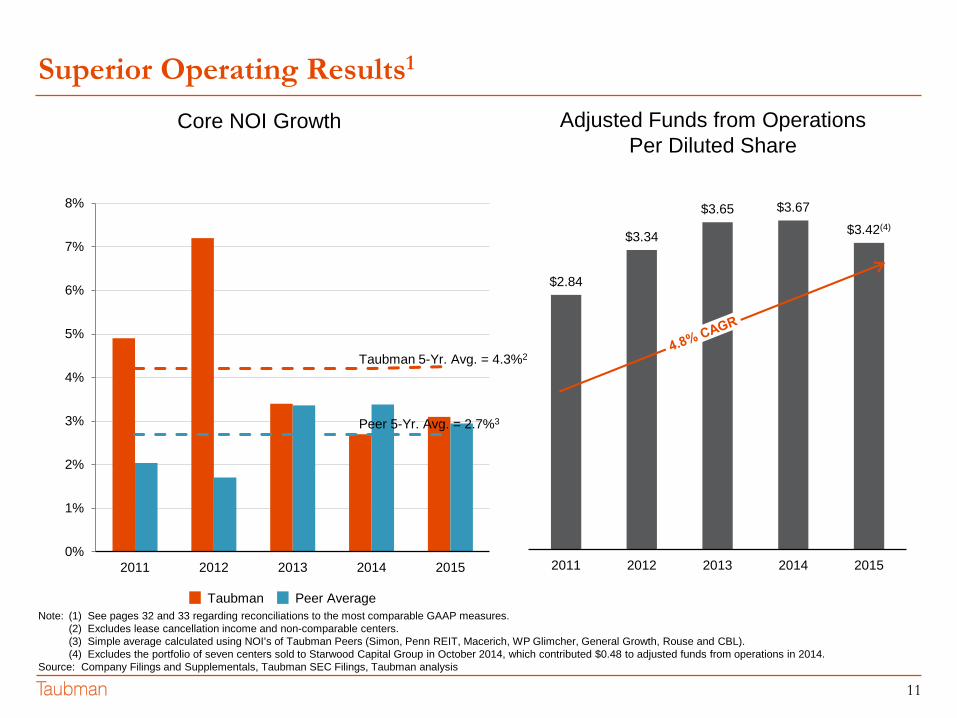
Superior Operating Results1
$2.84
$3.34
$3.65 $3.67$3.42(4)
2011 2012 2013 2014 2015
Note: (1) See pages 32 and 33 regarding reconciliations to the most comparable GAAP measures.(2) Excludes lease cancellation income and non-comparable centers.(3) Simple average calculated using NOI’s of Taubman Peers (Simon, Penn REIT, Macerich, WP Glimcher, General Growth, Rouse and CBL).(4) Excludes the portfolio of seven centers sold to Starwood Capital Group in October 2014, which contributed $0.48 to adjusted funds from operations in 2014.
Source: Company Filings and Supplementals, Taubman SEC Filings, Taubman analysis
Adjusted Funds from OperationsPer Diluted Share
Core NOI Growth
Taubman Peer Average
Taubman 5-Yr. Avg. = 4.3%2
Peer 5-Yr. Avg. = 2.7%3
12
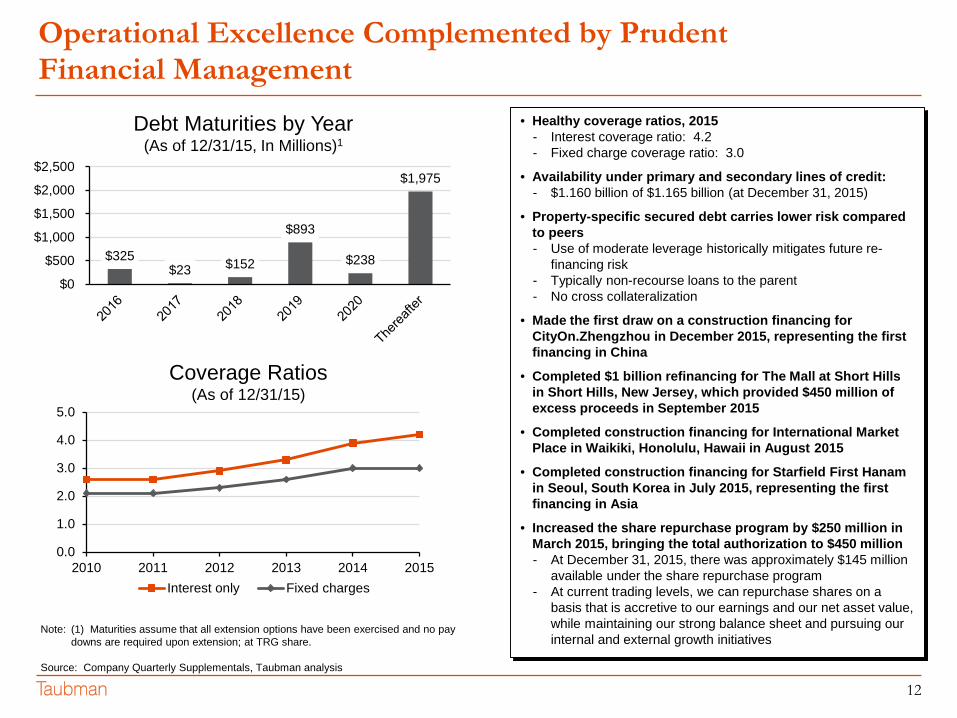
Operational Excellence Complemented by Prudent Financial Management
Note: (1) Maturities assume that all extension options have been exercised and no pay downs are required upon extension; at TRG share.
Source: Company Quarterly Supplementals, Taubman analysis
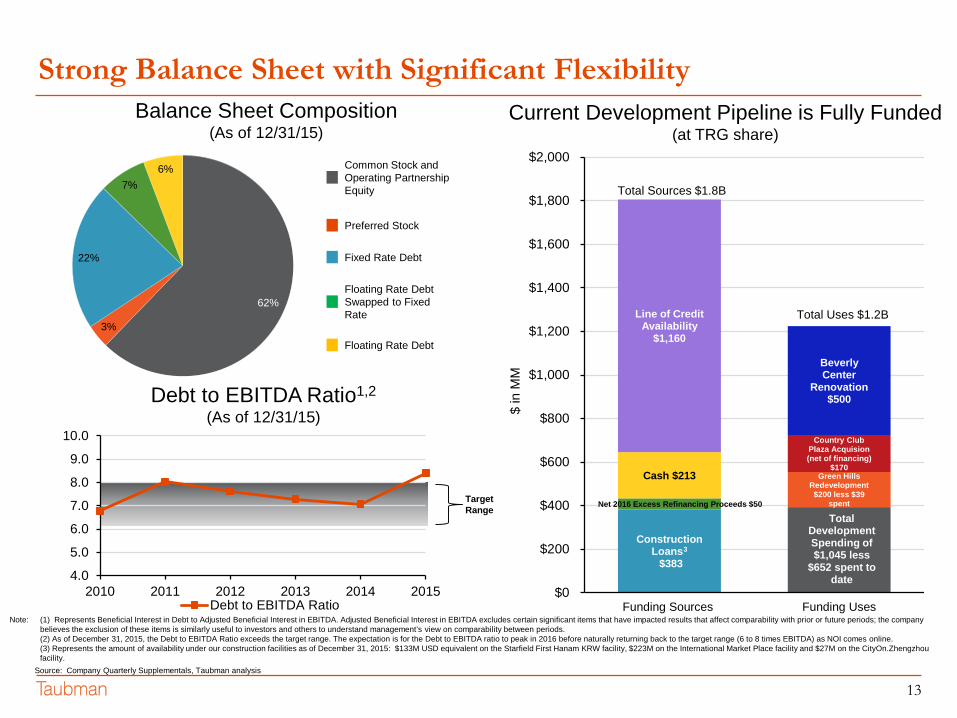
• Healthy coverage ratios, 2015- Interest coverage ratio: 4.2- Fixed charge coverage ratio: 3.0
• Availability under primary and secondary lines of credit: - $1.160 billion of $1.165 billion (at December 31, 2015)
• Property-specific secured debt carries lower risk compared to peers- Use of moderate leverage historically mitigates future re-
financing risk- Typically non-recourse loans to the parent- No cross collateralization
• Made the first draw on a construction financing for CityOn.Zhengzhou in December 2015, representing the first financing in China
• Completed $1 billion refinancing for The Mall at Short Hills in Short Hills, New Jersey, which provided $450 million of excess proceeds in September 2015
• Completed construction financing for International Market Place in Waikiki, Honolulu, Hawaii in August 2015
• Completed construction financing for Starfield First Hanamin Seoul, South Korea in July 2015, representing the first financing in Asia
• Increased the share repurchase program by $250 million in March 2015, bringing the total authorization to $450 million- At December 31, 2015, there was approximately $145 million
available under the share repurchase program- At current trading levels, we can repurchase shares on a
basis that is accretive to our earnings and our net asset value, while maintaining our strong balance sheet and pursuing our internal and external growth initiatives
Coverage Ratios(As of 12/31/15)
$325 $23 $152
$893
$238
$1,975
$0
$500
$1,000
$1,500
$2,000
$2,500
Debt Maturities by Year(As of 12/31/15, In Millions)1
0.0
1.0
2.0
3.0
4.0
5.0
2010 2011 2012 2013 2014 2015Interest only Fixed charges
13Source: Company Quarterly Supplementals, Taubman analysis
4.0
5.0
6.0
7.0
8.0
9.0
10.0
2010 2011 2012 2013 2014 2015Debt to EBITDA Ratio
62%
3%
22%
7%6% Common Stock and
Operating Partnership Equity
Preferred Stock
Fixed Rate Debt
Floating Rate Debt Swapped to Fixed Rate
Floating Rate Debt
Strong Balance Sheet with Significant FlexibilityBalance Sheet Composition
(As of 12/31/15)
Debt to EBITDA Ratio1,2
(As of 12/31/15)
Total Development Spending of $1,045 less
$652 spent to date
Green Hills Redevelopment $200 less $39
spent
Construction Loans2
3
$383
Net 2016 Excess Refinancing Proceeds $50
Cash $213
Line of Credit Availability
$1,160
Country Club Plaza Acquision (net of financing)
$170
Beverly Center
Renovation$500
$0
$200
$400
$600
$800
$1,000
$1,200
$1,400
$1,600
$1,800
$2,000
Funding Sources Funding Uses
Total Uses $1.2B
Total Sources $1.8B
$ in
MM
Current Development Pipeline is Fully Funded(at TRG share)
Target Range
Note: (1) Represents Beneficial Interest in Debt to Adjusted Beneficial Interest in EBITDA. Adjusted Beneficial Interest in EBITDA excludes certain significant items that have impacted results that affect comparability with prior or future periods; the company believes the exclusion of these items is similarly useful to investors and others to understand management’s view on comparability between periods.(2) As of December 31, 2015, the Debt to EBITDA Ratio exceeds the target range. The expectation is for the Debt to EBITDA ratio to peak in 2016 before naturally returning back to the target range (6 to 8 times EBITDA) as NOI comes online.(3) Represents the amount of availability under our construction facilities as of December 31, 2015: $133M USD equivalent on the Starfield First Hanam KRW facility, $223M on the International Market Place facility and $27M on the CityOn.Zhengzhoufacility.
14
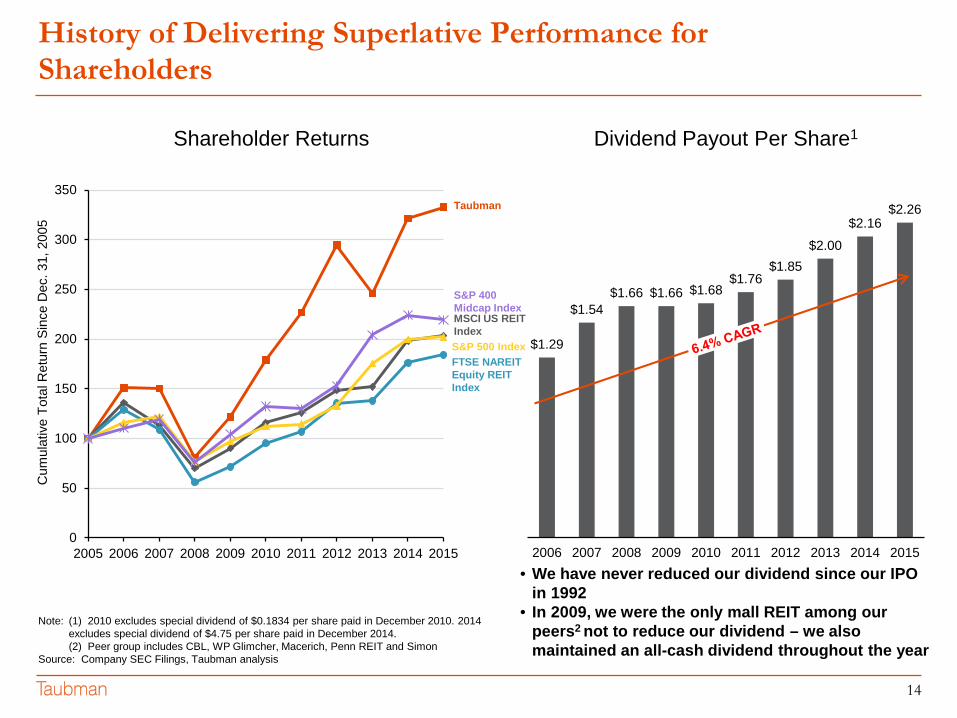
History of Delivering Superlative Performance for Shareholders
$1.29
$1.54$1.66 $1.66 $1.68
$1.76$1.85
$2.00$2.16
$2.26
2006 2007 2008 2009 2010 2011 2012 2013 2014 20150
50
100
150
200
250
300
350
2005 2006 2007 2008 2009 2010 2011 2012 2013 2014 2015
Note: (1) 2010 excludes special dividend of $0.1834 per share paid in December 2010. 2014 excludes special dividend of $4.75 per share paid in December 2014.(2) Peer group includes CBL, WP Glimcher, Macerich, Penn REIT and Simon
Source: Company SEC Filings, Taubman analysis
Cum
ulat
ive
Tota
l Ret
urn
Sinc
e D
ec. 3
1, 2
005
Shareholder Returns Dividend Payout Per Share1
Taubman
S&P 500 IndexFTSE NAREIT Equity REIT Index
MSCI US REIT Index
• We have never reduced our dividend since our IPO in 1992
• In 2009, we were the only mall REIT among our peers2 not to reduce our dividend – we also maintained an all-cash dividend throughout the year
S&P 400 Midcap Index

Client Name | Lorem Ipsum | Month 12, 2010
Future Growth
16
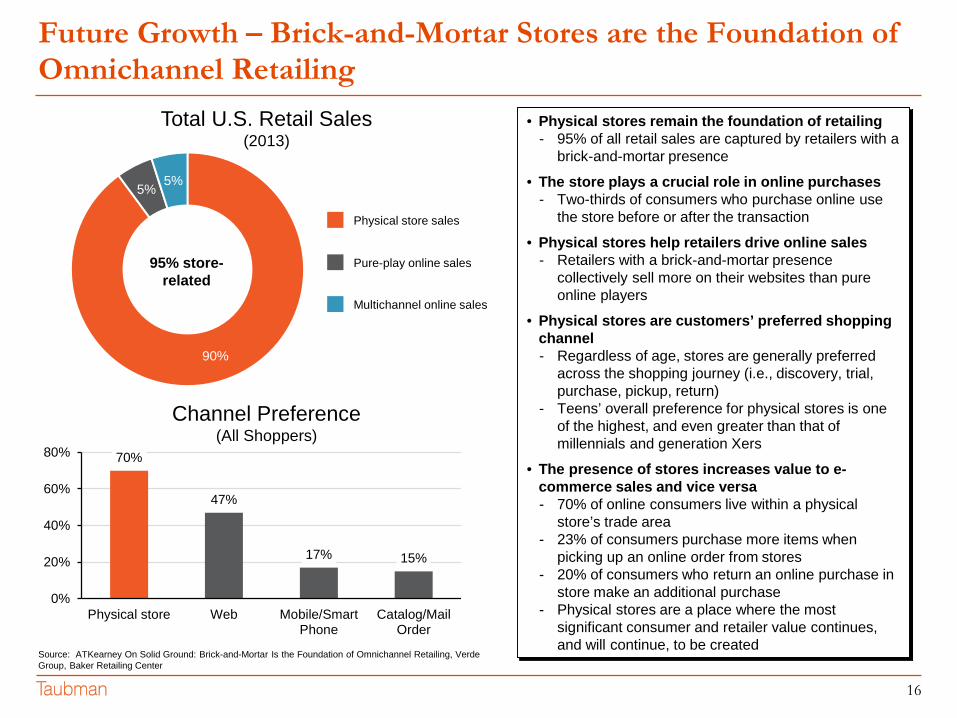
90%
5% 5%
Future Growth – Brick-and-Mortar Stores are the Foundation of Omnichannel Retailing
Physical store sales
Pure-play online sales
Multichannel online sales
Total U.S. Retail Sales(2013)
95% store-related
• Physical stores remain the foundation of retailing- 95% of all retail sales are captured by retailers with a
brick-and-mortar presence
• The store plays a crucial role in online purchases- Two-thirds of consumers who purchase online use
the store before or after the transaction
• Physical stores help retailers drive online sales- Retailers with a brick-and-mortar presence
collectively sell more on their websites than pure online players
• Physical stores are customers’ preferred shopping channel- Regardless of age, stores are generally preferred
across the shopping journey (i.e., discovery, trial, purchase, pickup, return)
- Teens’ overall preference for physical stores is one of the highest, and even greater than that of millennials and generation Xers
• The presence of stores increases value to e-commerce sales and vice versa- 70% of online consumers live within a physical
store’s trade area- 23% of consumers purchase more items when
picking up an online order from stores- 20% of consumers who return an online purchase in
store make an additional purchase- Physical stores are a place where the most
significant consumer and retailer value continues, and will continue, to be created
Source: ATKearney On Solid Ground: Brick-and-Mortar Is the Foundation of Omnichannel Retailing, Verde Group, Baker Retailing Center
70%
47%
17% 15%
0%
20%
40%
60%
80%
Physical store Web Mobile/SmartPhone
Catalog/MailOrder
Channel Preference(All Shoppers)
17
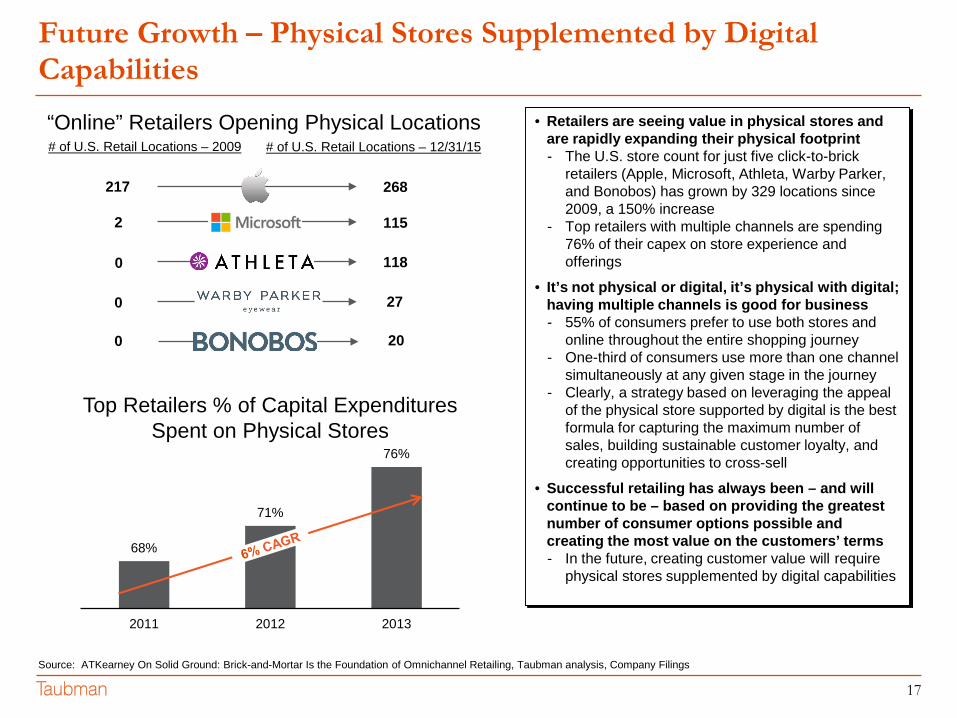
Future Growth – Physical Stores Supplemented by Digital Capabilities
68%
71%
76%
2011 2012 2013
Top Retailers % of Capital Expenditures Spent on Physical Stores
• Retailers are seeing value in physical stores and are rapidly expanding their physical footprint- The U.S. store count for just five click-to-brick
retailers (Apple, Microsoft, Athleta, Warby Parker, and Bonobos) has grown by 329 locations since 2009, a 150% increase
- Top retailers with multiple channels are spending 76% of their capex on store experience and offerings
• It’s not physical or digital, it’s physical with digital; having multiple channels is good for business- 55% of consumers prefer to use both stores and
online throughout the entire shopping journey- One-third of consumers use more than one channel
simultaneously at any given stage in the journey- Clearly, a strategy based on leveraging the appeal
of the physical store supported by digital is the best formula for capturing the maximum number of sales, building sustainable customer loyalty, and creating opportunities to cross-sell
• Successful retailing has always been – and will continue to be – based on providing the greatest number of consumer options possible and creating the most value on the customers’ terms- In the future, creating customer value will require
physical stores supplemented by digital capabilities
Source: ATKearney On Solid Ground: Brick-and-Mortar Is the Foundation of Omnichannel Retailing, Taubman analysis, Company Filings
“Online” Retailers Opening Physical Locations# of U.S. Retail Locations – 2009 # of U.S. Retail Locations – 12/31/15
1152
1180
0
0
27
20
217 268
18
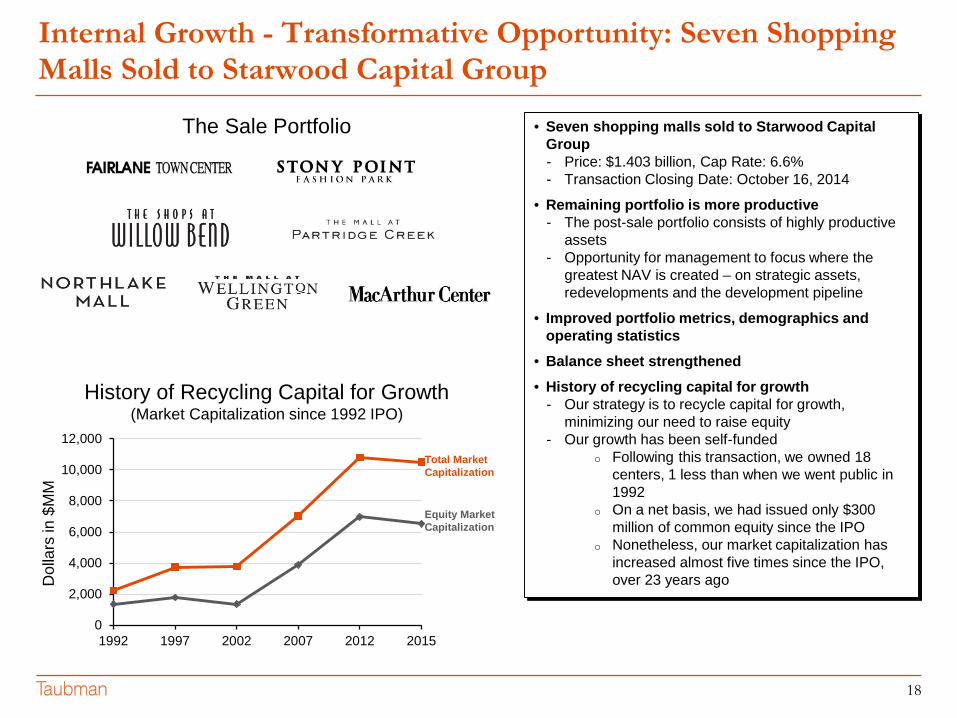
Internal Growth - Transformative Opportunity: Seven Shopping Malls Sold to Starwood Capital Group
The Sale Portfolio
History of Recycling Capital for Growth(Market Capitalization since 1992 IPO)
• Seven shopping malls sold to Starwood Capital Group- Price: $1.403 billion, Cap Rate: 6.6% - Transaction Closing Date: October 16, 2014
• Remaining portfolio is more productive- The post-sale portfolio consists of highly productive
assets- Opportunity for management to focus where the
greatest NAV is created – on strategic assets, redevelopments and the development pipeline
• Improved portfolio metrics, demographics and operating statistics
• Balance sheet strengthened• History of recycling capital for growth
- Our strategy is to recycle capital for growth, minimizing our need to raise equity
- Our growth has been self-fundedo Following this transaction, we owned 18
centers, 1 less than when we went public in 1992
o On a net basis, we had issued only $300 million of common equity since the IPO
o Nonetheless, our market capitalization has increased almost five times since the IPO, over 23 years ago
0
2,000
4,000
6,000
8,000
10,000
12,000
1992 1997 2002 2007 2012 2015
Dol
lars
in $
MM
Total Market Capitalization
Equity Market Capitalization
19
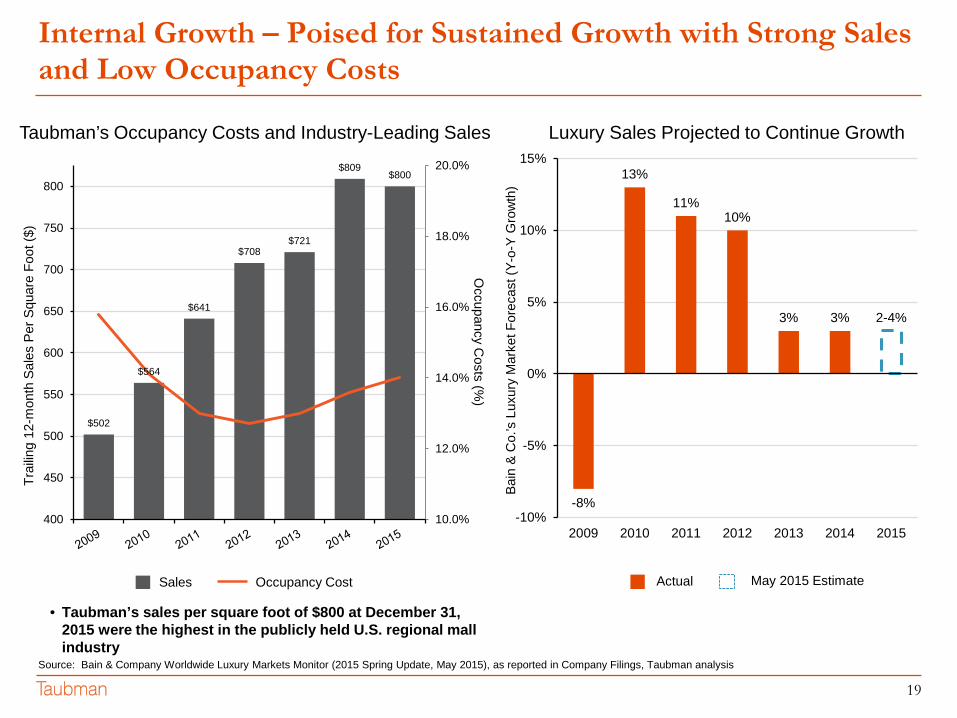
$502
$564
$641
$708$721
$809$800
10.0%
12.0%
14.0%
16.0%
18.0%
20.0%
400
450
500
550
600
650
700
750
800
• Taubman’s sales per square foot of $800 at December 31, 2015 were the highest in the publicly held U.S. regional mall industry
Internal Growth – Poised for Sustained Growth with Strong Sales and Low Occupancy Costs
-8%
13%
11%10%
3% 3% 2-4%
-10%
-5%
0%
5%
10%
15%
2009 2010 2011 2012 2013 2014 2015
Source: Bain & Company Worldwide Luxury Markets Monitor (2015 Spring Update, May 2015), as reported in Company Filings, Taubman analysis
Trai
ling
12-m
onth
Sal
es P
er S
quar
e Fo
ot ($
)
Taubman’s Occupancy Costs and Industry-Leading Sales Luxury Sales Projected to Continue Growth
Bain
& C
o.’s
Lux
ury
Mar
ket F
orec
ast (
Y-o-
Y G
row
th)
Actual May 2015 Estimate
Occupancy C
osts (%)
Sales Occupancy Cost
20
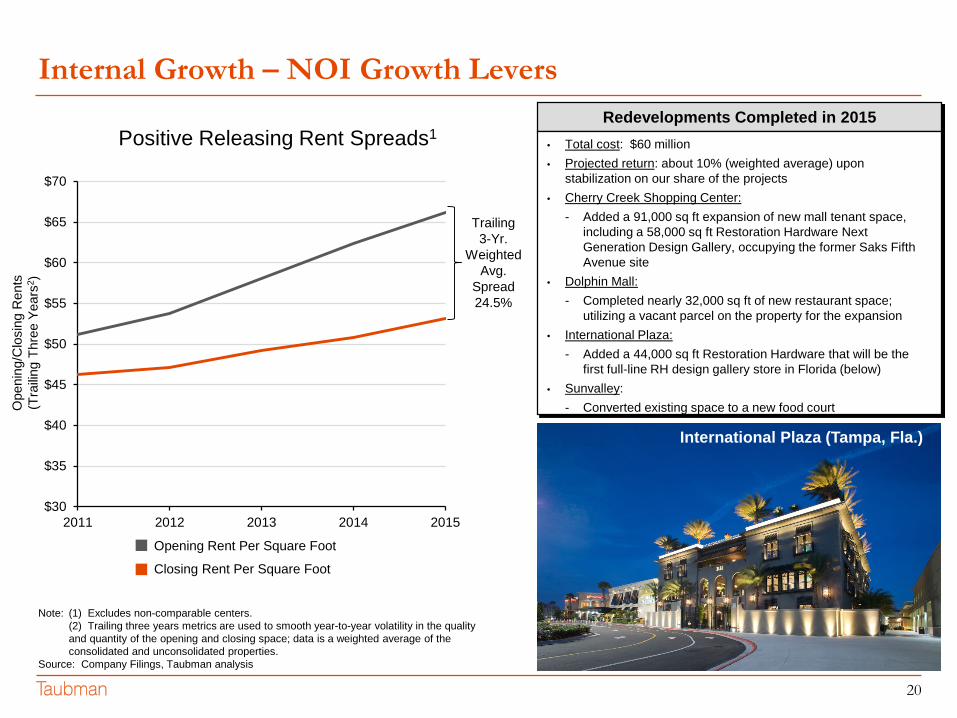
$30
$35
$40
$45
$50
$55
$60
$65
$70
2011 2012 2013 2014 2015
Internal Growth – NOI Growth Levers
Note: (1) Excludes non-comparable centers.(2) Trailing three years metrics are used to smooth year-to-year volatility in the quality and quantity of the opening and closing space; data is a weighted average of the consolidated and unconsolidated properties.
Source: Company Filings, Taubman analysis
Ope
ning
/Clo
sing
Ren
ts(T
railin
g Th
ree
Year
s2)
Positive Releasing Rent Spreads1
Closing Rent Per Square Foot
Opening Rent Per Square Foot
Trailing 3-Yr.
Weighted Avg.
Spread24.5%
Redevelopments Completed in 2015• Total cost: $60 million• Projected return: about 10% (weighted average) upon
stabilization on our share of the projects• Cherry Creek Shopping Center:
- Added a 91,000 sq ft expansion of new mall tenant space, including a 58,000 sq ft Restoration Hardware Next Generation Design Gallery, occupying the former Saks Fifth Avenue site
• Dolphin Mall:- Completed nearly 32,000 sq ft of new restaurant space;
utilizing a vacant parcel on the property for the expansion• International Plaza:
- Added a 44,000 sq ft Restoration Hardware that will be the first full-line RH design gallery store in Florida (below)
• Sunvalley:- Converted existing space to a new food court
International Plaza (Tampa, Fla.)
21
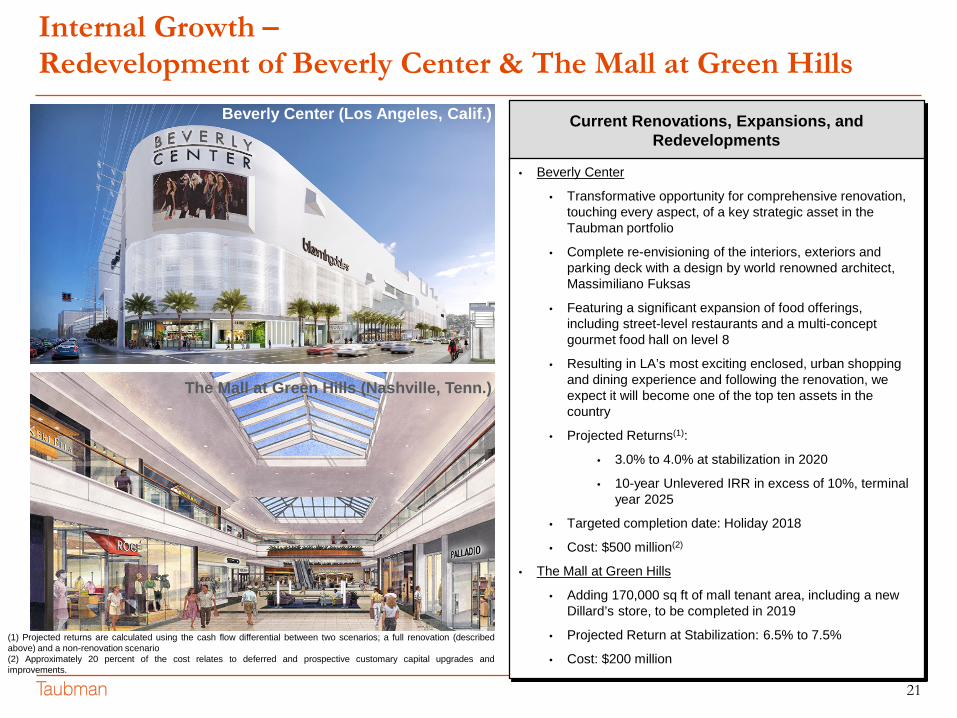
Internal Growth –Redevelopment of Beverly Center & The Mall at Green Hills
Current Renovations, Expansions, and Redevelopments
• Beverly Center
• Transformative opportunity for comprehensive renovation, touching every aspect, of a key strategic asset in the Taubman portfolio
• Complete re-envisioning of the interiors, exteriors and parking deck with a design by world renowned architect, Massimiliano Fuksas
• Featuring a significant expansion of food offerings, including street-level restaurants and a multi-concept gourmet food hall on level 8
• Resulting in LA’s most exciting enclosed, urban shopping and dining experience and following the renovation, we expect it will become one of the top ten assets in the country
• Projected Returns(1):
• 3.0% to 4.0% at stabilization in 2020
• 10-year Unlevered IRR in excess of 10%, terminal year 2025
• Targeted completion date: Holiday 2018
• Cost: $500 million(2)
• The Mall at Green Hills
• Adding 170,000 sq ft of mall tenant area, including a new Dillard’s store, to be completed in 2019
• Projected Return at Stabilization: 6.5% to 7.5%
• Cost: $200 million
The Mall at Green Hills (Nashville, Tenn.)
Beverly Center (Los Angeles, Calif.)
(1) Projected returns are calculated using the cash flow differential between two scenarios; a full renovation (describedabove) and a non-renovation scenario(2) Approximately 20 percent of the cost relates to deferred and prospective customary capital upgrades andimprovements.
22
External Growth – Areas of External Growth
U.S. Traditional Development• We have developed 13 U.S. properties since 1998, or an average about one every 18
months. We are currently under construction on one center opening in 2016.
Acquisitions• We expect attractive opportunities to acquire existing centers, or interests in existing
centers, to continue to be scarce. However, we continue to look for assets where wecan add significant value or that would be strategic to the rest of our portfolio.
• In March 2016, we acquired Country Club Plaza, a the premier mixed-use retail andoffice property in Kansas City, Missouri, in a joint venture with The MacerichCompany. This purchase is consistent with our strategy to own high quality,dominant assets in great markets.
Asia• We have pursued a strategy of seeking strategic partners to jointly develop high
quality malls in our areas of focus. Taubman Asia is engaged in projects that leverageour strong retail, planning, design and operational capabilities.
• We currently have two joint venture developments with the Wangfujing Group Co. Ltd,one of China’s largest department store chains, and another with Shinsegae Group,South Korea’s largest retailer.
• These three projects are scheduled to open in 2016.
23
External Growth –U.S. Traditional Development – International Market Place
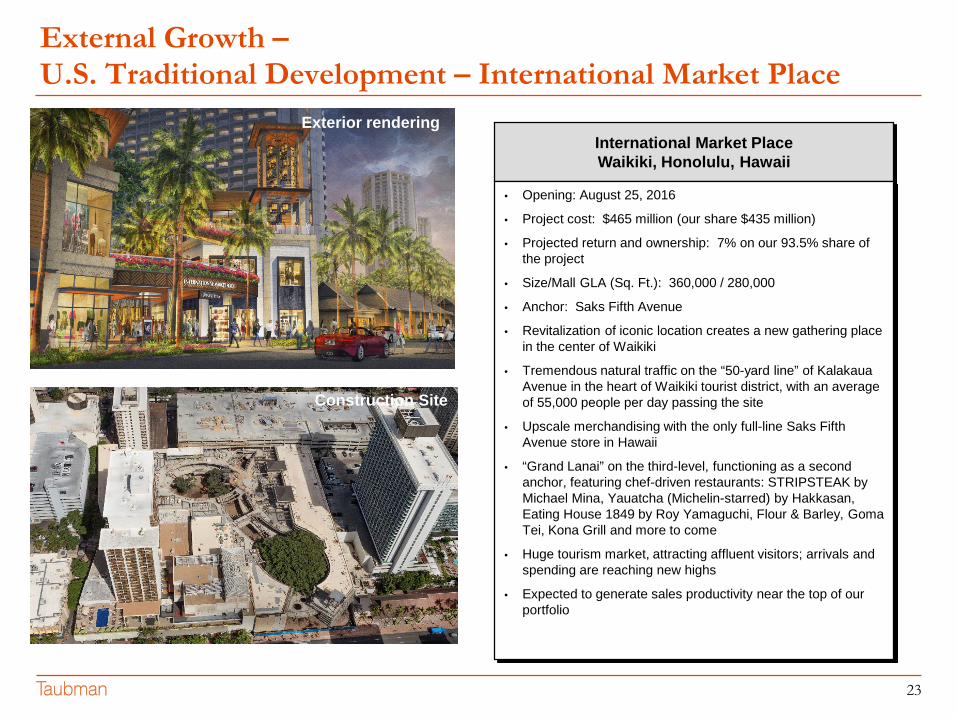
International Market Place Waikiki, Honolulu, Hawaii
• Opening: August 25, 2016
• Project cost: $465 million (our share $435 million)
• Projected return and ownership: 7% on our 93.5% share of the project
• Size/Mall GLA (Sq. Ft.): 360,000 / 280,000
• Anchor: Saks Fifth Avenue
• Revitalization of iconic location creates a new gathering place in the center of Waikiki
• Tremendous natural traffic on the “50-yard line” of KalakauaAvenue in the heart of Waikiki tourist district, with an average of 55,000 people per day passing the site
• Upscale merchandising with the only full-line Saks Fifth Avenue store in Hawaii
• “Grand Lanai” on the third-level, functioning as a second anchor, featuring chef-driven restaurants: STRIPSTEAK by Michael Mina, Yauatcha (Michelin-starred) by Hakkasan, Eating House 1849 by Roy Yamaguchi, Flour & Barley, Goma Tei, Kona Grill and more to come
• Huge tourism market, attracting affluent visitors; arrivals and spending are reaching new highs
• Expected to generate sales productivity near the top of our portfolio
Exterior rendering
Construction Site
24
External Growth –Asia – Xi’an, China
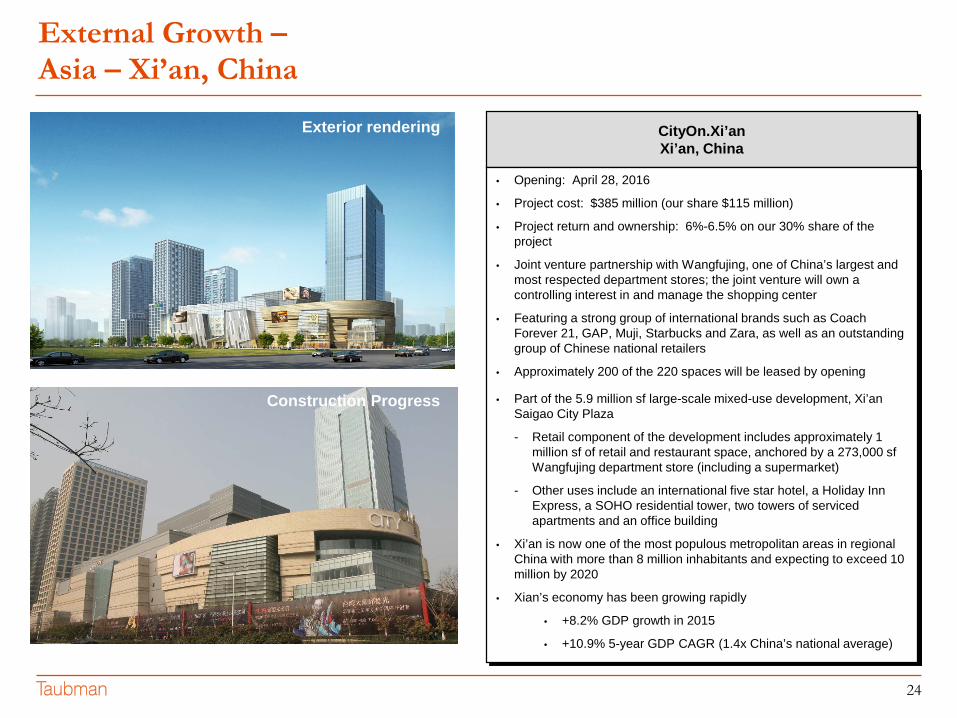
CityOn.Xi’an Xi’an, China
• Opening: April 28, 2016
• Project cost: $385 million (our share $115 million)
• Project return and ownership: 6%-6.5% on our 30% share of the project
• Joint venture partnership with Wangfujing, one of China’s largest and most respected department stores; the joint venture will own a controlling interest in and manage the shopping center
• Featuring a strong group of international brands such as Coach Forever 21, GAP, Muji, Starbucks and Zara, as well as an outstanding group of Chinese national retailers
• Approximately 200 of the 220 spaces will be leased by opening
• Part of the 5.9 million sf large-scale mixed-use development, Xi’an Saigao City Plaza
- Retail component of the development includes approximately 1 million sf of retail and restaurant space, anchored by a 273,000 sf Wangfujing department store (including a supermarket)
- Other uses include an international five star hotel, a Holiday Inn Express, a SOHO residential tower, two towers of serviced apartments and an office building
• Xi’an is now one of the most populous metropolitan areas in regional China with more than 8 million inhabitants and expecting to exceed 10 million by 2020
• Xian’s economy has been growing rapidly
• +8.2% GDP growth in 2015
• +10.9% 5-year GDP CAGR (1.4x China’s national average)
Exterior rendering
Construction Progress
25
External Growth –Asia – Zhengzhou, China
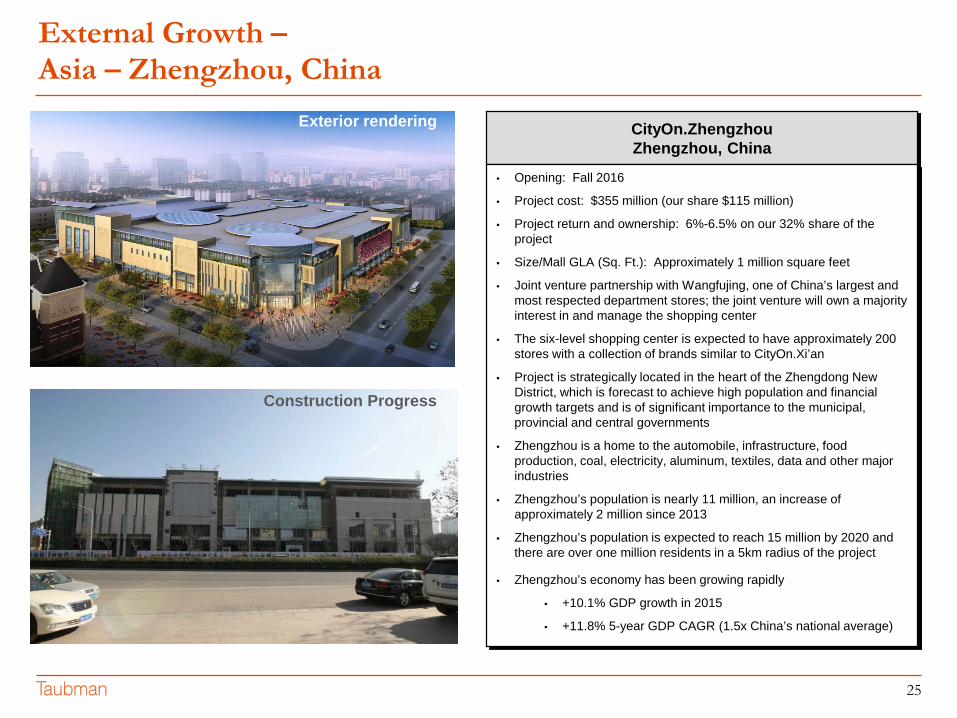
CityOn.Zhengzhou Zhengzhou, China
• Opening: Fall 2016
• Project cost: $355 million (our share $115 million)
• Project return and ownership: 6%-6.5% on our 32% share of the project
• Size/Mall GLA (Sq. Ft.): Approximately 1 million square feet
• Joint venture partnership with Wangfujing, one of China’s largest and most respected department stores; the joint venture will own a majority interest in and manage the shopping center
• The six-level shopping center is expected to have approximately 200 stores with a collection of brands similar to CityOn.Xi’an
• Project is strategically located in the heart of the Zhengdong New District, which is forecast to achieve high population and financial growth targets and is of significant importance to the municipal, provincial and central governments
• Zhengzhou is a home to the automobile, infrastructure, food production, coal, electricity, aluminum, textiles, data and other major industries
• Zhengzhou’s population is nearly 11 million, an increase of approximately 2 million since 2013
• Zhengzhou’s population is expected to reach 15 million by 2020 and there are over one million residents in a 5km radius of the project
• Zhengzhou’s economy has been growing rapidly
• +10.1% GDP growth in 2015
• +11.8% 5-year GDP CAGR (1.5x China’s national average)
Exterior rendering
Construction Progress
26
External Growth –Asia – Hanam, South Korea
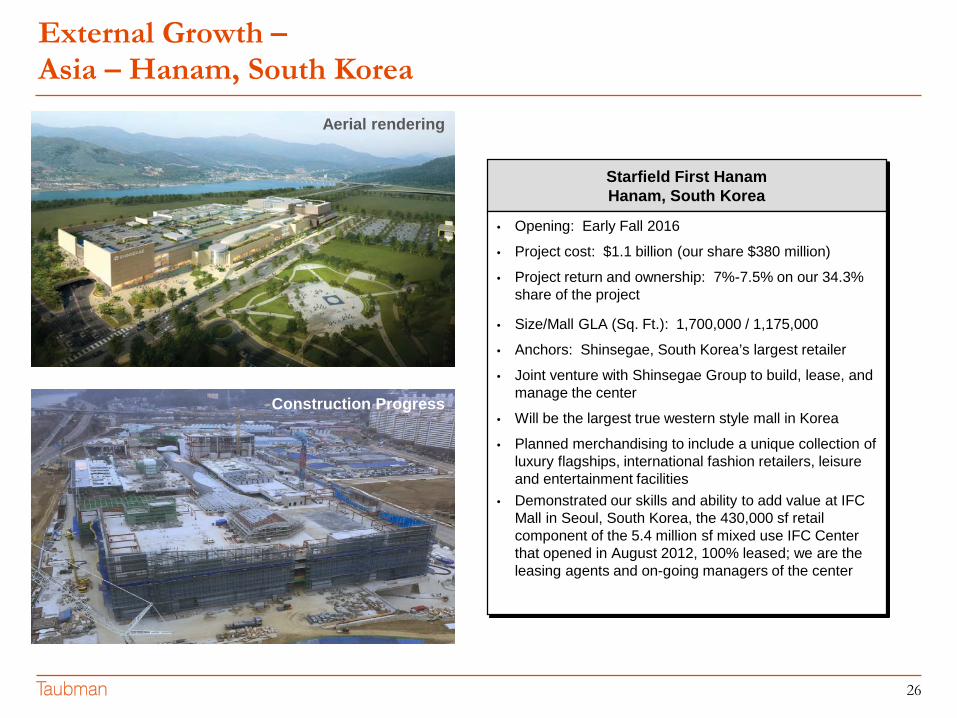
Starfield First HanamHanam, South Korea
• Opening: Early Fall 2016
• Project cost: $1.1 billion (our share $380 million)
• Project return and ownership: 7%-7.5% on our 34.3% share of the project
• Size/Mall GLA (Sq. Ft.): 1,700,000 / 1,175,000
• Anchors: Shinsegae, South Korea’s largest retailer
• Joint venture with Shinsegae Group to build, lease, and manage the center
• Will be the largest true western style mall in Korea
• Planned merchandising to include a unique collection of luxury flagships, international fashion retailers, leisure and entertainment facilities
• Demonstrated our skills and ability to add value at IFC Mall in Seoul, South Korea, the 430,000 sf retail component of the 5.4 million sf mixed use IFC Center that opened in August 2012, 100% leased; we are the leasing agents and on-going managers of the center
Aerial rendering
Construction Progress
27
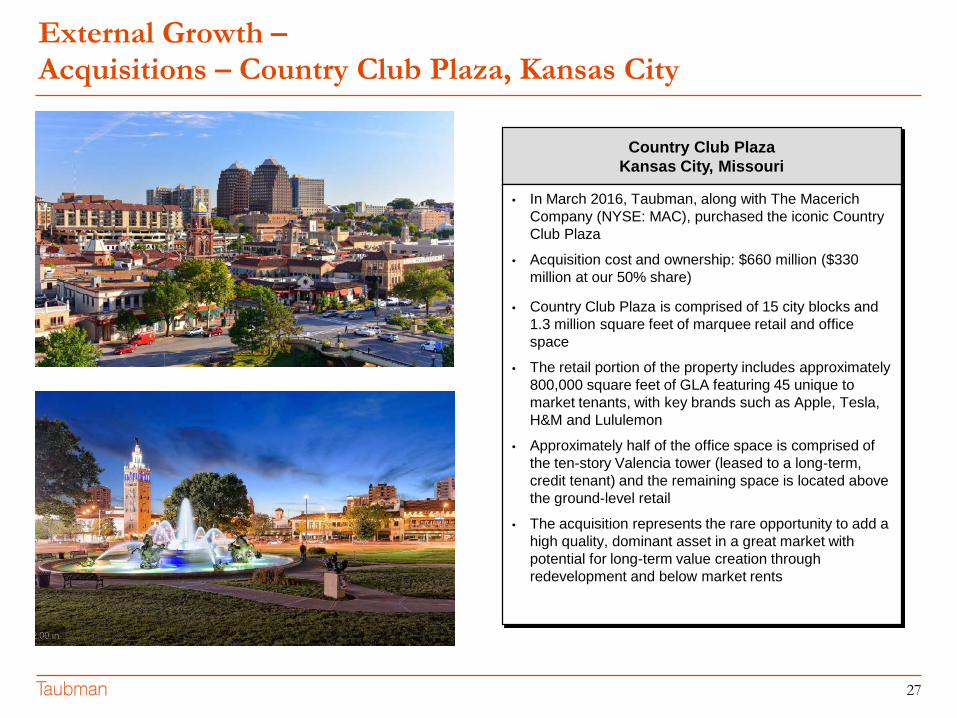
Country Club PlazaKansas City, Missouri
• In March 2016, Taubman, along with The MacerichCompany (NYSE: MAC), purchased the iconic Country Club Plaza
• Acquisition cost and ownership: $660 million ($330 million at our 50% share)
• Country Club Plaza is comprised of 15 city blocks and 1.3 million square feet of marquee retail and office space
• The retail portion of the property includes approximately 800,000 square feet of GLA featuring 45 unique to market tenants, with key brands such as Apple, Tesla, H&M and Lululemon
• Approximately half of the office space is comprised of the ten-story Valencia tower (leased to a long-term, credit tenant) and the remaining space is located above the ground-level retail
• The acquisition represents the rare opportunity to add a high quality, dominant asset in a great market with potential for long-term value creation through redevelopment and below market rents
External Growth –Acquisitions – Country Club Plaza, Kansas City
28
External Growth –U.S. Traditional Development versus Asia Development
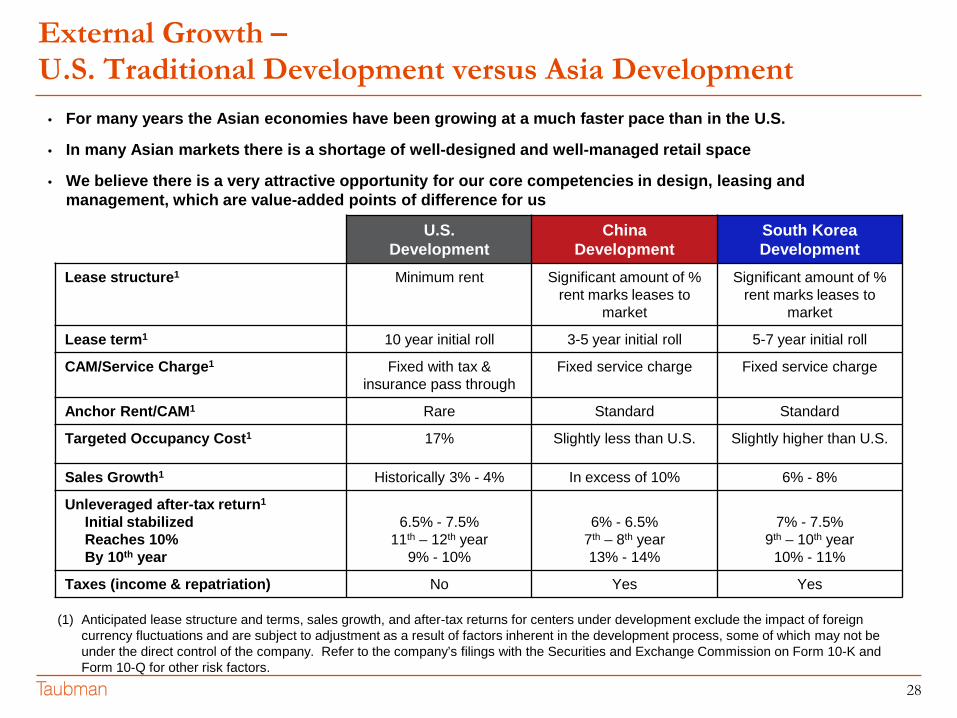
• For many years the Asian economies have been growing at a much faster pace than in the U.S.
• In many Asian markets there is a shortage of well-designed and well-managed retail space
• We believe there is a very attractive opportunity for our core competencies in design, leasing and management, which are value-added points of difference for us
(1) Anticipated lease structure and terms, sales growth, and after-tax returns for centers under development exclude the impact of foreign currency fluctuations and are subject to adjustment as a result of factors inherent in the development process, some of which may not be under the direct control of the company. Refer to the company’s filings with the Securities and Exchange Commission on Form 10-K and Form 10-Q for other risk factors.
U.S.Development
China Development
South Korea Development
Lease structure1 Minimum rent Significant amount of % rent marks leases to
market
Significant amount of % rent marks leases to
market
Lease term1 10 year initial roll 3-5 year initial roll 5-7 year initial roll
CAM/Service Charge1 Fixed with tax & insurance pass through
Fixed service charge Fixed service charge
Anchor Rent/CAM1 Rare Standard Standard
Targeted Occupancy Cost1 17% Slightly less than U.S. Slightly higher than U.S.
Sales Growth1 Historically 3% - 4% In excess of 10% 6% - 8%
Unleveraged after-tax return1
Initial stabilizedReaches 10%By 10th year
6.5% - 7.5%11th – 12th year
9% - 10%
6% - 6.5%7th – 8th year13% - 14%
7% - 7.5%9th – 10th year
10% - 11%
Taxes (income & repatriation) No Yes Yes
29
Investment Summary
• Highest Quality Portfolio
• Developer, Not a Consolidator
• Superior Operating Results
• Strong Balance Sheet: Prudent Financial Management
• History of Dividend Growth
• Strong Historical Shareholder Returns
30
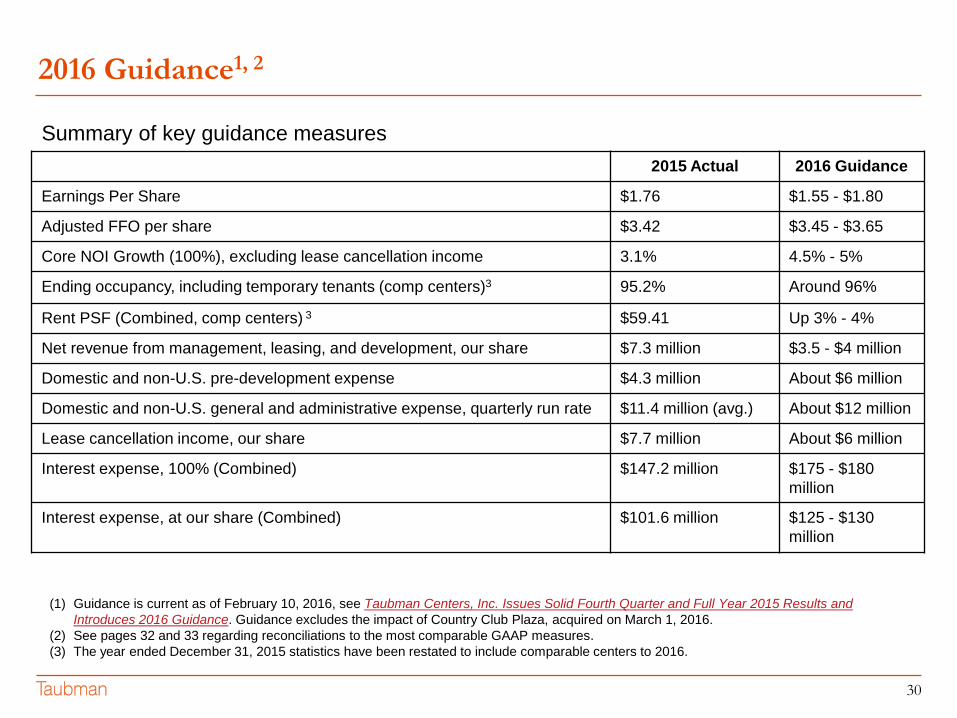
2016 Guidance1, 2
Summary of key guidance measures2015 Actual 2016 Guidance
Earnings Per Share $1.76 $1.55 - $1.80
Adjusted FFO per share $3.42 $3.45 - $3.65
Core NOI Growth (100%), excluding lease cancellation income 3.1% 4.5% - 5%
Ending occupancy, including temporary tenants (comp centers)3 95.2% Around 96%
Rent PSF (Combined, comp centers) 3 $59.41 Up 3% - 4%
Net revenue from management, leasing, and development, our share $7.3 million $3.5 - $4 million
Domestic and non-U.S. pre-development expense $4.3 million About $6 million
Domestic and non-U.S. general and administrative expense, quarterly run rate $11.4 million (avg.) About $12 million
Lease cancellation income, our share $7.7 million About $6 million
Interest expense, 100% (Combined) $147.2 million $175 - $180 million
Interest expense, at our share (Combined) $101.6 million $125 - $130 million
(1) Guidance is current as of February 10, 2016, see Taubman Centers, Inc. Issues Solid Fourth Quarter and Full Year 2015 Results and Introduces 2016 Guidance. Guidance excludes the impact of Country Club Plaza, acquired on March 1, 2016.
(2) See pages 32 and 33 regarding reconciliations to the most comparable GAAP measures.(3) The year ended December 31, 2015 statistics have been restated to include comparable centers to 2016.
31
Forward Looking Language
For ease of use, references in this presentation to “Taubman Centers,” “company,” “Taubman” or an operating platform mean Taubman Centers, Inc. and/or one or more of a number of separate, affiliated entities. Business is actually conducted by an affiliated entity rather than Taubman Centers, Inc. itself or the named operating platform.
This presentation may contain forward-looking statements within the meaning of Section 27A of the Securities Act of 1933, as amended, and Section 21E of the Securities Exchange Act of 1934, as amended. These statements reflect management's current views with respect to future events and financial performance. The forward-looking statements included in this presentation are made as of the date hereof. Except as required by law, we assume no obligation to update these forward-looking statements, even if new information becomes available in the future. Actual results may differ materially from those expected because of various risks and uncertainties. You should review the company's filings with the Securities and Exchange Commission, including “Risk Factors” in its most recent Annual Report on Form 10-K and subsequent quarterly reports, for a discussion of such risks and uncertainties.
32
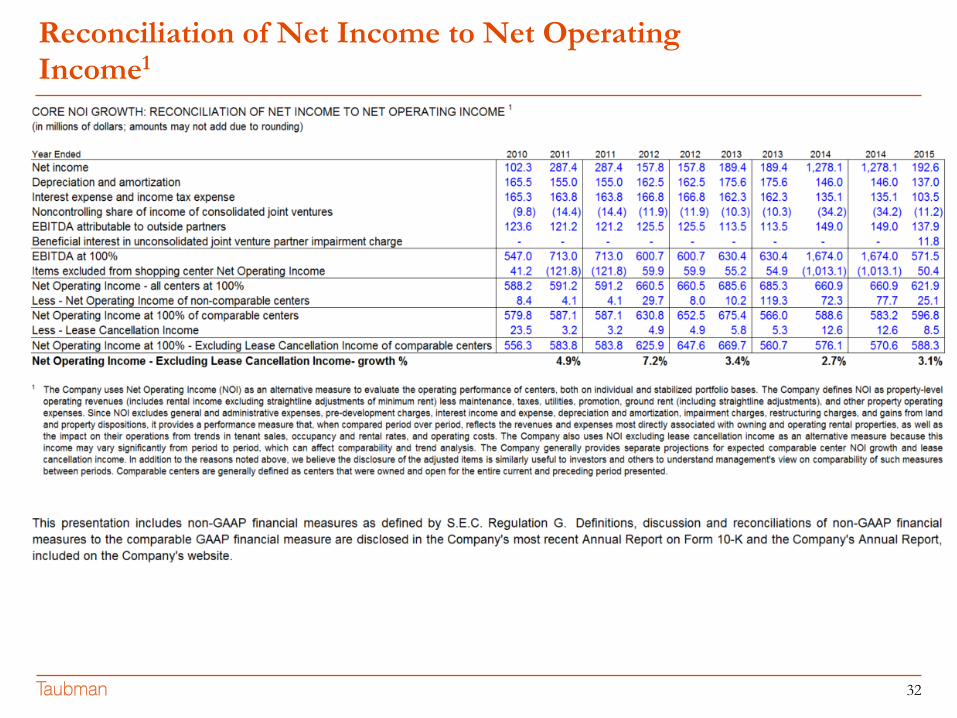
Reconciliation of Net Income to Net Operating Income1
33
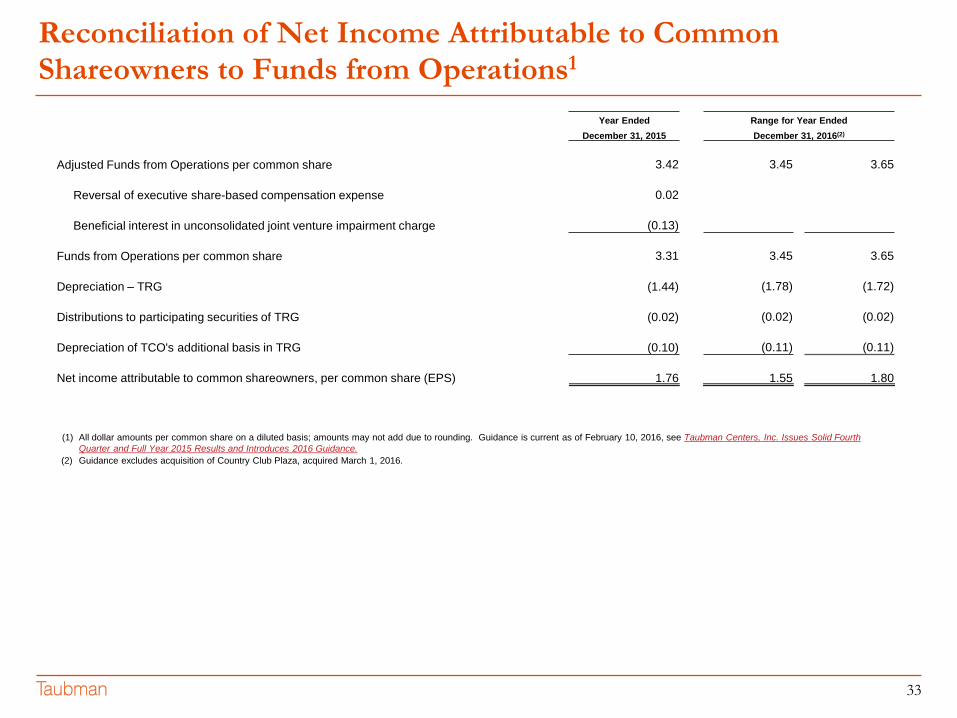
Reconciliation of Net Income Attributable to Common Shareowners to Funds from Operations1
Year Ended Range for Year EndedDecember 31, 2015 December 31, 2016(2)
Adjusted Funds from Operations per common share 3.42 3.45 3.65
Reversal of executive share-based compensation expense 0.02
Beneficial interest in unconsolidated joint venture impairment charge (0.13)
Funds from Operations per common share 3.31 3.45 3.65
Depreciation – TRG (1.44) (1.78) (1.72)
Distributions to participating securities of TRG (0.02) (0.02) (0.02)
Depreciation of TCO's additional basis in TRG (0.10) (0.11) (0.11)
Net income attributable to common shareowners, per common share (EPS) 1.76 1.55 1.80
(1) All dollar amounts per common share on a diluted basis; amounts may not add due to rounding. Guidance is current as of February 10, 2016, see Taubman Centers, Inc. Issues Solid Fourth Quarter and Full Year 2015 Results and Introduces 2016 Guidance.
(2) Guidance excludes acquisition of Country Club Plaza, acquired March 1, 2016.


