TIMES M O N T H LY R E P O R T • J A N U A R Y 2010 Statutory Details: Taurus Mutual Fund has been constituted as a Trust under the Indian Trust Act, 1882. Sponsor: HB Portfolio Ltd. Trustee: Taurus Investment Trust Company Ltd., Investment Manager: Taurus Asset Management Company Ltd. Risk Factors: All investments in mutual funds and securities are subject to market risks and the NAV of the scheme may go up or down depending upon the factors and forces affecting the securities market. There can be no assurance that the scheme's investment objectives will be achieved. The past performance of the mutual fund is not indicative of the future performance of the schemes. The sponsor is not responsible or liable for any loss resulting from the operation of the scheme beyond the initial contribution of Rs. 2 Lakhs made towards setting up of the mutual fund. The name of the schemes, do not in any manner indicate the quality of the schemes, its future prospects and returns. There is no guarantee or assurance as to any returns on investments of the unit holders. All dividend distributions are subject to the investment performance of the scheme. The investment made by the scheme is subject to external risks on transferring, pricing, trading volumes, settlement risks etc of securities. Please read the Scheme Information Document/ Statement of Additional Information carefully before investing.*Ranked No.1 Performing Fund out of 29 funds in the ELSS Category for 3 years returns as on 31st Jan., 2010 by Value Research. **Source: www.mutualfundsindia.com. Top Performing Fund out of 12 funds for the period 1 year as on 31st Jan., 2010 in the Infrastructure Sector Category. Strengthen your investments with smart choices Taurus Tax Shield Taurus Infrastructure Fund Taurus Ethical Fund Invest Smart. Invest Now. • - Save tax with the fund thats Ranked No.1* • - Invest in No.1 Performing Fund** from India's most promising sector • - India's first actively managed equity fund based on the principles of Shariah Our unified bond makes your investments strong Past Performance may or may not be sustained in future.
Transcript
TIMESM O N T H L Y R E P O R T • J A N U A R Y 2 0 1 0
Statutory Details: Taurus Mutual Fund has been constituted as a Trust under the Indian Trust Act, 1882.
Sponsor: HB Portfolio Ltd.
Trustee: Taurus Investment Trust Company Ltd., Investment Manager: Taurus Asset Management Company Ltd.
Risk Factors: All investments in mutual funds and securities are subject to market risks and the NAV of the scheme may go up or down depending upon the factors and forces affecting the securities market. There can be no assurance that the scheme's investment objectives will be achieved. The past performance of the mutual fund is not indicative of the future performance of the schemes. The sponsor is not responsible or liable for any loss resulting from the operation of the scheme beyond the initial contribution of Rs. 2 Lakhs made towards setting up of the mutual fund. The name of the schemes, do not in any manner indicate the quality of the schemes, its future prospects and returns. There is no guarantee or assurance as to any returns on investments of the unit holders. All dividend distributions are subject to the investment performance of the scheme. The investment made by the scheme is subject to external risks on transferring, pricing, trading volumes, settlement risks etc of securities. Please read the Scheme Information Document/ Statement of Additional Information carefully before investing.*Ranked No.1 Performing Fund out of 29 funds in the ELSS Category for 3 years returns as on 31st Jan., 2010 by Value Research. **Source: www.mutualfundsindia.com. Top Performing Fund out of 12 funds for the period 1 year as on 31st Jan., 2010 in the Infrastructure Sector Category.
Strengthen your investments with smart choices
Taurus Tax Shield
Taurus Infrastructure Fund
Taurus Ethical Fund
Invest Smart. Invest Now.
• - Save tax with the fund thats Ranked No.1*
• - Invest in No.1 Performing Fund** from India's most promising sector
• - India's first actively managed equity fund based on the principles of Shariah
Our unified bond makes your investments strong
Past Performance may or may not be sustained in future.
INDEX Page No.
1
2
3
4
5
6
7
8
9
10
TAURUS STARSHARE
AN OPEN-END EQUITY SCHEME WITH A FOCUS ON MULTI CAP STOCKS
TAURUS INFRASTRUCTURE FUND ..............................................................................................................................................................................5
AN OPEN-END EQUITY THEMATIC SCHEME
TAURUS ETHICAL FUND .......................................................................................................................................................................................................6
TAURUS BONANZA FUND .................................................................................................................................................................................................8
AN OPEN-END EQUITY SCHEME WITH A LARGE CAP FOCUS
TAURUS DISCOVERY FUND ...............................................................................................................................................................................................9
AN OPEN-END EQUITY FUND WITH MID CAP AND SMALL CAP FOCUS
TAURUS ULTRA SHORT TERM BOND FUND ....................................................................................................................................................10
AN OPEN-END SHORT TERM BOND SCHEME
TAURUS LIQUID FUND ......................................................................................................................................................................................................11
AN OPEN-END LIQUID SCHEME
TAURUS INCOME FUND ..................................................................................................................................................................................................12
AN OPEN-END BOND SCHEME
TAURUS GILT FUND ............................................................................................................................................................................................................13
The month of January 2010 started on a positive note but then the following three global events led to a sell off in the equity & commodities market worldwide.
1)China embarked on the monetary tightening route with the Chinese Central Bank increasing the Reserve Ratio by 0.5% and increasing interest rate on 1 year bill by 0.8%. The investor community across the globe took it as an indication that with signs of revival in most of the developed economies, these economies would also start withdrawing the stimulus packages much earlier than anticipated.
2)US President's talk of putting restrictions on the proprietary investment by bank sponsored Hedge Funds and private equity players
3)By the end of the month news started trickling in that some of the countries in Eastern Europe may face trouble in financing their debt deficits that may again lead to fiscal crisis world over.
In India, the Central Bank in its quarterly Monetary Policy review increased the CRR by 0.75% (to be implemented in two stages). This was expected to suck out liquidity to the extent of Rs. 36,000 crs. With Govt's prime concern focussed upon arresting the rising food inflation, the Central Bank has to gradually move away from the easy monetary policy pursued in the last couple of years. This will however depend on the recovery of the Indian Economy and to an extent on the increase in genuine credit off-take.
These events cast their shadow on the Indian markets also. During the month of January 2010, BSE Sensex declined by 6.34% and NSE Nifty by 6.13%.
The Indian economy & markets however remain strong as highlighted by the following positive aspects:
1)The results announced by most of the leading companies during the third quarter of FY 10 have been encouraging. There is a revival in the demand in the Indian economy with combined figures of 2581 companies showing a rise of 42% in net profit, 24% in operating profit on the back of more than 10% rise in net sales on YOY basis. The best growth was shown by the manufacturing sector followed by Services Sector. Financial sector reported a marginal growth. Auto & IT companies reported better than expected numbers.
2)IIP grew 11.7% YOY in November and 6 core sectors grew by 6% in December
3)On the back of pick-up in private consumption and investment, IMF now expects India's GDP growth at 6.75% in 2009-10 and 8% in 2011-12.
4)RBI in its quarterly review has revised the GDP growth forecast to 7.5% from earlier 6%.
For the Indian equity markets we feel that there could be some more pain in the short term but the medium to long term outlook still looks positive and markets should revive after this healthy correction. The event to watch out is the forthcoming Budget. Investors may use the corrections as an opportunity to add on to their portfolio in a gradual manner.
Taurus Tax Shield (our ELSS scheme), Taurus Infrastructure Fund, Taurus Ethical Fund and Taurus Ultra Short Term Bond Fund continued to do well for us, which reflected in the growth of our AUM. Taurus Tax Shield (ELSS) rewarded the investorswith a dividend of 15%, its second dividend for the current financial year, coming on the back of three dividends declared in previous financial year.
We renew our appeal made in the previous month through this magazine to look at financial planners/advisors akin to Chartered Accountants, Doctors and Lawyers and feel that investors should compensate them by way of fees for the noble work they do by planning out the financial security for the investors.
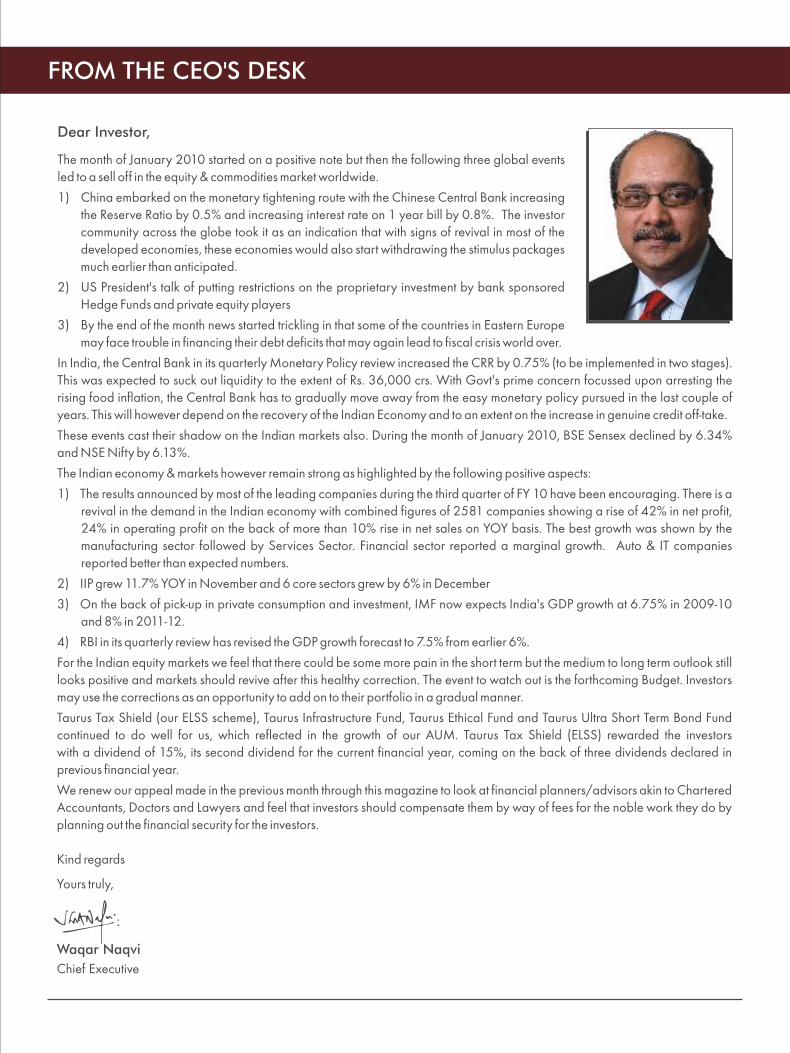
Kind regards
Yours truly,
Waqar Naqvi
Chief Executive
FROM THE CEO'S DESK
PE
RF
OR
MA
NC
E
TAURUS STARSHARE - AN OPEN-END EQUITY SCHEME WITH A FOCUS ON MULTI CAP STOCKS
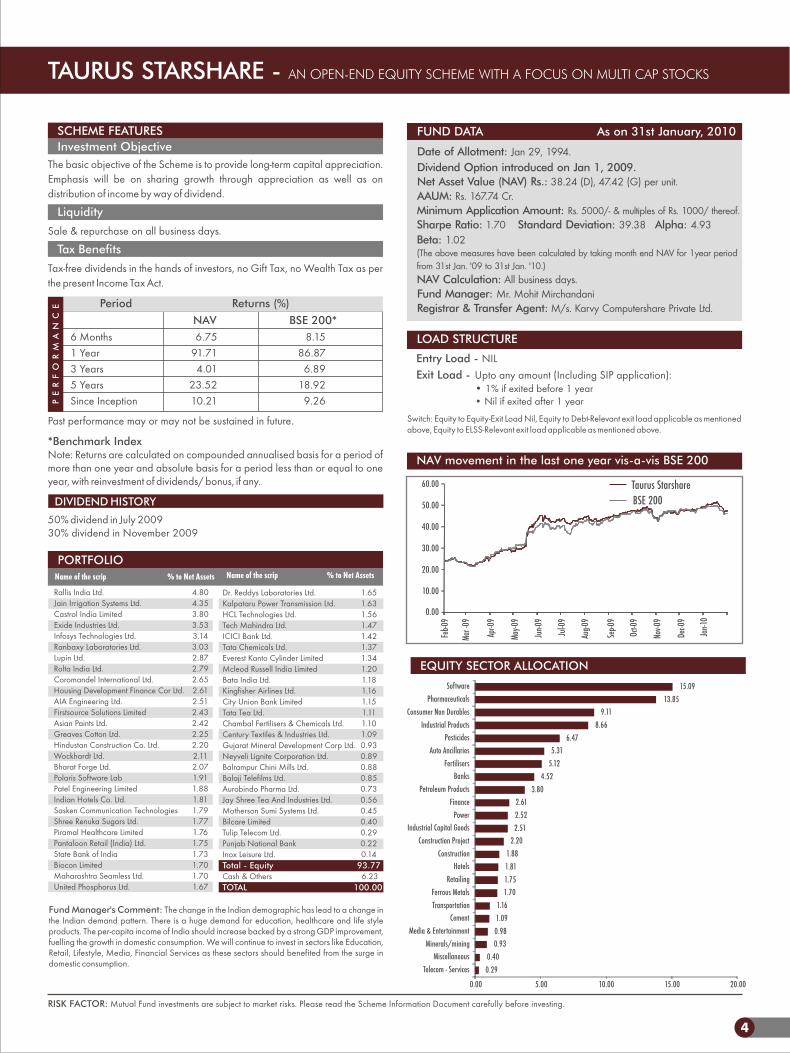
Date of Allotment: Jan 29, 1994.Dividend Option introduced on Jan 1, 2009.
Net Asset Value (NAV) Rs.: 38.24 (D), per unit.AAUM: Rs. 167.74 Cr.Minimum Application Amount: Rs. 5000/- & multiples of Rs. 1000/ thereof.Sharpe Ratio: 1.70Standard Deviation: 39.38Beta: 1.02(from 31st Jan. '09 to 31st Jan. '10.)NAV Calculation: All business days.Fund Manager: Mr. Mohit MirchandaniRegistrar & Transfer Agent: M/s. Karvy Computershare Private Ltd.
FUND DATA As on 31st January, 2010
47.42 (G)
The above measures have been calculated by taking month end NAV for 1year period
Alpha: 4.93
RISK FACTOR: Mutual Fund investments are subject to market risks. Please read the Scheme Information Document carefully before investing.
The basic objective of the Scheme is to provide long-term capital appreciation. Emphasis will be on sharing growth through appreciation as well as on distribution of income by way of dividend.
Sale & repurchase on all business days.
Tax-free dividends in the hands of investors, no Gift Tax, no Wealth Tax as per the present Income Tax Act.
Period Returns (%)
6 Months 6.75 8.15 1 Year 91.71 86.87 3 Years 4.01 6.89 5 Years 23.52 18.92 Since Inception 10.21 9.26
Past performance may or may not be sustained in future.
*Benchmark IndexNote: Returns are calculated on compounded annualised basis for a period of more than one year and absolute basis for a period less than or equal to one year, with reinvestment of dividends/ bonus, if any.
50% dividend in July 200930% dividend in November 2009
SCHEME FEATURES
Investment Objective
Liquidity
Tax Benefits
DIVIDEND HISTORY
NAV BSE 200*
Name of the scrip % to Net Assets
PORTFOLIO
Name of the scrip % to Net Assets
Rallis India Ltd. 4.80Jain Irrigation Systems Ltd. 4.35Castrol India Limited 3.80Exide Industries Ltd. 3.53Infosys Technologies Ltd. 3.14Ranbaxy Laboratories Ltd. 3.03Lupin Ltd. 2.87Rolta India Ltd. 2.79Coromandel International Ltd. 2.65Housing Development Finance Cor Ltd.2.61AIA Engineering Ltd. 2.51Firstsource Solutions Limited 2.43Asian Paints Ltd. 2.42Greaves Cotton Ltd. 2.25Hindustan Construction Co. Ltd. 2.20Wockhardt Ltd. 2.11Bharat Forge Ltd. 2.07Polaris Software Lab 1.91Patel Engineering Limited 1.88Indian Hotels Co. Ltd. 1.81Sasken Communication Technologies1.79Shree Renuka Sugars Ltd. 1.77Piramal Healthcare Limited 1.76Pantaloon Retail (India) Ltd. 1.75State Bank of India 1.73Biocon Limited 1.70Maharashtra Seamless Ltd. 1.70United Phosphorus Ltd. 1.67
• 1% if exited before 1 year• Nil if exited after 1 year
Switch: Equity to Equity-Exit Load Nil, Equity to Debt-Relevant exit load applicable as mentioned above, Equity to ELSS-Relevant exit load applicable as mentioned above.
LOAD STRUCTURE
Fund Manager's Comment: The change in the Indian demographic has lead to a change in the Indian demand pattern. There is a huge demand for education, healthcare and life style products. The per-capita income of India should increase backed by a strong GDP improvement, fuelling the growth in domestic consumption. We will continue to invest in sectors like Education, Retail, Lifestyle, Media, Financial Services as these sectors should benefited from the surge in domestic consumption.
Dr. Reddys Laboratories Ltd. 1.65Kalpataru Power Transmission Ltd. 1.63HCL Technologies Ltd. 1.56Tech Mahindra Ltd. 1.47ICICI Bank Ltd. 1.42Tata Chemicals Ltd. 1.37Everest Kanto Cylinder Limited 1.34Mcleod Russell India Limited 1.20Bata India Ltd. 1.18Kingfisher Airlines Ltd. 1.16City Union Bank Limited 1.15Tata Tea Ltd. 1.11Chambal Fertilisers & Chemicals Ltd. 1.10Century Textiles & Industries Ltd. 1.09Gujarat Mineral Development Corp Ltd.0.93Neyveli Lignite Corporation Ltd. 0.89Balrampur Chini Mills Ltd. 0.88Balaji Telefilms Ltd. 0.85Aurobindo Pharma Ltd. 0.73Jay Shree Tea And Industries Ltd. 0.56Motherson Sumi Systems Ltd. 0.45Bilcare Limited 0.40Tulip Telecom Ltd. 0.29Punjab National Bank 0.22Inox Leisure Ltd. 0.14
Cash & Others 6.23Total - Equity 93.77
TOTAL 100.00
4
EQUITY SECTOR ALLOCATION
0.290.40
0.930.981.091.16
1.701.751.811.88
2.202.512.522.61
3.804.52
5.125.31
6.478.66
9.1113.85
15.09
0.00 5.00 10.00 15.00 20.00
Telecom - ServicesMiscellaneous
Minerals/miningMedia & Entertainment
CementTransportationFerrous Metals
RetailingHotels
ConstructionConstruction Project
Industrial Capital GoodsPower
FinancePetroleum Products
BanksFertilisers
Auto AncillariesPesticides
Industrial ProductsConsumer Non Durables
PharmaceuticalsSoftware
0.00
10.00
20.00
30.00
40.00
50.00
60.00
Feb-0
9
Mar -
09
Apr-0
9
May-0
9
Jun-0
9
Jul-0
9
Aug-0
9
Sep-0
9
Oct-0
9
Nov-0
9
Dec-0
9
Jan-1
0
NAV movement in the last one year vis-a-vis BSE 200
Taurus Starshare BSE 200
PE
RF
OR
MA
NC
E
5
TAURUS INFRASTRUCTURE FUND - AN OPEN-END EQUITY THEMATIC SCHEME
To provide capital appreciation and income distribution to unitholders by investing pre-dominantly in equity and equity related securities of the companies belonging to infrastructure sector, it's related industries inclusive of suppliers of capital goods, raw materials and other supportive services to infrastructure companies and balance in debt and money market instruments.
Sale and repurchase on all business days.
Tax-free dividends in the hands of investors, no Gift Tax, no Wealth Tax as per the present Income Tax Act.
Period Returns (%)
NAV BSE 200*
3 Months 10.33 5.21
6 Months 11.35 8.15
1 Year 143.53 86.87
Since Inception 10.14 12.36
Past performance may or may not be sustained in future.
*Benchmark Index
Note: Returns are calculated on a compounded annualised basis for a period of more than one year and absolute basis for a period less than or equal to one year, with reinvestment of dividends/ bonus, if any.
SCHEME FEATURES
Investment Objective
Liquidity
Tax Benefits
FUND DATA As on 31st January, 2010
Date of Allotment: Mar 5, 2007.Net Asset Value (NAV) Rs.: 13.29 (D), 13.24 (G) per unit.AAUM: Rs. 27.41 Cr.Minimum Application Amount: Rs. 5000/- & multiples of Rs. 1000/ thereof.Sharpe Ratio: 1.93Standard Deviation: 47.37 Alpha:
Beta: 1.21(The above measures have been calculated by taking month end NAV for 1year period from 31st Jan. '09 to 31st Jan. '10.)
NAV Calculation: All business days.Fund Manager: Mr. Mohit MirchandaniRegistrar & Transfer Agent: M/s. Karvy Computershare Private Ltd.
18.30
RISK FACTOR: Mutual Fund investments are subject to market risks. Please read the Scheme Information Document carefully before investing.
Fund Manager's Comment: Strong rebound in IIP as well as core sector performance has reflected a positive trend emerging in the infrastructure sector. The improved funding scenario, increasing number of financial closures and favourable GOI policy makes us remain positive towards the sector.
• 1% if exited before 1 year • Nil if exited after 1 year
Switch: Equity to Equity-Exit Load Nil, Equity to Debt-Relevant exit load applicable as mentioned above, Equity to ELSS-Relevant exit load applicable as mentioned above.
LOAD STRUCTURE
Name of the scrip % to Net Assets
PORTFOLIO
Name of the scrip % to Net Assets
Castrol India Limited 5.99
Greaves Cotton Ltd. 5.26
KEC International Ltd. 5.19
Jain Irrigation Systems Ltd. 4.87
AIA Engineering Ltd. 4.84
Asian Paints Ltd. 4.81
Indian Hotels Co. Ltd. 4.76
Rolta India Ltd. 4.64
Exide Industries Ltd. 4.47
Apollo Hospitals Enterprise 4.41
Shree Renuka Sugars Ltd. 3.63
Hindustan Construction Co. Ltd. 3.56
Bharat Forge Ltd. 3.15
Sasken Communication Technologies2.77
Indraprastha Gas Limited 2.70
Srei Infrastructure Finance Ltd. 2.70
HCL Technologies Ltd. 2.63
Kalpataru Power Transmission Ltd. 2.52
Patel Engineering Limited 2.52
Maharashtra Seamless Ltd. 2.51
SRF Limited 2.19
NIIT Technologies Ltd. 1.99
Neyveli Lignite Corporation Ltd. 1.96
Kirloskar Electric Co Ltd. 1.87
Allied Digital Services Limited 1.75
IRB Infrastructure Developers Ltd. 1.44
Power Finance Corporation Limited1.38
Bajaj Electricals Limited 1.22
Hindustan Dorr Oliver Ltd. 1.20
Apar Industries Ltd. 1.11
Balkrishna Industries Limited 0.90
Cash & Others 5.07
Total - Equity 94.93
TOTAL 100.00
Consumer Durables
Transportation
Hardware
Ferrous Metals
Construction
Gas
Construction Project
Finance
Healthcare Services
Hotels
Petroleum Products
Auto Ancillaries
Consumer Non Durables
Industrial Capital Goods
Power
Software
Industrial Products
1.22
1.44
1.75
2.51
2.52
2.70
3.56
4.08
4.41
4.76
5.99
7.56
8.44
9.02
9.67
12.03
13.28
0.00 5.00 10.00 15.00
EQUITY SECTOR ALLOCATION
BSE 200Taurus Infrastructure Fund
NAV movement in the last one year vis-a-vis BSE 200
TAURUS ETHICAL FUND - AN OPEN-END EQUITY ORIENTED SCHEME
Date of Allotment: April 6, 2009
AAUM: Rs. 15.98 Cr.Minimum Application Amount: Rs. 5000/- & multiples of Re. 1/- thereof.NAV Calculation: All business days.Fund Manager: Mr. Mohit MirchandaniRegistrar & Transfer Agent: M/s. Karvy Computershare Private Ltd.
FUND DATA As on 31st January, 2010
Net Asset Value (NAV) Rs.: 16.82 (D), 19.78(G), 19.77 (B) per unit.
RISK FACTOR: Mutual Fund investments are subject to market risks. Please read the Scheme Information Document carefully before investing.
To provide capital appreciation and income distribution to unitholders through investment in a diversified portfolio of equities, which are based on the principles of Shariah.
Sale & repurchase on all business days.
Tax free dividends in the hands of Investor, No Gift Tax, No Wealth Tax as per the present Income Tax Act.
Period Returns (%)
3 Months 13.48 5.80
6 Months 19.23 8.48
Since Inception 97.80 61.09
Past performance may or may not be sustained in future.*Benchmark IndexNote: Returns are calculated on a compounded annualised basis for a period of more than one year and absolute basis for a period less than or equal to one year, with reinvestment of dividends/ bonus, if any.
15% dividend in July 2009, 10% dividend in September 2009.
• 1% if exited before 1 year • Nil if exited after 1 year
Switch: Equity to Equity-Exit Load Nil, Equity to Debt-Relevant exit load applicable as mentioned above, Equity to ELSS-Relevant exit load applicable as mentioned above.
LOAD STRUCTURE
Fund Manager's Comment: A concentrated portfolio has helped since inception of the fund and we will continue to adopt the same strategy especially in the wake of limited universe available for investing. The fund has outperformed key indices in the last month. Key additions to the portfolio during the month included Apollo Hospitals & Amar Raja Batteries. Among the top 10 holdings, Navneet Publications and Apollo Hospitals outperformed the markets while Greaves Cotton & Divis Lab underperformed the market.We continue to invest in companies with higher margins which will reflect in their strong cash flows and consequently maintain the balance sheet quality. We continue to maintain a concentrated portfolio strategy.
RISK FACTOR: Mutual Fund investments are subject to market risks. Please read the Scheme Information Document carefully before investing.
Name of the scrip % to Net Assets
PORTFOLIO
Apollo Hospitals Enterprise 1.39Bharat Heavy Electricals Ltd. 1.36South Indian Bank Ltd. 1.35Reliance Industries Ltd. 1.33Firstsource Solutions Limited 1.31Wockhardt Ltd. 1.28Balrampur Chini Mills Ltd. 1.26Allied Digital Services Limited 1.24Power Finance Corporation Limited 1.21Larsen & Toubro Ltd. 1.18Tech Mahindra Ltd. 1.18United Phosphorus Ltd. 1.17Gail (India) Ltd. 1.16City Union Bank Limited 1.14Oil & Natural Gas Corporation Ltd. 1.11Moser Baer India Limited 1.06Bank of Rajasthan Ltd. 1.06Mahindra Lifespace Developers Ltd. 0.97Man Industries India Limited 0.96Adhunik Metaliks Limited 0.95Shree Renuka Sugars Ltd. 0.92Opto Circuits Ltd. 0.79Reliance Capital Ltd. 0.77Usha International Limited 0.74Sterlite Industries Ltd. 0.72Bharat Forge Ltd. 0.58
Cash & Others 10.68 Total - Equity 89.32
TOTAL 100.00
Name of the scrip % to Net Assets
Divis Laboratories Ltd. 3.34Greaves Cotton Ltd. 3.09Hindustan Dorr Oliver Ltd. 3.09Sasken Communication Technologies 2.96Bata India Ltd. 2.90Exide Industries Ltd. 2.83Aia Engineering Ltd. 2.72Piramal Healthcare Limited 2.67Ranbaxy Laboratories Ltd. 2.64Max India Limited 2.64Biocon Limited 2.31Kingfisher Airlines Ltd. 2.03Infosys Technologies Ltd. 1.98Indraprastha Gas Limited 1.91Gujarat State Petronet Ltd. 1.86Tata Chemicals Ltd. 1.83Jain Irrigation Systems Ltd. 1.75Bilcare Limited 1.72Infrastructure Development Finance Co. Ltd.1.70Rolta India Ltd. 1.63Aptech Ltd. 1.62Housing Development Finance Cor Ltd. 1.61Union Bank of India 1.58ICICI Bank Ltd. 1.57State Bank of India 1.51Rallis India Ltd. 1.44Tanla Solutions Limited 1.42Petronet Lng Ltd. 1.39Jyoti Structures Ltd. 1.39
To provide long term capital appreciation over the life of the scheme through investment pre-dominantly in equity shares, besides tax benefits.
Sale on all business days. As per Income Tax Laws, the redemption facility is available after a lock-in period of 3 years from the date of investment.
As per Section 80C of the Income Tax Act, an individual or a HUF is allowed deduction from income to an amount upto a maximum of Rs. 1 Lakh by investment in the scheme. Tax -free dividends in the hands of investors.
Available to individual / HUF investors upto five times of investment subject to a maximum of Rs. 5 Lakhs.
Period Returns (%)
NAV BSE 200*
6 Months 10.64 8.15 1 Year 92.89 86.87 3 Years 18.34 6.89 5 Years 17.40 18.92 Since Inception 11.70 13.79
Past performance may or may not be sustained in future.
*Benchmark Index
Note: Returns are calculated on a compounded annualised basis for a period of more than one year and absolute basis for a period less than or equal to one year, with reinvestment of dividends/ bonus, if any.
Growth plan: 35% dividend in Dec 2005, 16% dividend in Feb 2004, 11% dividend inSept 2003, Dividend plan: 15% dividend in Jan 2010, 10% dividend in Nov 2009, 10% dividend inMar 2009, 10% dividend in Jan 2009, 10% dividend in Dec 2008.
SCHEME FEATURES
Investment Objective
Liquidity
Tax Benefits
Personal Accident Death Insurance Cover
DIVIDEND HISTORY
Dividend Option introduced on May 6, 2008.
Net Asset Value (NAV) Rs.: 30.46 AAUM: Rs. 36.65 Cr.Minimum Application Amount: Rs. 500/- & multiples of Rs. 500/ thereof
Sharpe Ratio: 2.06Standard Deviation: 34.45 Beta: 0.92(The above measures have been calculated by taking month end NAV for 1year period from 31st Jan. '09 to 31st Jan. '10.)
NAV Calculation: All business days.Fund Manager: Mr. Mohit Mirchandani w.e.f 1st Jan., 2010Registrar & Transfer Agent: M/s. Karvy Computershare Private Ltd.
FUND DATA As on 31st January, 2010
Date of Allotment: Mar 31, 1996.
22.24 (D), (G) per unit.
.
Alpha: 14.99
Entry Load - NILExit Load - Upto any amount (Including SIP application): NA
Switch: Equity to Equity-Exit Load Nil, Equity to Debt-Relevant exit load applicable as mentioned above, Equity to ELSS-Relevant exit load applicable as mentioned above.
LOAD STRUCTURE
Fund Manager's Comment: The Indian equity markets are the barometer of the economy which is again back to growth path leading to continuous improvement in the per capita earnings for the country. This makes a case for investment in the sectors benefited by this structural change. We will continue to focus on the companies having long term growth potential.
NAV movement in the last one year vis-a-vis BSE 200
0.00
5.00
10.00
15.00
20.00
25.00
30.00
35.00
Feb-
09
Mar-
09
Apr-
09
May-
09
Jun-
09
Jul-
09
Aug-
09
Sep-
09
Oct-
09
Nov-
09
Dec-
09
Jan-
10
PE
RF
OR
MA
NC
E
8
TAURUS BONANZA FUND - AN OPEN-END EQUITY SCHEME WITH A LARGE CAP FOCUS
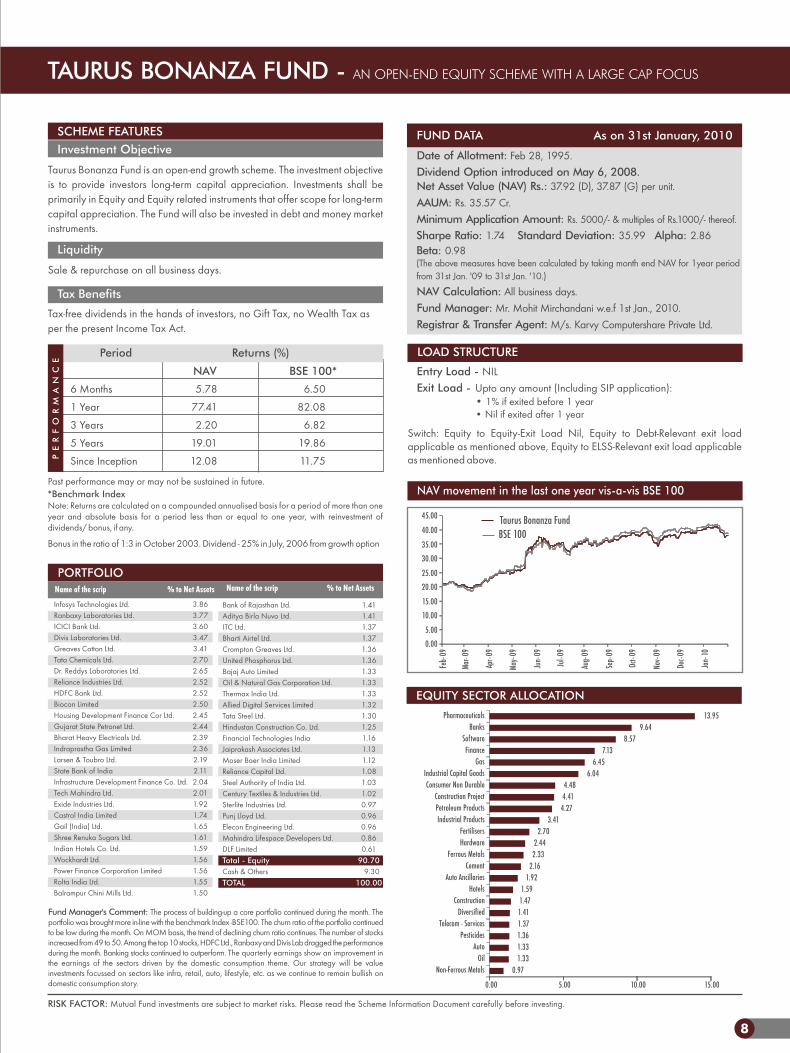
Taurus Bonanza Fund is an open-end growth scheme. The investment objective is to provide investors long-term capital appreciation. Investments shall be primarily in Equity and Equity related instruments that offer scope for long-term capital appreciation. The Fund will also be invested in debt and money market instruments.
Sale & repurchase on all business days.
Tax-free dividends in the hands of investors, no Gift Tax, no Wealth Tax as per the present Income Tax Act.
Period Returns (%)
NAV BSE 100*
6 Months 5.78 6.50
1 Year 77.41 82.08
3 Years 2.20 6.82
5 Years 19.01 19.86
Since Inception 12.08 11.75
Past performance may or may not be sustained in future.*Benchmark IndexNote: Returns are calculated on a compounded annualised basis for a period of more than one year and absolute basis for a period less than or equal to one year, with reinvestment of dividends/ bonus, if any.
Bonus in the ratio of 1:3 in October 2003. Dividend - 25% in July, 2006 from growth option
SCHEME FEATURES
Investment Objective
Liquidity
Tax Benefits
FUND DATA As on 31st January, 2010
Date of Allotment: Feb 28, 1995.Dividend Option introduced on May 6, 2008.
Net Asset Value (NAV) Rs.: 37.92 (D), 37.87 (G) per unit.AAUM: Rs. 35.57 Cr.Minimum Application Amount: Rs. 5000/- & multiples of Rs.1000/- thereof.
Sharpe Ratio: 1.74Standard Deviation: 35.99 Beta: 0.98(The above measures have been calculated by taking month end NAV for 1year period from 31st Jan. '09 to 31st Jan. '10.)
NAV Calculation: All business days.Fund Manager: Mr. Mohit Mirchandani w.e.f 1st Jan., 2010.Registrar & Transfer Agent: M/s. Karvy Computershare Private Ltd.
Alpha: 2.86
Bank of Rajasthan Ltd. 1.41Aditya Birla Nuvo Ltd. 1.41ITC Ltd. 1.37Bharti Airtel Ltd. 1.37Crompton Greaves Ltd. 1.36United Phosphorus Ltd. 1.36Bajaj Auto Limited 1.33Oil & Natural Gas Corporation Ltd. 1.33Thermax India Ltd. 1.33Allied Digital Services Limited 1.32Tata Steel Ltd. 1.30Hindustan Construction Co. Ltd. 1.25Financial Technologies India 1.16Jaiprakash Associates Ltd. 1.13Moser Baer India Limited 1.12Reliance Capital Ltd. 1.08Steel Authority of India Ltd. 1.03Century Textiles & Industries Ltd. 1.02Sterlite Industries Ltd. 0.97Punj Lloyd Ltd. 0.96Elecon Engineering Ltd. 0.96Mahindra Lifespace Developers Ltd. 0.86DLF Limited 0.61
Cash & Others 9.30Total - Equity 90.70
TOTAL 100.00
Name of the scrip % to Net Assets
PORTFOLIO
Name of the scrip % to Net Assets
Infosys Technologies Ltd. 3.86Ranbaxy Laboratories Ltd. 3.77ICICI Bank Ltd. 3.60Divis Laboratories Ltd. 3.47Greaves Cotton Ltd. 3.41Tata Chemicals Ltd. 2.70Dr. Reddys Laboratories Ltd. 2.65Reliance Industries Ltd. 2.52HDFC Bank Ltd. 2.52Biocon Limited 2.50Housing Development Finance Cor Ltd. 2.45Gujarat State Petronet Ltd. 2.44Bharat Heavy Electricals Ltd. 2.39Indraprastha Gas Limited 2.36Larsen & Toubro Ltd. 2.19State Bank of India 2.11Infrastructure Development Finance Co. Ltd.2.04Tech Mahindra Ltd. 2.01Exide Industries Ltd. 1.92Castrol India Limited 1.74Gail (India) Ltd. 1.65Shree Renuka Sugars Ltd. 1.61Indian Hotels Co. Ltd. 1.59Wockhardt Ltd. 1.56Power Finance Corporation Limited 1.56Rolta India Ltd. 1.55Balrampur Chini Mills Ltd. 1.50
Fund Manager's Comment: The process of building-up a core portfolio continued during the month. The portfolio was brought more in-line with the benchmark Index -BSE100. The churn ratio of the portfolio continued to be low during the month. On MOM basis, the trend of declining churn ratio continues. The number of stocks increased from 49 to 50. Among the top 10 stocks, HDFC Ltd., Ranbaxy and Divis Lab dragged the performance during the month. Banking stocks continued to outperform. The quarterly earnings show an improvement in the earnings of the sectors driven by the domestic consumption theme. Our strategy will be value investments focussed on sectors like infra, retail, auto, lifestyle, etc. as we continue to remain bullish on domestic consumption story.
RISK FACTOR: Mutual Fund investments are subject to market risks. Please read the Scheme Information Document carefully before investing.
• 1% if exited before 1 year • Nil if exited after 1 year
Switch: Equity to Equity-Exit Load Nil, Equity to Debt-Relevant exit load applicable as mentioned above, Equity to ELSS-Relevant exit load applicable as mentioned above.
NAV movement in the last one year vis-a-vis BSE 100
Taurus Bonanza Fund BSE 100
PE
RF
OR
MA
NC
E
9
TAURUS DISCOVERY FUND - AN OPEN-END EQUITY FUND WITH MID CAP AND SMALL CAP FOCUS
Date of Allotment: Sep 5, 1994.Net Asset Value (NAV) Rs.: 14.16 (D), 14.15 (G) per unit.AAUM: Rs. 25.15 Cr.Minimum Application Amount: Rs. 5000/- & multiples of Rs.1000/- thereof.
Sharpe Ratio: 1.77Standard Deviation: 39.67 Beta: 1.03(The above measures have been calculated by taking month end NAV for 1year period from 31st Jan. '09 to 31st Jan. '10.)
NAV Calculation: All business days.Fund Manager: Mr. Mohit Mirchandani w.e.f 1st Jan., 2010.Registrar & Transfer Agent: M/s. Karvy Computershare Private Ltd.
FUND DATA As on 31st January, 2010
Alpha: 7.69
RISK FACTOR: Mutual Fund investments are subject to market risks. Please read the Scheme Information Document carefully before investing.
The primary objective of the Scheme is to identify and select low priced stocks through price discovery mechanism, which would broadly include: • To capitalise on available opportunity on growth potential offered by undervalued penny stocks. • Such stocks being low priced and if dividend paying, decent dividend yield will give desired cushion in the volatile capital market. • Lower side risk is minimum in such investments. • Many of such cases where investment will be made, may be turnaround cases, therefore, greater potential for improvement in NAV.
Sale & repurchase on all business days.
Tax-free dividends in the hands of investors, no Gift Tax, no Wealth Tax as per the present Income Tax Act.
Period Returns (%)
NAV CNX Midcap Index*
6 Months 15.70 21.04
1 Year 105.48 114.96
3 Years (5.42) 10.91
5 Years 9.36 20.26
Since Inception 2.28 7.98
Past performance may or may not be sustained in future.
*Benchmark IndexNote: Returns are calculated on a compounded annualised basis for a period of more than one year and absolute basis for a period less than or equal to one year, with reinvestment of dividends/ bonus, if any.
SCHEME FEATURES
Investment Objective
Liquidity
Tax Benefits
Fund Manager's Comment: During the month, the fund adopted a more focussed approach with reduced stock count. Also, the fund was brought more in-line with the benchmark index. The benefits of the same will be felt in the coming months. Key addition included Sasken communication. Increasing demand outlook and performance of the core sector should lead to an improved business outlook for the mid cap sector. The sector should witness traction in earnings as well as profitability margins. Both Domestic and Foreign investors will be looking for value investing in this space. This makes a strong case for the investment in the segment.
Bharat Forge Ltd. 1.79Firstsource Solutions Limited 1.65Gail (India) Ltd. 1.65Balrampur Chini Mills Ltd. 1.61Ratnamani Metals & Tubes Ltd 1.61Thermax India Ltd. 1.49HCL Technologies Ltd. 1.46NIIT Ltd. 1.46Bank of Rajasthan Ltd. 1.36Indraprastha Gas Limited 1.33Shipping Corporation of India Ltd. 1.33Man Industries India Limited 1.27ING Vysya Bank Ltd. 1.24Opto Circuits Ltd. 1.23Rolta India Ltd. 1.20Shree Renuka Sugars Ltd. 1.18Emco Ltd. 1.17Crompton Greaves Ltd. 1.15Mundra Port & Special Eco Zone Ltd. 1.07Elecon Engineering Ltd. 0.97Aditya Birla Nuvo Ltd. 0.85Titan Industries Ltd. 0.64
Cash & others 3.99Total - Equity 96.01
TOTAL 100.00
Name of the scrip % to Net Assets
PORTFOLIO
Name of the scrip % to Net Assets
Exide Industries Ltd. 4.33Aia Engineering Ltd. 4.17Divis Laboratories Ltd. 3.79Biocon Limited 3.56Greaves Cotton Ltd. 3.44Tech Mahindra Ltd. 3.12Lupin Ltd. 3.02Ranbaxy Laboratories Ltd. 2.99Bata India Ltd. 2.69Tata Chemicals Ltd. 2.59Piramal Healthcare Limited 2.52City Union Bank Limited 2.42Indian Overseas Bank 2.41Sasken Communication Technologies 2.30Rallis India Ltd. 2.25Gujarat State Petronet Ltd 2.22Union Bank of India 2.17Jain Irrigation Systems Ltd. 2.02United Phosphorus Ltd. 2.01Jyoti Structures Ltd. 1.97Wockhardt Ltd. 1.92IDBI Bank Ltd 1.91Adhunik Metaliks Limited 1.89Aurobindo Pharma Ltd. 1.88Ashok Leyland Ltd. 1.87Max India Limited 1.86
• 1% if exited before 1 year • Nil if exited after 1 year
Switch: Equity to Equity-Exit Load Nil, Equity to Debt-Relevant exit load applicable as mentioned above, Equity to ELSS-Relevant exit load applicable as mentioned above.
LOAD STRUCTURE
0.85
1.87
1.97
2.40
2.59
4.26
4.33
4.76
5.19
6.12
8.94
9.12
11.19
11.51
20.91
0.00 5.00 10.00 15.00 20.00 25.00
Diversified
Auto
Power
Transportation
Fertilisers
Pesticides
Auto Ancillaries
Ferrous Metals
Gas
Consumer Non Durables
Industrial Capital Goods
Industrial Products
Software
Banks
Pharmaceuticals
EQUITY SECTOR ALLOCATION
NAV movement in the last one year vis-a-vis CNX Midcap Index
Taurus Discovery FundCNX Midcap Index
0.00
2.00
4.00
6.00
8.00
10.00
12.00
14.00
16.00
18.00
Feb
-09
Mar-
09
Apr-
09
May
-09
Jun
-09
Jul-
09
Aug
-09
Sep
-09
Oct-
09
Nov-
09
Dec-
09
Jan-1
0
10
Individuals Corporate NRI
Short Term 12.5%+ 10% Bond Fund surcharge+surcharge+surcharge+
3% cess 3% cess 3% cess
Total Tax 14.16% 22.66%14.16%
Money Market and 25%+ 10%25%+ 10%25%+ 10%Liquid Schemes surcharge+surcharge+surcharge+
3% cess 3% cess 3% cess
Total Tax 28.33%28.33%28.33%
20%+ 10% 12.5%+ 10%
Period Returns (%)
NAV Crisil Liquid
Fund Index*
Retail Institutional Super
Institutional
6 Months 2.27 2.30 2.39 1.39
1 Year 5.08 5.21 5.46 4.29
Since Inception 5.56 5.87 6.11 5.13
The past performance may or may not be sustained in future.
*Benchmark Index:
Note: (1) Returns are calculated on a compounded annualised basis for a period of more than one year and absolute basis for a period less than or equal to one year, with reinvestment of dividends/bonus, if any. (2) The scheme became open-ended w.e.f. December 2, 2008.
Rated
AAAf
by CRISIL
To generate returns with higher liquidity and low volatility from a portfolio of money market and debt instruments. However, there is no assurance that the investment objective of the scheme will be realised.
Sale & repurchase on all business days.
SCHEME FEATURES
Investment Objective
Liquidity
Tax Benefits for Dividend Distribution
FUND DATA As on 31st January, 2010
CRISIL Certified AAAf FundDate of Allotment: December 1, 2008.Net Asset Value (NAV):Retail 10.0135 (D), (G), Institutional Rs.: 10.0135 (D), 10.6681(G), 10.0120 (W) per unit.Super Institutional Rs.:10.0135 (D),10.6956 (G), 10.0120 (W) per unit.Average Maturity Period: 0.44 years.AAUM: Rs. 1,521.23 Cr.Minimum Application Amount:Retail Plan: Rs. 5,000/- per application and thereafter in multiplesof Rs. 1,000/-. thereofInstitutional Plan: Rs. 1 cr. per application and thereafter inmultiples of Rs. 1000/- thereof.Super Institutional Plan: Rs. 5 crs. per application and thereafter in multiples of Rs. 1000/- thereof.Additional Subscription Amount:Retail Plan: Rs. 1,000/- per application and thereafter in multiplesof Rs. 1,000/-.Institutional Plan: Rs. 1lakh per application and thereafter inmultiples of Rs. 1000/-.Super Institutional Plan: Rs. 1lakh per application and thereafter in multiples of Rs. 1000/-.Fund Manager: Mr. Pankaj JainRegistrar & Transfer Agent: M/s. Karvy Computershare Private Ltd.
Rs.: 10.648210.0120 (W) per unit.
RISK FACTOR: Mutual Fund investments are subject to market risks. Please read the Scheme Information Document carefully before investing.
TAURUS ULTRA SHORT TERM BOND FUND - AN OPEN-END SHORT TERM BOND SCHEME(Formerly known as Taurus Short Term Bond Fund)
PE
RF
OR
MA
NC
E
Name of the scrip % to Net Assets
PORTFOLIO
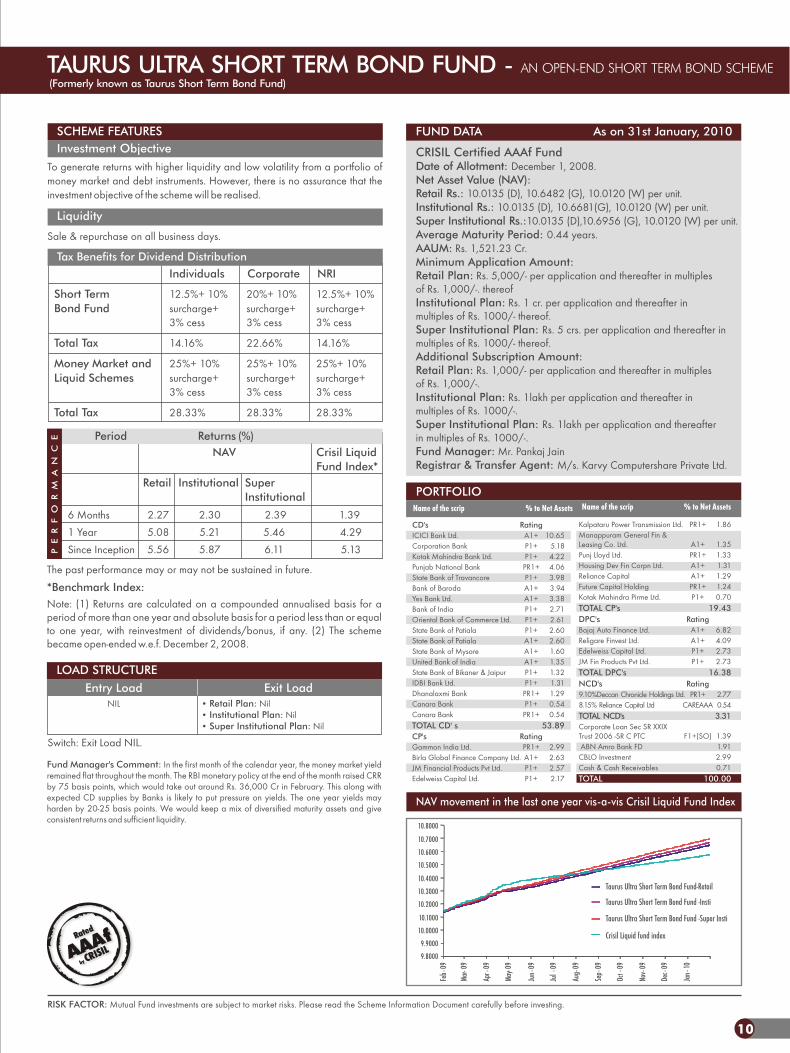
Fund Manager's Comment: In the first month of the calendar year, the money market yield remained flat throughout the month. The RBI monetary policy at the end of the month raised CRR by 75 basis points, which would take out around Rs. 36,000 Cr in February. This along with expected CD supplies by Banks is likely to put pressure on yields. The one year yields may harden by 20-25 basis points. We would keep a mix of diversified maturity assets and give consistent returns and sufficient liquidity.
Name of the scrip % to Net Assets
CD's Rating
ICICI Bank Ltd. A1+10.65Corporation Bank P1+5.18Kotak Mahindra Bank Ltd. P1+4.22Punjab National Bank PR1+4.06State Bank of Travancore P1+3.98Bank of Baroda A1+3.94Yes Bank Ltd. A1+3.38Bank of India P1+2.71Oriental Bank of Commerce Ltd. P1+2.61State Bank of Patiala P1+2.60State Bank of Patiala A1+2.60State Bank of Mysore A1+1.60United Bank of India A1+1.35State Bank of Bikaner & Jaipur P1+1.32IDBI Bank Ltd. P1+1.31Dhanalaxmi Bank PR1+1.29Canara Bank P1+0.54Canara Bank PR1+0.54TOTAL CD' s 53.89
CP's
Gammon India Ltd. PR1+2.99Birla Global Finance Company Ltd.A1+2.63JM Financial Products Pvt Ltd. P1+2.57Edelweiss Capital Ltd. P1+2.17
Rating
Kalpataru Power Transmission Ltd. PR1+1.86Manappuram General Fin &Leasing Co. Ltd. A1+1.35Punj Lloyd Ltd. PR1+1.33Housing Dev Fin Corpn Ltd. A1+1.31Reliance Capital A1+1.29Future Capital Holding PR1+1.24Kotak Mahindra Pirme Ltd. P1+0.70TOTAL CP's 19.43
DPC's Rating
Bajaj Auto Finance Ltd. A1+6.82Religare Finvest Ltd. A1+4.09Edelweiss Capital Ltd. P1+2.73JM Fin Products Pvt Ltd. P1+2.73TOTAL DPC's 16.38
NCD's Rating
9.10%Deccan Chronicle Holdings Ltd.PR1+2.778.15% Reliance Capital Ltd CAREAAA0.54TOTAL NCD's 3.31
Corporate Loan Sec SR XXIXTrust 2006 -SR C PTC F1+(SO)1.39 ABN Amro Bank FD 1.91CBLO Investment 2.99Cash & Cash Receivables 0.71TOTAL 100.00
NAV movement in the last one year vis-a-vis Crisil Liquid Fund Index
9.8000
9.9000
10.0000
10.1000
10.2000
10.3000
10.4000
10.5000
10.6000
10.7000
10.8000
Feb-
09
Mar-0
9
Apr-
09
May-0
9
Jun-
09
Jul-
09
Aug-
09
Sep-
09
Oct-
09
Nov-
09
Dec-
09
Jan-
10
Taurus Short Term Bond Fund -Ultra Insti
Taurus Short Term Bond Fund -Ultra Super Insti
Crisil Liquid fund index
Taurus Ultra Short Term Bond Fund-Retail
LOAD STRUCTURE
Entry Load Exit LoadNIL • Retail Plan: Nil
• Institutional Plan: Nil• Super Institutional Plan: Nil
Switch: Exit Load NIL.
11
PE
RF
OR
MA
NC
E
RISK FACTOR: Mutual Fund investments are subject to market risks. Please read the Scheme Information Document carefully before investing.
TAURUS LIQUID FUND - AN OPEN-END LIQUID SCHEME
FUND DATA As on 31st January, 2010
Net Asset Value (NAV)
Super Institutional Rs.: 10.0295 (G) per unit.
Average Maturity Period: 0.07 years.
AAUM: Rs. 78.55 Cr.Minimum Application Amount:
Retail Plan: Rs. 5,000/- per application and thereafter in multiplesof Rs. 1,000/- thereof.
Institutional Plan: Rs. 1 cr. per application and thereafter inmultiples of Rs. 1000/- thereof.
Super Institutional Plan: Rs. 5 crs. per application and thereafter in multiples of Rs. 1000/- thereof.
Additional Subscription Amount:
Retail Plan: Rs. 1,000/- per application and thereafter in multiplesof Rs. 1,000/-.
Institutional Plan: Rs. 1lakh per application and thereafter inmultiples of Rs. 1000/-.
Super Institutional Plan: Rs. 1lakh per application and thereafter in multiples of Rs. 1000/-.
Sharpe Ratio: -8.23Standard Deviation: 0.12 (The above measures have been calculated by taking month end NAV for 1year period from 31st Jan. '09 to 31st Jan. '10.)
NAV Calculation: All business days.Fund Manager: Mr. Pankaj JainRegistrar & Transfer Agent: M/s. Karvy Computershare Private Ltd.
CRISIL Certified AAAf FundDate of Allotment: Aug 31, 2006.
Rs.: 10.0114 (D), 12.0090 (G) per unit.
Institutional Rs.: 10.0238 (G) per unit.
Alpha: -1.01
To generate steady and reasonable income, with low risk and high level of liquidity from a portfolio of money market securities and high quality debt.
Sale & repurchase on all business days.
Tax free dividends in the hands of investors, no Gift Tax, no Wealth Tax as per the present Income Tax Act.
Period Returns (%)
NAV Crisil Liquid Fund Index*
3 Months 0.87 0.70
6 Months 1.60 1.39
1 Year 3.25 4.29
3 Years 0.15 6.82
Since Inception 5.50 6.75
The past performance may or may not be sustained in future.
*Benchmark Index:
Note: Returns are calculated on a compounded annualised basis for a period of more than one year and absolute basis for a period less than or equal to one year, with reinvestment of dividends/ bonus, if any.
SCHEME FEATURES
Investment Objective
Liquidity
Tax Benefits
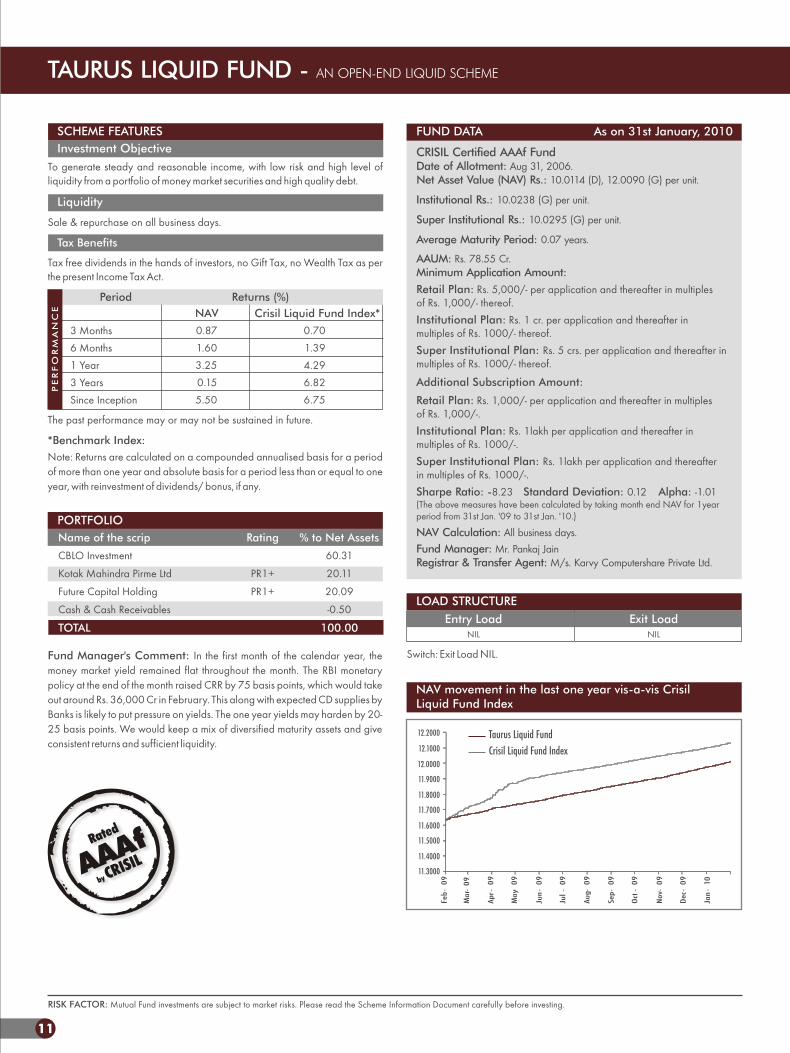
Fund Manager's Comment: In the first month of the calendar year, the money market yield remained flat throughout the month. The RBI monetary policy at the end of the month raised CRR by 75 basis points, which would take out around Rs. 36,000 Cr in February. This along with expected CD supplies by Banks is likely to put pressure on yields. The one year yields may harden by 20-25 basis points. We would keep a mix of diversified maturity assets and give consistent returns and sufficient liquidity.
Name of the scrip Rating % to Net Assets
TOTAL 100.00
PORTFOLIO
CBLO Investment 60.31
Kotak Mahindra Pirme Ltd PR1+ 20.11
Future Capital Holding PR1+ 20.09
Cash & Cash Receivables -0.50
Switch: Exit Load NIL.
11.3000
11.4000
11.5000
11.6000
11.7000
11.8000
11.9000
12.0000
12.1000
12.2000
09 09 09 09 09 09 09 09 09 09 09
Feb
Mar
Apr
May
Jun
Jul
Aug
Sep
Oct
Nov
Dec
Jan
- - - - - - - - - - - -10
NAV movement in the last one year vis-a-vis CrisilLiquid Fund Index
Taurus Liquid FundCrisil Liquid Fund Index
PE
RF
OR
MA
NC
E
12
TAURUS INCOME FUND - AN OPEN-END BOND SCHEME
To maximize income through basket of debts, bonds, debentures, Government Securities and money market instruments etc. of varying maturities while maintaining safety and liquidity.
Sale & repurchase on all business days.
Tax-free dividends in the hands of investors, no Gift Tax, no Wealth Tax as per the present Income Tax Act.
Period Returns (%)
NAV Crisil Composite Bond Fund Index*
6 Months 1.78 2.09
1 Year 0.91 4.70
3 Years 3.59 6.60
5 Years 3.09 5.67
Since Inception 5.39 5.52
Past performance may or may not be sustained in future.
*Benchmark Index from April 1, 2002
Note: Returns are calculated on a compounded annualised basis for a period of more than one year and absolute basis for a period less than or equal to one year, with reinvestment of dividends/ bonus, if any.
Rs. 0.30 per unit dividend declared in the scheme in February 2002.
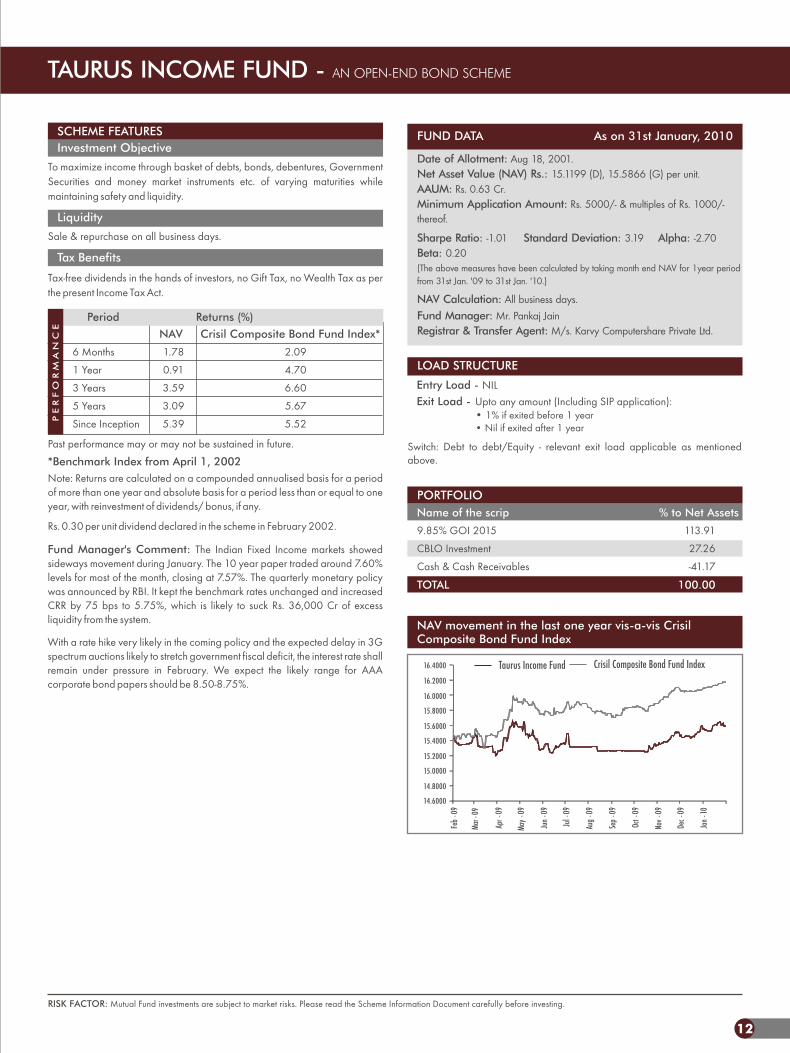
Fund Manager's Comment: The Indian Fixed Income markets showed sideways movement during January. The 10 year paper traded around 7.60% levels for most of the month, closing at 7.57%. The quarterly monetary policy was announced by RBI. It kept the benchmark rates unchanged and increased CRR by 75 bps to 5.75%, which is likely to suck Rs. 36,000 Cr of excess liquidity from the system.
With a rate hike very likely in the coming policy and the expected delay in 3G spectrum auctions likely to stretch government fiscal deficit, the interest rate shall remain under pressure in February. We expect the likely range for AAA corporate bond papers should be 8.50-8.75%.
SCHEME FEATURES
Investment Objective
Liquidity
Tax Benefits
FUND DATA As on 31st January, 2010
Date of Allotment: Aug 18, 2001.Net Asset Value (NAV) Rs.: 15.1199 (D), 15.5866 (G) per unit.AAUM: Rs. 0.63 Cr.Minimum Application Amount: Rs. 5000/- & multiples of Rs. 1000/- thereof.
Sharpe Ratio: -1.01Standard Deviation: 3.19 Beta: 0.20(The above measures have been calculated by taking month end NAV for 1year period from 31st Jan. '09 to 31st Jan. '10.)
NAV Calculation: All business days.Fund Manager: Mr. Pankaj JainRegistrar & Transfer Agent: M/s. Karvy Computershare Private Ltd.
Alpha: -2.70
RISK FACTOR: Mutual Fund investments are subject to market risks. Please read the Scheme Information Document carefully before investing.
• 1% if exited before 1 year • Nil if exited after 1 year
Switch: Debt to debt/Equity - relevant exit load applicable as mentioned above.
LOAD STRUCTURE
PORTFOLIO
Name of the scrip % to Net Assets
TOTAL 100.00
9.85% GOI 2015 113.91
CBLO Investment 27.26
Cash & Cash Receivables -41.17
14.6000
14.8000
15.0000
15.2000
15.4000
15.6000
15.8000
16.0000
16.2000
16.4000
Feb
-09
Mar-
09
Apr-
09
May
-09
Jun
-09
Jul-
09
Aug
-09
Sep
-09
Oct-
09
Nov-
09
Dec-
09
Jan
-10
NAV movement in the last one year vis-a-vis CrisilComposite Bond Fund Index
Taurus Income Fund Crisil Composite Bond Fund Index
PE
RF
OR
MA
NC
E
13
TAURUS GILT FUND - AN OPEN-END GILT SCHEME
FUND DATA As on 31st January, 2010
Date of Allotment: Aug 18, 2001.Net Asset Value (NAV) Rs.: 13.6070 (D), 13.8859 (G) per unit.AAUM: Rs. 0.02 Cr.Minimum Application Amount: Rs. 5000/- & multiples of Rs. 1000/- thereof.Sharpe Ratio: -8.84Standard Deviation: 0.26 (The above measures have been calculated by taking month end NAV for 1year period from 31st Jan. '09 to 31st Jan. '10.)
NAV Calculation: All business days.
Fund Manager: Mr. Pankaj Jain.
Registrar & Transfer Agent: M/s. Karvy Computershare Private Ltd.
Alpha: -2.32
To provide risk free returns to the investors even for a shorter duration through investment in securities issued by Central Government or State Government or any security unconditionally guaranteed by Government of India. Investment will also be made in repos and reverse repos.
Sale & repurchase on all business days.
Tax-free dividends in the hands of investors, no Gift Tax, no Wealth Tax as per the present Income Tax Act.
Period Returns (%)
NAV I-Sec Composite Index*
6 Months 0.62 1.34 1 Year 1.79 1.06 3 Years 2.73 8.54 5 Years 1.24 7.38 Since Inception 3.96 6.97
Past performance may or may not be sustained in future.
*Benchmark Index from April 1, 2002
Note: Returns are calculated on a compounded annualised basis for a period of more than one year and absolute basis for a period less than or equal to one year, with reinvestment of dividends/bonus, if any.
Rs. 0.30 per unit dividend declared in the scheme in February 2002.
Fund Manager's Comment: The Indian Fixed income markets showed sideways movement during January. The 10 year paper traded around 7.60% levels for most of the month, closing at 7.57%. The quarterly monetary policy was announced by RBI. It kept the benchmark rates unchanged and increased CRR by 75 bps to 5.75%, which is likely to suck Rs. 36,000 Cr of excess liquidity from the system.
With a rate hike very likely in the coming policy and the expected delay in 3G spectrum auctions likely to stretch government fiscal deficit, the interest rate shall remain under pressure in February. The 10 year benchmark paper may trade in a range of 7.55%-7.75% before the budget is announced.
SCHEME FEATURES
Investment Objective
Liquidity
Tax Benefits
RISK FACTOR: Mutual Fund investments are subject to market risks. Please read the Scheme Information Document carefully before investing.
• 1% if exited before 1 year • Nil if exited after 1 year
Switch: Debt to debt/Equity - relevant exit load applicable as mentioned above.
LOAD STRUCTURE
NAV movement in the last one year vis-a-vis I SecComposite Index
Taurus Gilt FundI Sec Composite Index
12.0000
12.5000
13.0000
13.5000
14.0000
14.5000
15.0000
15.5000
Feb
-09
Mar
-09
Apr-
09
May
-09
Jun
-09
Jul-
09
Aug-
09
Sep
-09
Oct-
09
Nov-
09
Dec-
09
Jan
-10
TAURUS TAX SHIELD - An open-end equity linked saving scheme
Taurus Tax Shield
With exemplary track record in performance, Taurus Tax Shield offers
has been Ranked No.1 Performing Fund in the ELSS category out of 29 funds for 3 years returns as on January 31, 2010 by Value Research.
It gives your investment the potential growth of equities with the added advantage of tax saving under Section 80C. You can also opt for a SIP and make the rupee cost averaging work in your favour.
•
•
•
Tax saving opportunity along with capital growth
Tax saving up to Rs. 30,900/- under Section 80C*
Personal Accident Death Insurance upto 5 times of the invested amount not exceeding Rs. 5 Lakhs
• Dividend history:
*
*
•
Declared 10% dividend in November 2009
Declared 30% dividend in FY 2008 - ’09
Shorter lock-in period of 3 years
* Declared 15% dividend in January 2010
Save tax. Invest in performance.
To Invest, call Taurus Asset Management Company Limited
Past Performance may or may not be sustained in future.
SAVE TAX with the fund that’s
*RANKED No. 1
Statutory Details: Taurus Mutual Fund has been constituted as a Trust under the Indian Trust Act, 1882. Sponsor: HB Portfolio Ltd. Trustee: Taurus Investment Trust Company Ltd., Investment Manager: Taurus Asset Management Company Ltd. Risk Factors: All investments in mutual funds and securities are subject to market risks and the NAV of the scheme may go up or down depending upon the factors and forces affecting the securities market. There can be no assurance that the scheme's investment objectives will be achieved. The past performance of the mutual fund is not indicative of the future performance of the schemes. The sponsor is not responsible or liable for any loss resulting from the operation of the scheme beyond the initial contribution of Rs. 2 Lakhs made towards setting up of the mutual fund. Taurus Tax Shield is only the name of the scheme and does not in any manner indicate the quality of the scheme, its future prospects and returns. There is no guarantee or assurance as to any returns on investments of the unit holders. All dividend distributions are subject to the investment performance of the scheme. The investment made by the scheme is subject to external risks on transferring, pricing, trading volumes, settlement risks etc of securities. Please read the scheme information document carefully before investing. *Ranked No. 1 Performing Fund out of 29 funds in the ELSS category for 3 years returns as on January 31, 2010 by Value Research. *Under Income Tax Act 1961 for an investment of Rs. 1 lakh assuming that the investor falls under the maximum tax slab of 30% plus education cess; applicable for Finance Act, 2009.