Tax Credits for Health Insurance Leonard E. Burman and Jonathan Gruber Discussion Paper No. 19 June 2005 Leonard E. Burman is a senior fellow at the Urban Institute, codirector of the Tax Policy Center, and a visiting professor at Georgetown University. Jonathan Gruber is professor of economics at MIT and research associate at the National Bureau of Economic Research. The authors gratefully acknowledge comments and very helpful tables from Linda Blumberg, and research assistance from Fredric Blavin, Troy Kravitz, and Bill Lincoln. Fiona Blackshaw and Susan Kellam edited the paper. Support for this research was provided by the Macarthur Foundation.
Transcript
Tax Credits
for Health Insurance
Leonard E. Burman and
Jonathan Gruber
Discussion Paper No. 19
June 2005
Leonard E. Burman is a senior fellow at the Urban Institute, codirector of the Tax Policy Center, and a visiting professor at Georgetown University. Jonathan Gruber is professor of economics at MIT and research associate at the National Bureau of Economic Research.
The authors gratefully acknowledge comments and very helpful tables from Linda Blumberg, and research assistance from Fredric Blavin, Troy Kravitz, and Bill Lincoln. Fiona Blackshaw and Susan Kellam edited the paper. Support for this research was provided by the Macarthur Foundation.
Background..................................................................................................................................... 3 Summary Data and Historical Trends......................................................................................... 3 Current-Law Treatment of Employer-Sponsored Insurance ...................................................... 4 Health Insurance Market Failure ................................................................................................ 7 Effects of Current Tax Subsidies ................................................................................................ 8
Who Benefits from the Current Tax Exclusion?........................................................................... 10 Employment-Based Coverage .................................................................................................. 10
Financing Tax Credit Proposals.................................................................................................... 20 Conclusion .................................................................................................................................... 21 References..................................................................................................................................... 23 Appendix 1. Why a Non-group Health Insurance Credit Is Equivalent to a Tax on ESI.......... 25 Appendix 2. A Short Description of the Gruber Microsimulation Model................................. 27 Tables and Figures .........................................................................................................................29
1
Tax Credits for Health Insurance
Over 40 million Americans under age 65—the overwhelming majority of them in working families—lack health insurance. They are less likely to obtain important preventive screenings while healthy, and they receive lower-quality care when sick.1 And, the public ultimately shoulders the burden of paying for the medical treatment of those lacking insurance, through either higher taxes or higher health care costs.
Moreover, health insurance costs more than it would in a perfect market, for several reasons. First, the very act of having insurance tends to increase utilization. People spend more when someone else is writing the check, but this causes insurance to be more expensive than it might be (a phenomenon known as moral hazard). Second, insurance tends to be most attractive to people who expect to benefit most from it—such as those with chronic conditions and people who plan to have children. Since insurers can only imperfectly match premiums to expected utilization, they have to assume that purchasers have higher costs than the population average. That means that healthy people get a relatively bad deal from insurance—unless they can align themselves with a large group. (This feature of insurance is called adverse selection.) Third, the existence of free—even if inadequate—emergency health care for those with low incomes serves as a deterrent for purchasing health insurance, both because the free care provides a safety net and because uncompensated care tends to raise the cost of care for those with insurance. Finally, healthy people—especially in the non-group market—can only imperfectly insure against the costs of developing chronic illnesses, because premiums for non-group health insurance tend to increase over time for sick people.
The government, in fact, intervenes heavily in the market for health insurance. Low-income households (and especially low-income children), those deemed “medically needy,” military families and veterans, and the elderly all benefit from publicly provided insurance. Other working-age individuals and families receive substantial tax subsidies. Health insurance paid for by employers is a tax-free fringe benefit—exempt from both income and payroll taxes. In addition, self-employed individuals can deduct the cost of health insurance premiums from their taxable income. These tax subsidies are worth over $140 billion a year.
The subsidies have worked in one sense: employer-sponsored insurance (ESI) covers more than two-thirds of workers and their families. Arguably, encouraging individuals to get insurance at work deals with the problem of adverse selection and also offers those who work for large firms a kind of renewable insurance (at least as long as they continue working and their employer continues offering insurance). However, the tax subsidies are poorly targeted. The value of a tax exclusion grows with income and is worth little or nothing to those with low incomes, even though they are most likely to be deterred by the cost of insurance.
The tax subsidies also tend to exacerbate the moral hazard problem mentioned above. Higher-income employees tend to value insurance very highly, in part because of the tax benefits. As a result, they tend to acquire relatively generous coverage. To address this problem, Congress enacted a provision in 2003 aimed at encouraging employees to purchase high- 1 Hadley (2003) estimates that mortality declines by 4.5 to 7.0 percent for people when they gain health insurance.
2
deductible health insurance, either directly or through their employers. Individuals with qualifying high-deductible health insurance can contribute pre-tax dollars in a health savings account (HSA), and withdrawals used to pay for medical care are also tax-free. Employer contributions to HSAs receive the same generous tax treatment as contributions to employer-sponsored insurance. This kind of turbocharged IRA is very valuable to higher-income (high tax bracket) employees, especially those who are healthier than average.
Numerous proposals would provide additional tax subsidies for health insurance. Most notably, for the past four years President Bush has proposed to provide a refundable tax credit for the purchase of health insurance by lower-income individuals not covered by employer-sponsored health insurance or a public insurance program. Although critics have complained the subsidy is far too small to substantially expand coverage among those who most need help, it would represent a major new expenditure on behalf of the poor.
Expanding health coverage through the tax system may not be the most efficient path, but tax subsidies appear the only game in town for expanding the federal role in the provision of health insurance. This paper examines the implications of major expansions in tax credits for health insurance, starting with the President’s refundable tax credit proposal. Based on a microsimulation model, we examine the effects of the proposal on health insurance coverage generally, coverage by type of insurance (employer versus non-group), and the distribution of benefits by income level. At least in the short run, the President’s proposal would modestly expand the number of people with health insurance on net, but it would also cause significant dislocations—many people currently covered by health insurance at work would lose that coverage and would not be covered by alternative insurance. Yet, many currently uninsured people would gain coverage and many low-income people who already pay for their own insurance would see the cost of insurance reduced by the subsidy.
We also examine the impact of other, more generous tax subsidies in this paper. The basic model is a tax credit designed to mimic a voucher equal to the difference between the cost of insurance and 10 percent of a household’s income. Importantly, this plan assumes that affordable health insurance would be available to individuals through the Federal Employees Health Benefits Plan (FEHBP), or something similar, whereas the President’s proposal makes no such guarantee. We examine the effect of policies that would allow the credit only for individual non-group coverage (as in the President’s plan), only for employer-sponsored insurance, or for insurance acquired in either market. All these options would reduce the number of uninsured by far more than the President’s proposal, but at greater cost. The non-group-only credit would also cause millions of people to become newly uninsured, although two people would gain insurance for every one who loses it. The other two policies would not cause significant numbers of people to lose insurance, but their costs would be commensurately greater. All the reform options are much more progressive than the current tax subsidy.
The first section of this paper provides some background on the market for health insurance. A second section reviews who benefits from the current employer tax exclusion. The third section examines the four reform options. A concluding section sums up and lays out areas for future research.
3
Background
Summary Data and Historical Trends
Most working-age Americans and their families receive health insurance through employers. According to the March 2004 Current Population Survey (CPS), 164 million nonelderly Americans (65 percent) in 2003 received primary health insurance coverage from either their own or a family member’s employer (see figure 1). Of the 35 percent without employer-sponsored insurance (ESI), about half were uninsured and most of the rest were enrolled in a public health plan (including Medicaid, Medicare, or a program sponsored by the Department of Veterans Affairs).2 Only 4 percent of Americans under age 65 were covered by private non-group insurance in 2003.
The number of nonelderly people who cite no primary source of health insurance grew markedly over the late 1980s and most of the 1990s, rising from 31.8 million in 1987 to a peak of 43.9 million in 1998 (see figure 2). The trend reversed at the end of the decade as the combination of a tight labor market and a moderation in the growth in health insurance premiums caused more employers to offer health insurance. The number who appeared to lack insurance fell to 41.9 million by 2000.
More people may have insurance than these statistics suggest, however. Starting with the March 2000 CPS, which collected data for 1999, interviewers asked respondents who did not report any type of health insurance whether they were, in fact, uninsured. Of the 42.1 million persons who did not report health insurance coverage prior to the verification question, 3.1 million responded that they were not uninsured and did in fact have health insurance coverage (Nelson and Mills 2001). This reduces the number of uninsured in 1999 to 39.0 million. Again, in 2001, 3.5 million people who did not report having insurance said that they were not uninsured in response to the verification question. Based on this measure, 40.9 million nonelderly people were uninsured in 2001—2.5 million more than in 2000. The upward trend continued through 2003, reaching a peak of 44.4 million. The rise is likely the combined result of the recession that started in 2001 and escalating health care costs.
The probability of having insurance coverage increases with age, income, and firm size (see table 1). Only 10 percent of workers between ages 50 and 64 were uninsured in 2003, but nearly 28 percent of workers between ages 18 and 29 lacked health insurance coverage. Workers in poor households are much less likely to have insurance coverage than those with modest or higher incomes. Almost half of poor workers (workers in families with incomes below the federal poverty level) and about 40 percent of near-poor workers (workers in families with incomes up to twice the federal poverty level) lacked insurance in 2003. In contrast, only 22 percent of workers with incomes between two and three times the federal poverty level and 7 percent of those with incomes greater than three times the federal poverty level were uninsured.
Small firms are much less likely to offer health insurance than larger firms. In 2003, about 32 percent of workers at firms with fewer than 10 employees were covered through their
2 VA insurance includes CHAMPUS, CHAMPVA, and any government-sponsored military health insurance plan.
4
own employer. Another 24 percent were covered by a spouse’s ESI, but 31 percent were uninsured. In contrast, 72 percent of workers at firms with more than 1,000 employees were enrolled in a health insurance plan sponsored by their employer, while 10 percent remained uninsured.
Although a large part of the disparity between small and large firms is likely the result of the higher premiums charged to small groups, another factor is the difference in income levels between workers at small and large firms. Employees at small firms often earn less than employees at large firms, and so are less likely to have health insurance coverage for that reason. Indeed, Nichols et al. (1997) found that high-income workers at small firms in 1993 were more likely to be offered ESI than low-income workers at large firms.3 Nonetheless, workers at every income level were much more likely to be offered insurance by a large employer than by a small one.
Although few people rely on non-group health insurance plans for primary coverage, those without access to ESI are much more likely to do so. Non-group coverage is especially important among workers in small firms. Nearly 10 percent of workers in firms with fewer than 10 workers were covered by non-group coverage, compared with about 2 percent of workers in firms with 100 or more workers.
There are also significant differences between adults and children: children are much more likely to be insured. While 20 percent of adults lack health insurance, less than 12 percent of children do. This pattern holds across income levels. Poor children are about half as likely to be uninsured as poor adults (23 percent versus 45 percent, as shown in figure 3). Even among households with incomes at least four times the poverty level, adults are 3 percentage points more likely to be uninsured than children. There are several factors behind this dichotomy. First, families without children do not generally qualify for Medicaid, regardless of income, and State Children’s Health Insurance Programs (SCHIP) cover some children ineligible for Medicaid. Second, at higher incomes, families with children may value health insurance more than childless households. Third, childless nonelderly adults probably tend to be younger on average than those with children. As discussed earlier, younger adults are much less likely to have insurance.
Current-Law Treatment of Employer-Sponsored Insurance
The tax law provides substantial subsidies for employment-based health insurance. Employer contributions to employee health insurance are treated as nontaxable fringe benefits and are excluded from compensation for both income tax and payroll tax purposes.4 If the employer contribution does not cover the entire premium, the employee pays for the remainder out of after-tax dollars. So the tax exclusion only applies to the employer’s share of the premium. Employees
3 In addition, lower-income workers are less likely to accept an offer of health insurance than those with high incomes because they cannot afford to pay their share of the premium. 4 See Lyke and Sroka (2003) for an excellent summary of current-law tax provisions and proposals related to health insurance.
5
with access to flexible spending accounts (FSAs), however, may be able to pay their share out of pre-tax dollars.5
Employers may purchase insurance for their employees or provide insurance themselves (i.e., self-insure—typically, in a plan managed by a third-party administrator). Section 105 of the Internal Revenue Code sets out nondiscrimination rules for benefits provided by self-insured plans aimed at preventing highly compensated managers from providing generous tax-free benefits for themselves that are not available to the rank-and-file workers.6 The Employee Retirement Income Security Act of 1974 (ERISA) exempts self-insured plans from state mandates and taxes on health insurance premiums that apply to third-party insurers.
Section 125 of the Internal Revenue Code allows employers to set up so-called “cafeteria plans” for certain employee benefits. A cafeteria plan allows employees to choose to receive part of their compensation as cash wages or in the form of one or more nontaxable fringe benefits, including health insurance. Flexible spending accounts are closely related to cafeteria plans. They allow employees to set aside a fixed dollar amount of annual compensation to pay for out-of-pocket expenses for medical and dental services, prescription drugs and eyeglasses, and the employee’s share of the cost of employer-sponsored health insurance. An FSA is financed through regular salary reductions. Any amount unspent at the end of the year is forfeited to the employer. Medical-related benefits paid through a cafeteria plan or FSA are excluded from employees’ taxable income for both income and payroll tax purposes. As a result, employees with access to such plans may pay for all or most of their medical costs with pre-tax dollars.
The Consolidated Omnibus Budget Reconciliation Act of 1985 (COBRA) amended ERISA to require employers with 20 or more employees who provide health insurance to their employees (whether self-insured or not) to allow participants and other beneficiaries (i.e., family members) to purchase continuing coverage for at least 18 months after it would otherwise cease for any reason, including termination, death, or divorce. Employers cannot charge covered employees more than 102 percent of the applicable premiums for covered employees for continuation of coverage.
The Trade Adjustment Assistance Reform Act of 2003 created a 65-percent refundable tax credit for health insurance purchased by workers certified by the Department of Labor as having lost their jobs due to foreign competition as well certain others covered by a pension taken over by the Pension Benefit Guaranty Corporation.
Most individuals who purchase their own insurance directly (including those covered by COBRA) cannot deduct the cost. However, individuals may deduct the portion of premiums they pay for health insurance plus other medical expenses that exceed 7.5 percent of adjusted gross
5 These employees tend to be at larger firms. FSAs are discussed later. 6 In contrast, no nondiscrimination rules apply to the provisions of commercially purchased health insurance. The Tax Reform Act of 1986 included a new Section 89, which set out nondiscrimination rules for employee benefits generally (including health insurance), but the new restrictions raised a firestorm of protest among business interests and others and were repealed in 1989.
6
income (AGI). In addition, starting in 2003, the self-employed may deduct their health insurance premiums from income tax (although not payroll tax).7
The Health Insurance Portability and Accountability Act of 1996 (HIPAA) established a four-year pilot program to make Medical Savings Accounts (MSAs) available to a limited number of people who are self-employed or work for small firms. The Medicare Prescription Drug Improvement and Modernization Act of 2003 renamed MSAs Health Savings Accounts (HSAs) and made them available to workers regardless of firm size. To qualify, individuals must be under age 65 and covered by a high-deductible health insurance plan, either offered at work or purchased in the non-group market. The deductible must be at least $1,000 for single coverage and $2,000 for family coverage. The maximum deductibles in 2005 are $2,650 and $5,250, respectively.8 Employer contributions to an employee’s HSA up to the deductible are excluded from taxable income for both income and payroll tax purposes—that is, they are treated the same as contributions to ESI. Individuals’ contributions to an HSA are deductible for income tax purposes.9 Individuals 55 to 64 may make additional “catch-up” contributions of up to $600 a year in 2005.10 Balances in an HSA may be withdrawn to pay for qualifying medical expenses without penalty; nonmedical withdrawals are subject to income tax, and withdrawals made before age 65 are subject to an additional 10 percent penalty. Unspent balances in an HSA can accumulate tax-free.
These supplemental tax subsidies for health insurance are small compared with the exclusion for employment-based health insurance. They will reduce income tax revenues by an estimated $13 to $15 billion in fiscal year 2006. In contrast, the employer exclusion will reduce income tax revenues by between $93 and $126 billion in the same year.11 Including payroll taxes, the total revenue loss could be as much as $190 billion per year.12
7 Before 2003, self-employed people could only deduct a portion of their health insurance premiums. 8 The maximum deductibles (although not the minimums) are indexed for inflation. 9 If the individual contributions are made through a cafeteria plan, they are also excluded from income for payroll tax purposes. 10 The catch-up contribution limit phases up to $1,000 by 2009. The concept of a catch-up contribution was implemented for individual retirement accounts and defined contribution plans in the Economic Growth and Taxpayer Relief and Reconciliation Act of 2001, based on the logic that women had to make additional contributions to catch up for the time spent out of the labor force. This is a dubious justification for a provision that mostly benefits men, but its application to HSAs is truly puzzling since their ostensible purpose is to offset unusually high medical expenses, not provide another retirement savings vehicle. 11 The official government estimates are done for Congress by the Joint Committee of Taxation (JCT) and for the administration by Treasury’s Office of Tax Analysis (OTA). Their estimates for the deduction for medical expenses and for health insurance premiums of the self-employed are similar, but their estimates for the exclusion from income tax of ESI diverge markedly. OTA estimates that the latter provision will reduce revenues by $126 billion in fiscal year 2006; JCT estimates a $93 billion revenue loss. The JCT estimates are smaller because they assume that, absent the tax exclusion, individuals who itemize deductions would be able to deduct the part of their health insurance premiums that, combined with other medical expenditures, exceeds 7.5 percent of AGI. OTA does not account for this offsetting deduction because it would logically require an increase in the tax expenditure estimate for the itemized deduction for health expenditures. Note that tax expenditure estimates are different from revenue estimates because, by convention, they do not take into account most behavioral responses or interactions with other tax expenditures. See Office of Management and Budget (2005) and JCT (2005). 12 Payroll tax revenue losses are more than half of the income tax revenue cost. (See Burman et al. 2003.) Thus,
7
Health Insurance Market Failure
Many arguments for government intervention in the health insurance market are based on the notion that the market would otherwise fail to operate efficiently. For example, market efficiency requires that buyers and sellers have complete product information, but lack of information is an endemic problem for both suppliers and consumers in the health insurance market. Insurers have only a limited ability to determine the health status—the risk—of any individual. As a result, a health insurance company that sets a fixed price for individuals in a particular class is most attractive to those with the highest risk. This so-called adverse selection causes the average insurance purchaser to have above-average risk, which raises the insurer’s costs and forces premiums to rise. Higher premiums then drive out lower-risk individuals, and the spiral continues. In theory, if adverse selection is severe enough, a market might even disappear (Rothschild and Stiglitz 1976).
Medical care is a unique commodity—when people become sick, they’ll do almost anything to get well. And because there often is a lack of information on the effectiveness of various therapies, physicians attempting to provide the best care possible may prescribe tests or treatments regardless of whether there is evidence that they will lead to improved health. Aside from any moral or ethical objections, this lack of information renders cost-benefit analysis nearly impossible for the physician or patient and decisions are often made with little regard for cost (Aaron 1991). This may be a virtue for the ill, but from an economic perspective it becomes a vice.
Insurance gives individuals an incentive to overconsume health care because they only have to pay a fraction of the cost (deductible and coinsurance). They will demand medical procedures until the marginal benefit to them equals their out-of-pocket expense.13 Individuals who are fully insured may consume care until its marginal benefit is nil. To counteract this tendency, insurers rely on managed care schemes designed to limit unnecessary medical expenditures.
It is unclear, however, how much of the cost of medical care is due to this moral hazard that arises from the low net-of-insurance price of insured care. Newhouse (1992) argues that the lion’s share of growth of health expenditures is attributable to advances in medical technology, not moral hazard. He concludes that overzealous efforts to limit moral hazard could do more harm than good if they reduce the incentive for medical innovation.
So-called free riders create another classic market failure. Because hospitals generally do not turn away very sick people who need care, the incentive to purchase insurance is diminished, especially for people who have little wealth to protect. So a small part of the health cost incurred by insured people and taxpayers is the cost of providing care for other individuals who did not provide for their own insurance—that is, who choose to “free-ride” (Olson 1982).
conservatively, the payroll tax expenditure would be at least $63 billion, based on Treasury numbers, or $46 billion, based on JCT’s estimates. This yields a range of $139 to $189 billion or more for the combined revenue loss. 13 The marginal benefit is net of non-pecuniary costs, such as pain and discomfort, and other costs, such as lost time from work.
8
Finally, a necessary condition for economic efficiency is the existence of complete markets—against not only current, but also future, risks. But it is virtually impossible to insure fully against future illness. Individuals cannot generally contract for health insurance at fixed rates, or under fixed terms, for more than one year in advance. While individuals can buy policies with rates determined by the experience of a subscriber group who purchased at a certain time, adverse selection causes such pools to be too expensive for healthy members over time. Members of the pool who turn out to be healthier than average can find insurance elsewhere with lower premiums. As the healthiest drop out, those who become sick and remain in the pool end up paying very high premiums. Thus, even in a set pool, insurance costs are based on health status in the future as well as when the policy is purchased (Hall 2000a).
The 1996 Health Insurance Portability and Accountability Act requires that all non-group insurance be renewable, but there is no limit on annual premium increases. Some states attempt to regulate premiums in the non-group market, but insurers can often find ways to circumvent those regulations (Hall 2000b).
Inability to renew on favorable terms may also arise in the employer market because premiums are underwritten. A large employer group partially solves this problem by continually refreshing the pool with healthy members who participate in the group for reasons largely unrelated to health status. Small employers, however, may be even more vulnerable to poor health outcomes than individuals in the non-group market.
Effects of Current Tax Subsidies
The federal government spends $140 billion or more a year on tax incentives for employer-sponsored health insurance. Those incentives encourage employees to participate in health insurance plans, reducing adverse selection and free ridership. At the same time, the subsidy causes employees to demand more comprehensive health insurance than they would if they had to pay the full price. More comprehensive insurance exacerbates moral hazard (Congressional Budget Office 1994). The tax incentive could be a significant contributor to high health care costs. Combined with state laws and courts that put pressure on insurers to provide more and more benefits, health insurance costs in the small group and individual markets tend to climb out of reach of low- and moderate-income households.
The new Health Savings Accounts are intended to mitigate the moral hazard problem by encouraging individuals to be more cost-conscious in their decisions about medical care. But HSAs may exacerbate the problem of adverse selection, since the high-deductible plans will be most attractive to healthy individuals.
Similarly, there are both advantages and disadvantages to tying health insurance to employment. The main advantage of subsidizing ESI is that employment is a natural way to pool health insurance risks, since people choose employment for many reasons other than their expected use of health care. Employment pooling works best for large firms, but Pauly and Herring (1999) claim that even relatively small groups can effectively pool most risks.
Administrative and marketing costs are lower for large groups (Monheit, Nichols, and Selden 1995). Collecting premiums as a part of payroll processing is less expensive than direct
9
billing. Collecting insurance premiums, either explicitly or implicitly as a part of payroll processing, may also be an especially effective way to encourage participation because individuals like to break up large expenses into small, automatically collected pieces (Thaler 1992). Also, if the choice facing workers is framed in terms of opting out rather than opting into an insurance plan, participation rates are higher. Large groups also have bargaining power to lower costs when dealing with insurers and providers. And, to the extent that workers can count on long-term employment with an established firm, ESI may provide more protection against premium increases than does the individual market.14
But ESI has drawbacks as well. It is an imperfect pooling mechanism. In a small firm, if one person gets sick, average costs can increase dramatically. Also, ESI provides limited renewability at best. People can lose their jobs or employers can decide to drop coverage—for example, because of unacceptably large premium increases.15 Although no better mechanism for pooling or renewability exists in the individual market, such a mechanism might have arisen were it not for the large tax subsidy for ESI. For example, if subsidized, professional associations, unions, or religious institutions might offer group health insurance policies to their members, much as they do with life insurance (Pauly and Herring 2001).
Finally, the subsidy for ESI tends to amplify the advantage of large firms over small ones in the provision of health insurance. To see why, imagine a world without an ESI tax exclusion. Many large firms might still offer health insurance even without a tax subsidy because of their advantages in pooling and lower administrative costs. Few if any small firms would. Now, after a tax exclusion is introduced, taxes fall for employees who work for firms that offer health insurance, but not for other firms. Firms that do not offer health insurance now would face pressure from their employees to offer this valuable tax-free fringe benefit, and many would choose to do so, but their cost of compensation increases relative to the large firms because, for a given package or benefits, health insurance is more expensive for small firms. This tends to place them at a competitive disadvantage, i.e., their profits are lower than at larger firms because of the tax subsidy. Effectively, the tax exclusion for ESI is a differential labor subsidy that is most valuable to large firms, tending to distort the allocation of labor and reduce production efficiency. 14 An actuarially fair premium for a long-term health insurance contract would be one that does not vary over time in response to unexpected changes in health status. The long-term health insurance contract could allow premiums to vary with age to reflect the normal increase in health expenditures that accompanies aging, much as term life insurance contracts call for increasing premiums with age to reflect higher expected mortality risk. Initial premiums under such a contract would probably be higher than those in the current individual market because they would provide insurance protection not only against the health care costs incurred during that year, but also against increased premiums due to unexpected declines in health status. (A mitigating factor, however, is that long-term insurance might be more attractive to people who are healthier than average because they would value the insurance against future declines in health status.) As discussed earlier, individuals may find that their non-group health insurance premiums increase over time if they turn out to be sicker than average, even if they were healthy when they first purchased insurance (Hall 2000a). However, as discussed later, it may not be feasible for any single insurer to offer an actuarially fair premium schedule set for periods longer than one year because of adverse selection among individuals covered by such insurance. 15 HIPAA requires insurers to offer insurance to terminated employees who have exhausted their COBRA coverage, but insurers can and do charge much higher rates for HIPAA customers. For example, CareFirst (Blue Cross-Blue Shield) charges a markup of almost 50 percent for HIPAA coverage in Virginia compared with otherwise identical underwritten policies (http://www.carefirst.com, March 27, 2003).
10
The subsidy for ESI also creates other production inefficiencies. It provides an incentive for employers to outsource certain workers (low-income workers and younger workers who would not value the insurance as much) and affects workers’ decisions about work and retirement (CBO 1994).
For all its imperfections, however, ESI covers more than three-quarters of American workers. Although some analysts believe that a better mechanism would arise in the absence of ESI, there is a risk that major tax changes could significantly reduce insurance coverage. Removing or reducing the incentive for employers to sponsor health insurance would produce countervailing effects on coverage. Although some young, healthy people might be induced to gain coverage in the individual non-group market under a different set of incentives, the loss of ESI could be particularly devastating to old and unhealthy workers who would face prohibitively high health insurance premiums in the private non-group market.
Thus, the conundrum: more than 40 million Americans lack health insurance. Subsidizing the purchase of private non-group insurance for those who cannot obtain it at work seems a natural remedy. But subsidizing private non-group insurance makes employment-based insurance less valuable to those who could enroll in subsidized private insurance. Some employers will stop sponsoring health insurance if their workers don’t demand it. Not all the workers at those firms would purchase non-group coverage. Others may increase the employee share of premiums or increase the cost-sharing requirements under the company health insurance plan (i.e., provide less generous insurance). Depending on how employers respond, a new coverage initiative might actually end up reducing the number of people with health insurance.
Who Benefits from the Current Tax Exclusion?
The current tax exclusion for employment-based health insurance benefits some workers more than others. Clearly, the exclusion does not benefit uninsured workers. Even among workers with employer-sponsored coverage, the benefits of the tax exclusion vary widely. Individuals in low tax brackets—mostly low-income people—get little or no benefit from the tax exclusion. Those with more generous coverage, such as family coverage or insurance with low deductibles, benefit more because the premiums for their health insurance policies are higher. These also tend to be higher-income families.
Employment-Based Coverage
The subsidy for ESI most benefits those with high incomes, for several reasons. First, because the subsidy is provided in the form of an exclusion from income, it is most valuable to those who face high marginal tax rates. Second, those with low incomes are much less likely to be in jobs that offer health insurance than people with higher incomes. Third, lower-income people who do get health insurance at work tend to get less generous coverage than those with higher incomes do and their employers tend to pay a smaller share of the premium.
11
The value of the tax exclusion increases with income
Earning compensation in the form of health insurance rather than wages produces indirect tax benefits. It can reduce both income tax and payroll tax liability. For example, people in the 15 percent federal income tax bracket save $150 in income taxes for every $1,000 of wages converted to employer contributions toward health insurance premiums. They save another $76.50 in Social Security and Medicare payroll taxes. In most states, they also pay less state income tax. So the combined value of income and payroll tax exclusions can reduce the overall cost of health insurance by 25 percent or more for middle-income families.
The value of the tax exclusion increases sharply with income because income tax rates rise with income. The Tax Policy Center estimates that about 30 percent of households were in the zero tax bracket in 2004.16 Most of them did not save anything in federal income taxes from reducing their taxable wages.17 Another 15 percent were in the 10 percent bracket and 34 percent were in the 15 percent bracket. The income tax exclusion is worth 15 cents on the dollar or less to those households. Only about 20 percent of households were in the 25 percent or higher tax bracket.
The lowest-income taxpayers receive no benefit from the income tax exclusion and only a small benefit from the exclusion of Medicare payroll taxes.18 The exact amount depends on whether workers or employers ultimately pay the employer’s portion of payroll taxes. Most economists believe that workers pay the tax in the form of lower wages. To see why, suppose an employer is willing to pay $20,000 to a particular worker before considering taxes. If the 16 Table T04-0104, available at www.taxpolicycenter.org/estimates. In 2004, 14.8 percent of tax filing units (generally, households) did not file and another 15.6 percent filed but were in the zero tax bracket (meaning that they had zero taxable income after claiming deductions). 17 Some people in the zero bracket who receive ESI may benefit from the exclusion of employer-sponsored health insurance from taxable income. Some people’s incomes are below the filing threshold simply because their health insurance premiums are excluded from income. For example, an individual earning $7,500 in 2001 has no taxable income. However, if her employer stopped contributing $2,000 toward health insurance and instead increased her wages by that amount, he or she would have positive taxable income and owe $300 in tax on it. Note, though, that few people at this income level receive ESI (see table 1). There are also families in the 15 percent tax bracket that would receive no benefit from the tax exclusion because nonrefundable tax credits such as the child tax credit and the dependent care tax credit offset all their income tax liability. 18 They would also save on Social Security payroll taxes, but that saving comes at the expense of lost benefits at retirement, a significant factor for low-income workers, as discussed later. Very low income workers may also save unemployment insurance taxes, but those savings also come at the expense of lost potential benefits.
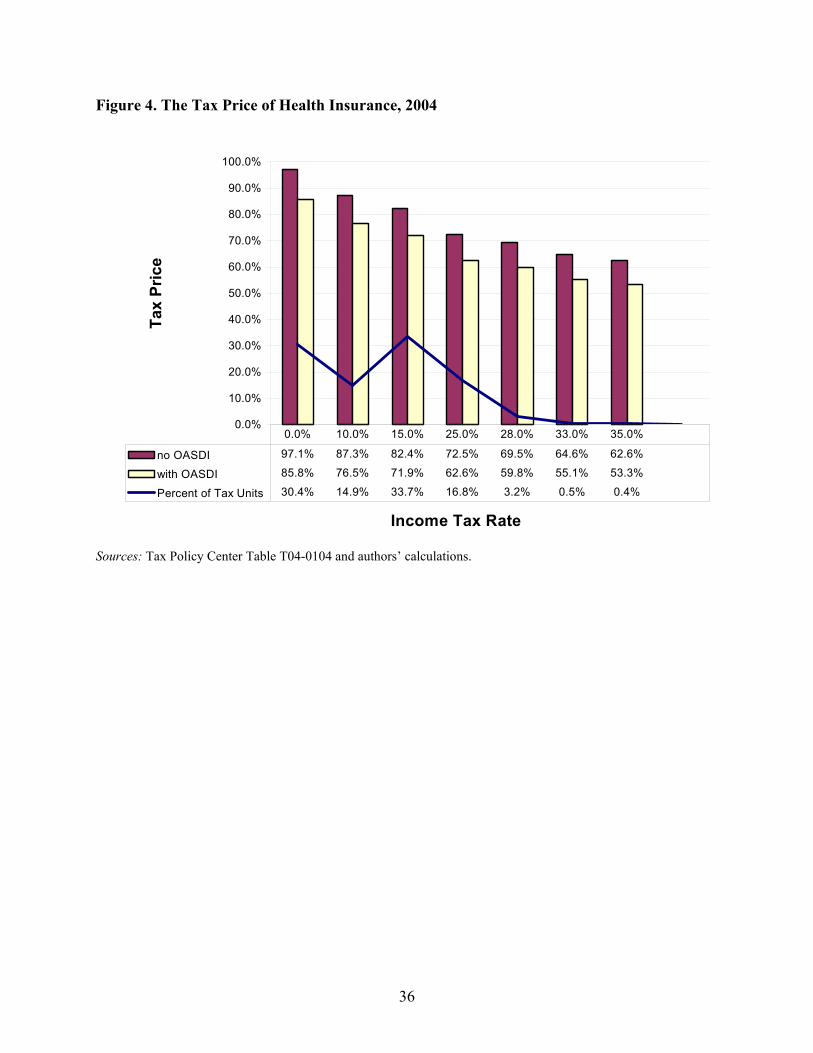
The Tax Price of Health Insurance
The tax price of health insurance measures how taxes alter the price of health insurance.
If the employer pays the entire premium, the tax price of ESI is 1 - s, where s is the subsidy rate. Thus, if there are no tax subsidies (s = 0), the tax price is 1. If s is 50 percent, the tax price is 0.5. The lower the tax price, the less expensive health insurance is after tax savings are subtracted. If the employer pays only a fraction, a, of the cost of health insurance, the tax price increases to 1 - as. Thus, the smaller the share paid by employers, the higher the tax price.
12
employer has to pay payroll taxes at a rate of 7.65 percent, the employee now costs more than he or she is worth to the employer. Either the employee will not be hired any longer, or compensation would have to decline to $18,579 or less to make the employee attractive to the employer. (Payroll tax on $18,579 is $1,421, so the total after-tax cost of the employee is $20,000.)
At least in the long run, employees are likely to pay the cost of the employer portion of payroll taxes in the form of lower wages. The exception to this rule would be situations where compensation is not set freely in a competitive labor market. An obvious example would be workers earning the minimum wage whose employers are prevented by statute from passing along payroll taxes (or most other labor expenses) in the form of lower wages.19
Overall, the subsidy created by the exclusion from income and Medicare payroll taxes was worth about three cents on the dollar to the roughly 30 percent of tax filing units who were in the zero tax bracket in 2004 (see figure 4). That is, the after-tax “price” of the portion of health insurance provided by employers was 97.1 percent of the pre-tax price for employees in the zero bracket. If employers cannot pass payroll taxes on to employees in the form of lower wages, the tax price would be close to 99 percent of the pre-tax price of health insurance.
Employees in the 10 percent tax bracket pay a tax price of 87.3 percent, those in the 15 percent bracket pay 82.4 percent, and those in the 25 percent tax bracket face a tax price of 72.5 percent. The 0.4 percent of tax filing units in the highest 35 percent tax bracket face a tax price of 62.6 percent. Put differently, the subsidy rate is more than 12 times bigger for the richest 0.4 percent of tax filers than it is for the poorest 30 percent.
The issue is a bit more complex in the case of Social Security taxes. If we include savings in Social Security taxes, the tax price faced by low-income workers would fall from 97.1 percent to 85.8 percent of premiums. Social Security benefits, however, are highly progressive, so reduced future benefits are likely to offset much or all of a low-income person’s payroll tax savings. Feldstein and Samwick (1992) estimate that the lifetime effective Social Security tax rate (including both payroll taxes and benefits) for employees with low covered earnings was negative in 1990. That is, the present value of future benefits more than offsets the tax paid for people with very low earnings. If employees understand that their current taxes will produce a valuable future benefit, then it may be inappropriate to treat Social Security payroll contributions as a tax for lower-income people.20 So workers with low lifetime incomes may view the tax savings from health insurance as conveying no benefit at all since they sacrifice more than a dollar of retirement benefits for every tax dollar saved now.
The connection between Social Security benefits and taxes is weaker for higher-income people. For them, it might be more appropriate to treat Social Security payroll taxes as a pure tax. Under that assumption, someone in the 15 percent federal income tax bracket faces a tax price for health insurance of as little as 72 percent of premiums. In the 25 percent tax bracket, the 19 This is one reason small firms and those with low-wage workers are less likely to offer ESI. 20 Feldstein and Samwick (1992) point out that many individuals with low covered earnings were not in fact poor, but earned most of their income working for state and local governments that were exempt from the Social Security payroll tax.
13
price is under 63 percent. For very high income taxpayers, the price can fall near 50 percent, but most primary earners in the 35 percent tax bracket are not subject to Social Security taxes on the margin, so the 63 percent tax price is more appropriate.21
Effective tax subsidy rates
The tax exclusion for ESI provides a subsidy for health insurance that varies both among individuals and firms. An individual gets no benefit from the tax exclusion if his or her employer does not offer health insurance. Even if the employer offers insurance, the employee may not be eligible for it because he or she works part-time. The subsidy rate generally depends on the percentage of the health insurance premium that is paid for by the employer. One exception is if the employer offers employees access to a flexible spending account, which allows employees to pay for their own share of premiums with pre-tax income. For employees with access to ESI, the overall size of the subsidy is governed by the amount of the premiums, and the subsidy rate depends on their income and payroll tax rates.
Virtually all factors that lead to high subsidy rates on health insurance increase with income. Burman et al. (2003) find that the likelihood of having employer-sponsored insurance coverage increased dramatically with income in 1998. Only 11 percent of families with incomes below $10,000 had health insurance through their job, compared with over 80 percent of families with incomes above $40,000. Lower-income families were less likely to work in jobs that offer health insurance coverage (Cooper and Schone 1997). Even if their employer offered it to full-time employees, low-income people are more likely to work either part-time or part-year, and therefore be ineligible for health coverage.
Like the subsidy rate, the value of the tax exclusion also increases dramatically with income. Among families with employer-sponsored health insurance, the premiums for those with incomes below $20,000 averaged less than $2,800 in 1998 (Burman et al. 2003). Average premiums more than doubled for families with incomes above $75,000. Higher-income families average higher premiums because they are more likely to be covered by multiple policies and have family rather than self-only coverage. Indeed, the average family size for those with incomes below $20,000 is about 1.9, compared with 3.1 for those with incomes above $75,000. In addition, lower-income families are more likely to have coverage for less than a full year because of part-year employment.22 The average employer premium share also increased with income, from 66 percent for families with incomes less than $10,000 to 79 percent for families with incomes of $200,000 or higher.
Finally, as discussed in the previous section, the benefit of any tax exclusion is greatest for high-income families because the income tax is progressive. That is, excluding a dollar of 21 On the other hand, phantom taxes caused by the phaseout of itemized deductions and other provisions can increase the effective tax rate for upper-middle- and upper-income taxpayers. However, since these taxes are obscured by the complexity of the tax law, it is unclear that they would affect most taxpayers’ decisions (Burman and Gale 2001). 22 It is probably also true that higher-income people demand more generous health insurance coverage from their employers than their lower-income counterparts, just as higher-income people are more likely to drive a Lexus than a Chevy. Unfortunately, we are not aware of any evidence on the quality and comprehensiveness of health insurance plans offered by employers to employees at different income levels.
14
income from tax is worth much more to someone in the 35 percent tax bracket than to one in the 10 percent or 0 percent tax brackets.
Putting all these factors together, the picture is of a tax subsidy that overwhelmingly favors middle- and upper-income households. Families in the lowest income group received an average tax subsidy (including both income and payroll taxes) worth 9 percent of their premiums in 1998, compared with a subsidy of 33 percent of premiums for the highest-income group.23 Consequently, while high-income families on average receive ESI worth three times as much as that received by low-income families, it only costs 2.3 times as much after tax savings are considered.
The bottom line is that the subsidy is not at all targeted to those who most need help paying for health insurance. Health insurance premiums were 40 percent of income for the poorest households in 1998, but their subsidy rate was less than 10 percent (see figure 5). Those with incomes over $200,000 received subsidies equal to one-third of premiums even though premiums would amount to only 3 percent of their income without a subsidy.
Tax Credit Simulations
One response to the shortcomings and inequalities of the current system is to provide refundable tax credits to help low-income households acquire health insurance, either at work or in the private non-group market. Because the credits would be refundable, they would be tantamount to a voucher based on income.24 The credits could be limited to purchases in the individual non-group market, as under the President’s proposal, to insurance sponsored by employers, or to both. The most expansive credits would do the most to expand coverage and cause the fewest disruptions but would also be most costly to implement.
We consider four policy options. The first option is President Bush’s proposal to allow a credit of $1,000 per covered adult and $500 per covered child (up to two children) for a maximum family credit of $3,000. The credit rate phases out at certain income levels: between $15,000 and $30,000 for singles, $25,000 and $40,000 for single parents, and $25,000 and $60,000 for joint filers. In principle, the taxpayer could elect to take the credit in advance based on prior-year income, producing a kind of voucher that could be transferred to an insurer, although the exact mechanism to accomplish this is unclear. A taxpayer who participates in his or her employer’s health insurance plan or in a public insurance plan would be ineligible for the credit. Although the analysis here looks only at the use of the credit in the non-group health insurance market, the tax credit could also be applied toward the cost of coverage purchased 23 The tax subsidy discussed herein reflects both the federal income tax and the payroll tax, and applies to premiums only. It does not consider any worker premiums paid on a pre-tax basis or other pre-tax contributions made to a flexible savings account, each of which will also favor higher-income workers relative to lower-income workers. 24 This section assumes that the credits would be available for use at the time the individual must pay premiums for health insurance, rather than after the end of the year at tax filing time. At least in theory, this is feasible. President Bush has proposed credits that would be transferable to insurers who sell qualifying insurance at a discount that reflects the credit amount. In principle, a similar mechanism could allow employers to pay all or a portion of premiums on behalf of qualifying employees using transferable credits. In practice, such a mechanism is likely to be very difficult to implement effectively.
15
through private purchasing groups, state high-risk pools, and state-sponsored insurance purchasing groups.
The other three options are more generous credits to individuals and families covered by ESI, those covered by non-group insurance, or both groups. These options assume a refundable tax credit equal to the difference between the cost of modest health insurance coverage and 10 percent of income. We assume that individuals use the credit to buy health insurance from an FEHBP-like pool, and we assume the cost of the policy is the same as the FEHBP Blue Cross option (the most popular option among federal employees), which is $3,951 for singles and $9,255 for families in 2004. For purposes of simulation, we assume eligibility is based on the current year’s income, although it could be structured the same as the President’s plan (i.e., with an option to base eligibility for a transferable credit on the prior year’s income).
Results
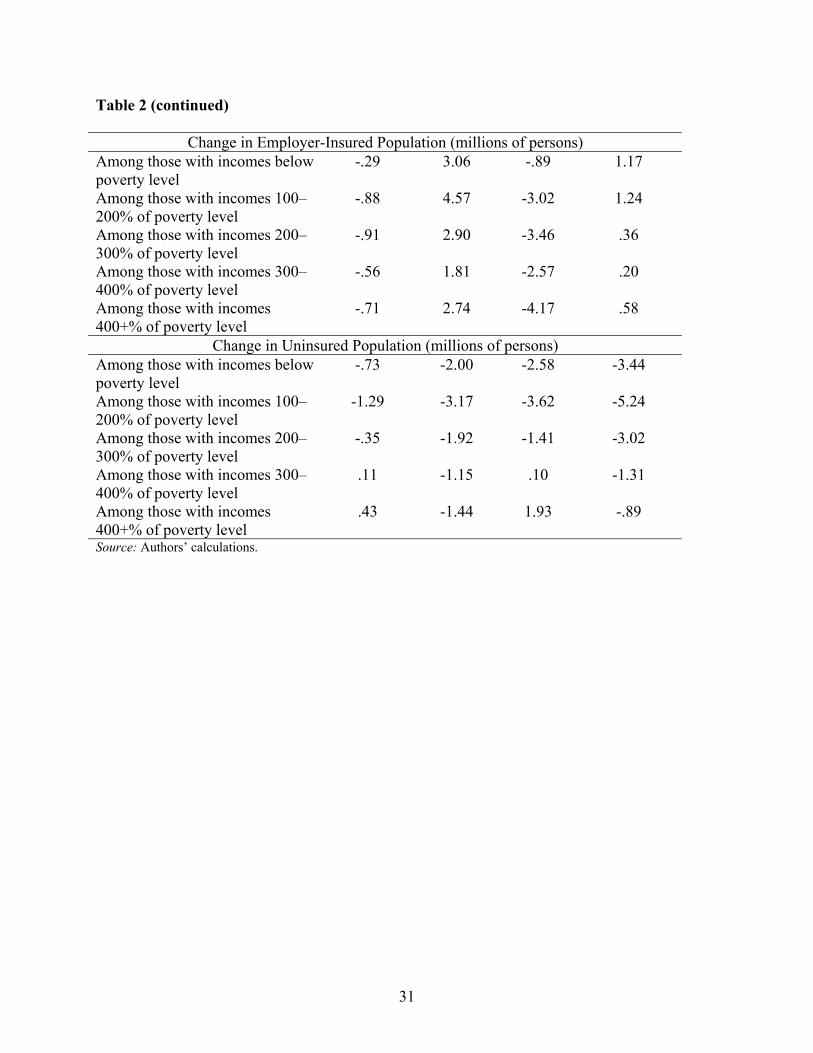
The results of these runs are presented in table 2. The table has columns for each of the four policy options considered. The rows show the impact of these policies on insurance coverage, government expenditure, and the income distribution.
Given budgetary limitations on any public approach to expand health insurance coverage, a key concept that drives reform is the cost-effectiveness of the policy. There are several different measures of cost-effectiveness, which are discussed below, but the basic concept is the extent to which new public spending is directed to those who would otherwise be uninsured, as opposed to “buying out the base” of existing insured individuals.25 The central issue to all these definitions is targeting. If individuals were indelibly labeled as “insured” or “uninsured”, then the government could easily target new tax subsidies to those labeled uninsured, with no spending on those labeled insured. In fact, this is not the case: insurance status is an individual choice, and individuals can respond to government policy in a way that raises its cost.
An alternative policy objective might be to reduce the financial burden of insurance on low-income households, even if they are currently insured. Under this criterion, buying out the base is an explicit policy objective that advances horizontal equity. It also can reduce economic distortions, as people do not have an incentive to switch their insurance provider solely for tax purposes.
The primary drawback of more expansive tax credit proposals is their effect on the federal budget. Three factors increase the cost of tax credit proposals. The first is spending on those who already have coverage through the subsidized form of insurance. For example, those already holding non-group insurance will benefit most directly from subsidies for non-group insurance. Yet the use of subsidies by this group does nothing to reduce the number of the uninsured.
25 To be clear, this is a political, not an economic, constraint. In economic terms, buying out the base is efficient because it does not alter behavior. In contrast, trying to eliminate windfalls by excluding those with employment-based insurance creates economic distortions—for example, it deters participation in employment-based health insurance. However, if the windfalls under the economically neutral alternative are financed by higher taxes, those taxes would also create economic distortions.
16
The second is the crowd-out of other forms of insurance through subsidizing a particular form of insurance. For example, when the government subsidizes non-group insurance, it can lead those with group insurance to move to the non-group market, either by their decision (switching out of employer-provided insurance) or by their employer’s decision (dropping the insurance offered at the firm or increasing the employees’ share of premiums). Effectively, limiting the subsidy to non-group insurance is the same as a generally available credit with a tax (equal to the amount of the credit) on those who choose to acquire insurance through employers (see appendix 1). This crowd-out may or may not increase government spending. For example, when individuals leave employer-provided insurance for non-group insurance, they increase spending on new non-group subsidies but decrease spending on the existing exclusion of employer-provided insurance purchases. On net, the effect on government spending is unclear.
The third factor that diminishes cost-effectiveness is the possible reduction in coverage for those who are insured before the policy is put into place. For example, suppose a firm has a workforce that is predominantly, but not universally, eligible for a non-group credit. This firm might decide to stop offering health insurance, stranding the minority of employees that cannot use the credit without employer coverage or a subsidized alternative. This rise in uninsurance offsets the reductions in the ranks of the existing uninsured, reducing the efficiency of the program by raising spending per newly insured person.
There are several different ways to measure cost-effectiveness. The traditional measure is the dollars of public spending per person newly insured. Another measure of interest is the extent of crowd out: the reduction in employer-provided insurance when other forms of insurance are subsidized (or when the existing subsidies to employer-provided insurance are reduced). A third measure is the (gross) rise in the uninsured—from firm dropping, for example. A fourth measure is the share of beneficiaries of any intervention that were previously uninsured, as opposed to the share receiving subsidies to remain insured.
A final measure incorporates the type of uninsured who are impacted by reform. Simply counting the dollars per newly insured is unsatisfactory when different reforms may appeal to very different populations. For example, a reform that significantly increases insurance coverage among children will have much lower costs than one that primarily affects higher-cost adults. But this comparison is unfair; the latter reform is essentially extending more valuable insurance coverage than is the former. So a better measure of cost-effectiveness is the spending per dollar of insurance value provided, which reflects both the numerical increases in coverage and the cost of the individuals provided coverage.
Bush Credit
The first column of table 2 refers to the credit proposed by President Bush in his FY 2006 budget proposal. It is much less expensive than any other policies examined. Only 3.12 million uninsured people take up the credit, but a large portion of those who take up the credit were previously uninsured.
However, as noted, by limiting the credit to non-group insurance, the proposal is tantamount to a tax on ESI (see appendix 1). Because the credit favors non-group insurance over ESI, many employers choose to drop coverage. Almost 3.4 million individuals lose ESI. Most of
17
these people switch to non-group insurance, but 1.3 million previously insured people become uninsured as a result of this policy. On balance, 1.8 million people gain health insurance.
Note that these simulations are based on a number of assumptions about economic behavior. Altering those assumptions could result in qualitatively important changes. For example, under different assumptions, much more employer dropping might occur or adverse selection could be a severe problem in the private non-group market, in which case President Bush’s proposal could actually increase the number of people without insurance. (See, e.g., Lav and Friedman 2001.)
The expenditures on the Bush plan are modest compared with the other options. The total federal cost is $4.9 billion, representing additional federal spending of $2,654 per newly insured person. The states actually save money because 300,000 fewer people are covered by public insurance. We estimate that the federal and state governments together save an average $2,300 per person who leaves public insurance. Overall, states save $425 million under this option.26
Nonetheless, the federal government would spend more than two dollars for every dollar of insurance value provided under this option because the newly insured tend to be younger and healthier than the population at large and those losing employer coverage tend to be less healthy than average. The average age of the newly insured under this plan is 24.9 years old, and only 2.1 percent are in fair or poor health, while 40.2 percent are in excellent health. By comparison, the average age of all uninsured persons is 30 years old, 9 percent of whom are in fair or poor health, and 29 percent of whom are in excellent health.
As a result, the average health cost is only $1,431 for the newly insured.27 Thus, on balance, total spending equals $2.23 per dollar of insurance provided. Put differently, the excess spending—over and above the incremental health cost of the insured population—is $1.23 per dollar of coverage provided.
By design, subsidy dollars are targeted at lower-income individuals; 69 percent of subsidy dollars go to those with incomes below 200 percent of the poverty level. As a result, lower-income individuals experience the largest declines in uninsurance rates. In contrast, the number of people with incomes above three times the poverty level who lack health insurance increases on average. This occurs because their employers drop coverage and they are ineligible for the health insurance credits, so their cost of insurance increases substantially.
The President’s proposal would significantly reduce the number of people covered by employer-sponsored insurance. More than 8 percent of those currently covered by ESI, or 3.36 million people, would no longer be covered by employment based health insurance. Of those losing employer coverage, 1.84 million purchase non-group coverage and 0.23 million become
26 The state savings come from two sources. First, states spend less on Medicaid and other public insurance. Second, states with income taxes gain because taxable incomes increase as fewer employers offer insurance and the share of income excludible from taxable income (for employees who still get ESI) is reduced by the amount of the federal credit. 27 For this calculation, we impute to each person in the data the cost of insuring them through public insurance (which is roughly 15 percent below the cost of private insurance) as a measure of the “true” insurance cost.
18
covered by Medicaid. Another 1.29 million become uninsured—1.13 million because their employers drop coverage and 0.16 million because the employer contribution toward health insurance premiums is reduced.
Employer Credit
The employer credit would cover many more people, but at much greater cost. About 9.7 million uninsured persons would gain coverage under this proposal. But most of the credits will be claimed by those who already have insurance: only about 6 percent of those who take up the credit were previously uninsured, while 94 percent already had insurance—mostly ESI. The employer credit is a windfall for them.
According to the simulations, nobody loses insurance because of this policy. Qualifying individuals who start with ESI have an even stronger incentive to participate in their employers’ plans after the credit is enacted, so no employers drop coverage and many are induced to offer it for the first time. Individuals with non-group coverage have no incentive to drop their coverage unless they can find an employer that offers insurance. The simulations suggest that about 2.7 million individuals with non-group coverage acquire ESI; another 2.7 million with public insurance switch to ESI. On balance, 15.1 million people get ESI who did not have it before, but more than 5 million simply switch from other insurance coverage.
The employer credit costs the federal government a total of $141 billion a year. With just under 10 million persons gaining insurance coverage, this implies that the policy costs the federal government $14,558 per person gaining coverage. This policy is the least cost-effective but also the least disruptive.
As with the President’s proposal, people gaining coverage under this proposal tend to be slightly younger and healthier than average. The average age of the uninsured person that gains insurance is 29.7 years old; 8.2 percent are in fair or poor health and 30 percent are in excellent health. The average cost for those gaining insurance through the employer credit is $1,984, about $100 less than the average cost of insuring all uninsured people.
The government spends $7.22 per dollar of insurance value provided. Roughly speaking, the extra spending associated with this approach to providing insurance, relative to an ideal which gave insurance only to those who were otherwise uninsured, is $6.22. This large cost arises from the fact that most of the dollars spent on this policy are going to those who are already insured.
This subsidy is not well targeted by income either. Only 11 percent of subsidy dollars go to those with incomes below the poverty level, less than half the share under the President’s plan. In contrast, 18 percent goes to those with incomes three or four times the poverty level, and 16 percent to those with incomes over 400 percent of the poverty level. Relative to other types of policies, this distribution represents a large portion of subsidy dollars that go to upper-income individuals, primarily to those already employer-insured that take advantage of the credit.
Nonetheless, the employer credit would significantly expand coverage for lower-income people. More than 3 million people below the poverty level gain employer-sponsored insurance, and another 4.57 million with incomes between one and two times the poverty level gain ESI. At
19
the same time, many higher-income people gain coverage—2.74 million people above 400 percent of the poverty level gain employer insurance, in part due to the considerable size of the pool of higher-income people who could gain from the credit.28
Reductions in the number of uninsured occur across all income levels. These reductions are somewhat concentrated in the lower income categories, with 2 million people below the poverty level and 3.17 million people between 100 and 200 percent of the poverty level gaining insurance. In the final rows, we find that 1.92 million, 1.15 million, and 1.44 million people in the top three income brackets newly acquire insurance.
Non-group Credit
The next column of the table shows that a generous non-group credit can significantly expand coverage, but with significant disruptions. Several differences from the employer credit are immediately apparent. Although a similar number of uninsured individuals take advantage of the credit, this number represents 39 percent of those who take it up. Unlike the employer credit, almost half as many people lose insurance coverage as gain it under this option. 10.46 million previously uninsured people gain non-group coverage, but 4.87 million who had employer coverage become uninsured. Although the magnitude of this response may seem large in response to a fairly small credit, it is important to remember that this dropping comes off a very large base of over 160 million employer-insured workers. We also see a large increase of 20.38 million non-group insured, and corresponding decreases of 14.11 million employer-insured and 0.69 million publicly insured.
The most striking difference between the two credits is the cost. The non-group credit costs more than $100 billion less than the employer credit. Moreover, the cost per newly insured individual is considerably lower—$7,106. This increase in cost-effectiveness is driven by spending geared much more effectively toward the uninsured.
The newly insured under the non-group credit are on average younger and healthier than those who would be newly insured under the employer credit, with an average age of 26.3 years old and only 2.9 percent in fair or poor health. This is reflected in the average cost of each newly insured person, $1,549, and the spending per dollar of insurance provided, $5.74. The partial subsidy to non-group insurance considered here is much more attractive to healthy individuals for whom the subsidy equals a large percentage of non-group insurance premiums. As a result, the average value of insurance to those who take up these kinds of credits is often less than that provided by other types of policies. This explains why the non-group credit looks much more efficient than the employer credit when looking at the “cost per newly insured” measure as opposed to looking at the “spending per dollar of insurance provided” measure.
The number of people covered by employer-sponsored health insurance decreases in all income levels. The smallest change is for those with incomes below the poverty level, primarily because relatively few of them have employer-sponsored insurance before the credit is
28 Compared with the President’s proposal, this option provides subsidies to people with much higher incomes. Households with incomes up to $92,550 would qualify for at least a partial credit toward their family health insurance premiums.
20
implemented. The non-group credit also causes significant numbers of low- and moderate-income people (those with incomes below 300 percent of the poverty level) to become uninsured. This is a paradoxical result for the group that qualifies for the largest credits. Many of those with incomes over 300 percent of the poverty level also lose insurance coverage, largely because of firm dropping.
Employer and Non-group Credits
A credit for both ESI and non-group insurance would expand coverage the most, but at the greatest cost. The combined credit avoids the implicit tax on ESI (or non-group) insurance that occurs with a discriminatory credit. In this case, ESI retains a small tax advantage over non-group insurance because the tax exclusion remains, although that factor is not large for the lower-income people who are most likely to be uninsured.
A total of 14.19 million uninsured people gain coverage under this alternative, representing only 8.6 percent of those who take advantage of the credits. The low percentage is primarily the result of the large number of previously employer-insured who take advantage of the employer credit. With this reduction in the uninsured comes a small increase of 0.3 million individuals who lose their insurance, mostly because of firm dropping. This figure represents a far smaller increase in the uninsured than under the non-group credit alone, indicating that the pressure for employers to drop workers off their insurance plans is almost wholly mitigated by the incentives to retain and expand their plans in the employer credit. The remaining increases of 3.55 million employer-insured and 12.96 million non-group-insured and the net decrease of 2.61 million publicly insured are all somewhat expected owing to the magnitude of population changes in columns 2 and 3.
The annual cost to the federal government of this plan is $155 billion, considerably less than the sum of the costs of the employer and non-group credits taken separately. With over 14 million people gaining insurance coverage, this implies a cost of $11,186 per person for each newly insured individual. This figure is close to the mean of the figures for the employer and non-group credits. Similarly, the spending per dollar of insurance value—$6.50—lies between the values for the two separate credits.
The distribution of subsidy dollars, however, closely resembles that of the employer credit. This is because of the much larger take-up of the employer credit than the non-group credit and, to a lesser extent, the higher average health spending of those who take advantage of the employer credit.
The number of employer-insured increases somewhat at all income levels, but especially in the lower income categories. The number of uninsured at all income levels also decreases significantly. The reductions are also the largest at lower income levels.
Financing Tax Credit Proposals
Significantly expanding coverage in our current, largely private, voluntary system is costly. The President’s proposal would cost nearly $5 billion a year, and reduce the ranks of the uninsured
21
by less than 2 million people. If employer dropping is pervasive enough, the number of people without insurance could actually increase.
The much more generous credits simulated in columns 2 to 4 of table 2 would be much more costly. The employer credit would cost about $141 billion in 2004; the individual credit, $40 billion; and the combined credit, $155 billion. The two options that expand coverage most would roughly double the annual tax expenditure on health insurance.29 Raising this much additional revenue would be politically difficult, but financing such large (and growing) tax expenditures through deficits would be fiscally irresponsible and, in any event, not sustainable for long.30
Table 3 illustrates one option to pay for the revenue cost of the new tax credit proposals in 2004—a proportional across-the-board increase in tax rates.31 The Bush credit would be financed by an average rate change of 0.7 percent.. The 10 percent bracket would become 10.07 percent; the top 35 percent rate would become 35.3 percent. To finance the employer credit, however, rates would have to go up by more than 18 percent. The 10 percent bracket would become 11.8 percent; the 35percent bracket would balloon to 41.4 percent. If both ESI and non-group were eligible for the credit, rates would have to swell by 20 percent. The non-group-only credit would require a comparatively modest 5.5 percent increase in rates.
Note that all these proposals would get more expensive over time because health costs are expected to grow significantly faster than price levels and income. As a result, the required rate changes necessary to achieve revenue neutrality would grow larger over time.
There are numerous other possible financing mechanisms, but all would be difficult to enact.
Conclusion
The government provides over $140 billion a year in tax subsidies for employment-based health insurance. Consequently, over two-thirds of Americans under age 65 are insured through an employer (Americans age 65 and over are primarily covered by Medicare). However, there are significant gaps in coverage, especially among small firms and low-income workers. Current tax
29 Technically, the refundable portion of the tax credit would be treated as an outlay in official budget scoring, not as a tax expenditure. The discussion here treats both the outlay and revenue portions as tax expenditures. 30 Part of the revenue cost could be offset by eliminating the current employer exclusion for ESI. Since the exclusion would primarily benefit those with incomes too high to benefit for a substantial credit under these options, this policy would increase taxes on higher-income households to partially offset the cost of the tax subsidy for low- and middle-income households. The risk of this policy is that it would shift more people away from ESI and reduce the net gains in coverage. 31 These estimates do not account for interactions between rates and the cost of credit proposals. ESI is a more valuable fringe benefit at a tax rate of 42 percent than at a rate of 35 percent. As a result, raising rates might induce more employers to offer health insurance. However, since most higher-income people already receive insurance at work, the large tax increases at the top may have little practical effect on the offer of insurance, at least in the short run.
22
subsidies are poorly suited to addressing those gaps because they favor higher-income workers and large firms that face the lowest insurance costs.
Proposals have been made to provide tax credits or deductions for the purchase of insurance outside work. Those proposals could improve equity between people who are and aren’t currently covered by ESI but they threaten to cause many middle-income people to lose insurance coverage and could even reduce the number of people with insurance under some plausible assumptions (Blumberg 1999). The Council of Economic Advisers (2000) concludes that any such estimates are highly uncertain.
Making the tax credit available to workers with ESI could virtually guarantee that few if any people would lose coverage, but those policies are very expensive. A tax credit for ESI would reduce the number of uninsured individuals by almost 10 million, according to our simulations, compared with a net reduction of 5.6 million people for a generous credit for non-group insurance and 1.8 million for the President’s much more targeted subsidy. But the cost of the employer credit per newly insured person would be $14,558, more than twice as much as the generous non-group credit and more than five times as much as the President’s proposal. Making the credits available to both ESI and non-group insurance would reduce the cost per newly insured person and maximize the reduction in people without insurance, but at an annual budget cost of over $155 billion.
In short, there is no magic bullet to expand health insurance coverage with minimal disruptions and low cost to the Treasury. The President’s plan is relatively frugal but would cause millions of workers to lose their employment-based health insurance. It might not even reduce the number of people without insurance. The generous credit for non-group health insurance would allow many more people to acquire insurance than under the President’s plan but would also cause more people to lose coverage, and the budget cost would be much greater. The other options minimize disruption, but would vastly increase the deficit.
One option not considered here would be to pay for health insurance tax credits by scaling back or eliminating the existing exclusion for employment-based health insurance. Such an option would likely increase the efficiency of any of these proposals, albeit at the cost of some employer dropping. It is unclear, however, whether such options would have any political feasibility in the foreseeable future.
23
References
Aaron, Henry J. 1991. Serious and Unstable Condition: Financing America’s Health Care. Washington, DC: The Brookings Institution.
Blumberg, Linda J. 1999. “Expanding Health Insurance Coverage: Are Tax Credits the Right Tack to Take?” Washington, DC: The Urban Institute.
Burman, Leonard E., and William G. Gale. 2001. “A Golden Opportunity to Simplify the Tax System.” Brookings Policy Brief No. 77. Washington, DC: The Brookings Institution.
Burman, Leonard E., Cori E. Uccello, Laura Wheaton, and Deborah Kobes, 2003. “Tax Incentives for Health Insurance.” Tax Policy Center Discussion Paper No. 12. Washington, DC: The Tax Policy Center.
Congressional Budget Office (CBO). 1994. The Tax Treatment of Employment-Based Health Insurance. Washington, DC: U. S. Government Printing Office.
Cooper, Philip F., and Barbara Steinberg Schone. 1997. “More Offers, Fewer Takers for Employment-Based Health Insurance: 1987 and 1996.” Health Affairs 16(6): 142–49.
Council of Economic Advisers. 2000. “Reaching the Uninsured: Alternative Approaches to Expanding Health Insurance Access.” Washington, DC: Council of Economic Advisers.
Feldstein, Martin, and Andrew Samwick. 1992. “Social Security Rules and Marginal Tax Rates.” National Tax Journal 45(1): 1–22.
Fronstin, Paul. 2000. “Sources of Health Insurance and Characteristics of the Uninsured: Analysis of the March 2000 Current Population Survey.” EBRI Issue Brief No. 228. Washington, DC: Employee Benefit Research Institute.
Hadley, Jack. 2003. “Sicker and Poorer-The Consequences of Being Uninsured: A Review of the Research on the Relationship between Health Insurance, Medical Care Use, Health, Work, and Income,” Medical Care Research and Review 60(2): 3S-75S. Available at http://mcr.sagepub.com/cgi/reprint/60/2_suppl/3S
Hall, Mark A. 2000a. “The Structure and Enforcement of Health Insurance Rating Reforms.” Inquiry 37 (Winter): 376–88.
———. 2000b. “An Evaluation of New York’s Reform Law.” Journal of Health Politics, Policy and Law 25(1): 71–100.
Joint Committee on Taxation (JCT). 2005. Estimates of Federal Tax Expenditures for Fiscal Years 2005 to 2009. JCS 1-05. Washington, DC: U. S. Government Printing Office.
24
Lav, Iris J., and Joel Friedman. 2001. “Tax Credits for Individuals to Buy Health Insurance Won’t Help Many Uninsured Families.” Washington, DC: Center on Budget and Policy Priorities.
Lyke, Bob, and Christopher Sroka. 2003. “Tax Benefits for Health Insurance: Current Legislation.” Washington, DC: Congressional Research Service.
Monheit, Alan C., Len M. Nichols, and Thomas M. Selden. 1995. “How are Net Health Insurance Benefits Distributed in the Employment-Related Market?” Inquiry 32 (Winter): 379–91.
Nelson, Charles T., and Robert J. Mills. 2001. “The March CPS Health Insurance Verification Question and Its Effect on Estimates of the Uninsured.” http://www.census.gov/hhes/hlthins/verif.html.
Newhouse, Joseph P. 1992. “Medical Care Costs: How Much Welfare Loss?” Journal of Economic Perspectives 6(3): 3–21.
Nichols, Len M., Linda J. Blumberg, Gregory P. Acs, Cori E. Uccello, and Jill A. Marsteller. 1997. “Small Employers: Their Diversity and Health Insurance.” Washington, DC: The Urban Institute.
Office of Management and Budget (OMB). 2005. Analytical Perspectives: Budget of the United States Government, FY 2006. Washington, DC: U.S. Government Printing Office.
Olson, Mancur, ed. 1982. A New Approach to the Economics of Health Care. Washington, DC: American Enterprise Institute Press.
Pauly, Mark, and Bradley Herring. 1999. Pooling Health Insurance Risks. Washington, DC: American Enterprise Institute.
———. 2001. “Expanding Coverage Via Tax Credits: Trade-Offs and Outcomes.” Health Affairs 20(1): 9–26.
Rothschild, Michael, and Joseph Stiglitz. 1976. “Equilibrium in Competitive Insurance Markets: An Essay on the Economics of Imperfect Information.” Quarterly Journal of Economics 90(4): 629–50.
Thaler, Richard H. 1992. “Saving and Mental Accounting.” In Choices Over Time, edited by George Loewenstein and Jon Elster (287–330). New York: Russell Sage Foundation.
25
Appendix 1. Why a Non-group Health Insurance Credit Is Equivalent to a Tax on ESI
A non-group credit is equivalent to a generally available tax credit partially financed by a tax on employers who currently provide health insurance. To see why, note that under the President’s proposal, an employee offered health insurance can either refuse ESI or refuse the tax credit. If she takes ESI, she loses out on a valuable tax credit. A foregone subsidy is economically equivalent to a tax.
A simple model illustrates the point. First, consider the case of a universally available tax credit, assumed to equal c per policy. (The credit could be a percentage of the premium; the algebra would be different, but the results would be qualitatively identical.) Suppose the tax price of ESI is (1 - t), where t is the effective tax rate on the exclusion from income and payroll taxes.32 If the premium for ESI is PE, then the after-tax price of ESI is PE(1 - t) - c.
If the premium for individual non-group insurance (II) is PI, then the after-credit price under this policy would be PI - c. The difference in cost between ESI and II would equal
(1) ∆ = PI - PE(1 - t),
the same as it is under current law.
The difference in premium between ESI and II for an individual may be expressed in terms of the savings from generally lower loading factors on ESI (d) plus or minus a rating factor (r) that reflects the difference between the health status of the individual and the average health status of the employer group, assuming that individual insurance is risk-rated. The risk factor, r, is defined as negative for a sick person and positive for a healthy one.
The relationship between employer and individual insurance may be written as
(2) PE = PI(1 - d + r).
Then the difference is
(3) ∆ = [(d - r)(1 - t) + t]PI,
the after-tax premium savings, ((d - r)(1 - t)), plus the tax savings attributable to the employer exclusion. This tax advantage may be appropriate if a goal is to reduce adverse selection by encouraging participation in ESI. As discussed earlier, the tax advantage for low-income workers can be fairly small (only the saving in Medicare payroll taxes). Moreover, for
32 The tax price, t, solves
p
ptτ
ττ+
−−≡−
11
1 , where τ is the marginal income tax rate and τp is the employer’s (or
employee’s) payroll tax rate. Solving for t yields the following expression: p
ptτττ
++
=1
2.
26
young, healthy employees, the advantage of switching to the rated individual market, r, may offset the overall cost advantage of ESI, especially for small firms for which d is small.
Now consider a policy where ESI doesn’t qualify for the tax credit. The after-tax cost of ESI becomes P(1 - d + r)(1 - t). The cost advantage (if any) becomes
(4) ∆‘ = [(d - r)(1 - t) + t]P - c.
Compared with ∆, the discriminatory credit effectively includes a tax of c per policy for employers who offer insurance.
When is ∆‘ likely to be negative (i.e., when will individuals opt out of ESI)?
• when d is small (i.e., small firms)
• when r is large (i.e., young, healthy employees)
• when t is small (i.e., lower-income workers)
• when c is large (i.e., tax credit significant compared with premiums)
27
Appendix 2. A Short Description of the Gruber Microsimulation Model
The Gruber model allows a user to input a set of policy parameters, and output the impact of that policy on public sector costs and the distribution of insurance coverage. The modeling approach used here is the type of “microsimulation” modeling used by the Treasury Department, Congressional Budget Office, and other government entities. This approach consists of drawing on the best evidence available in the health economics literature to model how individuals will respond to the changes in the insurance environment induced by changes in government policy.
The model takes as its base the February and March 2001 Current Population Surveys. The March survey contains information on family demographics, tax rates, and insurance coverage. The February survey contains information on insurance offering by employers. We match to these surveys information on
• group insurance costs and the distribution of premiums across employers and employees, imputed by firm location and firm size using data from the Kaiser Family Foundation– Health Research and Educational Trust 2003 employer survey;
• non-group insurance costs, which use a base cost estimated from existing non-group insurance pricing, adjusted by age, sex, and health status; and
• public insurance costs, estimated as a function of age, sex, and health status from the Medical Expenditure Panel Survey.
These base data are then used to compute, for every possible policy change, the impact of that change on the eligibility for, and price of, various types of insurance. These price and eligibility changes are then run through a detailed and integrated set of behavioral equations that relate them to behavioral responses by individuals, families, and firms. These behavioral responses are modeled using the best available evidence from the health economics literature, and include such responses as
• the extent to which the currently uninsured will purchase newly subsidized insurance coverage or take up newly available public coverage;
• the extent to which those with existing insurance coverage will take up subsidies to that type of insurance coverage (e.g., to what extent will the non-group insured take up subsidies to non-group insurance?);
• the extent to which those with one form of insurance coverage will switch to another form if it is subsidized;
• the extent to which firms will react to the subsidies of non-employer insurance by dropping their offering of insurance to their employees or cutting back on employer premium contributions to insurance; and
28
• the extent to which those employees dropped from group coverage will then take up other forms of insurance coverage.
It is very important to model potential firm responses to these policy changes. To capture firm responses, the model creates “synthetic” firms in the CPS by drawing for each worker other “coworkers” in the CPS based on that worker’s wage, industry, firm size, and health insurance offering status. These synthetic coworkers are grouped together to form firms. Firm responses are then modeled based on the average effects of policies on their workforce.
29
Table 1. Primary Source of Health Insurance for Workers Age 18 to 64, by Demographic Category, 2003
Percentage Distribution by Source of Insuranceb
Category
Number of
workersa (millions)
Own employer
Other employer
Private non-
group Public
insurance No insurance All workers 118.7 60.0 17.5 3.2 3.0 16.4 HIU income as percentage of poverty levelc Under 100 6.7 20.0 12.4 3.8 15.1 48.8 100 to 199 16.7 38.3 11.1 3.6 7.2 39.9 200 to 299 19.7 57.4 14.7 3.4 2.9 21.7 300 and over 75.6 68.9 20.0 3.0 1.1 7.0 Firm size (number of employees) Fewer than 10 18.4 31.6 24.0 9.2 4.6 30.7 10 to 24 12.1 43.7 22.1 4.3 4.0 26.0 25 to 99 16.0 57.6 17.9 2.6 3.4 18.5 100 to 499 16.7 67.4 15.7 1.7 2.3 12.8 500 to 999 67.7 16.5 1.7 2.5 11.7 1,000 or more 71.9 14.4 1.5 2.4 9.8 Age (years) Under 30 28.4 41.4 22.7 3.2 5.0 27.8 30 to 39 29.4 62.6 15.4 2.5 2.9 16.6 40 to 49 32.4 65.2 17.3 3.2 2.2 12.2 50 to 64 28.5 69.7 14.6 3.9 2.2 9.7 Source: Urban Institute estimates based on the March 2004 Current Population Survey. a Includes all employed individuals with annual earnings of at least $1,000. b If an individual is covered by more than one type of insurance, coverage is classified according to the following hierarchy: own employer, other employer, public insurance (including Medicare, Medicaid, and coverage through the Department of Veterans Affairs), and private non-group. c HIU refers to health insurance unit, a collection of people (usually a family or single person) that is or would be covered by one health insurance policy.
30
Table 2. Simulation Results for Illustrative Health Insurance Tax Credits, 2004
Policy Bush credit
Employer credit
Non-group credit
Employer and non-
group credits Changes in Population (millions of persons)
Newly insured 3.12 9.69 10.46 14.19 as percent of all credit recipients 30.3 6.1 39.4 8.6
Newly uninsured 1.29 0 4.87 0.30 Net decrease in uninsured 1.83 9.69 5.58 13.9 Net change in employer-insured -3.36 15.09 -14.11 3.55 Net change in non-group-insured 5.5 -2.65 20.38 12.96 Net change in publicly insured -0.31 -2.74 -0.69 -2.61
Costs ($2004) Federal cost per year ($millions) 4,865 141,057 39,669 155,429 Change in state spending ($millions)
-425 -2,288 -1,440 -2,692
Federal cost per newly insured ($) 2,654 14,558 7,106 11,186
Targeting Average age of newly insured (years)
24.9 29.7 26.3 27.4
Percent of newly insured in fair or poor health
2.1 8.2 2.9 4.7
Average cost of newly insured ($) 1,431 1,984 1,549 1,694 Spending per dollar of insurance provided ($)
2.23 7.22 5.74 6.50
Distribution of Subsidy Dollars (percent) To those with incomes below poverty level
24 11 22 13
To those with incomes 100–200% of poverty level
45 27 37 28
To those with incomes 200–300% of poverty level
23 27 24 27
To those with incomes 300–400% of the poverty level
6 18 10 17
To those with incomes 400+% of poverty level
2 16 6 15
31
Table 2 (continued)
Change in Employer-Insured Population (millions of persons) Among those with incomes below poverty level
-.29 3.06 -.89 1.17
Among those with incomes 100–200% of poverty level
-.88 4.57 -3.02 1.24
Among those with incomes 200–300% of poverty level
-.91 2.90 -3.46 .36
Among those with incomes 300–400% of poverty level
-.56 1.81 -2.57 .20
Among those with incomes 400+% of poverty level
-.71 2.74 -4.17 .58
Change in Uninsured Population (millions of persons) Among those with incomes below poverty level
-.73 -2.00 -2.58 -3.44
Among those with incomes 100–200% of poverty level
-1.29 -3.17 -3.62 -5.24
Among those with incomes 200–300% of poverty level
-.35 -1.92 -1.41 -3.02
Among those with incomes 300–400% of poverty level
.11 -1.15 .10 -1.31
Among those with incomes 400+% of poverty level
.43 -1.44 1.93 -.89
Source: Authors’ calculations.
32
Table 3. Income Tax Rates that Would Offset Cost of Health Insurance Tax Credits in 2004
Required Rate per Current-Law Tax Bracket (percent)
Note: The table assumes that tax rates on capital gains and dividends are unaltered and the AMT remains at 2004 levels.
33
Figure 1. Primary Source of Insurance for Nonelderly Americans in 2003
65%4%
11%
1%
1%
18%
ESIPrivateMedicaidMedicareOther publicNone
Source: Urban Institute estimates based on data from the March 2004 Current Population Survey.
Note: Medicaid includes SCHIP; Other Public includes Indian Health Service, CHAMPUS, CHAMPVA, and any government-sponsored military health insurance plan.
34
Figure 2. Nonelderly Uninsured, 1987–2003
30
34
38
42
46
1986 1988 1990 1992 1994 1996 1998 2000 2002 2004
Year
Uni
nsur
ed (m
illio
ns)
Revised estimates
Sources: Fronstin (2000), table 1, and Urban Institute tabulations of Current Population Surveys.
Notes: Revised estimates include as insured those who did not report having insurance on the CPS but then said that they were not uninsured in response to a verification question. These data are not available before 1999.
35
Figure 3. Percentage of Nonelderly Population That Is Uninsured, by Income, 2003
0
10
20
30
40
50
<100 100-199 200-299 300-399 400+
Income as % of poverty level
Perc
ent u
nins
ured
Adults 18-64
Children 0-18
Source: March 2004 CPS.
36
Figure 4. The Tax Price of Health Insurance, 2004
Sources: Tax Policy Center Table T04-0104 and authors’ calculations.
0.0%
10.0%
20.0%
30.0%
40.0%
50.0%
60.0%
70.0%
80.0%
90.0%
100.0%
Income Tax Rate
Tax
Pric
e
no OASDI 97.1% 87.3% 82.4% 72.5% 69.5% 64.6% 62.6%
with OASDI 85.8% 76.5% 71.9% 62.6% 59.8% 55.1% 53.3%
Percent of Tax Units 30.4% 14.9% 33.7% 16.8% 3.2% 0.5% 0.4%
0.0% 10.0% 15.0% 25.0% 28.0% 33.0% 35.0%
37
Figure 5. Health Insurance Subsidy Rate Compared with Premium Burden, by Income, 1998
Source: Burman et al. (2003). a The subsidy rate is defined as the tax subsidy as a percent of premiums. b The premium burden is calculated as the pre-tax premium as a percent of after-tax income.
0
0.05
0.1
0.15
0.2
0.25
0.3
0.35
0.4
0.45
1 to 9.9 10 to 19.9 20 to 29.9 30 to 39.9 40 to 49.9 50 to 74.9 75 to 99.9 100 to199.9
200 orMore
Income (thousands of dollars)
Perc
ent
Subsidy ratea
Premiumb
Other Publications by the Tax Policy Center
Discussion Paper Series
Number Title Authors Date
18 Executive Compensation Reform and the Limits of Tax Policy
Michael Doran November 2004
17 Economic Effects of Making the 2001 and 2003 Tax Cuts Permanent
William G. Gale and Peter R. Orszag
October 2004
16 Distributional Effects of Defined Contribution Plans and Individual Retirement Arrangements
Leonard E. Burman, William G. Gale, Matthew Hall, and Peter R. Orszag
June 2004
15 Effects of Recent Fiscal Policies on Today’s Children and Future Generations
William G. Gale and Laurence J. Kotlikoff
July 2004
14 Pensions, Health Insurance, and Tax Incentives Leonard E. Burman, Richard W. Johnson, and Deborah I. Kobes
January 2004
13 Searching for a Just Tax System Rudolph G. Penner December 2003
12 Tax Incentives for Health Insurance Leonard E. Burman, Cori E. Uccello, Laura L. Wheaton, and Deborah Kobes
May 2003
11 State Fiscal Constraints and Higher Education Spending
Thomas J. Kane, Peter R. Orszag, and David L. Gunter
May 2003
10 Budget Blues: The Fiscal Outlook and Options for Reform
Alan J. Auerbach, William G. Gale, Peter R. Orszag, and Samara R. Potter
May 2003
9 Private Pensions: Issues and Options William G. Gale and Peter Orszag
April 2003
8 The Economic Effects of Long-Term Fiscal Discipline
William G. Gale and Peter Orszag
April 2003
7 Charitable Bequests and Taxes on Inheritances and Estates: Aggregate Evidence from across States and Time
Jon Bakija, William G. Gale, and Joel Slemrod
April 2003
6 The Enron Debacle: Lessons for Tax Policy Jane G. Gravelle February 2003
5 The Individual AMT: Problems and Potential Solutions
Leonard E. Burman, William G. Gale, Jeffrey Rohaly, and Benjamin H. Harris
September 2002
4 Providing Federal Assistance for Low-Income Families through the Tax System: A Primer
Frank Sammartino, Eric Toder, and Elaine Maag
July 2002
3 An Economic Evaluation of the Economic Growth and Tax Relief Reconciliation Act of 2001
William G. Gale and Samara R. Potter
March 2002
2 How Marriage Penalties Change under the 2001 Tax Bill
Adam Carasso and C. Eugene Steuerle
May 2002
1 The Effect of the 2001 Tax Cut on Low- and Middle- Income Families and Children
Leonard E. Burman, Elaine Maag, and Jeff Rohaly
April 2002
Issues and Options Series
Number Title Author Date
10 Options to Reform the Estate Tax Leonard E. Burman, William G. Gale, and Jeffrey Rohaly
March 2005
9 High-Income Families Benefit Most from New Education Savings Incentives
Susan Dynarski February 2005
8 The American Jobs Creation Act of 2004: Creating Jobs for Accountants and Lawyers
Kimberly A. Clausing December 2004
7 Promoting 401(k) Security J. Mark Iwry September 2003
6 Effects of Estate Tax Reform on Charitable Giving Jon M. Bakija and William G. Gale
July 2003
5 The AMT: Out of Control Leonard E. Burman, William G. Gale, Jeffrey Rohaly, and Benjamin H. Harris
September 2002
4 Saying “I Do” after the 2001 Tax Cuts Adam Carasso and C. Eugene Steuerle
August 2002
3 EGTRRA: Which Provisions Spell the Most Relief? Leonard E. Burman, Elaine Maag, and Jeff Rohaly
June 2002
2 The Estate Tax Is Down, But Not Out Leonard E. Burman and William G. Gale
December 2001
1 Designing Tax Cuts to Benefit Low-Income Families Frank Sammartino June 2001