63
Electronic copy available at: http://ssrn.com/abstract=2401905 Tax and Non-Tax Incentives and Investments: Evidence and Policy Implications Sebastian James September 2013
Electronic copy available at: http://ssrn.com/abstract=2401905
Tax and Non-Tax Incentives and Investments:
Evidence and Policy Implications
Sebastian James
September 2013
Electronic copy available at: http://ssrn.com/abstract=2401905
ii
Contents
EXECUTIVE SUMMARY .................................................................................................. V
1. INTRODUCTION.......................................................................................................... 1
2. FRAMEWORK FOR ANALYZING INCENTIVES ................................................. 2
Tax Incentives around the World ......................................................................................... 3
3. DO INCENTIVES MATTER FOR INVESTMENT? ECONOMETRIC
EVIDENCE ............................................................................................................................ 5
Conclusions from the literature ............................................................................................ 6
Tax rates affect FDI levels and locations ............................................................................. 6
Recent work by the World Bank Group and International Monetary Fund ................... 7
The investment climate affects the effectiveness of incentives ........................................... 8
Sector orientation and incentives ....................................................................................... 13
Policy implications ............................................................................................................... 15
5. DO INVESTMENT INCENTIVES MATTER TO INVESTORS? ........................ 16
Sector orientation and incentives ....................................................................................... 18
WTO limitations on the use of export linked incentives .................................................. 19
Policy implications ............................................................................................................... 19
6. REVENUE COST OF TAX INCENTIVES - TAX EXPENDITURES .................. 20
Tax Expenditures and the Budget process ........................................................................ 21
How are tax expenditures computed? ................................................................................ 21
Policy implications ............................................................................................................... 23
7. WHEN INCENTIVES MAY BE USED? .................................................................. 23

iii
Public goods .......................................................................................................................... 23
Positive externalities ............................................................................................................ 24
International tax competition ............................................................................................. 24
8. COSTS OF MANAGING AND ADMINISTERING INCENTIVES ...................... 26
Reducing Discretion and the costs of obtaining tax incentives ........................................ 27
Indirect Revenue losses due to incentives .......................................................................... 29
Policy implications ............................................................................................................... 34
9. POLITICAL ECONOMY AND TAX INCENTIVES .............................................. 35
Discretionary tax incentives are popular with politicians ................................................ 36
Tax incentives have unknown costs .................................................................................... 36
Tax incentives can work if governance is good ................................................................. 37
Bargaining for incentives—the role of tax competition ................................................... 37
Incentives create a community that depends on them ...................................................... 38
Policy implications ............................................................................................................... 38
10. OPTIONS FOR INCENTIVE POLICY ...................................................................... 39
Best policy option for tax incentives ................................................................................... 39
Reform Path for Tax Incentives Reform ........................................................................... 40
Policy for anchor investments ............................................................................................. 44
APPENDIX-1. A SIMPLE MODEL OF INCENTIVES .................................................. 47
Policy implications ............................................................................................................... 50
Adjusting the model for Investment climate ..................................................................... 51
APPENDIX-2: TYPES OF TAX INCENTIVES .............................................................. 52

iv
APPENDIX – 3: ECONOMETRIC RESULTS OF INVESTMENT CLIMATE
ADVISORY SERVICES RESEARCH .............................................................................. 53
v
Executive Summary
This paper analyzes how investment incentives may or may not be used to foster private investment, particularly in developing countries. What makes such incentives effective? How much should they cost? And how are they linked to policymaking and political economy? The assessment draws on existing literature as well as several case studies and surveys conducted for this paper.
Governments make extensive use of investment incentives in an effort to attract investments. Their effectiveness has been the subject of intense debate, and little consensus has emerged. Some experts have argued that there is little evidence such incentives are effective—a view that has guided considerable technical assistance recommending that governments curtail their use. Others have argued that investment incentives have contributed to the rapid economic growth of countries such as the Republic of Korea, Mauritius, and Singapore. These disparate views are not surprising given that tax and nontax incentives are just one of the many factors that influence the success of investments. Countries typically pursue growth-related reforms using a combination of approaches, including macroeconomic policies, investment climate improvements, and industrial policy changes—including investment incentives. If such reforms have led to growth, it is difficult to attribute it solely to incentives. Although studies have tried to disentangle the effects of these reforms; most have been limited to OECD countries. Among other things, this paper aims to shed light on how incentives work in developing countries.
Every investment incentive policy has potential costs and benefits. The benefits arise from:
• Higher revenue from possibly increased investment.
• Social benefits—such as jobs, positive externalities, and signaling effects—from this increased investment.
The costs are due to:
• Revenue losses from investments that would have been made even without the incentives.
• Indirect costs such as economic distortions and administrative and leakage costs.
It is difficult to quantify these elements, but trying to do so provides a useful conceptual tool for policymakers analyzing the general framework for incentives as well as targeted incentives for anchor investments, export-oriented and mobile investments, extractive industries, and so on.
The investment climate is especially crucial for determining the effectiveness of incentives in attracting foreign direct investment (FDI). Although lowering effective tax rates helps

vi
boost FDI, the effect is eight times stronger for countries with good investment climates. This finding helps explain why incentives have encouraged investment in some countries yet failed in others. Legal guarantees for investors and simplified incentive regimes also have positive effects on investment. Evidence for other common interventions, such as tax holidays, tends to be less robust.
Surveys of investors in Jordan, Mozambique, Nicaragua, and Serbia find that most non-exporters do not rank investment incentives among their top reasons for investing. By contrast, exporters consider such incentives very important. Survey evidence also shows that some investors spent considerable time qualifying incentives, implying that these special benefits also impose costs. For these and other reasons—including political economy—the costs and benefits of investment incentives are rarely clear-cut for governments or recipients.
The paper reaches the following conclusions about investment incentives:
• On their own, such incentives have limited effects on investments. Countries must also dedicate themselves to improving their investment climates.
• If used, investment incentives should be used minimally—mainly to address market failures and generate multiplier effects.
• Incentives should be awarded with as little discretion and as much transparency as possible, using automatic legal criteria.
• To the extent possible, incentives should be linked to investment growth (that is, based on performance), and tax holidays should be avoided.
• Only the tax administration should administer tax incentives.
• Regional cooperation should be encouraged to prevent harmful tax competition between countries.
• Governments should regularly prepare tax expenditure statements to measure and monitor the costs of tax incentives. In addition, incentive policies should be reviewed periodically to assess their effectiveness in helping meet desired goals.

1
1. Introduction
Investment incentives are measurable economic advantages that governments provide to specific enterprises or groups of enterprises, with the goal of steering investment into favored sectors or regions or of influencing the character of such investments. These benefits can be fiscal (as with tax concessions) or non-fiscal (as with grants, loans, or rebates to support business development or enhance competitiveness).
Tax and nontax incentives have both been widely used to promote investment. Incentives—especially fiscal incentives—have been associated with higher investment in several countries, including Ireland, Mauritius, and Singapore. But while some governments vouch for the effectiveness of incentives, many others have failed to attract expected investments. Accordingly, considerable research has focused on the role incentives play in promoting investment and creating jobs. Most of this research has occurred in developed countries; evidence from developing countries has largely been anecdotal. But there is proof that Incentives work for certain kinds of investments, in specific situations, and for specific sectors, such as export-oriented investments. Finally, as practitioners and policymakers can attest, political economy exerts a powerful influence on incentives. Many incentives—especially generous ones—have persisted because of lobbying by special interests and politicians’ need to curry favor. Yet little research has been done on how political economy affects incentive policy. Investment incentives are constantly evolving, so gaining knowledge about them is a dynamic process. This paper breaks new ground in several areas. First, it consolidates recent research by the World Bank Group’s Investment Climate Advisory Services on how a country’s investment climate influences the effectiveness of incentives, particularly in developing countries. Though higher taxes reduce foreign direct investment (FDI), the size of that effect depends on the investment climate. Changes in tax rates have a much bigger effect on FDI in countries conducive to investment than they do elsewhere. Indeed, for countries ranked in the top half of the Bank Group’s Doing Business indicators, changes in marginal effective tax rates had eight times more impact on FDI than for countries in the bottom half. Second, the paper sheds light on the role that political economy plays in the popularity of incentives—and the related shortcomings. Incentives are sometimes used to dole out favors to investors, so investors who benefit from incentives resist attempts to eliminate them. This paper suggests a way to tackle such problems. Third, the paper compiles good practices on managing and administering incentives in developing countries, drawing on government and private sector experiences.

2
Finally, the paper provides policymakers with a framework for analyzing the efficacy of investment incentives based on the sector and level of development involved, and suggests reforms for moving toward best practice.
Policy areas beyond this paper’s scope
The policy recommendations in this paper are fairly broad and could be applied to investment incentives in general. However, some topics require detailed policy advice that is beyond the scope of this paper, including:
• Investment incentives and broader goals for industrial policy. Investment incentives can be used to pursue industrial policy goals such as diversifying investment, increasing local value added, and substituting for imports. But while this paper provides policy guidelines for investment incentives, it does not assess their effectiveness in achieving such goals.
• Incentives and special economic zones (SEZs). An attractive investment climate is important, and SEZs can provide such a climate. But this paper does not assess whether creating SEZs is preferable to developing institutions and improving the investment climate throughout a country.
• Macro-Fiscal aspects of investment incentives. Though this paper touches on aspects of the tax regime, it is not about fiscal policy. Governments may be willing to forgo tax revenue in the short term in hopes of boosting investment to support growth and tax revenue in the future, but the paper does not analyze the effectiveness of such policies.
• Nontax incentives and spending policies. This paper’s guidance focuses on how to use tax incentives to promote investment. Some nontax factors, such as a good investment climate, are prerequisites for tax incentives to be effective. Other nontax factors—such as the ease of accessing land, starting a business, or exporting and importing—are also important for encouraging investment. While acknowledging the role of non-tax factors in encouraging investment and also in improving the effectiveness of tax incentives, the paper does not analyze the effectiveness of non-tax factors separately in encouraging investment.
• Tax regime for mining. This paper concludes that investment incentives are generally unnecessary for the mining sector because mining activities are location based and governments should collect the rents from such resources. But the tax regime for mining is highly specific and involves issues beyond the scope of this paper, such as taxation during the exploration period, carry-forward provisions and royalty rates, and the role of public-private partnerships in addressing environmental issues.
2. Framework for Analyzing Incentives
Incentive policies have varying costs and benefits for governments. Here tax incentives are defined as any deviations from the general tax system that are applied to certain kinds of
3
investments to reduce their tax liability. Nontax incentives are direct expenditures and other efforts made by the authorities to lower the cost of investments.1
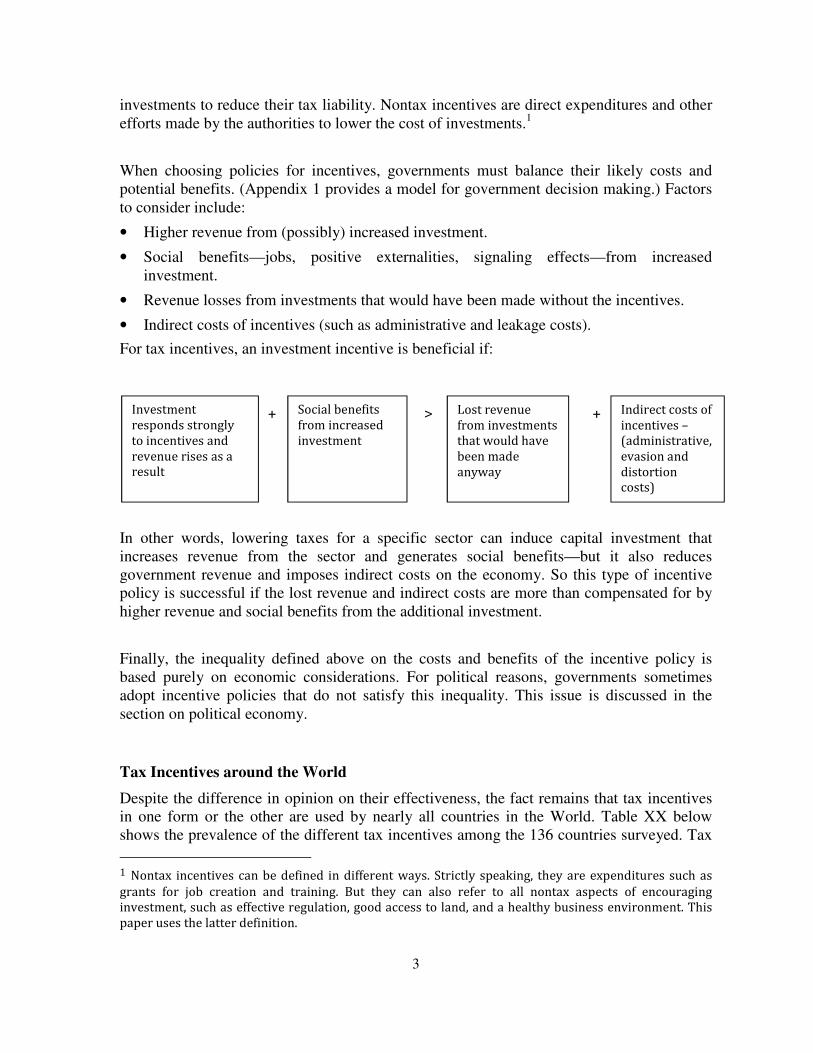
When choosing policies for incentives, governments must balance their likely costs and potential benefits. (Appendix 1 provides a model for government decision making.) Factors to consider include:
• Higher revenue from (possibly) increased investment.
• Social benefits—jobs, positive externalities, signaling effects—from increased investment.
• Revenue losses from investments that would have been made without the incentives.
• Indirect costs of incentives (such as administrative and leakage costs).
For tax incentives, an investment incentive is beneficial if:
In other words, lowering taxes for a specific sector can induce capital investment that increases revenue from the sector and generates social benefits—but it also reduces government revenue and imposes indirect costs on the economy. So this type of incentive policy is successful if the lost revenue and indirect costs are more than compensated for by higher revenue and social benefits from the additional investment.
Finally, the inequality defined above on the costs and benefits of the incentive policy is based purely on economic considerations. For political reasons, governments sometimes adopt incentive policies that do not satisfy this inequality. This issue is discussed in the section on political economy.
Tax Incentives around the World
Despite the difference in opinion on their effectiveness, the fact remains that tax incentives in one form or the other are used by nearly all countries in the World. Table XX below shows the prevalence of the different tax incentives among the 136 countries surveyed. Tax
1 Nontax incentives can be defined in different ways. Strictly speaking, they are expenditures such as
grants for job creation and training. But they can also refer to all nontax aspects of encouraging investment, such as effective regulation, good access to land, and a healthy business environment. This paper uses the latter definition.
Investment responds strongly to incentives and revenue rises as a result
Social benefits from increased investment
Indirect costs of incentives – (administrative, evasion and distortion costs)
Lost revenue from investments that would have been made anyway
> + +
4
Holidays are most prevalent in South Asia, Europe and Central Asia, Latin America and the Caribbean and the East Asia Pacific countries while they are least prevalent in the OECD countries. This reflects the gradual move away from the use of tax holidays over time in the developed countries due to their ineffectiveness in aligning the incentives of increased investment with the tax benefits. There is now a much greater use of tax incentives for encouraging Research and Development with the OECD countries and those in the East Asia and Pacific using this tax incentive the most often. Super-deductions, where deductions are allowed for more than the actual cost of certain expenses is most prevalent in South Asia mainly to reduce subsidize the cost of investments when starting a business. The use of tax and duty exemptions in Special Economic Zones is quite popular across all the regions. This may reflect a move towards containing the tax incentives to certain geographic locations and minimize their impact of the tax incentives on the wider economy for revenue reasons. It may also reflect a reaction to the limitations imposed by the WTO which prohibits tax incentives for exporters. In such a case, tax incentives provided in Special Economic Zones while not explicitly limiting the tax incentives to exporters is targeted to benefit precisely that group. The fact that SEZs are typically defined to be outside the customs territory of country makes it more attractive to exporters of those goods that have a significant proportion of imported inputs.
Table 1: Prevalence of Tax Incentives around the World
Number
of
Countries
Surveyed
Tax
holiday/
Tax
exempti
on
Reduced
Tax rate
Investm
ent
allowanc
e/Tax
credit
VAT
exempti
on/
reductio
n
R&D
Tax
Incenti
ve
Super-
deducti
ons
SEZ/Fre
e
Zones/E
PZ/Free
port
Discretio
nary
process
East Asia and
Pacific 12 92% 92% 75% 75% 83% 8% 83% 25%
Eastern Europe
and Central Asia 16 75% 31% 19% 94% 31% 0% 94% 38%
Latin America
and the
Caribbean
24 75% 29% 46% 58% 13% 4% 75% 29%
Middle-East and
North Africa 15 73% 40% 13% 60% 0% 0% 80% 27%
OECD 33 21% 30% 61% 79% 76% 18% 67% 27%
South Asia 7 100% 43% 71% 100% 29% 57% 71% 14%
Sub-Saharan
Africa 30 60% 63% 73% 73% 10% 23% 57% 47%
Source: Various tax guides – Deloitte, IBFD and others.
Most notable are the use of discretionary procedures to provide tax incentives across all the regions. In such a system, investors could ‘apply’ for a new tax incentive or duty exemption, typically to an agency outside the tax administration, if they satisfy certain broad criteria.
5
Discretion could also be in the application of a tax incentive. The tax incentive that the investor may qualify for may be specified in the tax law or investment code but generally given broad interpretation which requires an approval process. The ‘automatic’ process on the other hand is when tax incentives are provided for in the tax legislation and there is not procedure for ‘apply’ for them. Taxpayers in this case directly claim for their tax incentives during tax filing or during importation. Discretionary tax incentives are prone to corrupt practices as the ‘approval’ is valuable for investors and officials administering them have the ability to refuse it. The ‘approval’ in many cases by agencies outside the tax administration is not final because the latter have to comply with their own procedures to ensure that the tax incentive or duty exemption is correctly claimed. Among all the regions in the World, Sub-Saharan Africa uses discretionary procedures the most. This mostly reflects the use of investment codes where investors typically need to apply for tax incentives before Investment Promotion Agencies. Interestingly, discretionary processes are not uncommon in the OECD countries.
3. Do Incentives Matter for Investment? Econometric Evidence
Any policy on incentives should address whether it increases investment.2 This can be inferred based on how investment in a country responds to the introduction of or changes to incentive policy, as measured by FDI and gross capital formation. However, changes in incentive policy are generally made at the same time as other changes that affect investment behavior (such as macroeconomic restructuring). This simultaneity makes analysis challenging because it is difficult to attribute changes in investment to changes in incentives. But by carefully selecting the incentive reforms studied, it is possible to address some of these issues. Another significant problem for econometric studies on investment in developing countries involves the measurement of investment. A lack of good data on investment in these countries makes it hard to estimate the effects of incentives in general and tax incentives in particular. Gross domestic capital formation is especially poorly measured, though FDI is measured better.3 The best data on investment come from firms, but such data are rare in developing countries. To mitigate this problem, several approaches have been used to determine whether incentives are effective in encouraging investments.
2 As indicated by the elasticity of capital investment to the tax rate, or the size of
��
��� (see Appendix 1).
3 See Gordon, David, and Ross Levine, 1988, “The Capital Flight Problem,” International Finance Discussion
Paper 320.

6
Conclusions from the literature
Hassett and Hubbard (2002) provide a good review of the literature on the effectiveness of tax policy (in general) and tax incentives (in particular) in promoting investment. They find that:
● Tax policy affects investment, with a 1.0 percent increase in the user cost of capital lowering investment by 0.5–1.0 percent (for an elasticity of –0.5 to –1.0).4 This analysis is based on microeconomic data from firms. Macroeconomic data, by contrast, provide little evidence that tax policy affects investment. But this conclusion is likely due to measurement errors in macroeconomic data, inter-asset reallocation of capital, and simultaneity, which make it difficult to draw causal links or make correct attributions using macroeconomic data.
● Taxes increase the user cost of capital, so any uniform reduction in that cost should encourage capital investment. But targeted incentives are unlikely to broadly reduce the cost of capital.
● Most investment incentives focus on investments in equipment, creating inter-asset distortions between types of capital. These distortions could outweigh the benefits of such incentives, with the net result being that the incentives attract weaker investment. In Thailand, for example, firms that benefited from incentives had weaker financial ratios than those that did not.5
● Economic growth is higher in countries that invest more in equipment, mainly because workers learn better skills by operating different kinds of equipment. Thus equipment subsidies are good for growth because they generate positive externalities.
● Investment incentives do not work for many firms that face finance constraints and cannot grow to take advantage of tax incentives.
● Because the supply of capital goods is inelastic in the short run, some investment incentives might benefit suppliers of capital goods instead of investors.
● Low inflation—which is the result of factors other than a policy decision to award incentives—serves as a good investment subsidy.
● Temporary incentives can have larger short-run impact than permanent ones.
Tax rates affect FDI levels and locations
Though Hasset and Hubbard (2002) find that tax policy has little effect on investment when macroeconomic data are used, there is evidence that taxes affect the volume and location of FDI. Extensive research indicates that FDI is sensitive to taxation in host countries (Hines 1997). Such a wide body of literature exists on the topic that it was the subject of a meta
4 The user cost of capital is the cost of capital investment that incorporates all costs (such as interest and
taxes) and incentives (such as investment allowances, Investment tax credits, and accelerated depreciation). 5 FIAS, 1999, “Kingdom of Thailand: A Review of Investment Incentives,” World Bank Group, Washington, D.C.
7
study by De Mooij and Ederven (2003).6 The authors’ survey of the literature concluded that, on average, a 1 percentage point increase in the tax rate reduced FDI by 3.3 percent. Though there is a wide range of elasticities, most studies find that higher tax rates (including effective average tax rates, effective marginal tax rates, and statutory tax rates) have a significant negative impact on FDI flows. But most of these studies involve investment in OECD countries. Of 47 econometric studies on FDI and taxation, just 5 include investments in developing countries.7 This is mainly due to the poor availability of firm-level data in developing countries.
Outbound FDI by firms offers another way of analyzing whether incentives are effective in attracting investment to developing countries. Such analysis is possible using firm-level data on outbound FDI that include investments in developing countries. For example, the U.S. Bureau of Economic Analysis (BEA) collects microdata on U.S. firms’ outbound investments. In a study of FDI in 47 countries—including developing countries—drawing on the bureau’s data, Grubert and Mutti (2000) study why investors decide to locate in certain countries. They find that investments oriented toward domestic markets are less sensitive to changes in tax incentives, while export-oriented investments are more sensitive.8 Also using BEA data, Desai, Foley, and Hines (2006) conclude that U.S.-based multinational corporations in countries with a 10 percent higher indirect tax rate had 7.1 percent less assets (physical investments).9 Moreover, in countries with a 10 percent higher corporate income tax rate such corporations have 6.6 percent less assets. The advantage of this study is that more than half of the 55 countries with inbound investments were developing countries. But the results are not disaggregated by OECD and non-OECD countries. There is a significant vacuum in the literature on econometric studies of the efficacy of investment incentives in developing countries. Although the literature concludes that tax rates matter a lot for FDI, this conclusion cannot be extended to non-OECD countries.
Recent work by the World Bank Group and International Monetary Fund
To address this shortcoming in the literature, the World Bank Group’s Investment Climate Advisory Services undertook a series of econometric studies to determine how taxation affects FDI in developing countries. Investor surveys were also conducted to provide richer,
6 Mooij and Enderveen, 2003, “Taxation and Foreign Direct Investment: A Synthesis of Empirical Research,”
International Tax and Public Finance 10: 673–93. 7 Heckmeyer, J., and Lars Feld, 2009, “FDI and Taxation: A Meta Study,” CESifo Working Paper 2540.
8 However, the authors find that tax sensitivity is lower in high-income countries, which runs counter to the
findings in this paper. See Grubert and Mutti. 2004. “Empirical Assymetries in Foreign Direct Investment and
Taxation,” Journal of International Economics 62: 337–58. 9 Desai, M. A., C. F. Foley, and J. R. Hines, 2004, “Foreign Direct Investment in a World of Multiple Taxes,”
Journal of Public Economics 88: 2727–44.
8
disaggregated data. In addition, the International Monetary Fund (IMF) conducted a study on how corporate tax rates and tax incentives affected FDI in 40 Latin American, Caribbean, and African countries during 1985–2004.10
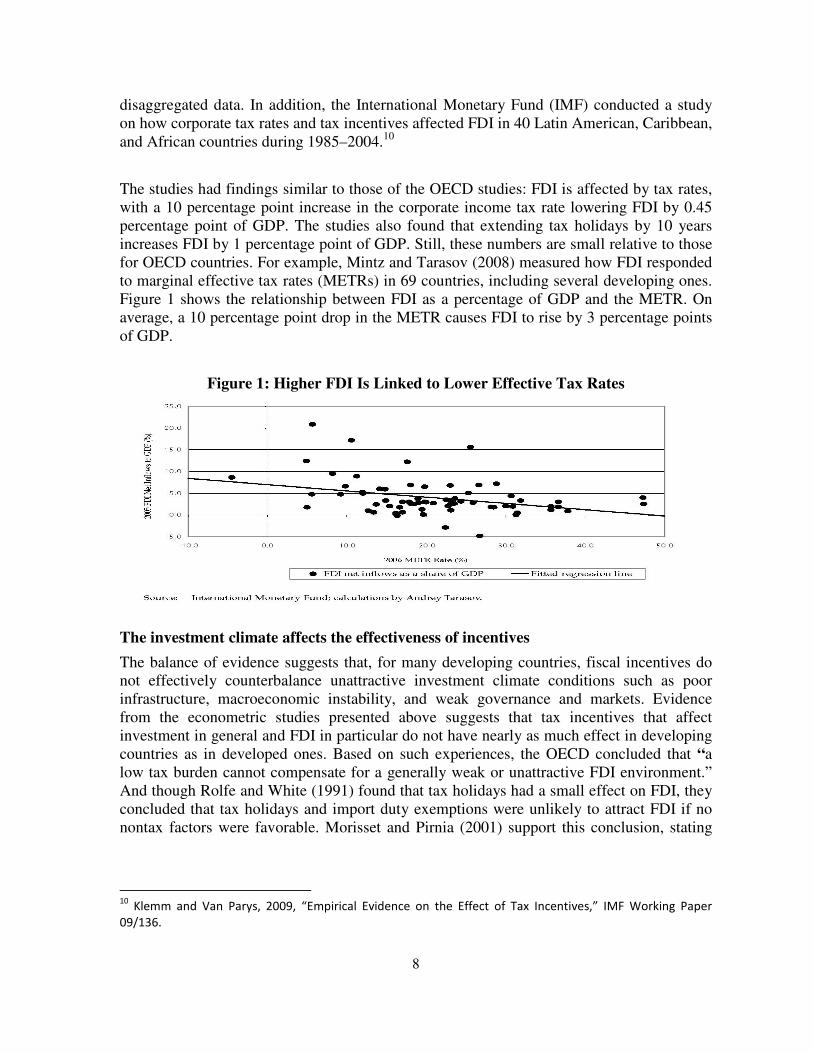
The studies had findings similar to those of the OECD studies: FDI is affected by tax rates, with a 10 percentage point increase in the corporate income tax rate lowering FDI by 0.45 percentage point of GDP. The studies also found that extending tax holidays by 10 years increases FDI by 1 percentage point of GDP. Still, these numbers are small relative to those for OECD countries. For example, Mintz and Tarasov (2008) measured how FDI responded to marginal effective tax rates (METRs) in 69 countries, including several developing ones. Figure 1 shows the relationship between FDI as a percentage of GDP and the METR. On average, a 10 percentage point drop in the METR causes FDI to rise by 3 percentage points of GDP.
Figure 1: Higher FDI Is Linked to Lower Effective Tax Rates
The investment climate affects the effectiveness of incentives
The balance of evidence suggests that, for many developing countries, fiscal incentives do not effectively counterbalance unattractive investment climate conditions such as poor infrastructure, macroeconomic instability, and weak governance and markets. Evidence from the econometric studies presented above suggests that tax incentives that affect investment in general and FDI in particular do not have nearly as much effect in developing countries as in developed ones. Based on such experiences, the OECD concluded that “a low tax burden cannot compensate for a generally weak or unattractive FDI environment.” And though Rolfe and White (1991) found that tax holidays had a small effect on FDI, they concluded that tax holidays and import duty exemptions were unlikely to attract FDI if no nontax factors were favorable. Morisset and Pirnia (2001) support this conclusion, stating
10
Klemm and Van Parys, 2009, “Empirical Evidence on the Effect of Tax Incentives,” IMF Working Paper
09/136.
9
that “incentives will generally neither make up for serious deficiencies in the investment environment nor generate the desired externalities.”11
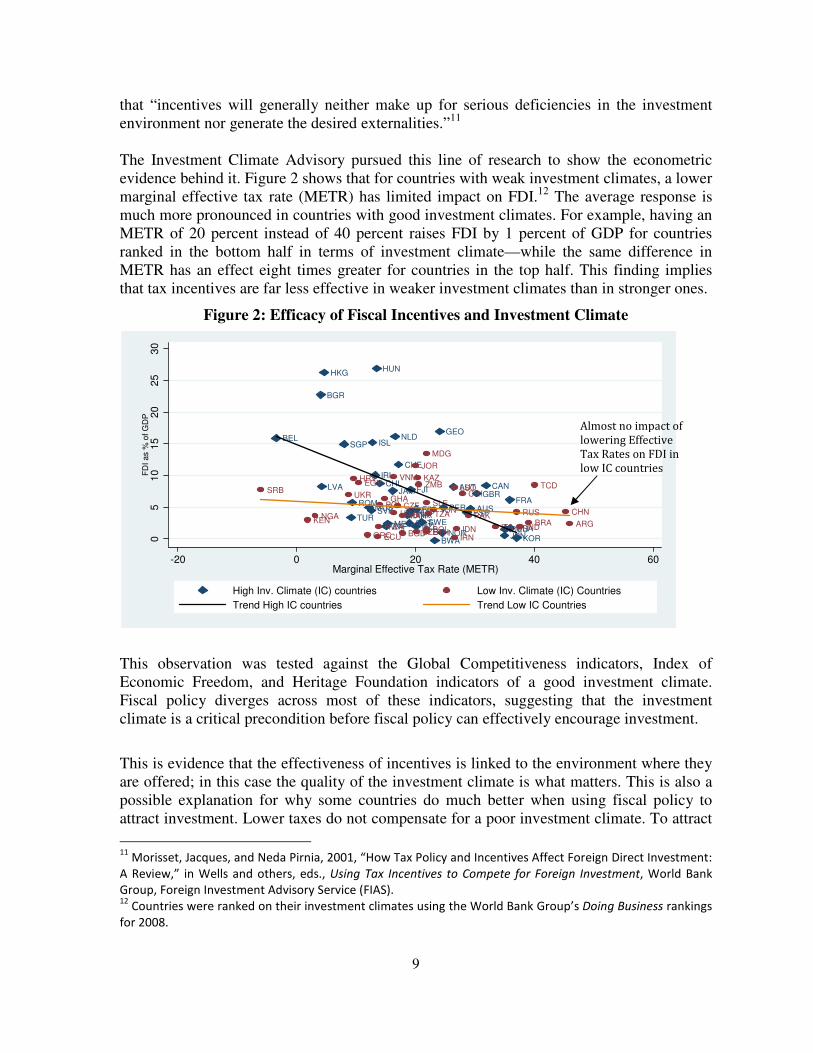
The Investment Climate Advisory pursued this line of research to show the econometric evidence behind it. Figure 2 shows that for countries with weak investment climates, a lower marginal effective tax rate (METR) has limited impact on FDI.12 The average response is much more pronounced in countries with good investment climates. For example, having an METR of 20 percent instead of 40 percent raises FDI by 1 percent of GDP for countries ranked in the bottom half in terms of investment climate—while the same difference in METR has an effect eight times greater for countries in the top half. This finding implies that tax incentives are far less effective in weaker investment climates than in stronger ones.
Figure 2: Efficacy of Fiscal Incentives and Investment Climate
This observation was tested against the Global Competitiveness indicators, Index of Economic Freedom, and Heritage Foundation indicators of a good investment climate. Fiscal policy diverges across most of these indicators, suggesting that the investment climate is a critical precondition before fiscal policy can effectively encourage investment.
This is evidence that the effectiveness of incentives is linked to the environment where they are offered; in this case the quality of the investment climate is what matters. This is also a possible explanation for why some countries do much better when using fiscal policy to attract investment. Lower taxes do not compensate for a poor investment climate. To attract
11
Morisset, Jacques, and Neda Pirnia, 2001, “How Tax Policy and Incentives Affect Foreign Direct Investment:
A Review,” in Wells and others, eds., Using Tax Incentives to Compete for Foreign Investment, World Bank
Group, Foreign Investment Advisory Service (FIAS). 12
Countries were ranked on their investment climates using the World Bank Group’s Doing Business rankings
for 2008.
AUS
AUT
BEL
BWA
BGR
CANCHL
DNK
FJI
FINFRA
GEO
DEU
HKGHUN
ISL
IRL
JAM
JPNKOR
LVA
MYSMUS
MEX
NLD
NZLNOR
PER
PRT
ROM
SGP
SVK
ZAF
ESPSWE
CHE
THATUR
GBR
USAARG
BGDBOL
BRA
TCD
CHN
CRI
HRV
CZE
ECUETH
GHA
GRCINDIDN
IRN
ITA
KAZ
JOR
KEN
LSO
MDG
MARNGA PAK
POLRUS
RWA
SRB
SLE
VNM
TUNUGA
UKR
EGY
TZA
UZB
ZMB
05
10
15
20
25
30
FD
I as %
of G
DP
-20 0 20 40 60Marginal Effective Tax Rate (METR)
High Inv. Climate (IC) countries Low Inv. Climate (IC) Countries
Trend High IC countries Trend Low IC Countries
Almost no impact of lowering Effective Tax Rates on FDI in low IC countries
10
investment, countries should improve their investment climates. (See Appendix 3, section 3 for regression results; the interaction term of investment climate and effective tax rate is significant in several measures of investment climate.) The investment climate influences the effectiveness of fiscal incentives in attracting investment through the role that public goods play in improving investment returns. Here the public goods are the components of the investment climate, such as infrastructure, rule of law, enforcement of contracts, and so on. The public goods are funded through a tax on capital, which in turn reduces the return on capital. But if the public goods make capital more productive, then an increase in taxation spent on them would have the opposite effect. On balance, the effect is ambiguous. However, when public goods and investment are highly complementary—as with the investment climate—then in countries with large endowments of such goods, a drop in taxes is much more effective at encouraging investment than in countries with smaller endowments.13 To confirm this finding, the Investment Climate Advisory conducted three econometric studies and four surveys of investors in developing countries. These studies overwhelmingly conclude that the investment climate is more important than tax breaks or other nontax incentives. The surveys were conducted in Jordan, Nicaragua, and Serbia by the Investment Climate Advisory and in Mozambique by Nathan Associates for the U.S. Agency for International Development (USAID). The methodological model for all the surveys and an analysis of the Mozambique one are available in Bolnick (2009).14 All the surveys found that factors related to the investment climate—such as ease of import and export, availability of local suppliers, regulatory framework, adequate infrastructure, and the country’s geographic location—rated higher than incentives as a primary motivation for investment (Table 1).
Table 2: Investor Motivations to Invest in Various Countries
Mozambique
(60)*
Jordan (61)
Serbia (50)
Nicaragua (71)
Three most
critical factors
driving
investment
decisions
(open-ended
question)
Domestic
market (38)**
Investment
climate (31) ***
Investment
climate (37)
Investment climate (77)
Little
competition
(16)
Political
stability and
security (25)
Skilled and
competitively
priced labor (33)
Labor costs (35)
13
James, Sebastian, and Stefan Van Parys, 2009, “Investment Climate and the Effectiveness of Tax
Incentives,” World Bank Group. 14
The Mozambique survey and analysis were conducted by Bruce Bolnick of Nathan Associates and was
funded by USAID as part of the broader Investment Climate Advisory study. The survey report is available
from the author on request.

11
Political
stability (14)
Domestic
market (23)
Personal reasons
(18)
Attractiveness
of incentives
(32)
* Numbers of investors surveyed are in parentheses. ** Numbers of investors who considered the factor critical are in parentheses. *** Includes ease of import and export, availability of local suppliers, regulatory framework, adequate infrastructure, and the country’s geographic position. Source: Investment Climate Advisory 2009.
Cross-country studies that examine the relationship between incentives and FDI are prone to omitted variable bias due to varying macroeconomic conditions, institutions, and endowments (such as mineral wealth). These issues are difficult to control for, and while time and country fixed effects take care of some of them, changes in macroeconomic conditions are harder to control for. One way to reduce such errors is to analyze similar countries or investors. Studies have found that incentives did not affect investment in West and Central Africa, while the opposite was true in the Eastern Caribbean (Box 1). The difference in findings may be explained by the stronger investment climates in the Caribbean economies.
Box 1. Incentives and Investment in Africa and the Caribbean
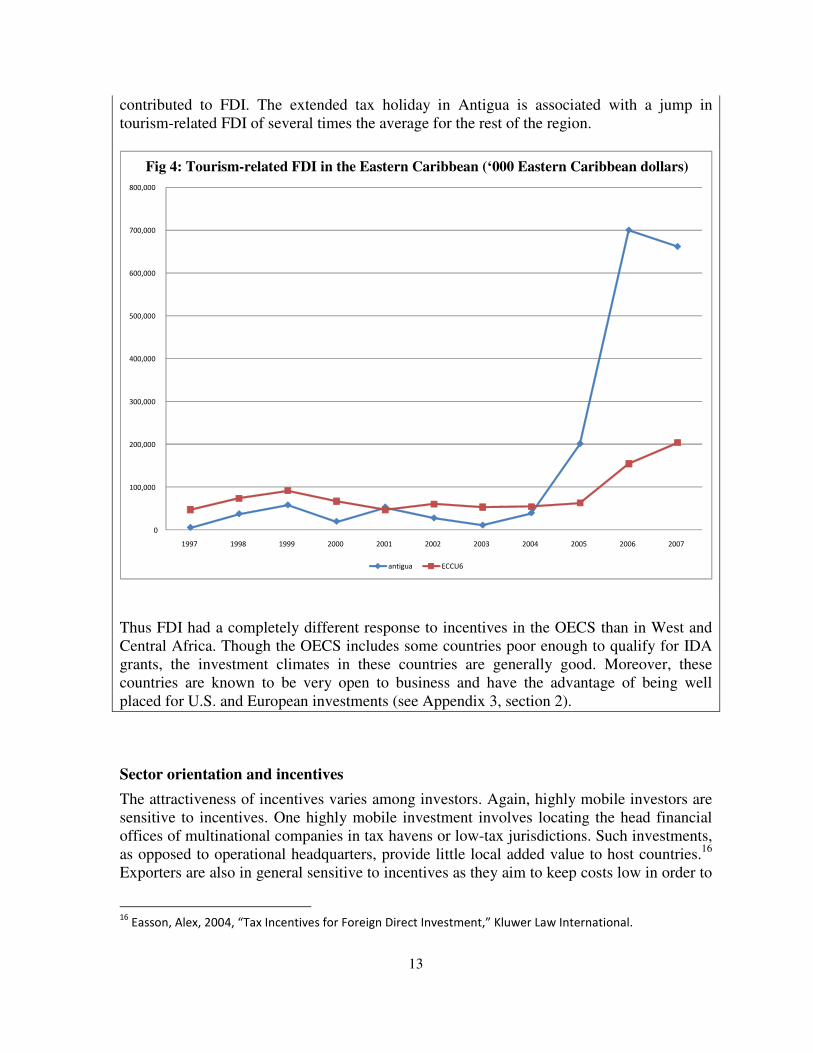
Investment climate studies of the Economic Community of West African States (UMEOA), Economic Community of Central African States (CEMAC), and Organization of Eastern Caribbean States (OECS) have the advantage that all three are monetary unions located fairly contiguously and share similar institutions. Another advantage is that while the unions share the same monetary policy, they are free to set their own fiscal policy—giving researchers a unique opportunity to examine how differences in incentives affect FDI. The figure below shows how differences in incentive policy affect FDI in the CFA franc zone, which consists of the six UMEOA countries and the six CEMAC countries. Because these countries are relatively homogeneous—sharing the same currency, speaking the same language (French), and geographically close to each other—they provide a rare basis for comparing investment and policies.
Fig 3: FDI and Investment Climate Changes in West and Central Africa
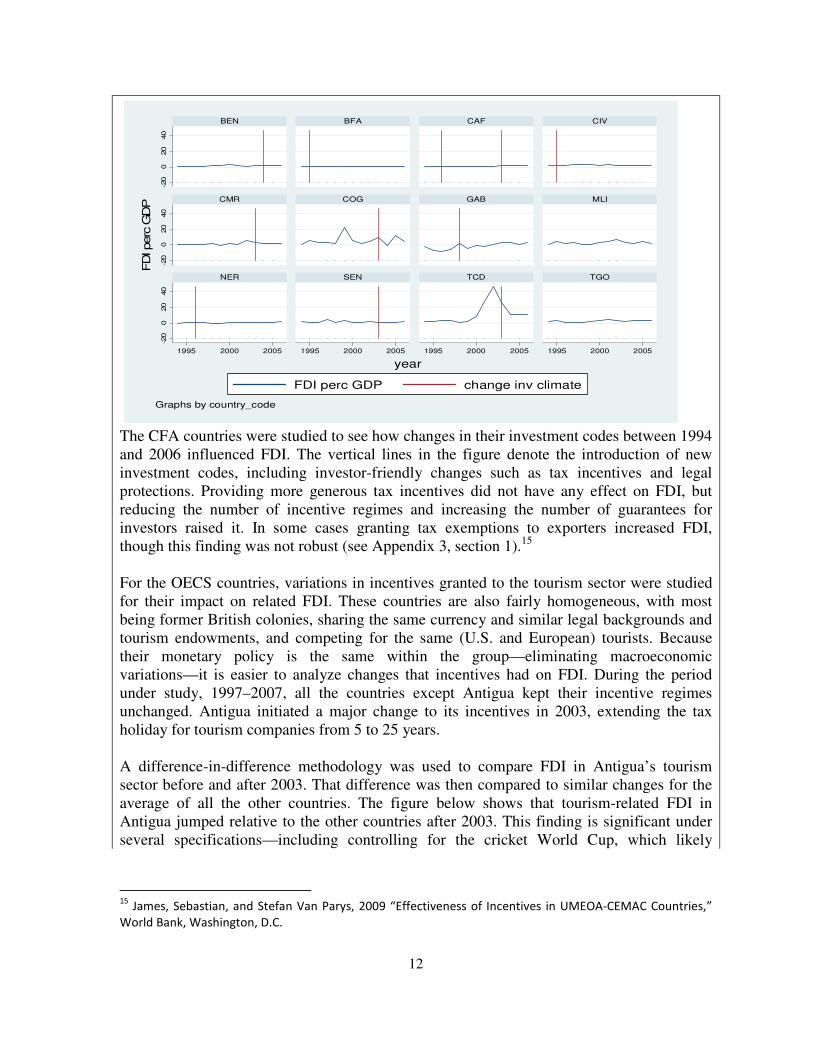
12
The CFA countries were studied to see how changes in their investment codes between 1994 and 2006 influenced FDI. The vertical lines in the figure denote the introduction of new investment codes, including investor-friendly changes such as tax incentives and legal protections. Providing more generous tax incentives did not have any effect on FDI, but reducing the number of incentive regimes and increasing the number of guarantees for investors raised it. In some cases granting tax exemptions to exporters increased FDI, though this finding was not robust (see Appendix 3, section 1).15 For the OECS countries, variations in incentives granted to the tourism sector were studied for their impact on related FDI. These countries are also fairly homogeneous, with most being former British colonies, sharing the same currency and similar legal backgrounds and tourism endowments, and competing for the same (U.S. and European) tourists. Because their monetary policy is the same within the group—eliminating macroeconomic variations—it is easier to analyze changes that incentives had on FDI. During the period under study, 1997–2007, all the countries except Antigua kept their incentive regimes unchanged. Antigua initiated a major change to its incentives in 2003, extending the tax holiday for tourism companies from 5 to 25 years. A difference-in-difference methodology was used to compare FDI in Antigua’s tourism sector before and after 2003. That difference was then compared to similar changes for the average of all the other countries. The figure below shows that tourism-related FDI in Antigua jumped relative to the other countries after 2003. This finding is significant under several specifications—including controlling for the cricket World Cup, which likely
15
James, Sebastian, and Stefan Van Parys, 2009 “Effectiveness of Incentives in UMEOA-CEMAC Countries,”
World Bank, Washington, D.C.
-20
020
40
-20
020
40
-20
020
40
1995 2000 2005 1995 2000 2005 1995 2000 2005 1995 2000 2005
BEN BFA CAF CIV
CMR COG GAB MLI
NER SEN TCD TGO
FDI perc GDP change inv climate
FD
I perc
GD
P
year
Graphs by country_code
13
contributed to FDI. The extended tax holiday in Antigua is associated with a jump in tourism-related FDI of several times the average for the rest of the region.
Thus FDI had a completely different response to incentives in the OECS than in West and Central Africa. Though the OECS includes some countries poor enough to qualify for IDA grants, the investment climates in these countries are generally good. Moreover, these countries are known to be very open to business and have the advantage of being well placed for U.S. and European investments (see Appendix 3, section 2).
Sector orientation and incentives
The attractiveness of incentives varies among investors. Again, highly mobile investors are sensitive to incentives. One highly mobile investment involves locating the head financial offices of multinational companies in tax havens or low-tax jurisdictions. Such investments, as opposed to operational headquarters, provide little local added value to host countries.16 Exporters are also in general sensitive to incentives as they aim to keep costs low in order to
16
Easson, Alex, 2004, “Tax Incentives for Foreign Direct Investment,” Kluwer Law International.
0
100,000
200,000
300,000
400,000
500,000
600,000
700,000
800,000
1997 1998 1999 2000 2001 2002 2003 2004 2005 2006 2007
Fig 4: Tourism-related FDI in the Eastern Caribbean (‘000 Eastern Caribbean dollars)
antigua ECCU6

14
be competitive in the destination market. By contrast, investors oriented toward domestic markets are less sensitive to incentives. This is confirmed by surveys of investors in different countries (discussed in section-XX). Using tax incentives to attract investment in areas that are primarily not driven by tax considerations leads to a waste of government resources as investments are likely to be made even without tax incentives. Policymakers, therefore, would need to adjust incentive policies depending on the type of FDI that they aim to attract. Table 2 provides some guidance on this approach.
Table 3: Typology of FDI and response to Tax Incentives
Type of
Investment
Factors that drive investment Response to investment
incentives
Resource-seeking FDI
Location of Natural Resources/Skill/Agglomeration benefits
Low response. FDI driven primarily by non-tax factors.
Market-seeking FDI
Market potential - Market dimensions - Income per-capita - Customer specific preferences - Kind of goods and services to be
provided
Low response. Level playing field between firms is critical (same tax system for all competitors).
Strategic Asset-seeking FDI
Acquiring Strategic Assets - Brands and Market positioning - Know-how - Technology - Distribution Networks - Human Capital
Low response. FDI is driven by the location of the asset. However lower taxes on capital gains reduces the costs of the transfer of these assets.
Efficiency-seeking FDI
Lower Costs - Mostly export oriented - Availability of skills at a Low
cost skills - Close to markets - Low relocation costs
High response to tax incentives. Firms are expected to compete globally, hence the lower the costs, the better their ability to compete globally.

15
Policy implications
This section’s conclusions about how incentives affect FDI—and the related policy implications—are summarized in Table 2.
Table 4. Conclusions on Incentives and Investment—and Policy Implications*
Research Conclusion Policy implication
Investment Climate Advisory research
Investments are not strongly influenced by lower tax rates in countries with weak investment climate.
Incentive policy should take into account the strength of a country’s investment climate.
Mooij and Enderveen (2003), Desai, Foley, and Hines (2004)
Investments in developed countries respond strongly to incentives.
Investment incentives are likely to work in developed countries.
Klemm and Van Parys (2009)
Investments have responded to incentives in some developing countries, but the elasticity was smaller than I developed countries.
Incentives have a small impact on investments in developing countries.
Grubert and Mutti (2003), Rolfe and White (1991), Wells (1986)
Export-oriented investments—especially mobile ones—are more sensitive to tax incentives.
Targeted incentives are a cost-effective way to foster such investments.
Hassett and Hubbard (2002)
Investment incentives create significant distortions by encouraging inefficient investments.
Attention should be paid to the efficiency costs of Investment incentives.
Low inflation is the best investment incentive.
A good macroeconomic environment works better than investment incentives.
Temporary incentives have bigger short-run impact than permanent ones.
Incentives should be used only temporarily. Tax holidays, if used, should have an end date after which they are not available to anyone.
* Based on a selection of the literature discussed
16
5. Do Investment Incentives Matter to Investors?
An alternative to using econometric evidence to assess the importance of incentives for investment is to ask investors themselves whether incentives mattered when they decided to invest in a certain location. This approach has been popular because it provides nuanced information on the importance of incentives for different types of investors operating in different sectors. Though this approach seems fairly straightforward, such surveys have problems. They run the risk of bias because any question to investors on whether incentives matter is likely to be answered yes. One way to avoid such bias is to ask investors to list and rank the reasons they invested in a country in an open-ended question. If incentives were salient, investors would mention them. A second approach is to ask investors to rank an existing list of reasons. An “extreme test” devised by Guisinger and Associates (1985), asks investors if they still would have invested if everything else were the same except that incentives were not provided. This essentially seeks to identify the marginal investors (those whose decision to invest was driven primarily on tax considerations. However, this extreme test could introduce a similar bias as when asking taxpayers directly if tax incentives mattered which they are most likely to concur. However, if this were a follow-on question to the open-ended question and the ranking question, the bias could be considerably reduced. This approach was used by Bruce Bolnick in his survey design which is what the subsequent surveys uses17. These tools make it possible to identify investors for whom incentives were critical to their investment. Based on that, the incentives given to other investors can be considered redundant. Table 3 shows redundancy ratios, which is the percentage of investors who claimed that they would have invested even without tax incentives, based on investor surveys in various countries. For example, a FIAS study on Thailand found that 81 percent of investments would have been made even without incentives. In Jordan, Mozambique, and Serbia 70 percent or more of investments would have been made anyway, so incentives were redundant. In the case of Rwanda, the redundancy ratio is as high as 98%. Overall, redundancy levels are quite high for investors in almost all the countries.18 But as Table 4 shows for exporters, tax incentives are far more important. That table also shows responses for duty-free imports, most of which have redundancy ratios similar to those for tax incentives. The other remarkable aspect about investment incentives is that they did not affect the level of investment for most investors. Returning to the model presented in section 2, one part of the costs of incentive policy is the loss of revenue from incentives given to investors who would have invested anyway. High redundancy ratios suggest that this loss is not trivial. Incentives are particularly redundant for investments oriented toward domestic markets and those based on natural resources—
17
Ibid 14. 18
Nicaragua is an exception, but 65 percent of the investors were exporters—40 percent of whom were
garment exporters—and most had considered another location.

17
such as mining and tourism—unique to a country. Interestingly, the greatest salience for tax incentives is correlated with the footloose nature of the investment. Incentives mattered most in Nicaragua, which also had the highest percentage of investors who considered another location. Thus surveys make it possible to understand the types of investors to whom incentives matter. Incentives are very important to exporters (those that are also mobile)—confirming Wells (1986), who notes that export-oriented firms operate in highly competitive markets with slim margins.19 They also tend to be highly mobile and have likely compared taxes across locations, because taxes are an important part of their cost structures. There is a dichotomy between the importance of incentives as perceived by governments and investors. Robinson (1961) finds that in a survey of investors and government departments entrusted with encouraging investment, governments believed that incentives strongly influenced investment decisions. But for investors, access to domestic markets, a good investment climate, security and stability, skilled labor, and other factors ranked much higher than incentives (see Table 1). This dichotomy may be due to the fact that granting incentives is much easier for government officials than is providing a secure and stable political environment, implementing economic reforms, or developing a skilled workforce.
Table 5. Salience of Incentives Based on Investor Surveys
Author Focus of survey Conclusion Did incentives
influence
Investment
level? (share
saying yes)
Investment Climate Advisory (FIAS)—investor motivation surveys
Burundi (2011) Redundancy ratio for incentives (Would have invested even if Incentives were not provided)
77% 30%
Guinea (2012) 92% 6%
Jordan (2009) 70% 28%
Kenya (2012) 61% 11%
Nicaragua (2009) 15% (51% for non-exporting firms outside free zones)
17%
Rwanda (2011) 98% 21%
Serbia (2009) 71% 6%
Tanzania (2011) 91% 8%
Tunisia (2012) 58% 25%
Uganda (2011) 93% 13%
FIAS 20 Vietnam (2004) 85% -
FIAS 21 Thailand (1999) 81% -
19
Wells, L. 1986. "Investment Incentives: An Unnecessary Debate." The CTC Reporter 22: 58–60. 20
Phu and others, 2004, “An Empirical Study of Corporate Income Tax Investment Incentives for Domestic
Companies in Vietnam,” USAID.

18
Nathan Associates 22
Mozambique (2009) 78% 13%
Guisinger and Associates (1985)
Investment incentives and performance requirements for export-oriented firms
33%
Reuber (1973) 23 FDI and market orientation
52% for export-oriented firms
Mckinsey—Multinational corporation investment in developing economies (2003)
Business process outsourcing (BPO) and automobile sectors in India (2003)
Incentives not among top 3 factors driving location decisions
Fortune/Deloitte and Touche (1997)
Business location study
Taxes ranked 13th of 26 factors in importance for investments
G–30 (1984) Study of 52 multinational corporations covering half of world’s FDI stock
Incentives ranked 7th in importance for investments
Sector orientation and incentives
The Investor Motivation Surveys allows us to understand the importance of tax incentives among different types of investors. Figures 3 shows that a larger share of investors oriented toward export markets would not have invested without incentives relative to investors oriented toward domestic markets.
21. “Kingdom of Thailand - A Review of Investment Incentives”. Foreign Investment Advisory Services (FIAS) 1999. 22 Bruce Bolnick (2009). “Investing in Mozambique – The role of Fiscal Incentives”. Report by Nathan Associates for USAID. 23
Reuber, G., 1973, Private Foreign Investment in Development, Oxford University Press.

19
Figure 5: Investors who would NOT have invested without tax Incentives
WTO limitations on the use of export linked incentives
Export incentives are subject to WTO discipline as they are classified as export subsidies and affect terms of trade. They are expressly prohibited subsidies are prohibited by WTO. However there is a low income country exemption provided under article 27 in the standard countervailing measures agreement. They include,
� Least Developed Countries: 33 WTO members + 12 in accession � Middle Income Countries:18 WTO members with GNP/capita < $1,000 (1990 US$) � Middle Income Countries: 23 WTO members with “grandfathered” programs (final phase out in 2015)
Policy implications
The analysis of investor surveys has three policy implications:
• To attract investment, governments should give top priority to improving their countries’ business climates.
• Targeted incentives should be provided to sectors where there is evidence that such incentives affect mobile investment and exporters. But these incentives should be linked to investment growth and job creation, both of which provide social benefits.
• Export incentives may run afoul of WTO guidelines.
0%
10%
20%
30%
40%
50%
60%
70%
80%
90%
100%
Jordan Mozambique Serbia Kenya Nicaragua
Non-
Exporters
Exporters

20
6. Revenue Cost of Tax Incentives - Tax Expenditures
Tax expenditures are defined as revenue losses that arise due to concessions that fall outside the regular tax system24. Calculation of Tax expenditures would cover all the tax incentives such as:
• Exemptions: income excluded from the tax base
• Allowances: amounts deducted from gross taxable income
• Credits: amounts deducted from tax liability
• Rate relief: a reduced rate of tax applied to a class of taxpayers or activities
• Tax deferrals: relief that takes the form of delay in paying tax (for example, accelerated depreciation)
• Duty Exemptions: Duty not collected on imports that in the usual course would be collected
• VAT Exemptions/Zero-rating: VAT not collected either on imports/production or value added.
Figure 9 shows the extent of tax expenditures in twenty-two countries that includes several OECD countries where it is a common practice to calculate them and recent efforts by the international agencies to calculate them for developing countries.
Figure 6: Tax Expenditure as % of GDP
Source: OECD, IDB and World Bank Reports
24 A major part of this section was drawn from Brixi and others (2003).
0.0%
1.0%
2.0%
3.0%
4.0%
5.0%
6.0%
7.0%
8.0%
9.0%
10.0%
Gu
ate
ma
la
Ca
na
da
Bu
run
di
UK
US
A
Ind
ia
Sp
ain
Me
xico
Rw
an
da
Ta
nza
nia
Ga
bo
n
Gu
ine
a
Ch
ile
Co
lum
bia
Ke
nya
Ug
an
da
Bra
zil
Tu
nis
ia
Ko
rea
Pe
ru
Arg
en
tin
a
Ne
the
rla
nd
s
Ge
rma
ny

21
Tax Expenditures and the Budget process
As the revenue costs are considerable, for the sake of stability in Public Finance, it is good practice to include the extent of tax expenditures as part of the budget process as in the case of ordinary expenditures. Unlike ordinary expenditures made out of the budget, revenue losses due to tax incentives are generally not perceived by the public as expenditures though they have the same effect.
By providing a greater level of transparency as to how governments spend their moneys, tax expenditure reports improve accountability of governments to taxpayers. It is quite common in countries with weak institutions for powerful lobbies and special interests to extract tax concessions from governments whose fiscal costs are rarely computed or even if they are computed, are never made public. As a result, the tax collection is affected reducing the ability of the governments to provide public goods to the citizens. Had the true fiscal costs been revealed, the public could be empowered to make the decision if the tax concessions result in tangible benefits that more than make up for the revenue losses. This ensures that such distorting tax concessions are kept within.
Tax expenditure budgets/reports are usually produced on a yearly basis, though some countries may do so once every two years. The process of computing the tax expenditures is data-intensive and may stretch the capacity of tax policy departments. However, the benefit in terms of transparency implies that countries benefit from these reports and such countries may adopt a regular process of estimating them though not necessarily every year. In Australia, the United States, Germany, and France there is a legal obligation to prepare tax expenditure. However, in the United Kingdom, Netherlands, and India, no such obligation exists.
How are tax expenditures computed?
The calculation of tax expenditures is not straight-forward as it involves establishing a base-line as to what constitutes the benchmark tax system. This benchmark could be different in different countries. For example, if the benchmark income tax rate in one country is 30% with a reduction of 10 percentage points for certain kinds of investments, the tax expenditure would be quite different from another country where there is a similar 10 percentage point reduction but where the benchmark tax rate is 20%.
Calculating the Tax Expenditures in the case of VAT also poses difficulties due to exemptions that may go towards intermediate inputs and not towards final consumption. For example, if there is an exemption from VAT on imports for certain kind of supply, say on the import of sugar. It is necessary to estimate how much of the imports go towards final consumption in which case the entire tax not collected towards such consumption is the tax expenditure. However, if the tax is sold to intermediaries, then some of the tax not collected

22
at imports could be recouped during final sale. Hence the calculation of tax expenditure on VAT exemptions and zero-rating requires the use of supply-and-use tables which provide industry-wide averages for final and intermediate consumptions of all supplies.
Tax expenditures are estimated using any of three methods:
The revenue foregone method. This is a calculation of the loss incurred by the governments due to the tax concessions. This is the easiest and most popular method of calculating tax expenditures. It involves using simple accounting of the reduction of the taxes paid as shown in the tax returns and documents provided during import. As a result, it is a static analysis and does not take into consideration the change in behaviour of taxpayers due to the tax changes.
The revenue gain method. In this method, the revenue gain that would result from bringing the tax concessions to the regular level is calculated. In this method, behavioural changes by taxpayers are taken into consideration when computing the revenue gain. For example, if the VAT rate for a certain preferred consumption is increased to the regular VAT rate, this might result in lower level of consumption due to higher price. As a result, the computation of the tax expenditure, in this case, would take into consideration the new demand for the goods (using the tax elasticities) and, in this case, the tax expenditure may not be as high as the case if such behavioural changes are not taken into consideration.
The outlay equivalent method. In this method, the tax expenditure is calculated as the direct spending that would result in the same benefit for the taxpayer as the tax concession. This would differ from the revenue forgone if the direct spending on the taxpayer in the form of a grant, for example, is itself taxable.
The actual calculation is data intensive requiring extensive details of the accounts of taxpayers and is usually done by simulating the tax concessions and the tax norms on a sample of tax returns.
The Table below gives basic calculations of the most popular tax expenditures whe using the revenue foregone method:
Tax expenditure type Calculation
Tax exemption (e.g. tax holiday)
Gross income of companies that qualify for tax holiday * effective tax rate T
Investment Allowances (%) Investment that qualifies for allowance * Allowance * T
Investment Tax Credit (%) Investment that qualifies for credit * Credit
Reduced tax rate R Gross income of companies that qualify for the reduced tax rate*(T–R)
Accelerated depreciation Deductions for the current year – income inclusion from
23
previous deferrals for the current year
Import tax exemptions Value of imports qualifying for the import tax exemption * import tax
Policy implications
Governments should as far as possible:
• Estimate the amount of revenue lost as a result of tax incentives
• Incorporate these tax expenditures as a part of the annual budget process
7. When Incentives May Be Used?
“Tax incentives improve economic performance only if government officials are better able to decide the best types and means of production than are private investors.”
———Richard Bird When assessing the utility of incentives, thought should be given to the circumstances under which governments should intervene in market operations. That is, when will private enterprises ensure that resources are used efficiently, and when should governments play a role? This section discusses examples of market failures. This is not to suggest that incentives should be offered to correct all such failures or anomalies, but rather that there are areas where governments may consider applying this policy framework to see if intervention is warranted.
Public goods
When considering approaches to stimulate certain economic activities or sectors or when establishing its policy to attract investment, a government should always ask what policy decision is likely to generate the most long-term economic activity or growth: spending a dollar directly on public goods and services or spending a dollar on incentives.
When the level of public goods is very low, the marginal benefit from an additional amount of public good is more than the marginal cost. Hence, it is optimal to invest in more public goods. On the other hand, an investment incentive could create private investment that in turn generates benefits for the economy. The goal is to compare the opportunity costs of public funds with the returns on funds used for investment incentives.
Consider the following examples:
• Tourism. In a country with weak road infrastructure, a dollar spent on roads leading to and from a tourist area is likely to create more economic activity than a dollar in tax concessions provided to a tourism company.

24
• Manufacturing. In a country with weak infrastructure and many unskilled workers, a dollar spent on roads, ports, telecommunications, or education is likely to attract more investment than a dollar in tax concessions provided to a manufacturing firm.25
Another consideration is that some public goods will not be supplied by the market or, if supplied, will be insufficient. In such cases thought should again be given to whether incentives can efficiently correct the undersupply.
Positive externalities
Economic activity often leads to positive externalities that governments want to support and encourage, perhaps through the use of incentives. Examples of such externalities include:
•••• Investments in technology—such as research and development or high-tech industries—that upgrade worker skills.
•••• Infrastructure projects that encourage business growth.
•••• Investments that create jobs in areas with high unemployment.
•••• Environmentally friendly technology.
•••• Anchor investments—that is, those that provide multiplier effects through signaling and by creating backward linkages into the local economy.
Such investments can have positive, often long-term spillover effects on the economy or environmental protection, making it easier to justify spending on incentives.
International tax competition
Tax competition creates a race to the bottom, with countries competing against each other to offer more generous incentives. There is evidence that tax competition is occurring between developing countries and is successful in attracting footloose investments (Klemm and VanParys 2009). Countries that attract such investments may suffer from the “winner’s curse”—having given up too much in exchange for investment. Moreover, while a country may win or lose a specific investment, in aggregate tax competition lowers revenues for all countries if investments would have been made in any case (a situation akin to the “prisoner’s dilemma”). Finally, footloose investments respond to tax incentives, yet often relocate to another tax-favored jurisdiction after tax incentives have been exhausted. Many investors also bargain with different governments to get the best incentive package, and governments generally acquiesce afraid that the investment would be lost if the demanded tax incentive is not provided.
25
Despite this, it is not uncommon for investment incentives to be given to mining companies. This could be
partly due to political economy pressures.
25
There is a strong role for international bodies such as the IMF, World Bank, and OECD to provide coordination and avoid harmful tax competition so that all countries can gain. While tax competition results in a race to the bottom there are situations where the opposite is possible26. Investments that tend to cluster in a certain location taking advantage of existing investments and supporting eco-system and in some cases the availability of specialized skills and resources. In fact, this can result in a race to the top, with countries raising taxes to capture the rents arising from such agglomeration benefits. Though such pressures typically occur in developed countries, China’s manufacturing cluster and India’s software cluster are notable examples in the developing world. Regional Tax Harmonization to tackle Tax Competition
The ECOWAS, SADC, OECS and the EAC have all made attempts at harmonizing their tax incentive regime with the aim of avoiding tax competition. However, these efforts have mostly been unsuccessful reflecting the difficult coordination problem. The European Union and the West Africa Economic and Monetary Union (WEAMU) are good examples where considerable efforts have been made to set-up a structure to tackle the problem of tax competition through the use of Rules. In the case of the EU the use of tax and nontax incentives are governed by State Aid rules which are enforceable in the European court of justice. This has provided some amount of harmonization it has been severely tested by Ireland through its low tax rate and the Netherlands by making available special tax reduction schemes that considerably reduces the tax burden of businesses set-up in their jurisdiction. The WAEMU has gone further than the EU in issuing directives that limit the applicable tax rates that countries could use. However in this case the overall impact has not been very effective because countries have provided tax incentives outside the tax laws even while following the directives on the applicable tax rates that could be used. The East Africa Community (EAC) has recently made the most progress towards a system of harmonizing their tax incentive regime through the use of a ‘Code of Conduct’ which is yet to be adopted. The Code of Conduct aims to formalize an existing arrangement whereby each year, the finance ministers of the five countries that make up the EAC meet before their budget speeches are made and discuss their budget proposals. This provides the opportunity for Finance Ministers to dissuade other members if they propose any new tax incentive that puts other countries at a disadvantage. However, using a non-enforceable ‘Code of Conduct’ has not proved to be effective in the Caribbean countries. Article 15#2 of the Revised Treaty of Basseterre (2011) reads, “Protocol Member States agree to the progressive harmonization of their fiscal policies and
26 Baldwin Richard and Krugman Paul. “Agglomeration, integration and tax harmonization”. European Economic Review 48 (2004) 1-23.

26
fiscal incentive regimes.” Despite this agreement, Caribbean states have been the most aggressive in out competing each other in offering Tax Holidays as long as 25 years. However, with the lack of consensus on this issue as a result of limited political support to tackle the problem as well as lack of an intuitional enforcement mechanism as in the case of the EU, it is unlikely that any progress could be made on this issue. There are two pressures that are dissuading countries from further tax competition, the hollowing out of the tax base resulting in higher taxes being borne by immobile factors of production such as labor. Second, the attempts by the international community to come down on aggressive tax planning as well as practices such as transfer pricing which limits the benefits accorded by the tax incentives27. Policy implications
To the extent possible, governments should:
• Use incentives to encourage the private sector to fund public goods or goods with a strong private good character (such as infrastructure).
• Limit use of incentives for activities unlikely to generate social benefits.
• Use resources saved by eliminating incentives for spending that the private sector is unwilling to cover.
• Make attempts towards setting up institutional as well as enforcement mechanisms to tackle tax competition.
8. Costs of Managing and Administering Incentives
As implied by the model from section 2, effective incentive policy requires reducing the nonrevenue costs of incentives.28 Ways to do so include reducing misuse of incentives, administering incentives effectively, and easing the compliance burden on investors who want to take advantage of incentives. Among other things, nonrevenue costs can involve:
• Distortions created by encouraging new investments that are detrimental to existing ones.
• Time and money spent by businesses lobbying the government for tax incentives.
• Time and money spent by businesses qualifying for and obtaining tax incentives.
• Revenue lost to illegal activity, such as from businesses that do not qualify for tax exemptions but falsify information to do so, or indirect revenue lost to businesses that do not qualify for tax incentives but illegally use tax-exempt entities to source goods.
27 The Vodaphone case is a recent example where the Indian government deemed that the transfer of ownership of a mobile operator to have taken place in India and hence liable to taxation on the capital gains in India even though the transfer of ownership was routed through companies located in the Cayman Islands where there was no tax on capital gains. 28 See Wells, Louis T., Nancy J. Allen, Jacques Morisset, and Neda Pirnia, 2001, “Using Tax Incentives to
Compete for Foreign Investment—Are they Worth the Costs?” International Finance Corporation and World
Bank, Foreign Investment Advisory Service (FIAS).
27
• Additional costs for authorities responsible for administering tax incentives.
Though these nonrevenue costs are difficult to quantify, they may greatly exceed the financial costs of incentives. Thus they should be kept in mind when formulating incentive policy.
Distortions created by unduly favoring new investments
By definition, incentives for new investments place existing investments at a disadvantage. The goal of investment incentives is to create new investments or expand existing ones. But in their desire to attract new investors, policymakers may neglect existing investors. Much can be gained by addressing the issues facing existing investors in expanding their investments. Indeed, if existing investors are not taken care of, new investors will be less likely to invest. Moreover, providing excessive investment incentives can erode the tax base by putting more pressure for revenue on the smaller base of existing investors—increasing their tax burdens and creating distortions. One response to such pressure is to evade taxes by posing as a new investor and benefiting from investment incentives. A common example is the abuse of tax holidays by investors who reorganize as new investors when their benefits expire.
Last but not least is the loss of business from existing investors who do not receive incentives to those who do.
Reducing Discretion and the costs of obtaining tax incentives
The costs of obtaining tax incentives are not trivial when incentives are discretionary. This discretion could happen when tax payers could apply for new tax incentives or when taxpayers have to go through an approval process to qualify for tax incentives that are already available in the law. These procedures could require considerable time and money from investors. Investment climate surveys in Jordan, Mozambique, Nicaragua, and Serbia have found that obtaining incentives delayed projects or raised costs for about a fifth of investors (Table 5). Some delays lasted more than a year. Some investment promotion agencies require that investors be approved before they can receive incentives. For example, the Gambia’s investment promotion authority confers a special status on investors, who are then awarded special investment certificates that entitle them to benefit from incentive packages. The investment promotion authority also states that, “Apart from these specific incentive packages, others can be negotiated with the Agency depending on the strategic nature of the investment.”29
29
http://www.gipfza.gm/Why_The_Gambia/Investment_Incentives.aspx (accessed 10 September 2009).

28
Table 6: Costs of obtaining Incentives
Mozambique Jordan Serbia Nicaragua
Did obtaining
incentives delay
project
implementation?
22% said yes (10% by 1–3 months; 8% by 3–6 months) 78% said no
18% said yes (8% by 3–6 months; 2% by 18 months or more) 82% said no
2% said yes 98% said no
27% said yes (20% by 2–12 months; 1% by more than 12 months) 72% said no
Did obtaining
incentives add to
project costs?
27% said yes 72% said no
5% said yes 95% said no
20% said yes 80% said no
13% said yes 85% said no
What were the
main additional
costs?
18% said additional senior management time 15% said loss of business
Not an issue 12% said additional consulting fees 6% said additional senior management time
26% said additional senior management time 24% said legal fees 17% said loss of business
To the extent possible, qualification for incentives should be automatic, with investors receiving them if they satisfy the conditions required by tax and other laws. Investors’ costs increase if they are asked to go through an approval process. Moreover, most investment promotion agencies lack the capacity to administer incentives—especially tax incentives. Table XX and Figure XX shows that in general taxpayers take more time to start their business in countries where the tax incentive was obtained in a discretionary manner. Figure shows that in Sub-Saharan Africa, more time to start a business is associated with discretion in the allotment of tax incentives.
Table 7: Discretion in granting Tax Incentives
Countries
Surveyed
Average delay in days for granting of incentives
Answer to the question, “Approximately how
many days/weeks/months were required to obtain the incentives over and above the time needed for
standard registration and start-up procedures?”
Discretion in
allotting the tax
incentive?

29
Serbia 6 No
Rwanda 10 No
Tanzania 15 No
Uganda 18 No
Jordan 21 Yes
Nicaragua 42 No
Burundi 47 Yes
Kenya 63 Yes
Guinea 80 Yes
Tunisia 95 Yes
Reducing discretion also is necessary to reduces opportunities for corruption. It also levels the playing field and avoids anti-competitive behavior when different taxpayers who are similarly placed are treated differently with regard to being provided a tax incentive as well as when qualifying for a tax incentive. In order to reduce discretion, certain principles could be adopted. Tax Incentives should only be provided through the laws especially the tax laws (including the customs law for duty exemption). This ensures that the legal basis governing the tax incentive has been approved by the legislature and is transparent and available to all taxpayers and not left to executive discretion. It is also important that any existing laws that provide for tax incentives be consolidated and provided as far as possible through the relevant tax legislation. This ensures that there is not overlap of the different tax incentives and avoids any lack of alignment of the tax incentives with the applicable tax laws. In order to reduce discretion on the administration of the tax incentive, it is necessary that the tax law that provides for the tax incentive specifies quite clearly the conditions that the taxpayer should satisfy to qualify for the tax incentive without requiring the use of discretion during implementation. When this is done, it is essential to ensure that the process of administering the tax is left to the tax administration and not to an external agent. Doing the latter only duplicates the process of administering the tax incentive increasing the cost of compliance for taxpayers.
Indirect Revenue losses due to incentives
The moment a benefit is created for some taxpayers, it provides an opportunity for those who do not qualify to abuse the system. James (2007) describes how businesses that are not eligible for a lower tax rate try to look like those that are—even incurring costs to do so. Such fraud cannot be uncovered except through intrusive audits, and the resulting revenue leakage can be considerable.
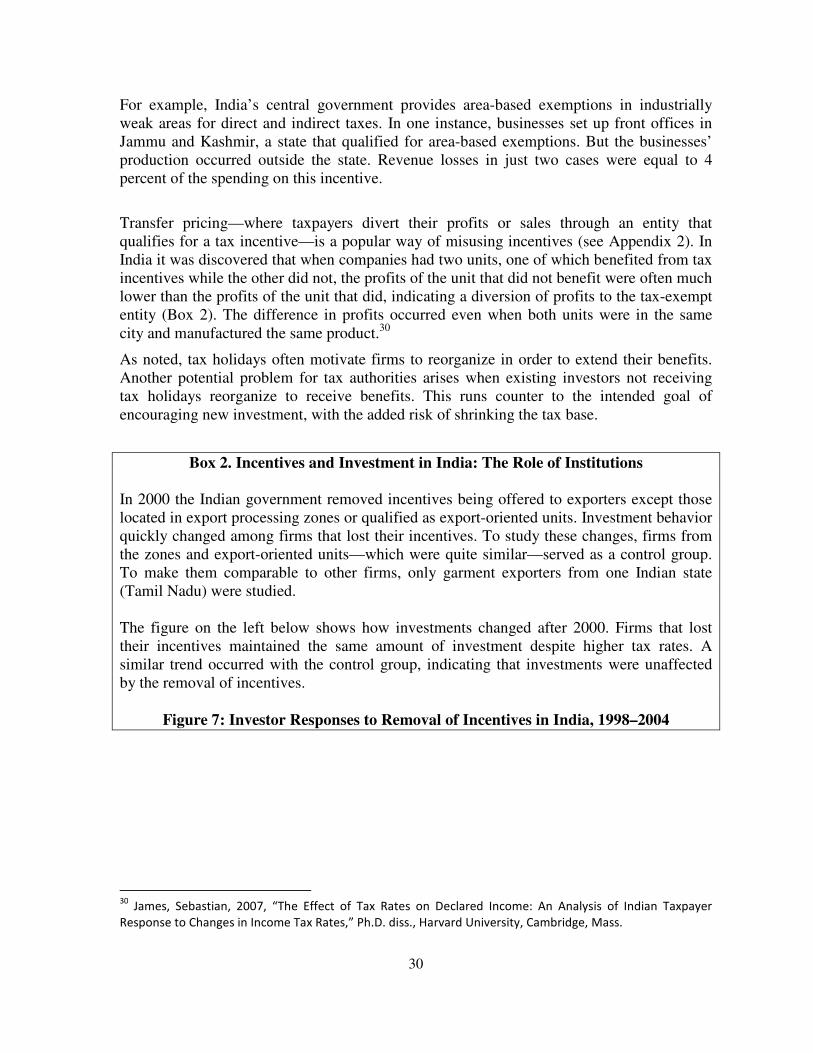
30
For example, India’s central government provides area-based exemptions in industrially weak areas for direct and indirect taxes. In one instance, businesses set up front offices in Jammu and Kashmir, a state that qualified for area-based exemptions. But the businesses’ production occurred outside the state. Revenue losses in just two cases were equal to 4 percent of the spending on this incentive.
Transfer pricing—where taxpayers divert their profits or sales through an entity that qualifies for a tax incentive—is a popular way of misusing incentives (see Appendix 2). In India it was discovered that when companies had two units, one of which benefited from tax incentives while the other did not, the profits of the unit that did not benefit were often much lower than the profits of the unit that did, indicating a diversion of profits to the tax-exempt entity (Box 2). The difference in profits occurred even when both units were in the same city and manufactured the same product.30
As noted, tax holidays often motivate firms to reorganize in order to extend their benefits. Another potential problem for tax authorities arises when existing investors not receiving tax holidays reorganize to receive benefits. This runs counter to the intended goal of encouraging new investment, with the added risk of shrinking the tax base.
Box 2. Incentives and Investment in India: The Role of Institutions
In 2000 the Indian government removed incentives being offered to exporters except those located in export processing zones or qualified as export-oriented units. Investment behavior quickly changed among firms that lost their incentives. To study these changes, firms from the zones and export-oriented units—which were quite similar—served as a control group. To make them comparable to other firms, only garment exporters from one Indian state (Tamil Nadu) were studied.
The figure on the left below shows how investments changed after 2000. Firms that lost their incentives maintained the same amount of investment despite higher tax rates. A similar trend occurred with the control group, indicating that investments were unaffected by the removal of incentives.
Figure 7: Investor Responses to Removal of Incentives in India, 1998–2004
30
James, Sebastian, 2007, “The Effect of Tax Rates on Declared Income: An Analysis of Indian Taxpayer
Response to Changes in Income Tax Rates,” Ph.D. diss., Harvard University, Cambridge, Mass.
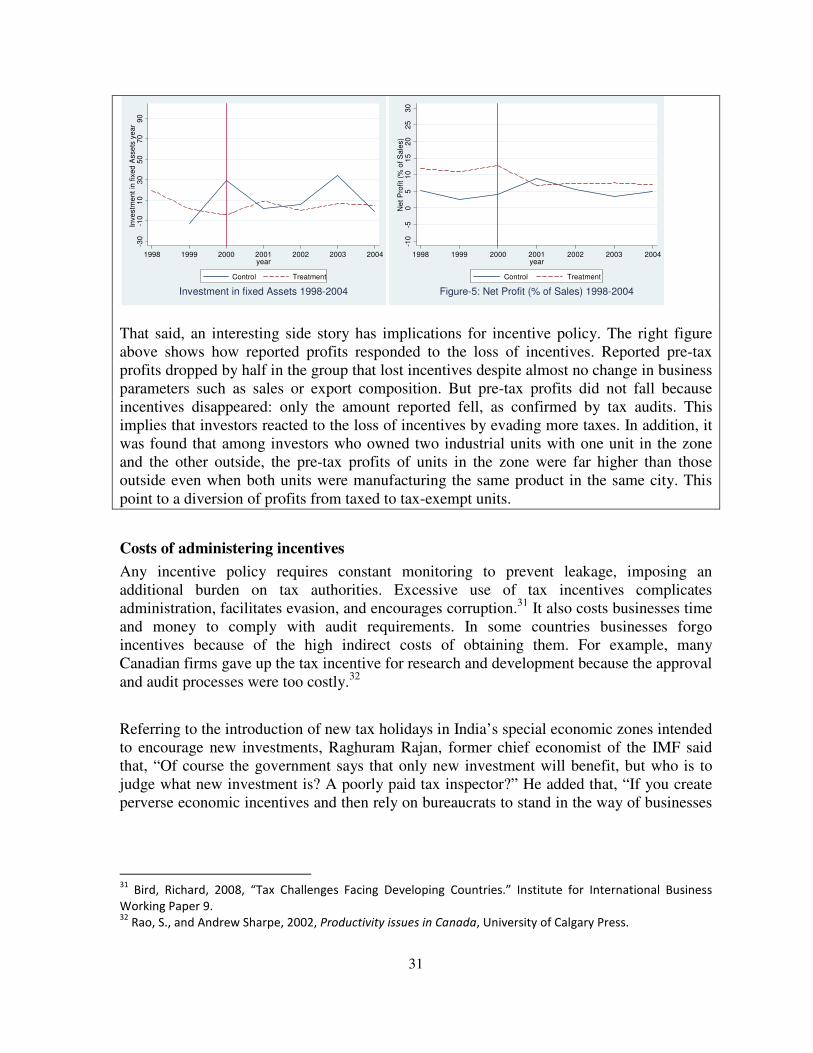
31
That said, an interesting side story has implications for incentive policy. The right figure above shows how reported profits responded to the loss of incentives. Reported pre-tax profits dropped by half in the group that lost incentives despite almost no change in business parameters such as sales or export composition. But pre-tax profits did not fall because incentives disappeared: only the amount reported fell, as confirmed by tax audits. This implies that investors reacted to the loss of incentives by evading more taxes. In addition, it was found that among investors who owned two industrial units with one unit in the zone and the other outside, the pre-tax profits of units in the zone were far higher than those outside even when both units were manufacturing the same product in the same city. This point to a diversion of profits from taxed to tax-exempt units.
Costs of administering incentives
Any incentive policy requires constant monitoring to prevent leakage, imposing an additional burden on tax authorities. Excessive use of tax incentives complicates administration, facilitates evasion, and encourages corruption.31 It also costs businesses time and money to comply with audit requirements. In some countries businesses forgo incentives because of the high indirect costs of obtaining them. For example, many Canadian firms gave up the tax incentive for research and development because the approval and audit processes were too costly.32
Referring to the introduction of new tax holidays in India’s special economic zones intended to encourage new investments, Raghuram Rajan, former chief economist of the IMF said that, “Of course the government says that only new investment will benefit, but who is to judge what new investment is? A poorly paid tax inspector?” He added that, “If you create perverse economic incentives and then rely on bureaucrats to stand in the way of businesses
31
Bird, Richard, 2008, “Tax Challenges Facing Developing Countries.” Institute for International Business
Working Paper 9. 32
Rao, S., and Andrew Sharpe, 2002, Productivity issues in Canada, University of Calgary Press.
-30
-10
10
30
50
70
90
Inve
stm
en
t in
fix
ed
Asse
ts y
ea
r
1998 1999 2000 2001 2002 2003 2004year
Control Treatment
Investment in fixed Assets 1998-2004
-10
-50
51
01
52
02
53
0N
et
Pro
fit
(% o
f S
ale
s)
1998 1999 2000 2001 2002 2003 2004year
Control Treatment
Figure-5: Net Profit (% of Sales) 1998-2004

32
exploiting them, the outcome will be little more, and a lot less revenue, but much richer bureaucrats.”33
Cost-Benefit Analysis - gauging the cost-effectiveness of investment incentive policies
The rational government would decide whether to provide a particular tax incentive depending on its costs and benefits. In general the cost of tax incentives is easier to measure than the benefits. The direct costs are the revenue loss as a result of the tax incentives provided to the investors who would have invested anyway. The indirect costs are the distortion costs, the additional cost as a result of evasion as a result of taxpayers claiming incorrectly that they qualify for the tax incentive, the additional cost of compliance for taxpayers as well as the additional costs of administering the tax incentives for the tax administration. The benefit that is relatively easy to measure would be the jobs created by those investors who changed their decision to invest as a result of the tax incentive. Other benefits such as a more diversified economy, more skill development, incorporating new technology, are much harder to measure. A first approximation would be to limit the benefits to the jobs created by the marginal investors and the cost would be the revenue cost for the investments that would be made anyway. A useful metric in this case is the revenue cost for each job created. Though this does not entirely cover all the costs as well as all the benefits, it provides a ballpark figure that can help policymakers decide if the incentive was worthwhile. For example, a 2008 Investment climate advisory study found that the Yemeni government spent about $6,000 each year for 8,000 jobs that investment incentives helped create—more than six times the country’s per capita income. In Thailand a 1999 FIAS study found that investment incentives each year cost the government about 16 times the average annual wage of an industrial worker. In the case of Tunisia it was found that the cost of tax incentives for each job created was three and a half times the per-capita income. Table 3 gives a first approximation of the cost versus the benefits. Column (2) gives the redundancy ratio which is the percentage of investors who would have invested even without the tax incentives. Column (3) shows the percentage of jobs created by these marginal investors. If the marginal investors on average create more jobs as a percentage of the total jobs as compared to the proportion of their numbers then one could argue that the marginal investors provide more benefits.
33
Rajan, Raghuram, 2006, Finance and Development (September).
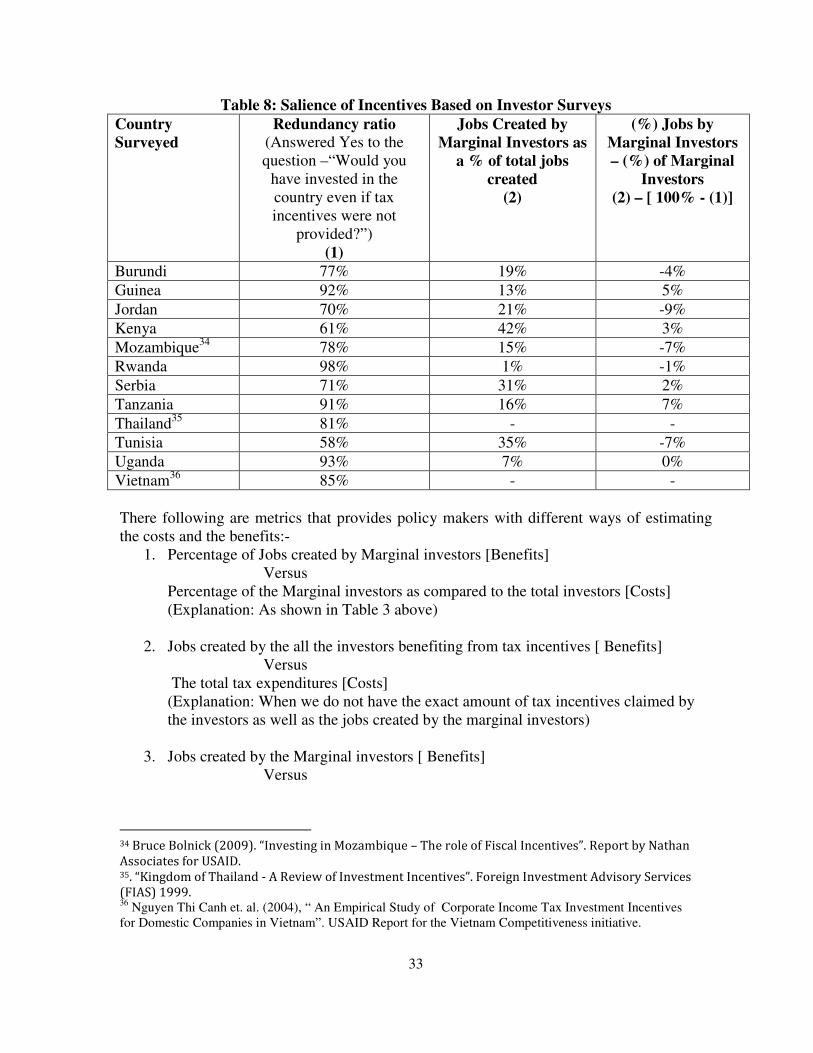
33
Table 8: Salience of Incentives Based on Investor Surveys
Country
Surveyed
Redundancy ratio
(Answered Yes to the question –“Would you
have invested in the country even if tax incentives were not
provided?”) (1)
Jobs Created by
Marginal Investors as
a % of total jobs
created
(2)
(%) Jobs by
Marginal Investors
– (%) of Marginal
Investors
(2) – [ 100% - (1)]
Burundi 77% 19% -4%
Guinea 92% 13% 5%
Jordan 70% 21% -9%
Kenya 61% 42% 3%
Mozambique34 78% 15% -7%
Rwanda 98% 1% -1%
Serbia 71% 31% 2%
Tanzania 91% 16% 7%
Thailand35 81% - -
Tunisia 58% 35% -7%
Uganda 93% 7% 0%
Vietnam36 85% - -
There following are metrics that provides policy makers with different ways of estimating the costs and the benefits:-
1. Percentage of Jobs created by Marginal investors [Benefits] Versus
Percentage of the Marginal investors as compared to the total investors [Costs] (Explanation: As shown in Table 3 above)
2. Jobs created by the all the investors benefiting from tax incentives [ Benefits] Versus
The total tax expenditures [Costs] (Explanation: When we do not have the exact amount of tax incentives claimed by the investors as well as the jobs created by the marginal investors)
3. Jobs created by the Marginal investors [ Benefits] Versus
34 Bruce Bolnick (2009). “Investing in Mozambique – The role of Fiscal Incentives”. Report by Nathan Associates for USAID. 35. “Kingdom of Thailand - A Review of Investment Incentives”. Foreign Investment Advisory Services (FIAS) 1999. 36 Nguyen Thi Canh et. al. (2004), “ An Empirical Study of Corporate Income Tax Investment Incentives for Domestic Companies in Vietnam”. USAID Report for the Vietnam Competitiveness initiative.

34
The Revenue cost as measured by the percentage of non-marginal investors multiplied by the total tax expenditures [Costs] (Explanation: When we do not have the exact amount of tax incentives claimed by the investors but we are able to find though surveys the marginal investors as well the jobs they create)
4. Jobs created by the Marginal investors [ Benefits] Versus
The Revenue cost as measured by the actual tax expenditures incurred by the non-marginal investors [Costs] (Explanation: When we do have the exact amount of tax incentives claimed by the investors as well as the jobs created by the marginal investors)
The Cost and benefits as described above give policy makers ball-park estimates which could then be used to advise policy. Measuring benefits such as diversification, skill development are much more difficult to measure. However it is possible to provide similar back to the envelope cost-benefit calculations as follows:-
- Creating not just more jobs but higher-value added jobs
Multiply the jobs created by the marginal investors in different categories with the
salary paid to the staff in each of these categories where the salary is the proxy of
the value-added.
- Creating not just direct jobs but also indirect jobs in all the industries that are
incentivized beyond the marginal investors
Multiply the jobs created by the marginal investors by a factor that captures the
indirect jobs created which could vary by sector - Creating new skills and research jobs
Estimate the jobs created under different categories including research jobs and use the same metric of the cost to create these jobs. Alternatively, estimate the revenue costs for each of the patents that the tax incentives have incentivized.
Policy implications
When incentives put pressure on an administration, impose additional costs on businesses, and create opportunities for rent seeking, policies are required to mitigate such problems. The following principles can help guide policymakers in such efforts.
• Incentives should be granted automatically. Eligibility for incentives provided by law should be based on clear criteria, not granted through special permission or certification by investment promotion agencies, ministries of trade, or other government agencies. This approach ensures prompt decision making and quick turnaround times for investors—essential to attracting and retaining investment.

35
• Good policymaking and tax administration require that tax incentives be part of the tax
code. Governments should place tax incentives in the relevant tax code so that tax authorities can administer them. Some tax incentives are provided through different statutes, and in extreme cases through individual agreements with investors. Those approaches create confusion about which government body administers tax incentives. If relevant tax clauses cannot be moved to the tax law, they should at least be mirrored or copied there. Doing so unambiguously allows the tax administration to administer tax incentives and limit their abuse.
• Incentives require adequate monitoring and control mechanisms. The tax administration should check that investors receiving tax incentives satisfy the requirements for them. To enable them to do so, it should be compulsory for tax returns, declarations, and relevant forms to be filed regularly as a precondition for tax benefits. Tax incentives should not be used as an excuse to avoid the compliance requirements of the tax administration. Moreover, strict information requirements (including the complete financial statements of related businesses) and regular audits must be imposed on firms seeking tax holidays.
• Measure the Costs and Benefits of Tax Incentives. The government should periodically measure the costs as well as the benefits of the tax incentives to inform policy making whether to continue, eliminate or modify them.
9. Political Economy and Tax Incentives
“If one cannot simply eliminate tax incentives, I have elsewhere suggested three simple rules to reduce the damage that may be caused by poorly-designed and implemented incentives: keep them simple, keep records, and evaluate the result. Alas, very few developing countries have managed to follow even such basic rules as these: the political advantages of ambiguity seem always to outweigh the potential social gains from transparency.”
———Richard Bird 37
The preceding analysis of the costs and benefits of incentives is based purely on economic criteria. But governments’ behavior is not always driven by economic rationality, and political rather than economic considerations often tip the balance in favor of incentives. Incentives are popular with governments for a variety of reasons, including: ● They are a less visible way for governments to provide special benefits to certain
businesses. ● They are easier to provide than infrastructure, labor skills, or other investment climate
improvements.
37
Bird, Richard, 2008, “Tax Challenges Facing Developing Countries,” Institute for International Business
Working Paper 9.
36
● When ministries other than the ministry of finance are allowed to provide tax incentives, the incentives are misaligned. Other ministries tend to give more incentives than is optimal because they do not have to bear the burden of lower tax collections.
● Governments want to be seen as doing something active to attract investments. The easiest approach tends to be to give up revenue that they do not have.
Tax incentives, like any market intervention, are justified if they correct market inefficiencies or generate positive externalities. Though there is limited evidence that tax concessions work, they hold considerable appeal for politicians because discretionary tax incentives—especially in developing countries—generate political influence over policy options, provide a political gesture of action, and facilitate political and administrative corruption.
Discretionary tax incentives are popular with politicians38
The tax complexity arising from tax incentives results from political tradeoffs—the product of elite bargaining within the political rules of the game. For example, through the fragmented power structures under Boris Yeltsin’s Russia in the 1990s, politically powerful elites secured exemptions through tax expenditures (incentives, concessions, holidays, exemptions) estimated to equal more than two-thirds of taxes collected for the federal budget (Easter 2008). Policymakers should be cautioned against introducing incentives that could notionally result in two investors in the same sector or two similar enterprises receiving entirely different incentive packages. Beyond the risk of enabling corruption, such a regime runs contrary to internationally accepted principles and will likely destroy any confidence that investors should have in government authorities to create an enabling business environment.
Tax incentives have unknown costs
Tax expenditures hold special political appeal because their costs are usually unknown, interference from other “veto players” (such as legislatures) is limited or nonexistent, and revenues losses are dispersed over the long term—while the political benefits, especially from discretionary regimes, are immediate and offer opportunities for corruption, on which political stability (Khan 2006) and personal greed depend. Thus tax incentives and the corruption around them offer what North and others (2007) describe as “the universal problem of violence and disorder.” They do so by providing powerful individuals and groups with incentives to cooperate with rather than fight the coalition in power.39
38 Major part of this section and the next two are drawn from Everett-Phillips, Max, 2009, part of chapter 7 in Handbook of Tax Simplification, World Bank Group, Investment Climate Advisory Services. 39 North, Douglass C., John Joseph Wallis, Steven B. Webb, and Barry R. Weingast, 2007, "Limited Access Orders in the Developing World: A New Approach to the Problems of Development," Policy Research Working Paper 4359, World Bank.
37
Tax expenditure budgeting is a useful tool for shedding light on the cost of incentives. Developing countries are increasingly using this tool, with India, Morocco, South Africa, and Uganda as recent examples. Investment Climate Advisory studies in Rwanda and Sierra Leone have found that more than one-third of tax revenues were given up as incentives—revenues that were badly needed to deliver basic public goods such as health care and education, prolonging both countries’ dependence on aid.
Tax incentives can work if governance is good
Tax incentives have worked in the context of effective governance. East Asian governments were able to offer successful nondiscretionary incentives that attracted private investors and promoted exports and technological adaptation and innovation (Choi and Kwack 1990). The type of political regime influences tax incentive policy. Countries with better governance offer lower tax incentives, with a stronger effect in more democratic countries (Li 2006). In environments with weaker governance, lacking the political incentive to deliver economic growth to legitimize the state, it can be difficult for political processes to select the right projects to support. At the same time, tax incentives may shift investment to certain industries or political priority areas because of redistributive concerns (for example, incentives for investment in poor areas), positive spillovers (for example, incentives for high-tech industries that transfer technology to the rest of the economy), or for economic diversification. But in all cases it remains problematic for political processes to correctly identify such spillovers without the politically driven “action learning” that underpinned the East Asian miracle.
Bargaining for incentives—the role of tax competition
Demands for incentives are also driven by the private sector. For export-oriented investors, lowering costs is critical to being competitive. Surveys of non-export-oriented investors have confirmed that while incentives were not an important factor in their decisions to invest, they would ask for them anyway because incentives improved their bottom lines. A survey of U.S. investors concluded that those who considered tax exemptions did so only marginally (Aharoni 1966). In fact, one concluded that, "Tax exemption is like a dessert; it is good to have, but it does not help very much if the meal is not there." Given that governments tend to buckle under pressure, many investors have played one country against another in seeking generous incentives, with the ”winning” country invariably overplaying its hand and ending up the loser. In 2001 Ramatex, a Malaysia-based textile manufacturer, negotiated with the governments of Botswana, Madagascar, and South Africa, then decided to invest in Namibia, which offered a 20-year tax holiday, subsidized
38
water and electricity, a 99-year tax exemption on land use, and R 60 million ($1 = R 8.12) to prepare the site (including setting up electricity, water, and sewage infrastructure). In fact, Namibia actively competed against South Africa, which offered a six-year tax holiday and subsidized land. But a year after production started, the Namibian government was having serious doubts about whether Ramatex would honor its promise of creating jobs.40 The factory closed in 2008 amid complaints of worker mistreatment and groundwater pollution, along with claims that the company had used Namibia only as a transshipment point. Wells and others (2001) discuss a large multinational corporation planning to set up an export-oriented electronics plant and bargaining with the Indonesian and Malaysian governments for generous tax benefits. In the end Malaysia “won” the contest, but the company then revealed that it had never intended to locate in Indonesia. Yet by playing one government against the other, it got a good deal. Tax competition creates a race to the bottom and is a classic coordination problem among countries. As an international public good, tax competition should be managed through international or regional agreements so that governments do not end up losing. The European Union offers a good model to emulate in this regard.
Incentives create a community that depends on them
In many countries incentives have stayed on the books long after the period they were intended for and well after their benefits no longer exist. Incentives create a community of businesses that depend on and lobby for them even after using up their benefits for the initial period they were granted. As Richard Bird has noted, “Once created, concessions usually prove hard to remove and tend to be enlarged at the initiative of taxpayers who lobby for more concessions or simply redefine existing concessions in unforeseen and presumably undesired ways. Get rid of them.” Once incentives are granted, it is extremely difficult to wean businesses away from them without expending a huge amount of political capital.
Policy implications
Tackling the persistence of incentives arising from political economy is extremely challenging. But certain methods can alleviate the problems, making it difficult for political elites to grant special favors and for special interests to receive them:
• Incentives should be granted transparently, through legislation. Incentives are more transparent and less subject to abuse when provided by law and approved by the legislature. This is particularly relevant because budgetary processes are usually subject to parliamentary oversight—and because tax incentives have budgetary consequences, they should be provided in a similar way. Doing so ensures that incentives are granted according to uniform, predetermined criteria available to the public. Incentives can be
40 James, Sebastian (2003); see also Bolnick (2004).

39
granted by the executive as political favors when transparency and public awareness are limited and checks and balances are lacking.
• Discretion should be limited. Discretionary incentives are one of the main reasons political economy problems are aggravated. Automatic eligibility for incentives based on law and clear criteria allows investors to know well in advance their eligibility for any incentive and reduces opportunities for corruption.
• Costs should be clear. Improving transparency about the cost of incentives goes a long way in pushing government toward sound incentive policy. Because the revenue costs of incentives are not obvious, governments tend to face limited scrutiny when granting them, unlike when making direct expenditures. Just as with the expenditure budget, it is best practice to budget the amount of revenue forgone and reveal it to the public. This approach requires that the ministry of finance project the likely amount of tax revenue to be forgone through tax expenditures in its budget projections. Doing so increases public discussion on the costs and benefits of incentives. Recent tax expenditure calculations for Rwanda and Sierra Leone have made both governments take notice after having revealed that more than a third of revenues were given up as incentives.
• Action should be coordinated among neighboring countries. Avoidance of tax competition is a useful goal at the regional level because it improves outcomes for all the governments involved.
10. Options for Incentive Policy
This section provides policymakers with advice on an optimal approach to providing incentives, including policy, administration, and needed reforms.
Best policy option for tax incentives
A good tax system ensures predictable revenue for government, is stable, and minimizes distortions in investment decisions. There is broad consensus that a reasonable, uniform tax rate on a broad base of taxpayers is sound policy. Paradoxically, that approach rules out all tax incentives. However, some experts have argued that governments should have less neutral policies because not all investments are the same and some incentives may be needed.41 Silvani and Baer (1997) note that in many developing countries a tax system with few taxes, a limited number of rates for each tax, limited exemptions, and a broad base has proven much easier to administer and resulted in higher compliance than a complex tax system. Wallschutzky (1989) suggests that an ideal tax system should keep tax laws as simple as possible, aim for a global tax with few exemptions, credits, rebates, or deductions, not try to achieve too many social and economic goals, and be continually monitored.
41 Ibid footnote 11. Page 85-86.
40
Having few exemptions limits the need to verify case-by-case compliance with the conditions under which exemptions are granted. Tax administration costs increase and tax administration becomes complex if the tax system is used to achieve nonrevenue goals. In addition to creating a narrower base, reducing equity, and imposing price distortions, differential treatment greatly increases information requirements for the tax administration, provides opportunities for misreporting, and complicates tax compliance requirements. Tax concessions for nonrevenue objectives should be used very selectively and only after comparing their effectiveness with alternative expenditure, subsidy, or regulatory instruments that can potentially achieve the same goals. Broad tax bases can be justified by the indirect savings due to reduced opportunities for noncompliance.42 Allowing little exclusion from the tax base makes reduces the scope for tax evasion whereby the tax evader incorrectly claims tax exemptions. Furthermore, for a given revenue requirement, tax rates can usually be lower than with a narrow base. Figure 5 provides basic guidance for policymakers seeking to move toward the best approach for tax incentives. Most countries fit somewhere in the middle in administering these incentives, so more detailed guidance about reforms is given below.
Reform Path for Tax Incentives Reform
Provide immediate relief to investors
In the short term and for various reasons—including political—governments face pressure to act quickly to show that they a working to increase investment and generate jobs. Reform policies can give immediate relief to investors without providing overly generous tax incentives. Such policies include:
• Setting time limits on incentives, sending a signal to potential investors that there is a limited window for benefits.
• Fostering investment in plants and machinery by reducing the cost of capital. Although this effort has a revenue cost, it goes a long way in encouraging investment.
• Making incentives available automatically, signaling to investors that government is making the investment process friendlier.
• Publicly announcing investors who benefit from incentives—helping to increase transparency and providing political backup.
• Pursuing a time-bound plan to reduce barriers to investment.
42 FIAS. 2009. Handbook of Tax Simplification, (ed. Sebastian S. James). Chapter 5. World Bank Group.

41
Move away from tax holidays
Tax holidays partly or completely exempt income from taxation for a specified number of years. This is a popular but ineffective incentive because:
● Tax holidays are a blanket benefit unrelated to the amount of capital invested or its growth during the holiday. An alternative is to set minimum capital investment investment growth requirements to receive a tax holiday.
● Firms have an incentive to close and sell their businesses at the end of the tax holiday—only to reopen as a “new” investment, thus gaining an indefinite tax holiday.
● If FDI operates under double taxation agreements, tax holidays simply transfer tax revenues from the country receiving the investments to the investing home country.
● Tax holidays enable firms to funnel profits, using transfer pricing, from an existing profitable company through the “tax holiday” company and so avoid paying taxes on either.
Tax Policy
Generous Tax Holidays
Partial Tax Holidays
Investment linked Tax Incentives (Investment Credits, Investment
Allowances, etc)
Only indirect tax incentives for capital inputs
Tax Incentives only for Anchor Investments
Uniform low tax rate over a broad base
Tax Administration
Discretionary/Non-Transparent Tax Incentives
Tax Incentives in Individual Agreements
Improve Transparency (Publish list of investors benefiting from
incentives)
Tax Incentives in Tax Laws
Tax Incentives are available without additional permission
No Tax Incentives
Figure 8: Reform Path for Tax Policy and Administration

42
● Most capital-intensive investments do not yield a profit until several years after operations start. Thus tax holidays for a “start up” period of five years are ineffective. Indeed, tax liabilities often kick in just about when a business starts to make a profit.
Thus tax holidays are a very blunt investment incentive. Other incentives could provide benefits to taxpayers while encouraging investment. Such incentives, known as investment-linked or performance-based incentives, include:
• Investment tax credit—deducting a fixed percentage of an investment from tax liability. Rules differ about credits in excess of tax liability and include the possibility that they will be lost, carried forward, or refunded.
• Investment allowance—deducting a fixed percentage of an investment from taxable profit (in addition to depreciation). The value of the allowance is the product of the allowance and the tax rate. So, unlike a tax credit, its value will vary across firms unless there is a single tax rate. Moreover, the value is affected by changes to the tax rate, with a tax cut reducing it.
• Accelerated depreciation—allowing depreciation at a faster schedule than is available for the rest of the economy. This can be done in many ways, including through higher first-year depreciation allowances or increased depreciation rates. In nominal terms tax payments are unaffected, but their net present value falls and the liquidity of firms increases.
The tax benefits of tax holidays could be converted to an equivalent investment-linked incentive or a flat corporate tax rate. Mintz and Tsiopoulos (1992) provide examples of moving from a tax holiday regime to one with a low flat tax rate. By properly calibrating the rates, such a conversion protects incentives for investors while eliminating the disadvantages of tax holidays. Moving from one incentive structure to another while reducing the tax burden has implications for revenue. Bolnick (2004) uses the ratio of the revenue loss to the METR gain to compare the cost-effectiveness of different incentives. As Table 6 shows, an investment tax credit provides the most (incentive) bang for the (revenue) buck. Though lowering tax rates provides a strong incentive for investment, making them too low is quite costly for revenue. As a result, any reform path that moves a country toward the best option should balance the competing objectives of attracting investment and protecting the revenue base. It should be noted that Table 6 does not reflect the additional investment that may occur when tax rates are lowered. But if the redundancy ratios are anywhere near those in Table 3, the revenue gain from investments that respond to incentives will likely be outweighed by the loss from investments that would have come in anyway.

43
Table 9: Cost-effectiveness of Various Tax Incentives43
Reform administration of tax incentives
Several bad practices involving the administration of tax incentives should be avoided. Some countries award incentives on a case-to-case basis or give investment certificates to “approved” investors that allow them to claim incentives. Moreover, these actions are hidden from the public. Such discretionary, nontransparent practices are prone to abuse and may not lead to the desired outcomes for government. Some countries also provide special investment incentives by executive decree. Even when such decrees are given by the highest authority, such as the president, this approach lacks proper checks and balances.
Even when tax incentives are awarded based on the law, there is a danger that incentives will proliferate if they are provided by sector ministries. Because these ministries are not responsible for collecting taxes, they do not bear the costs of the incentives they award. The
43
Bolnick (2004).

44
best approach is to grant incentives according to tax laws that offer as little discretion as possible.
Finally, when Incentives are provided it is essential that:
• They be based on rules and not be open-ended (with strict time limits).
• Benefiting investors file tax returns and face audits.
• Governments produce tax expenditure statements so that the cost of incentives is transparent.
• Incentives be reviewed occasionally for their efficacy.
Policy for anchor investments
The model outlined in section 2 is useful for policymakers analyzing whether directing incentives toward certain investments has a positive net impact on the economy. This tool can also be used to analyze the cost-effectiveness of incentives for anchor investments. Anchor investments are large enough to have significant backward linkages for the local economy, and are often made by highly reputable firms that jumpstart investment in several areas. Accordingly, governments often woo such investors with incentive packages. First, however, some basic questions should be answered:
• Will the investment generate additional tax revenue?
• Does the anchor investment provide positive externalities (such as signaling future investors and creating linkages to the economy)?
• Would the investment come in anyway? Does the country have any special advantages that are important to the investor?
• Would the investment incentive put existing investments at a disadvantage? Does it cause a leakage in tax revenue? Does it undermine the investment environment by encouraging other investors to ask for similar incentives ?
The most important question is whether the investment will generate the promised positive externalities. Around the world, several large investments have had limited direct impacts on local economies.44
Tailor incentives to country conditions
Table 7 summarizes desirable short- and long-term incentive policies for countries facing a variety of conditions.
44 MOZAL, a $2.2 billion aluminum smelter in Mozambique, is a classic example. Despite its massive size, there have been complaints about low job creation and limited backward linkages to the local economy. Moreover, the project benefited from generous tax incentives and contributes little tax revenue (see http://www.irinnews.org/Report.aspx?ReportId=75790). Still, MOZAL helped signal that Mozambique is a good place to do business, and has been followed by several other large investments.

45
Table 10: Incentive Policies under Various Country Scenarios
Country Scenario Short term policy Long term policy
Countries with very
weak investment
climate
Investment incentives are ineffective and therefore lead to waste of tax revenues. Tax revenues instead should be used to create public goods. Reforms should also be introduced to rationalize the tax system, the tax instruments, and the rates as well the tax administration.
Country should work to reduce barriers to investment and focus on simplifying investment process widely.
Countries facing tax
competition
Incentives may be used to ensure that the country is not at a disadvantage to its neighbors.45
Such countries should work on regional pacts to stop harmful tax competition. Countries should also work on marketing the more substantive differentiations eg. labor, skills, infrastructure, etc or develop a unique selling proposition.
Countries planning
to diversify their
economy
Countries may use incentives that are linked to investment growth (investment allowance, accelerated depreciation, etc.) but only for a limited period based on clear prioritization of sectors in line with FDI competitiveness
Broader industrial policy strategies have to be followed, including a focus on sector targeting and promotion for investment
Countries possessing
unique advantages
(natural beauty,
natural resources)
General Investment incentives to attract investments that exploit such advantages wastes revenue, unless they kick start investment
Barriers should be lowered for investments designed to exploit the natural resource, access to land, good quality infrastructure, and so on.
Gauging the cost-effectiveness of investment incentive policies
A popular metric for measuring the cost-effectiveness of investment incentive policies is to calculate the dollar cost of the jobs they create, based on total tax expenditure. Though not
45 While such a strategy was effective in the case of Antigua, it is possible that it took investment away from its neighbors through tax competition. As a result, while Antigua gained, it is likely that this was at the cost of its neighbors. Further in the long term, it erodes the tax base creating the need to tax other sources such as labor and consumption.

46
an entirely accurate measure, this approach provides a ballpark figure that can help policymakers decide if the incentive was worthwhile. For example, a 2008 Investment climate advisory study found that the Yemeni government spent about $6,000 each year for 8,000 jobs that investment incentives helped create—more than six times the country’s per capita income. In Thailand a 1999 FIAS study found that investment incentives each year cost the government about 16 times the average annual wage of an industrial worker.
11. Conclusion
Whatever incentives a government decides to offer and however it structures them, every effort should be made to ensure that incentives are:
● Affordable—forgone income should not severely undermine government revenue streams.
● Targeted—targets for incentives should be based on research to confirm that they will benefit the country in ways that would not have been possible if there were no incentives, thereby reducing revenue costs.
● Simple—incentive administration should permit easy accessibility and determination of eligibility.
● Reviewed periodically—investment incentives should be regularly reviewed to determine their relevance and economic benefit relative to their budgetary and other costs, including long-term impacts on resource allocation.
Providing incentives can create risks that might have implications for the investment climate and overall fiscal compliance. It also encourages lobbying and rent seeking. Increasing transparency on the costs and benefits of tax incentives would, in the long run, help frame future policy. Providing a level playing field to all businesses through a broadly based, low, uniform tax rate has been the best investment incentive in many countries.
47
Appendix-1. A Simple Model of Incentives
Government utility sets the tax rate (T) to maximize its utility given by
U =R(T) + S(K) – C(T-T�,I) (1)
Where R(T) : This is the Revenue accruing to government is assumed to be a tax on capital given by the expression R(T) = T × K. However, in the case of a the tax favored sector taxed
at a lower rate T�, the capital base could be disaggregated into K1 + K2(T,T�) + K3(T), where
K1 is the capital that would be invested in the tax favored sector anyway, K2(T,T�) is that capital in the tax favored sector that responds to tax incentive and, K3(T), is the capital investment into the regular sector;
S(K(T)): This is the social benefit arising from investment in the tax favored sector which is an increasing function of invested capital K(T), which itself is a function of the tax rate. The social benefit may be defined as the benefit that goes beyond the investment (e.g. positive externalities, or investments that have public good characteristics such as infrastructure), and;
C(T-T�,I): This is the indirect cost of incentives. A special benefit to certain sectors imposes an additional cost on the economy (including distortions and administrative costs). This cost
increases with the tax differential between the regular and tax favored sector (T-T�) due to economic distortions (Hassett and Hubbard 2002) and increased evasion (James 2007). The cost also decreases with the investment climate (I) or strength of the institutions. For example, if the tax administration is efficient, there is less leakage due to misuse of the incentives thereby less costs46.
Additional explanation of the terms:
R(T), the revenue accruing to government, is assumed to be a tax on capital given by the
expression R(T) = T × K. But in the case of a the tax-favored sector taxed at a lower rate T�,
the capital base could be disaggregated into K1 + K2(T,T�) + K3(T), where K1 is the capital
that would be invested in the tax-favored sector anyway, K2(T,T�) is the capital in the tax-favored sector that responds to the tax incentive, and, K3(T) is the capital investment in the regular sector. Hence, by definition K2(T,T) = 0. That is, when there is no tax-preferred status, this part of the capital is zero.
K2(T,T) = 0 (2)
Hence,
46 See James(2007), Tax Policy, Tax Compliance and Optimal Tax bases, Phd. Thesis. Harvard University.
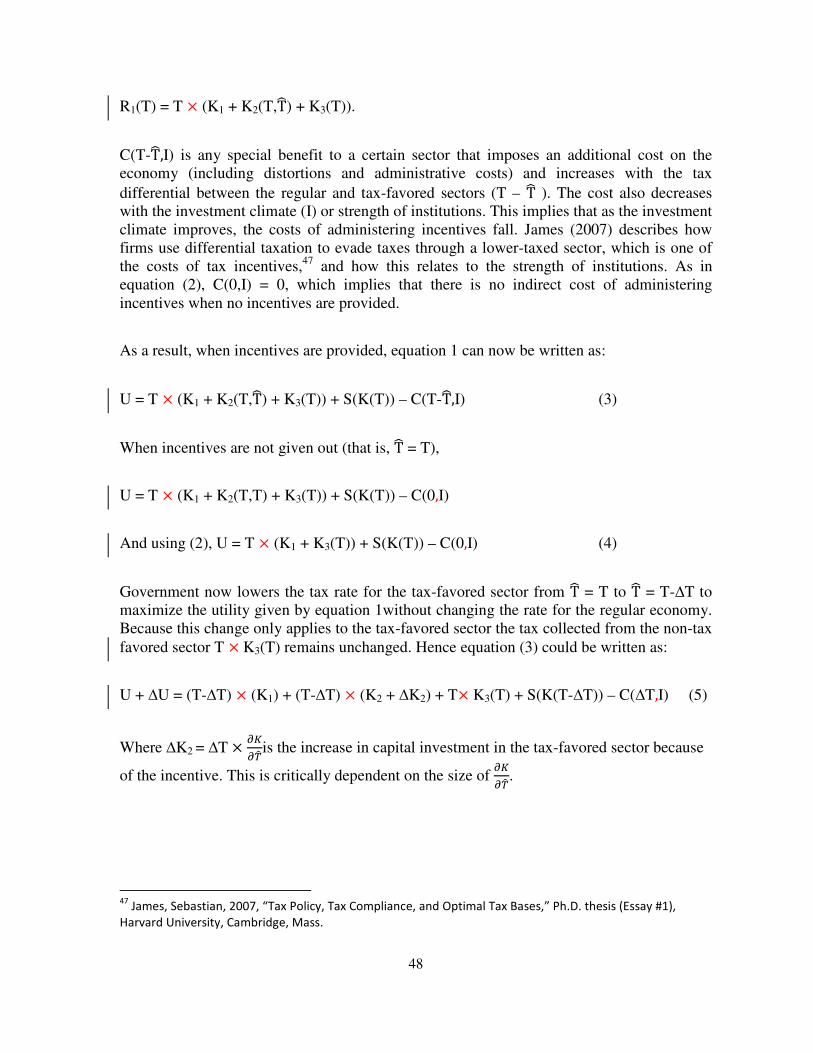
48
R1(T) = T × (K1 + K2(T,T�) + K3(T)).
C(T-T�,I) is any special benefit to a certain sector that imposes an additional cost on the economy (including distortions and administrative costs) and increases with the tax
differential between the regular and tax-favored sectors (T – T� ). The cost also decreases with the investment climate (I) or strength of institutions. This implies that as the investment climate improves, the costs of administering incentives fall. James (2007) describes how firms use differential taxation to evade taxes through a lower-taxed sector, which is one of the costs of tax incentives,47 and how this relates to the strength of institutions. As in equation (2), C(0,I) = 0, which implies that there is no indirect cost of administering incentives when no incentives are provided.
As a result, when incentives are provided, equation 1 can now be written as:
U = T × (K1 + K2(T,T�) + K3(T)) + S(K(T)) – C(T-T�,I) (3)
When incentives are not given out (that is, T� = T),
U = T × (K1 + K2(T,T) + K3(T)) + S(K(T)) – C(0,I)
And using (2), U = T × (K1 + K3(T)) + S(K(T)) – C(0,I) (4)
Government now lowers the tax rate for the tax-favored sector from T� = T to T� = T-∆T to maximize the utility given by equation 1without changing the rate for the regular economy. Because this change only applies to the tax-favored sector the tax collected from the non-tax favored sector T ×K3(T) remains unchanged. Hence equation (3) could be written as:
U + ∆U = (T-∆T) × (K1) + (T-∆T) × (K2 + ∆K2) + T× K3(T) + S(K(T-∆T)) – C(∆T,I) (5)
Where ∆K2 = ∆T× ��
���is the increase in capital investment in the tax-favored sector because
of the incentive. This is critically dependent on the size of ��
���.
47
James, Sebastian, 2007, “Tax Policy, Tax Compliance, and Optimal Tax Bases,” Ph.D. thesis (Essay #1),
Harvard University, Cambridge, Mass.
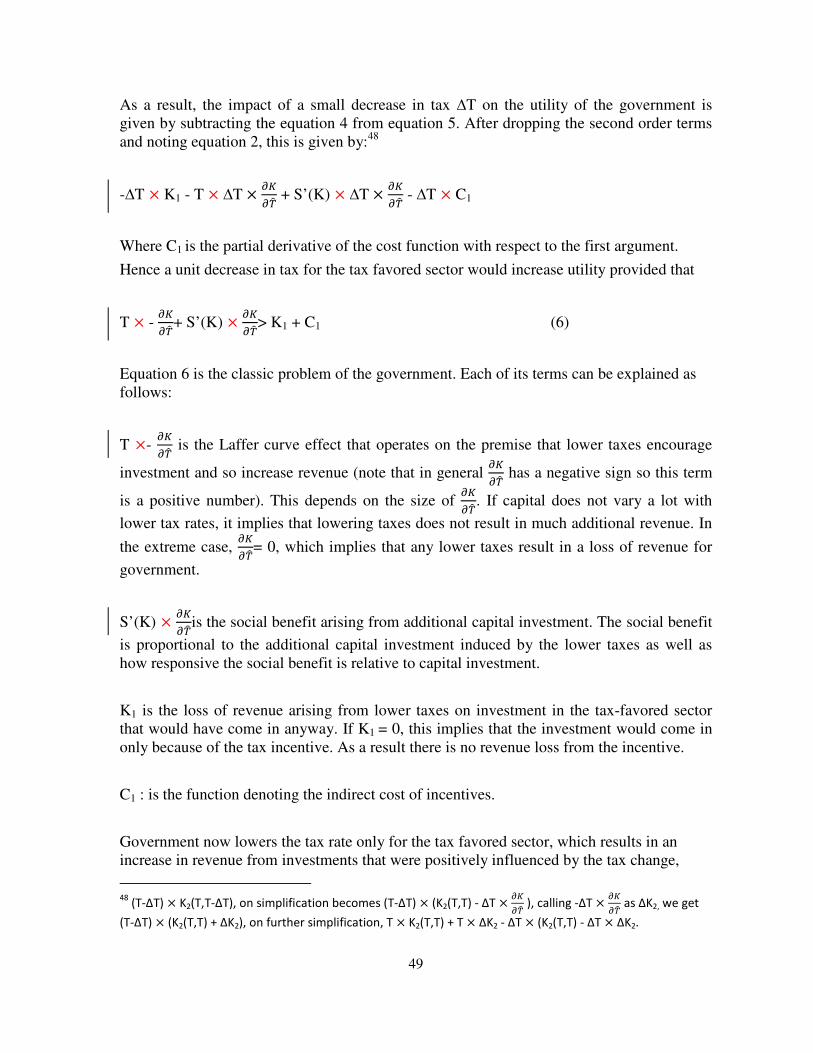
49
As a result, the impact of a small decrease in tax ∆T on the utility of the government is given by subtracting the equation 4 from equation 5. After dropping the second order terms and noting equation 2, this is given by:48
-∆T × K1 - T × ∆T× ��
��� + S’(K) × ∆T×
��
��� - ∆T × C1
Where C1 is the partial derivative of the cost function with respect to the first argument.
Hence a unit decrease in tax for the tax favored sector would increase utility provided that
T × - ��
���+ S’(K) ×
��
���> K1 + C1 (6)
Equation 6 is the classic problem of the government. Each of its terms can be explained as follows:
T ×- ��
��� is the Laffer curve effect that operates on the premise that lower taxes encourage
investment and so increase revenue (note that in general ��
��� has a negative sign so this term
is a positive number). This depends on the size of ��
���. If capital does not vary a lot with
lower tax rates, it implies that lowering taxes does not result in much additional revenue. In
the extreme case, ��
���= 0, which implies that any lower taxes result in a loss of revenue for
government.
S’(K) × ��
���is the social benefit arising from additional capital investment. The social benefit
is proportional to the additional capital investment induced by the lower taxes as well as how responsive the social benefit is relative to capital investment.
K1 is the loss of revenue arising from lower taxes on investment in the tax-favored sector that would have come in anyway. If K1 = 0, this implies that the investment would come in only because of the tax incentive. As a result there is no revenue loss from the incentive.
C1 : is the function denoting the indirect cost of incentives.
Government now lowers the tax rate only for the tax favored sector, which results in an increase in revenue from investments that were positively influenced by the tax change,
48
(T-∆T) × K2(T,T-∆T), on simplification becomes (T-∆T) × (K2(T,T) - ∆T× ��
���), calling -∆T×
��
��� as ∆K2, we get
(T-∆T) × (K2(T,T) + ∆K2), on further simplification, T × K2(T,T) + T × ∆K2 - ∆T × (K2(T,T) - ∆T × ∆K2.

50
social benefits from this increased investment, revenue loss from investments that would have come in anyway, and indirect costs of the incentives.
In summary, an incentive policy is successful if:
Policy implications
Expression Explanation Policy implication
��
��� is small Investment is not responding to
incentives Limited economic benefit of incentives
S’(K) is high Investment provides high social benefits
Incentives in these sectors are good for the economy
K1 is high A lot of Investment would have come despite the incentives
Revenue loss for government
C1 is high Incentives have high indirect costs Reduces the economic benefits of Incentives due to administrative and leakage costs
As a result, lowering taxes for a tax-preferred sector decreases revenue and imposes indirect costs on the economy. But it also increases capital investment that in turn increases revenue from the sector and generates social benefits.
As a result an incentive policy is successful if the decrease in revenue (and additional costs) is more than made up for by the increased investment and social benefits that the additional investment provides.
If ��
���is zero or very small, equation (6) is unlikely to be satisfied. Hence any tax decrease to
a tax-favored sector is a net loss to the welfare of the economy.
Revenue rises due to increased investment
Social benefit s increase due to increased investment
Indirect cost of incentives
Revenue losses on investments that would have come in anyway
> + +

51
If ��
��� is not zero, it remains to be seen if equation (6) is positive. It may be possible that for
various reasons ��
��� is so small and the indirect cost C(I) is so large that incentives are a net
loss to the economy.
As a result the success of any tax incentive policy hinges on the dependence of investment on tax rates, which depends on the conditions favorable to investment, the social benefits that any additional investment generates, and the indirect costs of the incentive policy.
For an incentive policy to be successful, three factors must be satisfied:
● Investment is highly dependent on tax rates, with lower taxes resulting in significant additional investment.
● Investment generates many social benefits. ● The incentive policy has low indirect costs.
Adjusting the model for Investment climate
As discussed, the crucial factor for effective incentives is the dependence of capital
investment on the tax rate, or the magnitude of ��
���. Based on econometric evidence, capital
investment and its elasticity relative to tax rates depend on the investment climate.
This implies that when an investment climate improves, capital could be used more efficiently. As a result more is invested. Second, is more effective when the investment
climate is more conducive. This implies that ��
��� can be written as
��
���= -F(I), and F(0)=0,
F(I) ≥0, and F’(I) > 0, so that as the tax rate decreases, capital investment decreases, but that increase depends on the strength of the investment climate. When the investment climate is bad (I = 0), no amount of tax change affects the investment level.

52
Appendix-2: Types of Tax Incentives
Definitions of Typical Tax Incentives49
Tax holidays: Temporary exemption of a new firm or investment from certain specified taxes, typically at least corporate income tax. Sometimes administrative requirements are also waived, notably the need to file tax returns. Partial tax holidays offer reduced obligations rather than full exemption. Special zones: Geographically limited areas in which qualified firms can locate and thus benefit from exemption of varying scope of taxes and/or administrative requirements. Zones are often aimed at exporters and located close to a port. In some countries, however, qualifying companies can be declared “zones” irrespective of their location.
Investment tax credit: Deduction of a certain fraction of an investment from the tax liability. Rules differ regarding excess credits (credits in excess of tax liability) and include the possibility that they may be lost, carried forward or refunded.
Investment allowance: Deduction of a certain fraction of an investment from taxable profits (in addition to depreciation). The value of an allowance is the product of the allowance and the tax rate. Unlike a tax credit, its value will thus vary across firms unless there is a single tax rate. Moreover, the value is affected by changes to the tax rate, with a tax cut reducing it.
Accelerated depreciation: Depreciation at a faster schedule than available for the rest of the economy. This can be implemented in many different ways, including a higher first year depreciation allowances, or increased depreciation rates. Tax payments in nominal terms are unaffected, but their net present value is reduced and the liquidity of firms is improved.
Reduced tax rates: Reduction in a tax rate, typically the corporate income tax rate. Exemptions from various taxes: Exemption from certain taxes, often those collected at the border such as tariffs, excises and VAT on imported inputs. Financing incentives: Reductions in tax rates applying to providers of funds, e.g., reduced withholding taxes on dividends.
49 Source: Klemm, Alexander, 2009, “Causes, Benefits, and Risks of Business Tax Incentives,” International
Monetary Fund, Washington, D.C.
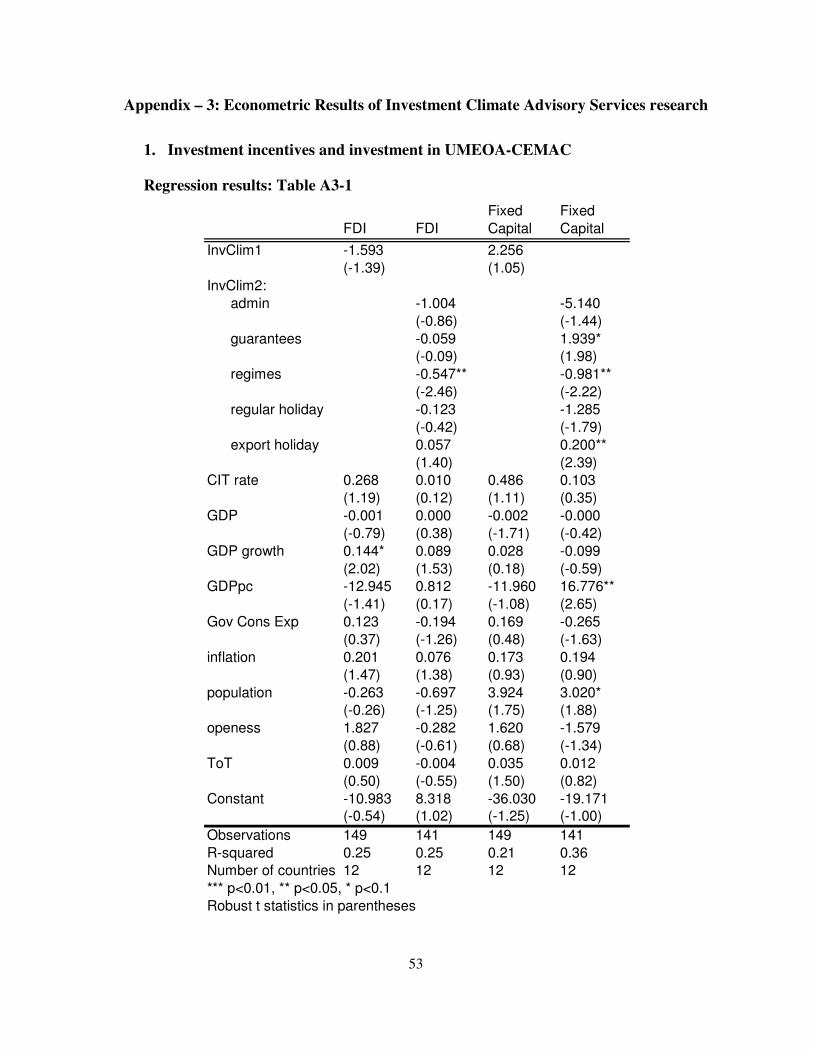
53
Appendix – 3: Econometric Results of Investment Climate Advisory Services research
1. Investment incentives and investment in UMEOA-CEMAC
Regression results: Table A3-1
FDI FDI
Fixed
Capital
Fixed
Capital
InvClim1 -1.593 2.256
(-1.39) (1.05)
InvClim2:
admin -1.004 -5.140
(-0.86) (-1.44)
guarantees -0.059 1.939*
(-0.09) (1.98)
regimes -0.547** -0.981**
(-2.46) (-2.22)
regular holiday -0.123 -1.285
(-0.42) (-1.79)
export holiday 0.057 0.200**
(1.40) (2.39)
CIT rate 0.268 0.010 0.486 0.103
(1.19) (0.12) (1.11) (0.35)
GDP -0.001 0.000 -0.002 -0.000
(-0.79) (0.38) (-1.71) (-0.42)
GDP growth 0.144* 0.089 0.028 -0.099
(2.02) (1.53) (0.18) (-0.59)
GDPpc -12.945 0.812 -11.960 16.776**
(-1.41) (0.17) (-1.08) (2.65)
Gov Cons Exp 0.123 -0.194 0.169 -0.265
(0.37) (-1.26) (0.48) (-1.63)
inflation 0.201 0.076 0.173 0.194
(1.47) (1.38) (0.93) (0.90)
population -0.263 -0.697 3.924 3.020*
(-0.26) (-1.25) (1.75) (1.88)
openess 1.827 -0.282 1.620 -1.579
(0.88) (-0.61) (0.68) (-1.34)
ToT 0.009 -0.004 0.035 0.012
(0.50) (-0.55) (1.50) (0.82)
Constant -10.983 8.318 -36.030 -19.171
(-0.54) (1.02) (-1.25) (-1.00)
Observations 149 141 149 141
R-squared 0.25 0.25 0.21 0.36
Number of countries 12 12 12 12
*** p<0.01, ** p<0.05, * p<0.1
Robust t statistics in parentheses

54
2. Effectiveness of Investment incentives for tourism in the Caribbean
Regression results: Table A3-2
(1) (2) (3) (4) (5) (6)
excl Grenada
excl Dominica
and Anguilla
Antigua2003 3.147*** 2.939*** 2.973*** 3.028*** 3.002*** 3.122***
(4.98) (4.72) (4.76) (4.80) (4.48) (4.22)
CricketWC2007 1.248** 1.263** 1.171*
(2.08) (2.09) (1.90)
Ivan2004 0.877 0.962
(0.85) (0.92)
Grenada2006 0.854
(0.81)
Constant 0.685* 0.685* 0.685* 0.685* 0.766* 0.855*
(1.94) (2.00) (1.99) (1.99) (1.96) (1.81)
Observations 77 77 77 77 66 55
R-squared 0.56 0.59 0.59 0.60 0.59 0.61
Number of countries 7 7 7 7 6 5
*** p<0.01, ** p<0.05, * p<0.1
t statistics in parentheses
all countries
Dependent variable: Tourism FDI

DRAFT
55
3. Investment Incentives and the Investment Climate
Figure A3-1. Dependence on the Fiscal Policy on Investment Climate
Investment Climate measured by Doing Business Indicators
AUS
AUT
BEL
BGR
CAN
CZEDNKFIN
FRA
GEO
HKG HUN
ISL
IRL
ITA
JAM
JPN
KAZLVA
MDG
MUSMAR
NLD
NZLNOR
PRT
ROMRUS
SGP
SVK
ZAF SWE
CHE
THATUR
EGYGBR
USAUZB
ZMB
ARGBGDBOL
BWA
BRA
TCDCHL
CHN
CRI
HRV
ECUETH
FJI
DEU
GHA
GRCINDIDN
IRN
JOR
KEN
KOR
LSO
MYS
MEXNGA PAK
PERPOL
RWA
SRB
SLE
VNM
ESPTUNUGA
UKR
TZA
010
20
30
FD
I as %
of G
DP
-20 0 20 40 60METR
High IC countries Low IC Countries
Trend High IC countries Trend Low IC Countries
Fiscal Policy Effectiveness and the Investment Climate
AUT
BGD
BEL
CAN TCDCHL
DNK
ETH
FJI
FINFRA
GEO
DEUGRC
HKG
ISL
IRL
ITA
JAM
JPN
JOR
KEN
KOR
MDG
MUS
MEXNZLNOR
PAKRWA
SGP
SVK
VNM
ZAF
ESPSWE
CHE
THAUGA
USA ARG
AUS
BOL
BWA
BRA
BGR
CHN
CRI
HRV
CZE
ECU
GHA
HUN
INDIDNIRN
KAZLSOLVA
MYSMAR
NLD
NGAPERPOL
PRT
ROMRUS
SRB
SLETUN
TUR
UKR
EGYGBR
TZA
UZB
ZMB
010
20
30
FD
I as %
of G
DP
-20 0 20 40 60METR
High IC countries Low IC Countries
Trend High IC countries Trend Low IC Countries
Fiscal Policy Effectiveness and the Investment Climate
AUS
AUT
BEL
BWA
BGR
CANCHL
CHN
CRI
CZEDNK
ETH
FJI
GEO
HKG HUN
ISL
IND
IRL
ITA
JAM
JPN
KAZ
JOR
KEN
LSO
MYSMUS
NZLNGA
SGP
SVK
VNM
CHE
THAUGA
GBR
USAUZBARG
BGDBOLBRA
TCDHRV
ECU
FINFRA
DEU
GHA
GRCIDNIRN KOR
LVA
MDG
MEXMAR
NLD
NOR
PAKPERPOL
PRT
ROMRUS
RWA
SRB
SLE
ZAF
ESPSWE
TUNTUR
UKR
EGY
TZA
ZMB
010
20
30
FD
I as %
of G
DP
-20 0 20 40 60METR
High IC countries Low IC Countries
Trend High IC countries Trend Low IC Countries
Fiscal Policy Effectiveness and the Investment Climate
AUS
BGD
BEL
BWA
BGR
CANCHL
DNK
FJI
FIN
GEO
GHA
HKG
IND
IRL
ITAJPN
KAZLVA
MDG
MYSMUS
MEXNZLNGA
NOR
PAKPERPOL
PRT
ROM SLE
SGP
ZAF SWETHATUR
GBR
USA ARG
AUT
BOLBRA
TCD
CHN
CRI
HRV
CZE
ECUETH
FRA
DEUGRC
HUN
ISL
IDNIRN
JAM
JOR
KEN
KOR
LSO
MAR
NLD
RUS
RWA
SRB
SVK
VNM
ESP
CHE
TUNUGA
UKR
EGY
TZA
UZB
ZMB
010
20
30
FD
I as %
of G
DP
-20 0 20 40 60METR
High IC countries Low IC Countries
Trend High IC countries Trend Low IC Countries
Fiscal Policy Effectiveness and the Investment Climate
ARG
AUS
AUT
BEL
BWA
BRA
BGR
CANCHL
CHN
CRI
CZE
ECU
FJIFRA
DEU
HKG
ISL
IRL
ITAJPNKOR
MYS
MEX
NLD
NZLNOR
PERPOL
PRT
ROM
SRB
SGP
SVK
ZAF
ESPSWE
GBR
USABGDBOL
TCDHRV
DNK
ETH
FIN
GEO
GHA
GRC
HUN
INDIDNIRN
JAM
KAZ
JOR
KEN
LSOLVA
MDG
MUSMARNGA PAK RUS
RWA
SLE
VNM
CHE
THATUN
TURUGA
UKR
EGY
TZA
UZB
ZMB
010
20
30
FD
I as %
of G
DP
-20 0 20 40 60METR
High IC countries Low IC Countries
Trend High IC countries Trend Low IC Countries
Fiscal Policy Effectiveness and the Investment Climate
AUS
BGD
BEL
BWA
BGR
CANCHL
DNK
FJI
FIN
GEO
GHA
HKG
IND
IRL
ITAJPN
KAZLVA
MDG
MYSMUS
MEXNZLNGA
NOR
PAKPERPOL
PRT
ROM SLE
SGP
ZAF SWETHATUR
GBR
USA ARG
AUT
BOLBRA
TCD
CHN
CRI
HRV
CZE
ECU ETH
FRA
DEUGRC
HUN
ISL
IDNIRN
JAM
JOR
KEN
KOR
LSO
MAR
NLD
RUS
RWA
SRB
SVK
VNM
ESP
CHE
TUNUGA
UKR
EGY
TZA
UZB
ZMB
010
20
30
FD
I as %
of G
DP
-20 0 20 40 60METR
High IC countries Low IC Countries
Trend High IC countries Trend Low IC Countries
Fiscal Policy Effectiveness and the Investment Climate
AUS
AUT
BEL
BWA
CANCHLHRV
DNK
ETH
FINFRA
DEUGRC
HKG HUN
ISL
IRL
ITAJPN
KAZ
JOR
KOR
LVA
MYSMUS
NLD
NZLNOR
PER
PRT
SGP
ZAF
ESPSWE
CHE
THATUNTUR
GBR
USA ARGBGDBOL
BRA
BGR
TCD
CHN
CRI
CZE
ECU
FJI
GEO
GHA
INDIDNIRN
JAM
KEN
LSO
MDG
MEXMARNGA PAK
POLROMRUS
RWA
SRB
SLESVK
VNM
UGA
UKR
EGY
TZA
UZB
ZMB
010
20
30
FD
I as %
of G
DP
-20 0 20 40 60METR
High IC countries Low IC Countries
Trend High IC countries Trend Low IC Countries
Fiscal Policy Effectiveness and the Investment Climate
AUS
AUT
BEL
CANCHL
CHNCZE
DNKFIN
FRA
DEUGRC
HKG HUN
ISL
IDN
IRL
ITAJPNKOR
LVA
MYSMUS
NLD
NZLNOR
POL
PRT
ROM
SRB
SGP
ESPSWE
CHE
THATUN
EGYGBR
USA ARGBGDBOL
BWA
BRA
BGR
TCDCRI
HRV
ECU ETH
FJI
GEO
GHA
INDIRN
JAM
KAZ
JOR
KEN
LSO
MDG
MEXMARNGA PAK
PER RUS
RWA
SLESVK
VNM
ZAFTUR UGA
UKR
TZA
UZB
ZMB
010
20
30
FD
I as %
of G
DP
-20 0 20 40 60METR
High IC countries Low IC Countries
Trend High IC countries Trend Low IC Countries
Fiscal Policy Effectiveness and the Investment Climate
AUS
AUT
BEL
CHNDNK
FJI
FINFRA
GEO
DEU
GHA
HKG HUN
ISL
IRL
JPN
KAZ
KOR
LVA
MYS
NLD
NZLNOR
PRT
ROMRUS
RWA
SGP
SVK
VNM
ZAF SWE
CHE
THATUR
UKR GBR
TZA
USAUZBARG
BGDBOLBWA
BRA
BGR
CAN TCDCHLCRI
HRV
CZE
ECU ETHGRCINDIDN
IRNITA
JAM
JOR
KEN
LSO
MDG
MUS
MEXMARNGA PAK
PERPOL
SRB
SLEESPTUNUGA
EGY ZMB
010
20
30
FD
I as %
of G
DP
-20 0 20 40 60METR
High IC countries Low IC Countries
Trend High IC countries Trend Low IC Countries
Fiscal Policy Effectiveness and the Investment Climate
ARGBGD
BEL
BOLBRA
BGR
CAN TCD
CHNFINFRA
GEO
DEU
GHA
GRC
HUN
ISL
LSOLVA
MDG
MYSMUSMAR
NLD
NZLNGA
NOR
PAKPERROM
RUS
RWA
SGP
ZAF
CHE
TUNTUR
UZB
ZMB
AUS
AUT
BWA
CHLCRI
HRV
CZEDNK
ECU ETH
FJI
HKG
INDIDNIRN
IRL
ITA
JAM
JPN
KAZ
JOR
KEN
KOR
MEX
POL
PRT
SRB
SLESVK
VNM
ESPSWE
THAUGA
UKR
EGYGBR
TZA
USA
010
20
30
FD
I as %
of G
DP
-20 0 20 40 60METR
High IC countries Low IC Countries
Trend High IC countries Trend Low IC Countries
Fiscal Policy Effectiveness and the Investment ClimateFiscal Policy effectiveness on Investment when compared between high performing countries and poorly performing countries on the different Doing Business Investment climate indicators (in order - Starting a Business, Dealing with licenses, Employing workers, registering property, Getting credit, Protecting Investors, Paying Taxes, Trading across borders, enforcing contracts, closing a business).

DRAFT
56
Regression results: Table A3-3
(1) (2) (3) (4) (5) (6) (7) (8) (9) (10) (12)
VARIABLES
FDI as % of GDP
FDI as % of GDP
FDI as % of GDP
FDI as % of GDP
FDI as % of GDP
FDI as % of GDP
FDI as % of GDP
FDI as % of GDP
FDI as % of GDP
FDI as % of GDP
FDI as % of GDP
ic_start ic_lic ic_emwo ic_prop ic_gecr ic_prot
ic_tax_norate ic_trade ic_foco ic_clobu
ic_dbrank08
METR _ -0.078 -0.175** -0.142**
-0.184*** -0.043
-0.156** -0.174**
-0.138** -0.078
-0.203*** -0.397***
(-1.18) (-2.62) (-2.18) (-2.79) (-0.50) (-2.28) (-2.64) (-2.07) (-1.00) (-2.95) (-3.38)
IC 3.068*** -0.935 0.279 1.040 1.055 0.491 0.811 0.692* 1.992* 1.893 -0.089***
(3.54) (-1.02) (0.37) (1.51) (1.61) (0.75) (1.02) (1.98) (1.90) (0.95) (-2.74)
metr_IC
-0.087*** 0.018 0.008 -0.034
-0.055** -0.025 -0.027
-0.028** -0.077* 0.002 0.003**
(-3.04) (0.58) (0.24) (-1.00) (-2.10) (-0.77) (-0.94) (-2.25) (-1.95) (0.02) (2.55) L._GDPpc_cUSD -0.000 0.000 -0.000 -0.000 0.000 0.000 -0.000 -0.000 -0.000 -0.000 -0.000
(-1.07) (0.19) (-0.46) (-0.35) (0.06) (0.02) (-0.18) (-0.11) (-0.35) (-0.18) (-0.63)
L.openness2 0.420** 0.589*** 0.544**
0.541***
0.532*** 0.443* 0.527*** 0.466** 0.389* 0.528*** 0.402**
(2.32) (3.00) (2.43) (2.85) (2.81) (1.76) (2.70) (2.43) (1.83) (2.80) (2.11)
inflation -18.936 -22.304 -15.599 -12.674 -8.929 -16.985 -7.166 -5.540 -12.951 -20.853 -9.972
(-0.66) (-0.68) (-0.51) (-0.41) (-0.29) (-0.54) (-0.22) (-0.18) (-0.42) (-0.68) (-0.34) L._GDP_cbnUSD -0.000 -0.001 -0.001 -0.000 -0.000 -0.000 -0.001 -0.000 -0.000 -0.001 -0.000
(-0.90) (-1.55) (-1.65) (-1.07) (-1.00) (-0.66) (-1.22) (-0.82) (-0.74) (-1.26) (-0.49)
Constant 7.330***
10.121***
9.791***
10.144*** 7.060**
9.595*** 9.667***
8.575***
7.672***
10.731*** 16.340***

DRAFT
57
(3.06) (3.92) (4.01) (4.08) (2.55) (3.82) (3.88) (3.44) (2.89) (4.35) (4.86)
Observations 69 69 69 69 69 69 69 69 69 69 69
R-squared 0.41 0.31 0.33 0.31 0.34 0.29 0.30 0.34 0.33 0.33 0.37
*** p<0.01, ** p<0.05, * p<0.1
t statistics in parentheses


