Business and Management Horizons ISSN 2326-0297 2013, Vol. 1, No. 1 www.macrothink.org/bmh 113 Tax Payers’ Attitude and Compliance Behavior among Small Medium Enterprises (SMEs) in Botswana Nugi Nkwe Accounting and Finance, University of Botswana, Gaborone, Botswana E-mail: [email protected]Received: March 18, 2013 Accepted: March 29, 2013 Published: April 5, 2013 doi: 10.5296/ bmh.v1i1.3486 URL: http://dx.doi.org/10.5296/ bmh.v1i1.3486 Abstract In the framework of this study, an attempt to identify the level of taxpayers’ attitudes and tax compliance behaviour towards tax systems, to identify factors which influence taxpayers’ attitudes, to establish relationship between attitudes and tax compliance behaviour and to recommend ways that may contribute to development of enhanced taxpayers’ attitudes and compliance behaviour among Small Medium Enterprises in Botswana. This research was a survey whose data is collected from two hundred taxpayers in Small Medium Enterprises. After the data was collected, it was analyzed using descriptive statistics then summarized and presented using statistical tools. From the findings, the conclusionis that taxpayer’ attitudes do affect their compliance behaviour and recommendations weremade to try andhelp these SMEs. Keywords: taxpayers’ attitude, tax compliance, SMEs, Botswana
Transcript
Business and Management Horizons ISSN 2326-0297
2013, Vol. 1, No. 1
www.macrothink.org/bmh 113
Tax Payers’ Attitude and Compliance Behavior among
Small Medium Enterprises (SMEs) in Botswana
Nugi Nkwe
Accounting and Finance, University of Botswana, Gaborone, Botswana
In the framework of this study, an attempt to identify the level of taxpayers’ attitudes and tax compliance behaviour towards tax systems, to identify factors which influence taxpayers’ attitudes, to establish relationship between attitudes and tax compliance behaviour and to recommend ways that may contribute to development of enhanced taxpayers’ attitudes and compliance behaviour among Small Medium Enterprises in Botswana. This research was a survey whose data is collected from two hundred taxpayers in Small Medium Enterprises. After the data was collected, it was analyzed using descriptive statistics then summarized and presented using statistical tools. From the findings, the conclusionis that taxpayer’ attitudes do affect their compliance behaviour and recommendations weremade to try andhelp these SMEs.
Small Businesses are key players in the economy of developing countries such as Botswana, as they generate significant employment and output. The number of SMEs in Botswana can be estimated at 56 000, with over 125 000 employees (Government of Botswana, 1988a).The contribution of SMEs to GDP is estimated at 45 percent and 30 percent of income tax (Government of Botswana, 1988b).Due to the importance of this sector in the country’s economy, it is important that the strategies of tax administration that are implemented enhance the SME taxpayers’ attitude and compliance towards paying taxes. Botswana Unified Revenue Services (BURS) major purpose is assessment, collection, administration and enforcement of tax laws with professionalism governed by integrity and fairness. BURS administer different types of taxes under different Laws and Acts such as Income Tax, Value Added Tax, Customs Duties and Exercise Tax among others and hence, are supposed to ensure taxpayers comply with the respective tax laws.
However, the complex Botswana taxation systems and other myriad of Government compliance requirements have arguably placed this sector at a disadvantage. Amongst these government regulations are occupational health and safety, workers’ compensation, licensing requirements, local council planning, and so forth, but taxation is the most critical regulation in compliance (Coleman and Evans 2003).
In other developing countries, tax noncompliance is a serious challenge facing income tax administration and hindering tax revenue performance. Despite the various tax reforms undertaken by governments to increase tax revenue over the years, prior statistical evidence has proven that the contribution of income taxes to the government’s total revenue remained consistently low and is relatively shrinking (Alabede et al., 2011). However, from all the taxes, personal income tax has remained the most disappointing, inefficient, unproductive and problematic tax system (Asada, 2005; Kiabel&Nwokah, 2009; Nzotta, 2007; Odusola, 2006; Sani, 2005).
Taxpayers’ behavior towards tax system has evoked great attention among many Revenue Authorities in the world especially in developed countries. However, it is debatable on what has been done towards the study of taxpayers behavior towards tax system in developing countries as they concentrate more in studies which would increase their budgets “bottom-line” in terms of huge revenue collection and enforcement efforts at the expense of studies on taxpayers behavior which would make increase in this tax revenue to be realized and enforcement efforts work.
2. Literature Review
Defining small businesses is problematic because of their diversity. Thus various parties adopt different definitions based on the criteria appropriate for their purposes.
Definitions of SMEs and characteristics were based on fixed assets mainly before but this was not giving a clear definition, lately more items are used such as employment levels, annual turnover, annual balance sheet total and some countries still use the total assets in addition.
Business and Management Horizons ISSN 2326-0297
2013, Vol. 1, No. 1
www.macrothink.org/bmh 115
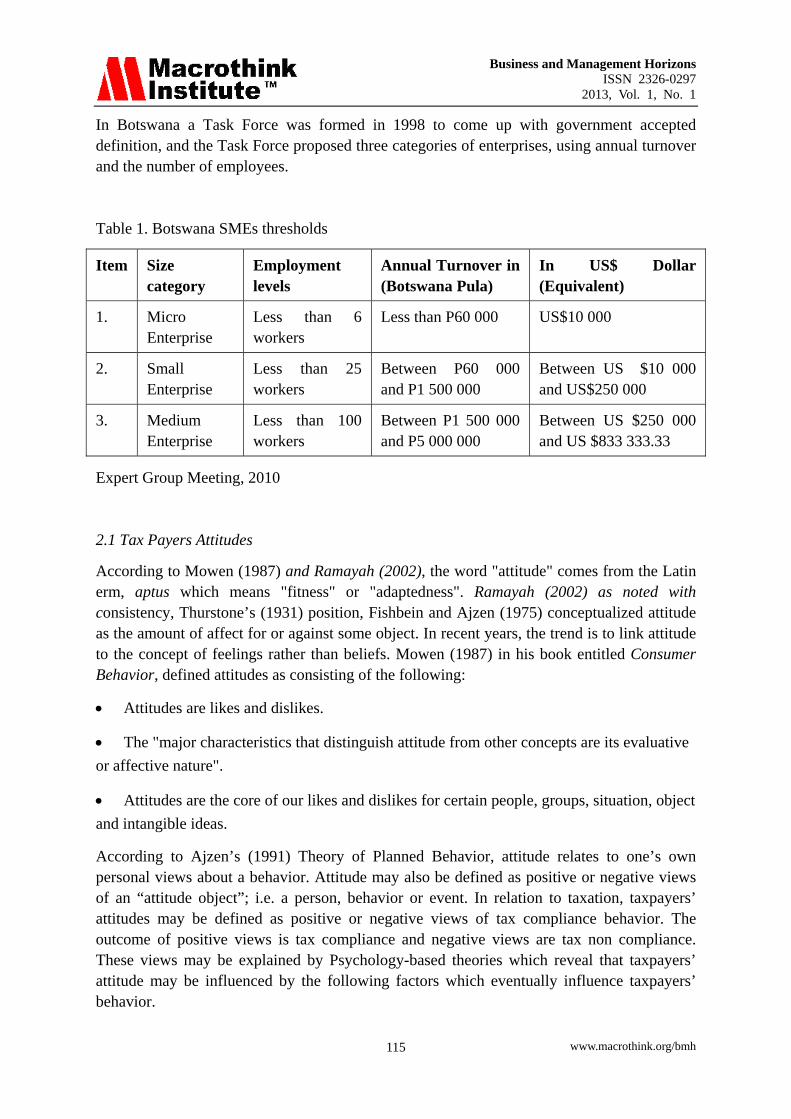
In Botswana a Task Force was formed in 1998 to come up with government accepted definition, and the Task Force proposed three categories of enterprises, using annual turnover and the number of employees.
Table 1. Botswana SMEs thresholds
Expert Group Meeting, 2010
2.1 Tax Payers Attitudes
According to Mowen (1987) and Ramayah (2002), the word "attitude" comes from the Latin erm, aptus which means "fitness" or "adaptedness". Ramayah (2002) as noted with consistency, Thurstone’s (1931) position, Fishbein and Ajzen (1975) conceptualized attitude as the amount of affect for or against some object. In recent years, the trend is to link attitude to the concept of feelings rather than beliefs. Mowen (1987) in his book entitled Consumer Behavior, defined attitudes as consisting of the following:
Attitudes are likes and dislikes.
The "major characteristics that distinguish attitude from other concepts are its evaluative
or affective nature".
Attitudes are the core of our likes and dislikes for certain people, groups, situation, object
and intangible ideas.
According to Ajzen’s (1991) Theory of Planned Behavior, attitude relates to one’s own personal views about a behavior. Attitude may also be defined as positive or negative views of an “attitude object”; i.e. a person, behavior or event. In relation to taxation, taxpayers’ attitudes may be defined as positive or negative views of tax compliance behavior. The outcome of positive views is tax compliance and negative views are tax non compliance. These views may be explained by Psychology-based theories which reveal that taxpayers’ attitude may be influenced by the following factors which eventually influence taxpayers’ behavior.
Item Size category
Employment levels
Annual Turnover in (Botswana Pula)
In US$ Dollar (Equivalent)
1. Micro Enterprise
Less than 6 workers
Less than P60 000 US$10 000
2. Small Enterprise
Less than 25 workers
Between P60 000 and P1 500 000
Between US $10 000 and US$250 000
3. Medium Enterprise
Less than 100 workers
Between P1 500 000 and P5 000 000
Between US $250 000 and US $833 333.33
Business and Management Horizons ISSN 2326-0297
2013, Vol. 1, No. 1
www.macrothink.org/bmh 116
Individual attitudes toward compliance have been shown to be a function of social and cultural norms (Elster, 1989; Naylor, 1989). If such attitudes would carry over to actual compliance, enhancing these norms, as through increasing overall trust in government, is a desirable policy instrument to complement the usual enforcement options. The attitude of taxpayers varies considerably. Some comply to the fullest extent required, irrespective of whether the IRS is actively auditing them or their industry. Other taxpayers essentially play the audit lottery and either do not prepare contemporaneous documentation or prepare the absolute minimum with the hope of avoiding the imposition of penalties (Turner, 2003).
An individual’s attitude towards tax system may predict (his tax compliance behaviour. Theoretically, Ajzen 1991), Fishbein and Ajzen (1975) and Oskamp (1991) have indicated that attitude is a partial indication of behaviour. Attitude towards an event, object, function or person may be favourable or unfavourable. According to Ajzen (1991) and Fishbein and Ajzen (1975), individual evaluates an event or object positively or negatively and positive and negative evaluation is the main dominant characteristic of an individual’s attitude.
2.2 Tax Compliance
Tax compliance can be described as the degree to which a taxpayer obliges to tax rules and regulations. James and Alley (2004) indicated that the meaning of tax compliance concept can be given from different perspectives but they define tax compliance as “…the willingness of individual and other taxable entities to act in accordance within the spirit as well as the letter of tax law and administration without the application of enforcement activity”.
Theoretical issues pertinent to tax compliance and tax compliance costs have been widely discussed in the literature. Research has identified numerous factors that affect taxpayers’ compliance (Richardson and Sawyer, 2001).
In explaining taxpayers’ compliance behaviour, that is, the reasons why taxpayers comply and do not comply, there are broadly two classes of theories – economic based theories, which emphasize incentives, and psychology-based theories which emphasize attitude (Trivedi&Shehata, 2005).
Economic, structural, demographic/personal and attitudinal traits have been identified as the key players in compliance. Theoretically, literature has provided evidence suggesting that tax compliance is influenced by numerous factors (Alm, 1999; Brook, 2001). Scholars identified these factors as economic, social and psychological factors (Alm, 1999; Brook, 2001; Devos, 2008; Fischer, 1993; Fischer, Wartick& Mark, 1992; Jackson &Millron, 1986; Kirchler, 2007). To tackle the challenge of tax noncompliance, it is necessary to understand factors influencing individual’s decision to comply with provision of tax laws. The early researchers based their work on economic perspective of tax compliance and they identified tax rate, penalty and detection probability as factors influencing taxpayers’ behavior (Allingham&Sandmo, 1972). The economic factors are based on the premise that tax evasion will respond to sanctions (Coleman and Evans, 2003).Additionally, Allingham and Sandmo (1972) assert that taxpayers behavior of non compliant depends on their belief of the probability of being detected through an audit and the severity of legal penalties imposed.
Business and Management Horizons ISSN 2326-0297
2013, Vol. 1, No. 1
www.macrothink.org/bmh 117
The structural factors, which are beyond the taxpayer’s control, are usually exogenously determined, for example, tax administration, tax complexity, tax rate structures and audit possibility (Alm, et al., 1992).
2.3 The Concept of Attitudes and Compliance
The payment of tax is obligatory duty of every citizen whether natural or corporate citizen. As a civic duty, it is expected that citizens will voluntarily comply with such obligation but that is not the case with some citizens. Studies have established relationship between attitudes of taxpayers and compliance. The study of Eriksen and Fallan (1996) revealed that taxpayer’s attitude towards tax system has influence on reinforced desire toward tax evasion and compliance. Chan et al. (2000) reported that Hong Kong taxpayers have less favorable attitude towards tax system as a result lower level of compliance. The study of Oriviska and Hudson (2002) examined the attitudes to tax evasion and reported that evasion is condoned by large number of people who are particularly benefiting from it. Eriksen and Fallan (1996) said that dimensions of attitude towards tax evasion include: attitude to one’s own tax evasion which is referred to as tax ethic, fairness of tax system, attitude to other people’s tax evasion and attitude to general crime (Alabede et al., 2011).
2.4 Compliance in Botswana
Compliance is the degree to which taxpayer comply with the tax law and administration, definition adopted from BURS.
Although firms have concerns in other areas such as corruption, taxation, and macroeconomic instability, Botswana often compares favorably with other SACU economies and high performing middle income economies in these areas as well. Botswana, however, is known for its favorable tax environment.
According to the last Budget Speech 2010/2011, Customs and Excise contributed P 7.750 billion. VAT recorded P4.377 billion which was an increase as a result of increased collections by BURS. Customs and Excise is third revenue source at 18.9%. For 2011/12, government expects P24.8 billion in taxes such as mineral royalties, customs and excise, non-mineral income tax and VAT. The figure is forecast to increase to P31.8 billion in the 2012/13 financial year, accounting for 74 percent of revenues.
BURS stated that Tax revenue laws assume voluntary compliance;
• Sec 65 of the Income Tax Act: Every person shall furnish a return.
• Sec. 26 of the VAT Act: Every registered person shall furnish a return.
A comparison of tax morale and compliance between Botswana and South Africa constitutes a good experiment since the tax systems themselves are similar but the political histories of the two countries could scarcely be more dissimilar Analyses of data from surveys of public attitudes toward government show that perceptions of fairness and efficacy are considerably higher in Botswana and self-reported tax compliance is higher.
Business and Management Horizons ISSN 2326-0297
2013, Vol. 1, No. 1
www.macrothink.org/bmh 118
The elements of the tax structure are summarized in Table 2. For the Personal Income Tax, the self-assessment and audit processes are similar in both countries although there are varying degrees of aggressiveness in enforcement. Both countries rely on some form of tax withholding at source and individual self-assessment and reporting of final tax liabilities. Tax evasion is treated as a serious crime in South Africa; the tax authority exploits high profile cases to reinforce its reputation for tough enforcement. The Botswana the tax authority seems to be (relatively) more accommodating. For example, a general tax amnesty was conducted in 1999 (Cummings et al. 2009).
Table 2. Features of the tax system in Botswana (effective year 2000) (adopted from Cummings et al. 2009)
Self-reporting/assessment Yes Withholding Yes Highest marginal rate 25% Financial penalty Yes (max: tax owed plus interest) Incarceration? Yes (up to 1 year) Mandatory filing No (unless tax owed)
Advocate PeterO’halloran on Gazette newspaper dated March 4th 2009 stated that Tax laws are complex for the man in the street. Botswana’s tax Acts have been designed carefully in order to be equitable. The particular design and various amendments over the years, have left us with a tax system, although, once again very reasonable and straightforward by international standards, for the average man in the street, they are certainly daunting.
Giving his views on the 2012/13 budget, Deloitte senior partner, Max Marinnelli, said the mismatch between individual and company taxation introduced by last year's tax changes could lead to transfer pricing and thin capitalization. The Deloitte expert called on BURS and fiscal authorities to identify defaulting SMMEs and enforce compliance because there was evidence that many of these were outside the tax net. This should be part of initiatives to expand the tax base.
"Expanding the tax base is essential so that everybody who shares in the country's prosperity also contributes to the nation's upkeep and that the tax burden is not carried by a small number of compliant taxpayers (only)," Marinelli said.
The Botswana Unified Revenue Service (BURS) is mandated to perform tax assessment and collection functions on behalf of the Government and to take appropriate measures to counteract tax evasion on the one hand, and to improve taxpayer service to a much higher level on the other hand.
Business and Management Horizons ISSN 2326-0297
2013, Vol. 1, No. 1
www.macrothink.org/bmh 119
3. Statement of the Problem
Botswana Taxpayers have shown different levels of tax compliance. Not even a hand full of researchers have worked on this topic, and only two articles were found; Tax morale affects tax compliance by Cummings et al 2009 and Tax Morale and Compliance by Torgler (2011),even these were not fully covering the problem at hand. The issue of compliance is major problem and it should be researched at length. Currently the government is not collecting enough taxes and people are not complying, the issue is to identify the root problem. The problem of not complying is highly assumed to be related to attitude. This relationship is not well understood due to lack of research in this area, so there is a gap which the researcher is trying to work on by formulating this study.
It was for this reason that this study attempted to find out how taxpayers’ attitudes influence tax compliance behavior in Botswana. The study tried to answer the following questions:
(i) What was the level of tax compliance among SMEs business income earners in Gaborone?
(ii) How the taxpayers’ attitudes and the factors influencing it influenced taxpayers’ compliance behavior among SMEs business income earners in Gaborone?
It was equally hypothesized that taxpayers’ attitudes do not encourage tax compliance in Botswana
4. Research Strategy
A research strategy used by Marti et al (2010) was used. The research involved income earners among SMEs in Gaborone, the results were used to generalize on how the taxpayers’ positive attitudes influence business income tax compliance in Gaborone and by extension Botswana.
A total of 200 taxpayers were sampled but only 180 responded to the questionnaires. This data was collected using structured questionnaire, which was delivered directly to the individuals and collected within one week. Questionnaires were designed based on Marti et.al (2010) data collection tool. It consisted of closed ended matrix and contingency questions. Likert scale comprising of 5 options was used with matrix questions. To protect the confidentiality of the individuals, the questionnaire form only had the serial number. The questionnaire was divided in to the following parts: - Part 1- Demographic Profile: This included gender, age, marital status, business experience and literacy level; Part 2- Attitudes and attitudinal factors: This included considering positive and negative attitudes and factors affecting attitudes such as justice in a tax system, peer attitude, understanding of tax laws, paying tax fines and penalties, use of informants by BURS, rewarding taxpayers, degree of being detected for nonpayment of tax, degree of risk aversion, positive government image, harassment from BURS, profit maximization and demographic variables such as gender, age, marital status, business experience and literacy level. Part 3 -Tax compliance and Tax non-compliance status: This included considering compliance measures such as registering for PIN, keeping the proper books of accounts, filing of return, accurate determination of taxable income, determination of accurate tax liability, paying of tax dues on the due dates,
Business and Management Horizons ISSN 2326-0297
2013, Vol. 1, No. 1
www.macrothink.org/bmh 120
payment of fines and penalties for over- due taxes, allowing of audit by tax collectors and use of tax advisors such as accountants; Part 4 – Reasons for tax compliance and non-compliance status
5. Hypothesis
The hypothesis (H1) is that taxpayers’ attitudes influence tax compliance in SMEs
6. Analysis of Data, Discussion and Findings
Data was collected from two hundred (200) taxpayers, in and around Gaborone, including; Molepolole, Mochudi, Otse and Lobatse were randomly selected. These 200 taxpayers were sampled and only one hundred and eighty (180) responded to the questionnaires, which is an equitably high rate of 90% (percent).
6.1 Analysis of Demographics
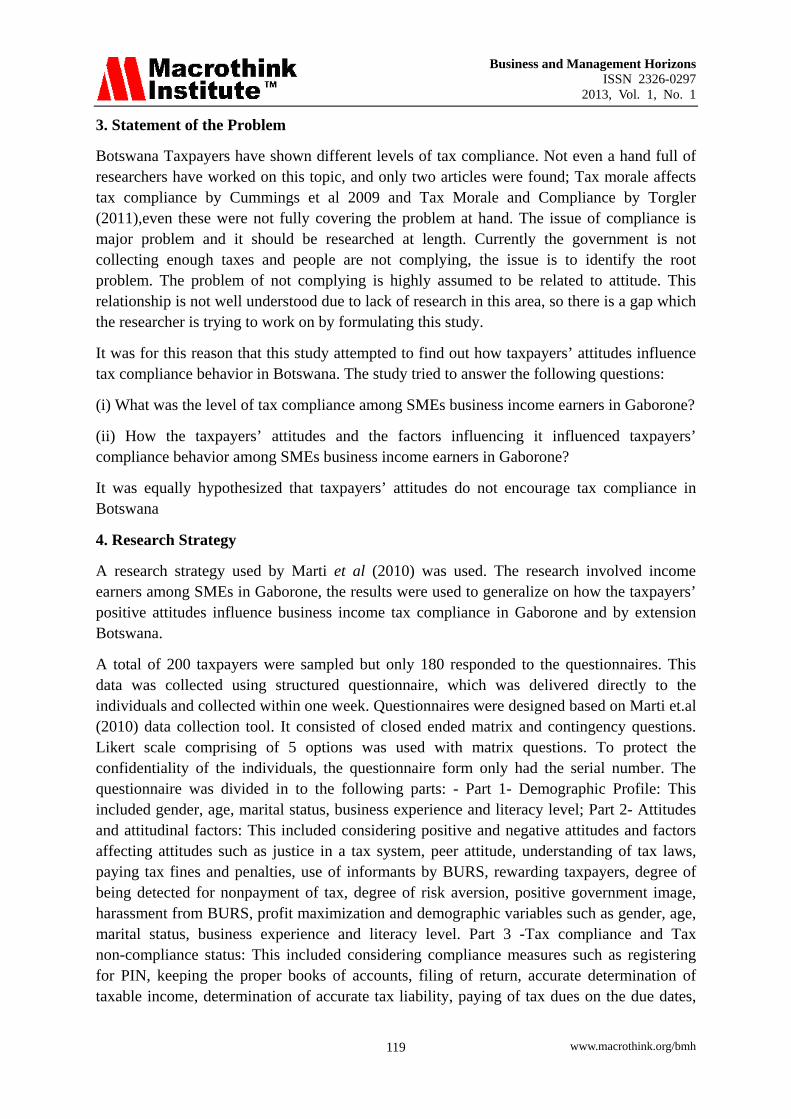
From the data collected and those who responded, 99 taxpayers were male, when 81 were female (See Chart 1). This represents a fairly reasonably distributed gender ratio among the taxpayers in and around Gaborone.
Males55%
Females45%
Gender
Chart 1
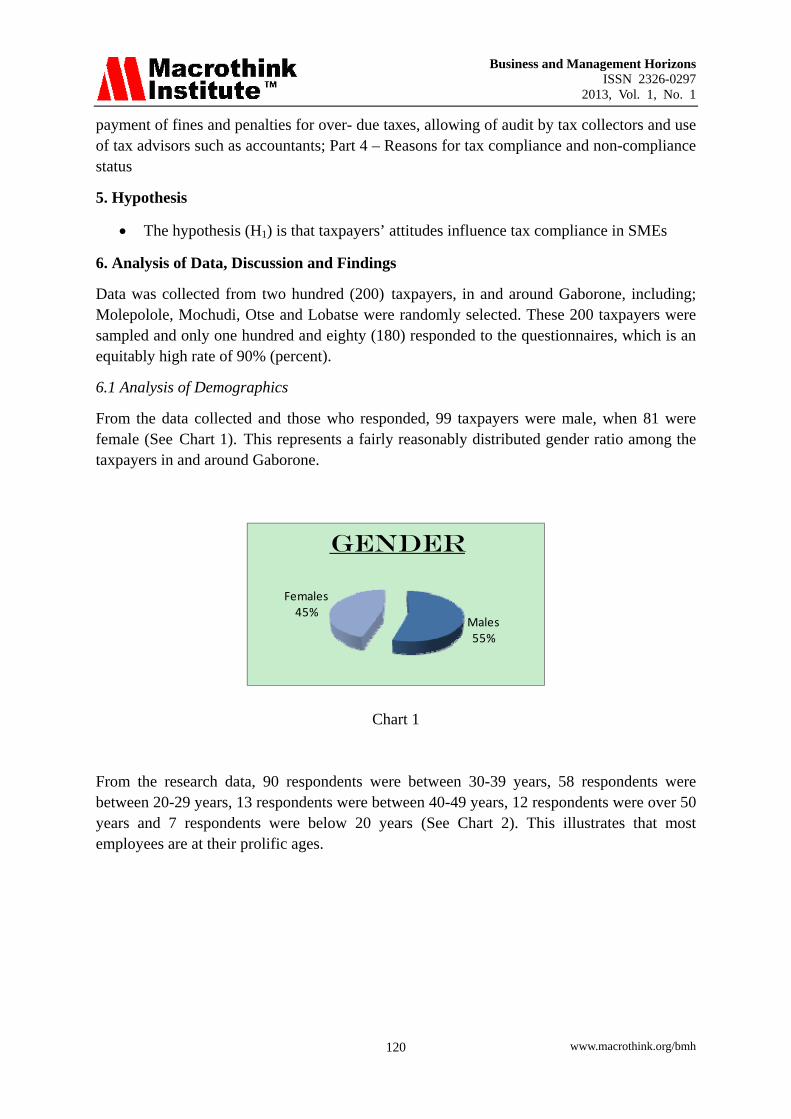
From the research data, 90 respondents were between 30-39 years, 58 respondents were between 20-29 years, 13 respondents were between 40-49 years, 12 respondents were over 50 years and 7 respondents were below 20 years (See Chart 2). This illustrates that most employees are at their prolific ages.
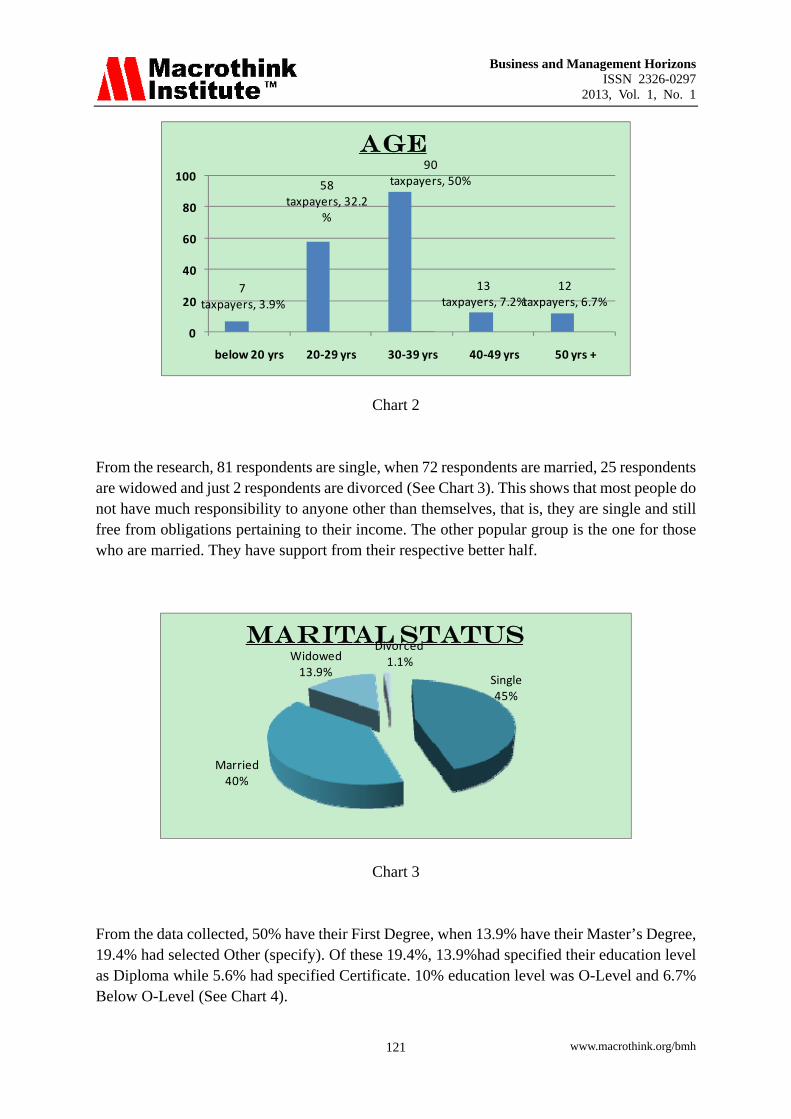
From the research, 81 respondents are single, when 72 respondents are married, 25 respondents are widowed and just 2 respondents are divorced (See Chart 3). This shows that most people do not have much responsibility to anyone other than themselves, that is, they are single and still free from obligations pertaining to their income. The other popular group is the one for those who are married. They have support from their respective better half.
Single45%
Married40%
Widowed13.9%
Divorced1.1%
Marital Status
Chart 3
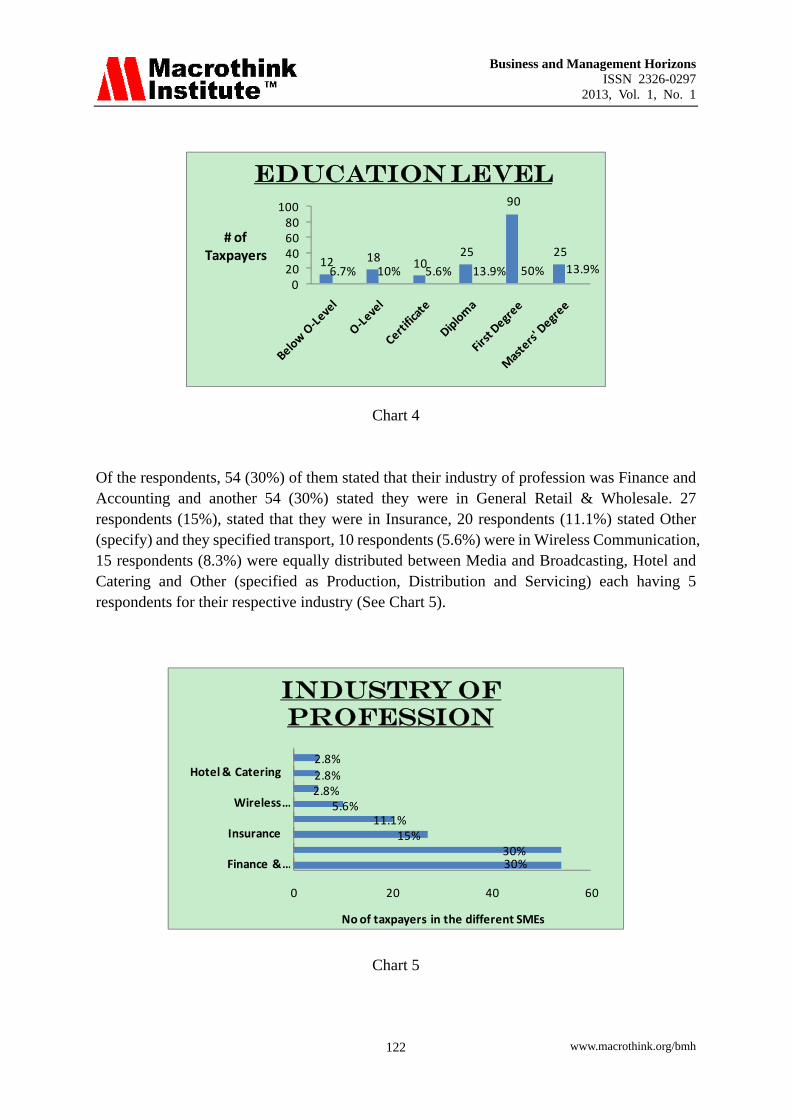
From the data collected, 50% have their First Degree, when 13.9% have their Master’s Degree, 19.4% had selected Other (specify). Of these 19.4%, 13.9%had specified their education level as Diploma while 5.6% had specified Certificate. 10% education level was O-Level and 6.7% Below O-Level (See Chart 4).
Business and Management Horizons ISSN 2326-0297
2013, Vol. 1, No. 1
www.macrothink.org/bmh 122
12 18 1025
90
25
6.7% 10% 5.6% 13.9% 50% 13.9%020406080
100
# of Taxpayers
EDUCATION LEVEL
Chart 4
Of the respondents, 54 (30%) of them stated that their industry of profession was Finance and Accounting and another 54 (30%) stated they were in General Retail & Wholesale. 27 respondents (15%), stated that they were in Insurance, 20 respondents (11.1%) stated Other (specify) and they specified transport, 10 respondents (5.6%) were in Wireless Communication, 15 respondents (8.3%) were equally distributed between Media and Broadcasting, Hotel and Catering and Other (specified as Production, Distribution and Servicing) each having 5 respondents for their respective industry (See Chart 5).
30%30%
15%11.1%
5.6%2.8%2.8%
2.8%
0 20 40 60
Finance & …
Insurance
Wireless …
Hotel & Catering
No of taxpayers in the different SMEs
INDUSTRY OF PROFESSION
Chart 5
Business and Management Horizons ISSN 2326-0297
2013, Vol. 1, No. 1
www.macrothink.org/bmh 123
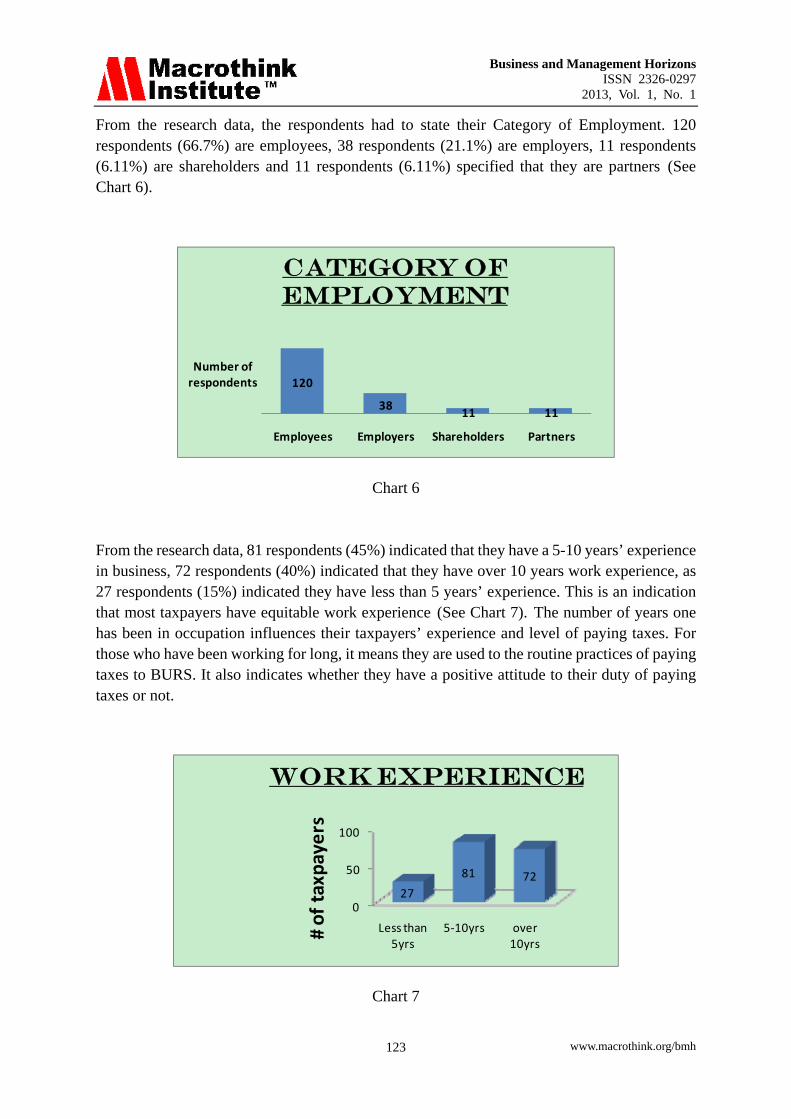
From the research data, the respondents had to state their Category of Employment. 120 respondents (66.7%) are employees, 38 respondents (21.1%) are employers, 11 respondents (6.11%) are shareholders and 11 respondents (6.11%) specified that they are partners (See Chart 6).
120
3811 11
Employees Employers Shareholders Partners
Number of respondents
CATEGORY OF EMPLOYMENT
Chart 6
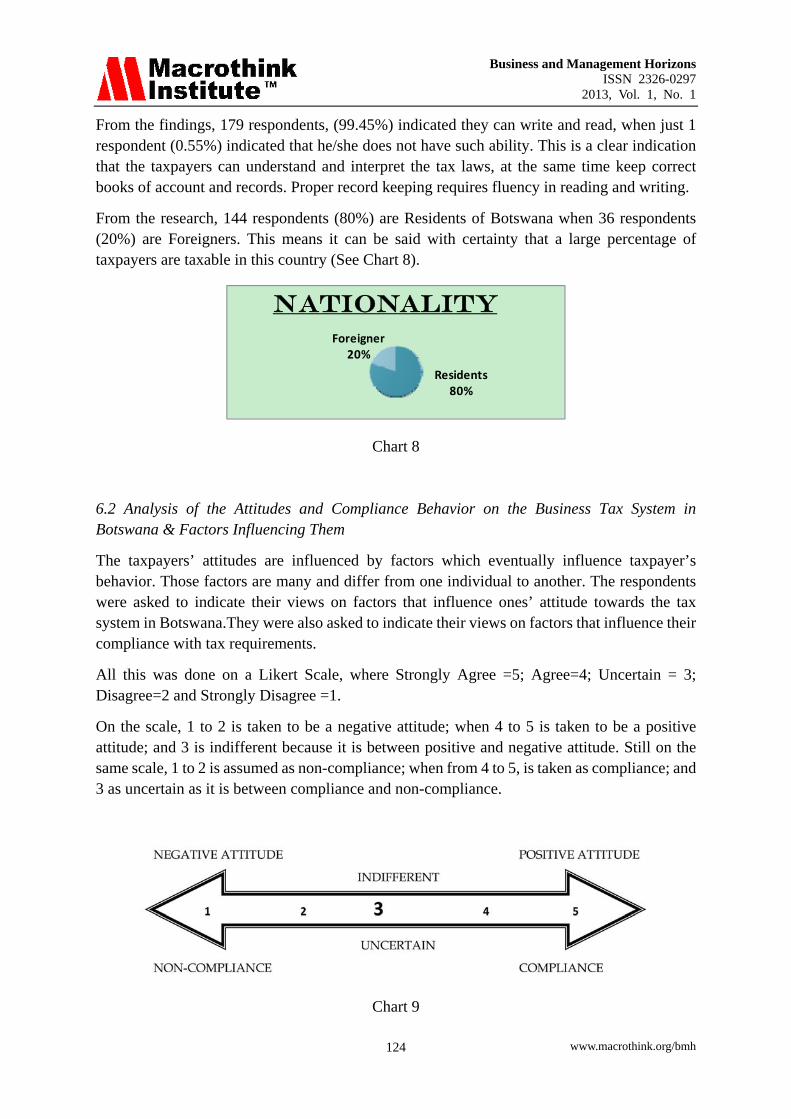
From the research data, 81 respondents (45%) indicated that they have a 5-10 years’ experience in business, 72 respondents (40%) indicated that they have over 10 years work experience, as 27 respondents (15%) indicated they have less than 5 years’ experience. This is an indication that most taxpayers have equitable work experience (See Chart 7). The number of years one has been in occupation influences their taxpayers’ experience and level of paying taxes. For those who have been working for long, it means they are used to the routine practices of paying taxes to BURS. It also indicates whether they have a positive attitude to their duty of paying taxes or not.
0
50
100
Less than 5yrs
5‐10yrs over 10yrs
27
81 72
# of taxpayers
Work Experience
Chart 7
Business and Management Horizons ISSN 2326-0297
2013, Vol. 1, No. 1
www.macrothink.org/bmh 124
From the findings, 179 respondents, (99.45%) indicated they can write and read, when just 1 respondent (0.55%) indicated that he/she does not have such ability. This is a clear indication that the taxpayers can understand and interpret the tax laws, at the same time keep correct books of account and records. Proper record keeping requires fluency in reading and writing.
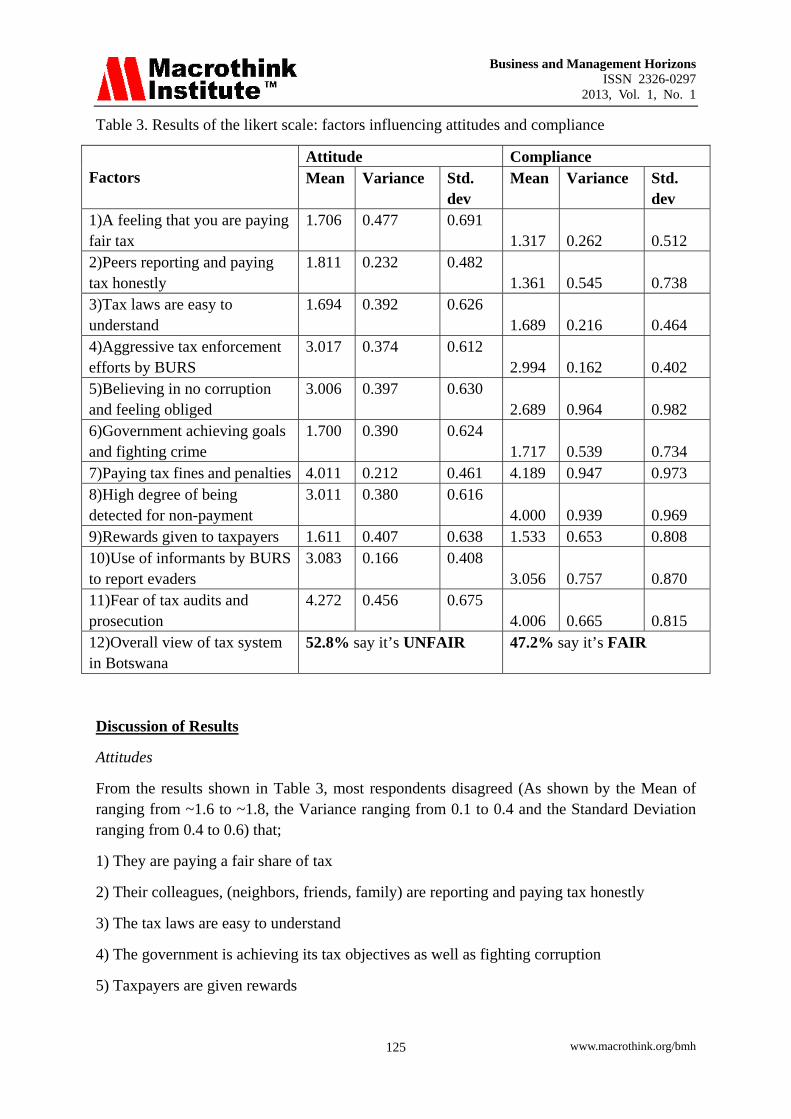
From the research, 144 respondents (80%) are Residents of Botswana when 36 respondents (20%) are Foreigners. This means it can be said with certainty that a large percentage of taxpayers are taxable in this country (See Chart 8).
Residents80%
Foreigner20%
NATIONALITY
Chart 8
6.2 Analysis of the Attitudes and Compliance Behavior on the Business Tax System in Botswana & Factors Influencing Them
The taxpayers’ attitudes are influenced by factors which eventually influence taxpayer’s behavior. Those factors are many and differ from one individual to another. The respondents were asked to indicate their views on factors that influence ones’ attitude towards the tax system in Botswana.They were also asked to indicate their views on factors that influence their compliance with tax requirements.
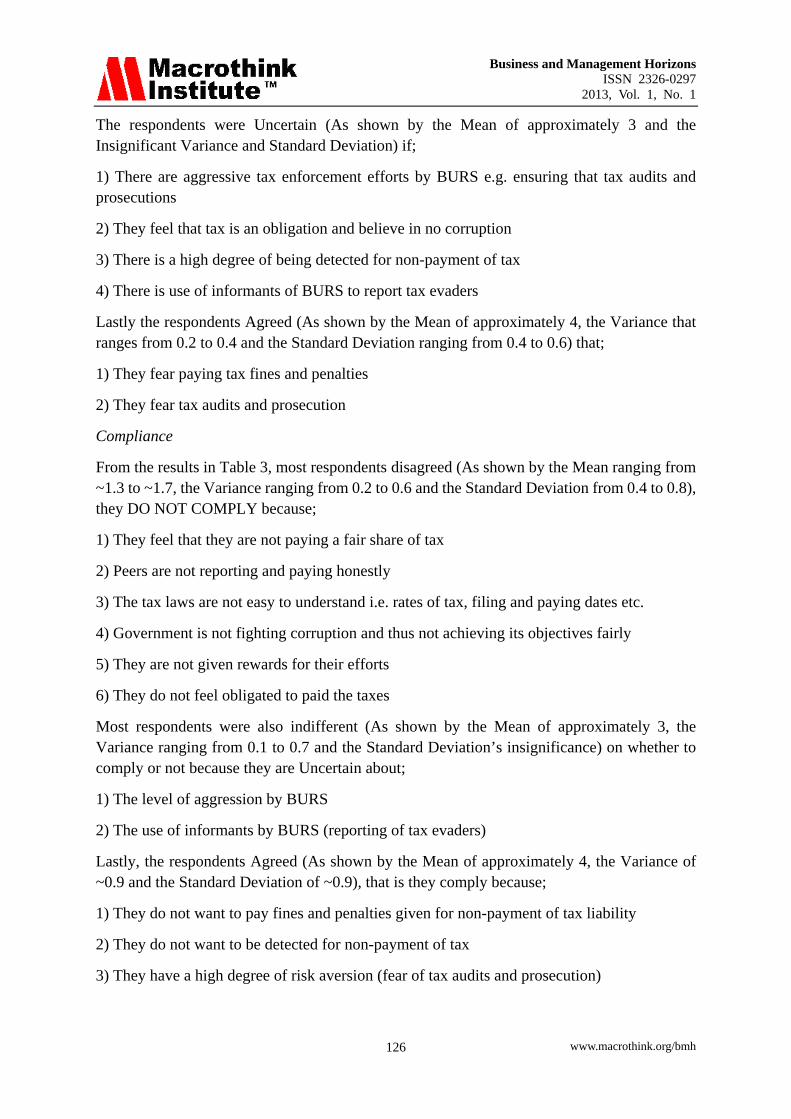
All this was done on a Likert Scale, where Strongly Agree =5; Agree=4; Uncertain = 3; Disagree=2 and Strongly Disagree =1.
On the scale, 1 to 2 is taken to be a negative attitude; when 4 to 5 is taken to be a positive attitude; and 3 is indifferent because it is between positive and negative attitude. Still on the same scale, 1 to 2 is assumed as non-compliance; when from 4 to 5, is taken as compliance; and 3 as uncertain as it is between compliance and non-compliance.
Chart 9
Business and Management Horizons ISSN 2326-0297
2013, Vol. 1, No. 1
www.macrothink.org/bmh 125
Table 3. Results of the likert scale: factors influencing attitudes and compliance
Factors
Attitude Compliance Mean Variance Std.
dev Mean Variance Std.
dev 1)A feeling that you are paying fair tax
1.706 0.477 0.691 1.317 0.262 0.512
2)Peers reporting and paying tax honestly
1.811 0.232 0.482 1.361 0.545 0.738
3)Tax laws are easy to understand
1.694 0.392 0.626 1.689 0.216 0.464
4)Aggressive tax enforcement efforts by BURS
3.017 0.374 0.612 2.994 0.162 0.402
5)Believing in no corruption and feeling obliged
3.006 0.397 0.630 2.689 0.964 0.982
6)Government achieving goals and fighting crime
1.700 0.390 0.624 1.717 0.539 0.734
7)Paying tax fines and penalties 4.011 0.212 0.461 4.189 0.947 0.973 8)High degree of being detected for non-payment
3.011 0.380 0.616 4.000 0.939 0.969
9)Rewards given to taxpayers 1.611 0.407 0.638 1.533 0.653 0.808 10)Use of informants by BURS to report evaders
3.083 0.166 0.408 3.056 0.757 0.870
11)Fear of tax audits and prosecution
4.272 0.456 0.675 4.006 0.665 0.815
12)Overall view of tax system in Botswana
52.8% say it’s UNFAIR 47.2% say it’s FAIR
Discussion of Results
Attitudes
From the results shown in Table 3, most respondents disagreed (As shown by the Mean of ranging from ~1.6 to ~1.8, the Variance ranging from 0.1 to 0.4 and the Standard Deviation ranging from 0.4 to 0.6) that;
1) They are paying a fair share of tax
2) Their colleagues, (neighbors, friends, family) are reporting and paying tax honestly
3) The tax laws are easy to understand
4) The government is achieving its tax objectives as well as fighting corruption
5) Taxpayers are given rewards
Business and Management Horizons ISSN 2326-0297
2013, Vol. 1, No. 1
www.macrothink.org/bmh 126
The respondents were Uncertain (As shown by the Mean of approximately 3 and the Insignificant Variance and Standard Deviation) if;
1) There are aggressive tax enforcement efforts by BURS e.g. ensuring that tax audits and prosecutions
2) They feel that tax is an obligation and believe in no corruption
3) There is a high degree of being detected for non-payment of tax
4) There is use of informants of BURS to report tax evaders
Lastly the respondents Agreed (As shown by the Mean of approximately 4, the Variance that ranges from 0.2 to 0.4 and the Standard Deviation ranging from 0.4 to 0.6) that;
1) They fear paying tax fines and penalties
2) They fear tax audits and prosecution
Compliance
From the results in Table 3, most respondents disagreed (As shown by the Mean ranging from ~1.3 to ~1.7, the Variance ranging from 0.2 to 0.6 and the Standard Deviation from 0.4 to 0.8), they DO NOT COMPLY because;
1) They feel that they are not paying a fair share of tax
2) Peers are not reporting and paying honestly
3) The tax laws are not easy to understand i.e. rates of tax, filing and paying dates etc.
4) Government is not fighting corruption and thus not achieving its objectives fairly
5) They are not given rewards for their efforts
6) They do not feel obligated to paid the taxes
Most respondents were also indifferent (As shown by the Mean of approximately 3, the Variance ranging from 0.1 to 0.7 and the Standard Deviation’s insignificance) on whether to comply or not because they are Uncertain about;
1) The level of aggression by BURS
2) The use of informants by BURS (reporting of tax evaders)
Lastly, the respondents Agreed (As shown by the Mean of approximately 4, the Variance of ~0.9 and the Standard Deviation of ~0.9), that is they comply because;
1) They do not want to pay fines and penalties given for non-payment of tax liability
2) They do not want to be detected for non-payment of tax
3) They have a high degree of risk aversion (fear of tax audits and prosecution)
Business and Management Horizons ISSN 2326-0297
2013, Vol. 1, No. 1
www.macrothink.org/bmh 127
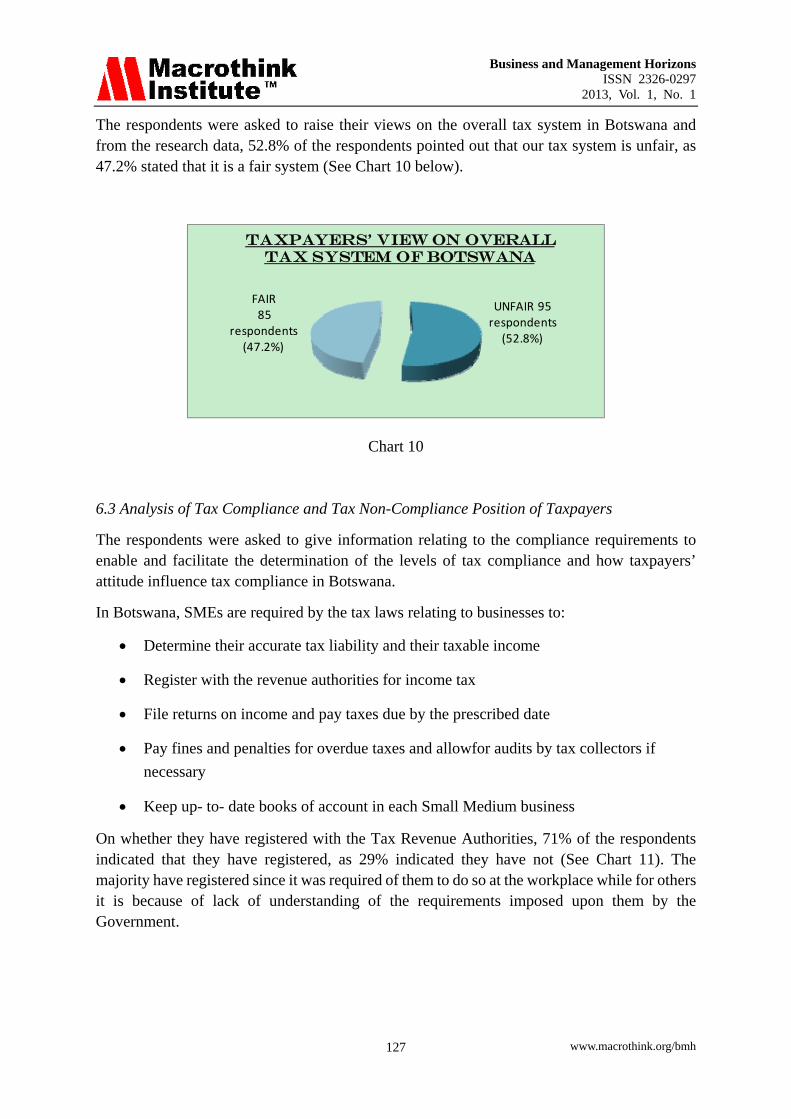
The respondents were asked to raise their views on the overall tax system in Botswana and from the research data, 52.8% of the respondents pointed out that our tax system is unfair, as 47.2% stated that it is a fair system (See Chart 10 below).
UNFAIR 95 respondents (52.8%)
FAIR85
respondents (47.2%)
Taxpayers' VIEW On overall TAX SYSTEM of botswana
Chart 10
6.3 Analysis of Tax Compliance and Tax Non-Compliance Position of Taxpayers
The respondents were asked to give information relating to the compliance requirements to enable and facilitate the determination of the levels of tax compliance and how taxpayers’ attitude influence tax compliance in Botswana.
In Botswana, SMEs are required by the tax laws relating to businesses to:
Determine their accurate tax liability and their taxable income
Register with the revenue authorities for income tax
File returns on income and pay taxes due by the prescribed date
Pay fines and penalties for overdue taxes and allowfor audits by tax collectors if
necessary
Keep up- to- date books of account in each Small Medium business
On whether they have registered with the Tax Revenue Authorities, 71% of the respondents indicated that they have registered, as 29% indicated they have not (See Chart 11). The majority have registered since it was required of them to do so at the workplace while for others it is because of lack of understanding of the requirements imposed upon them by the Government.
Business and Management Horizons ISSN 2326-0297
2013, Vol. 1, No. 1
www.macrothink.org/bmh 128
YESNO
71%
29%
REGISTRATION WITH TAX AUTHORITIES
Chart 11
On keeping up to date transaction records and books of accounts i.e. invoices, journals, ledgers, cash books, trial balances, profit and loss accounts, and balance sheet, half of the respondents indicated that they keep incomplete business records while another half keep up-to date complete transaction records (See Chart 12). Here there is some sort of compliance as well as non-compliance in keeping up to date records and books of accounts.
50%50%
KEEPING UP-TO-DATE RECORDS
YES
NO
Chart 12
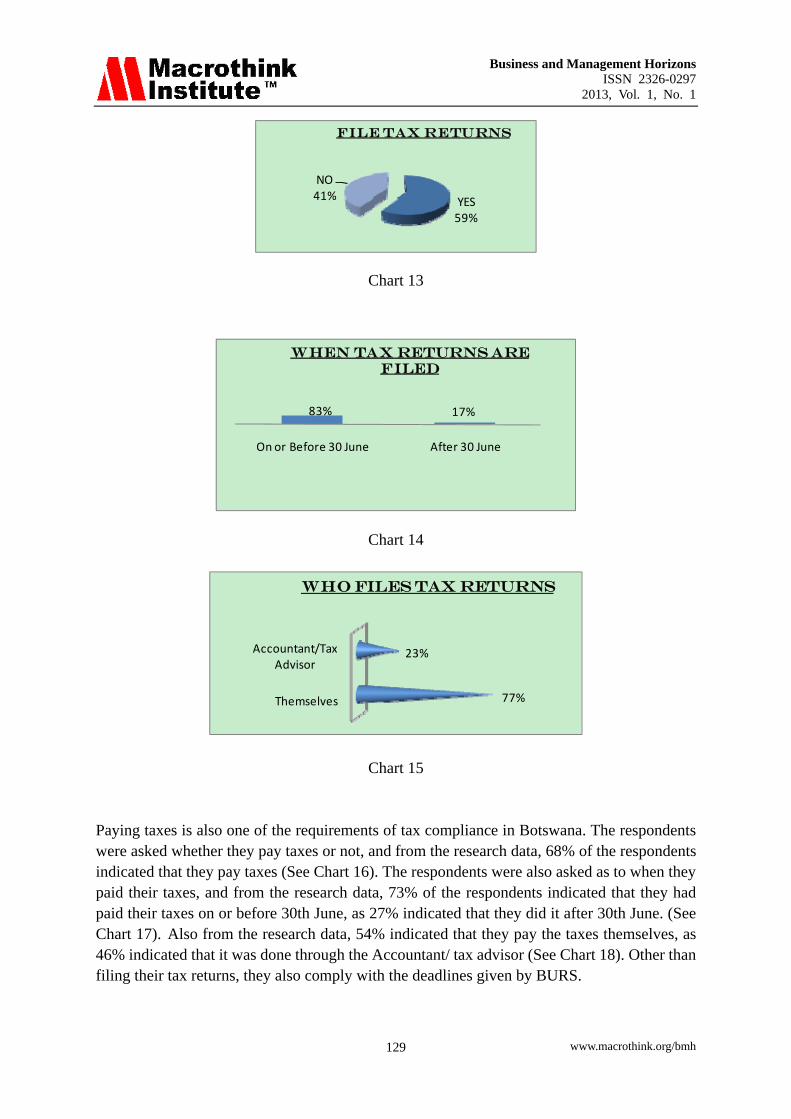
The respondents were asked whether they file tax returns or not, when and who files them; and from the research data, 59% of the respondents indicated that they file tax returns, 41% do not (See Chart 13). The respondents were also asked as to when they filed their tax returns in the previous tax year, and from the research data, 83% of the respondents indicated that they had filed their tax returns on or before 30th June, as 17% indicated that they did it after 30th June (See Chart 14). Also from the research data, 77% indicated that they file the tax returns themselves, as 23% indicated that it was done through the Accountant/ tax advisor (See Chart 15). The above factors all show that taxpayers do comply with the requirements.
Business and Management Horizons ISSN 2326-0297
2013, Vol. 1, No. 1
www.macrothink.org/bmh 129
YES59%
NO41%
FILE TAX RETURNS
Chart 13
83% 17%
On or Before 30 June After 30 June
When tax returns are filed
Chart 14
Themselves
Accountant/Tax Advisor
77%
23%
Who files tax Returns
Chart 15
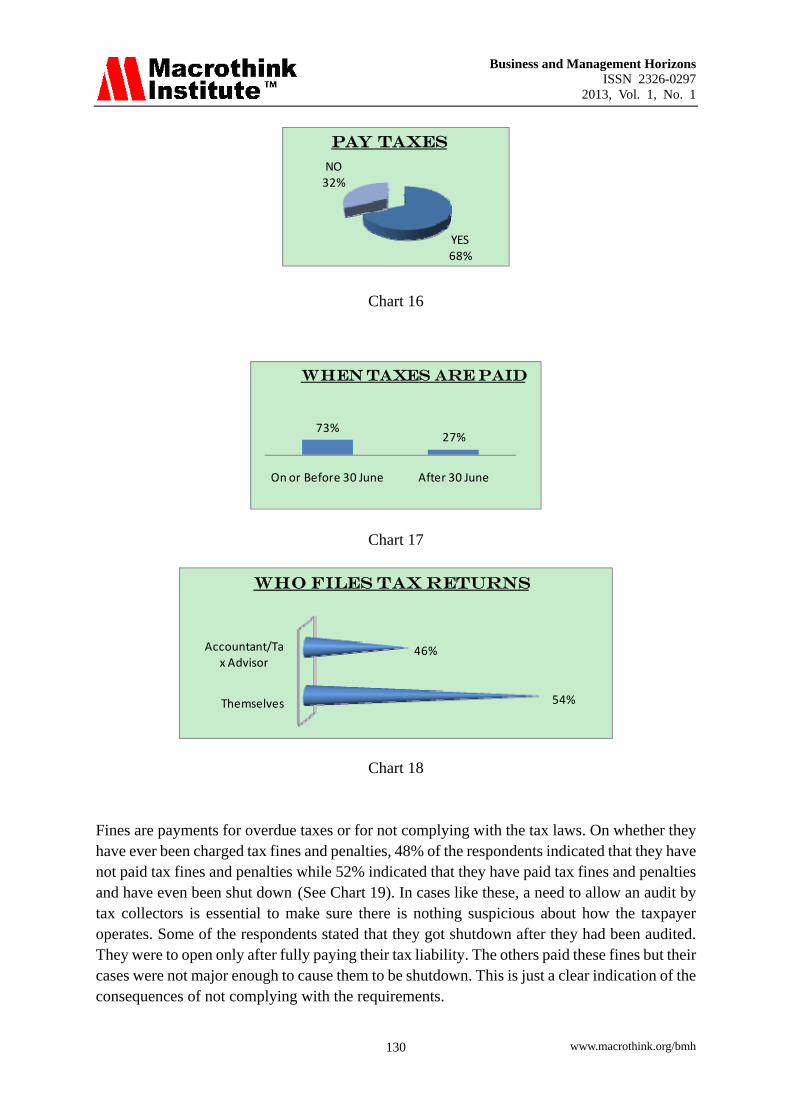
Paying taxes is also one of the requirements of tax compliance in Botswana. The respondents were asked whether they pay taxes or not, and from the research data, 68% of the respondents indicated that they pay taxes (See Chart 16). The respondents were also asked as to when they paid their taxes, and from the research data, 73% of the respondents indicated that they had paid their taxes on or before 30th June, as 27% indicated that they did it after 30th June. (See Chart 17). Also from the research data, 54% indicated that they pay the taxes themselves, as 46% indicated that it was done through the Accountant/ tax advisor (See Chart 18). Other than filing their tax returns, they also comply with the deadlines given by BURS.
Business and Management Horizons ISSN 2326-0297
2013, Vol. 1, No. 1
www.macrothink.org/bmh 130
YES68%
NO32%
PAY TAXES
Chart 16
73%27%
On or Before 30 June After 30 June
WHEN TAXES are PAID
Chart 17
Themselves
Accountant/Tax Advisor
54%
46%
WHO files tax returns
Chart 18
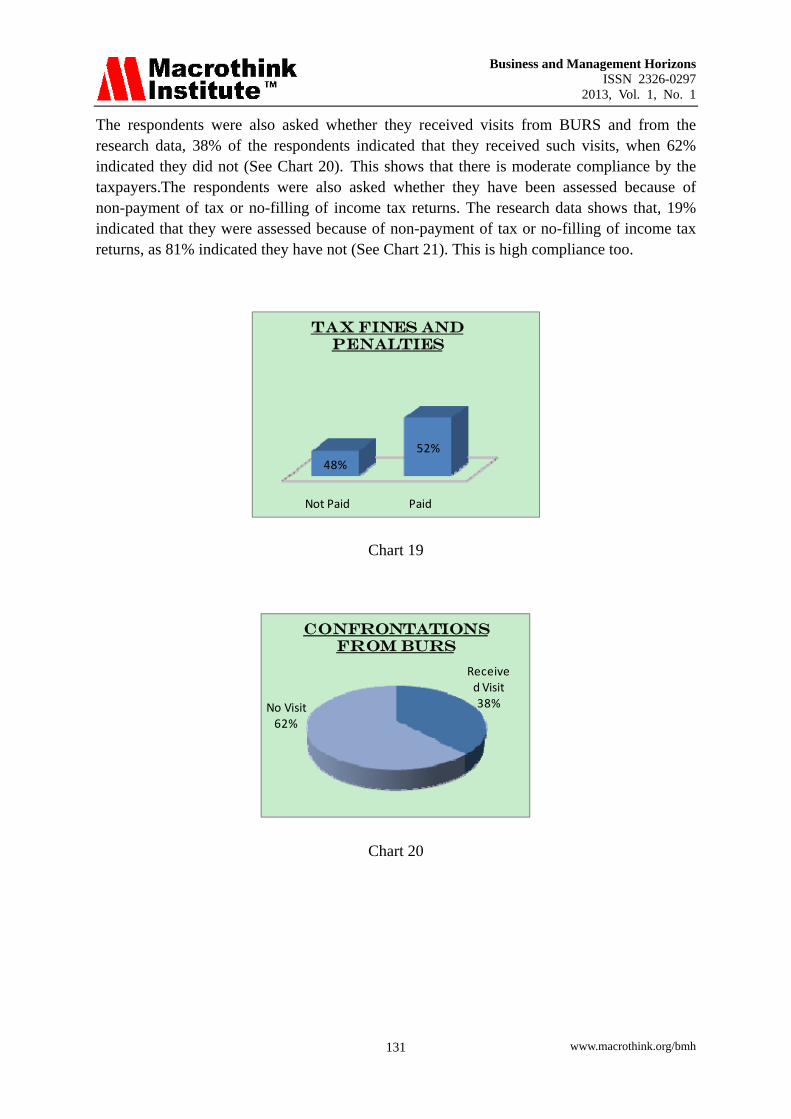
Fines are payments for overdue taxes or for not complying with the tax laws. On whether they have ever been charged tax fines and penalties, 48% of the respondents indicated that they have not paid tax fines and penalties while 52% indicated that they have paid tax fines and penalties and have even been shut down (See Chart 19). In cases like these, a need to allow an audit by tax collectors is essential to make sure there is nothing suspicious about how the taxpayer operates. Some of the respondents stated that they got shutdown after they had been audited. They were to open only after fully paying their tax liability. The others paid these fines but their cases were not major enough to cause them to be shutdown. This is just a clear indication of the consequences of not complying with the requirements.
Business and Management Horizons ISSN 2326-0297
2013, Vol. 1, No. 1
www.macrothink.org/bmh 131
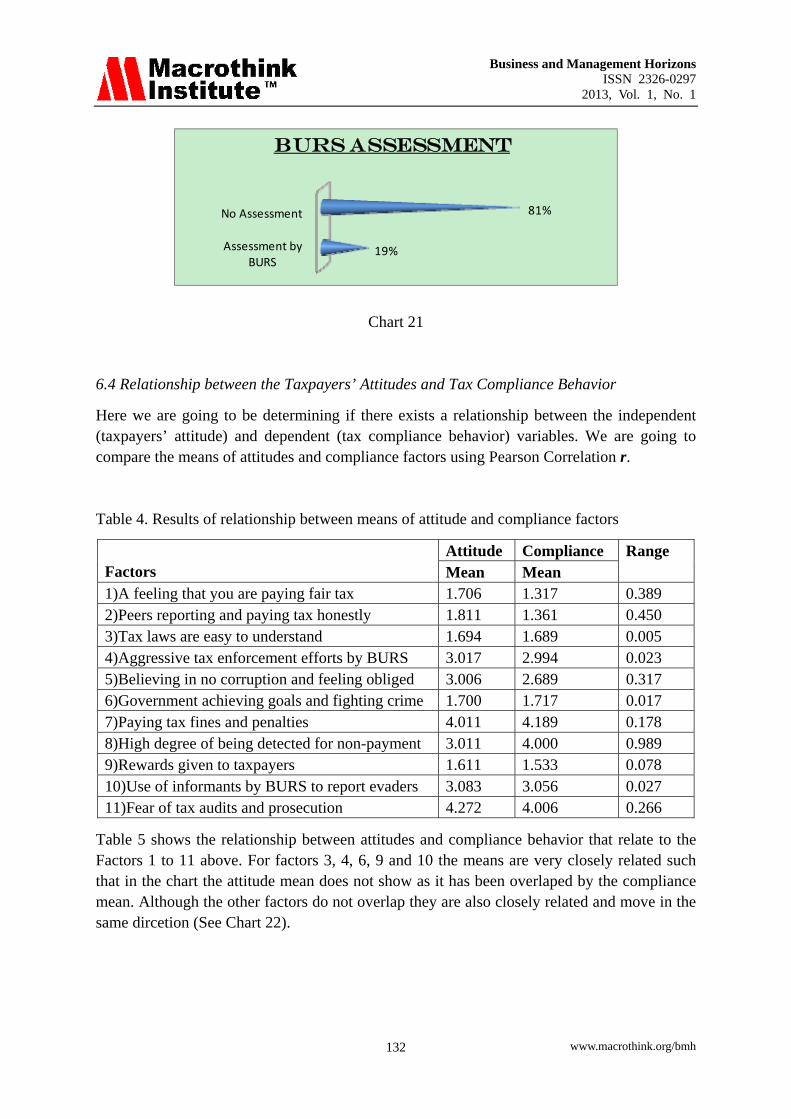
The respondents were also asked whether they received visits from BURS and from the research data, 38% of the respondents indicated that they received such visits, when 62% indicated they did not (See Chart 20). This shows that there is moderate compliance by the taxpayers.The respondents were also asked whether they have been assessed because of non-payment of tax or no-filling of income tax returns. The research data shows that, 19% indicated that they were assessed because of non-payment of tax or no-filling of income tax returns, as 81% indicated they have not (See Chart 21). This is high compliance too.
Not Paid Paid
48%
52%
Tax fines and penalties
Chart 19
Received Visit38%No Visit
62%
Confrontations from Burs
Chart 20
Business and Management Horizons ISSN 2326-0297
2013, Vol. 1, No. 1
www.macrothink.org/bmh 132
Assessment by BURS
No Assessment
19%
81%
BURS ASSESSMENT
Chart 21
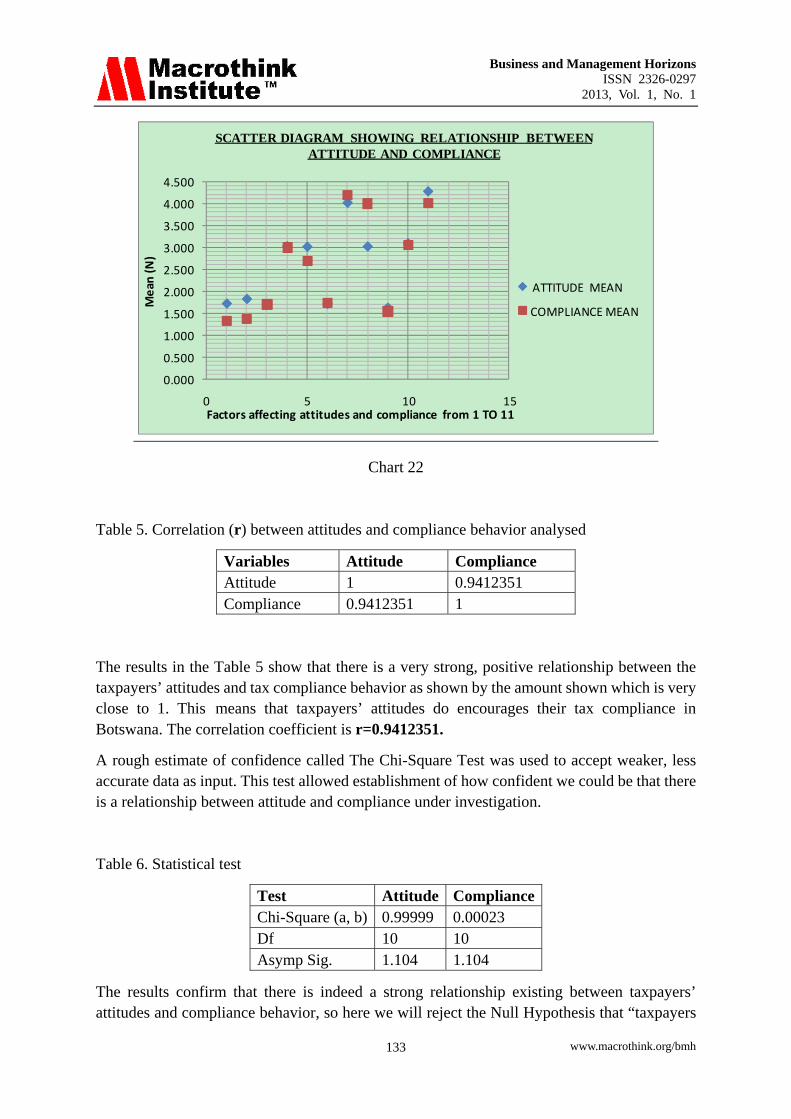
6.4 Relationship between the Taxpayers’ Attitudes and Tax Compliance Behavior
Here we are going to be determining if there exists a relationship between the independent (taxpayers’ attitude) and dependent (tax compliance behavior) variables. We are going to compare the means of attitudes and compliance factors using Pearson Correlation r.
Table 4. Results of relationship between means of attitude and compliance factors
Factors
Attitude Compliance Range Mean Mean
1)A feeling that you are paying fair tax 1.706 1.317 0.389 2)Peers reporting and paying tax honestly 1.811 1.361 0.450 3)Tax laws are easy to understand 1.694 1.689 0.005 4)Aggressive tax enforcement efforts by BURS 3.017 2.994 0.023 5)Believing in no corruption and feeling obliged 3.006 2.689 0.317 6)Government achieving goals and fighting crime 1.700 1.717 0.017 7)Paying tax fines and penalties 4.011 4.189 0.178 8)High degree of being detected for non-payment 3.011 4.000 0.989 9)Rewards given to taxpayers 1.611 1.533 0.078 10)Use of informants by BURS to report evaders 3.083 3.056 0.027 11)Fear of tax audits and prosecution 4.272 4.006 0.266
Table 5 shows the relationship between attitudes and compliance behavior that relate to the Factors 1 to 11 above. For factors 3, 4, 6, 9 and 10 the means are very closely related such that in the chart the attitude mean does not show as it has been overlaped by the compliance mean. Although the other factors do not overlap they are also closely related and move in the same dircetion (See Chart 22).
Business and Management Horizons ISSN 2326-0297
2013, Vol. 1, No. 1
www.macrothink.org/bmh 133
0.000
0.500
1.000
1.500
2.000
2.500
3.000
3.500
4.000
4.500
0 5 10 15
Mean
(N)
Factors affecting attitudes and compliance from 1 TO 11
SCATTER DIAGRAM SHOWING RELATIONSHIP BETWEEN ATTITUDE AND COMPLIANCE
ATTITUDE MEAN
COMPLIANCE MEAN
Chart 22
Table 5. Correlation (r) between attitudes and compliance behavior analysed
The results in the Table 5 show that there is a very strong, positive relationship between the taxpayers’ attitudes and tax compliance behavior as shown by the amount shown which is very close to 1. This means that taxpayers’ attitudes do encourages their tax compliance in Botswana. The correlation coefficient is r=0.9412351.
A rough estimate of confidence called The Chi-Square Test was used to accept weaker, less accurate data as input. This test allowed establishment of how confident we could be that there is a relationship between attitude and compliance under investigation.
Table 6. Statistical test
Test Attitude ComplianceChi-Square (a, b) 0.99999 0.00023 Df 10 10 Asymp Sig. 1.104 1.104
The results confirm that there is indeed a strong relationship existing between taxpayers’ attitudes and compliance behavior, so here we will reject the Null Hypothesis that “taxpayers
Business and Management Horizons ISSN 2326-0297
2013, Vol. 1, No. 1
www.macrothink.org/bmh 134
attitudes do not influence tax compliance behavior and accept the Alternate Hypothesis that states that they actually do.
Since the correlationcoefficient r is 0.9412 and the significance level is p<0.05, we can reject the reject the null hypothesis that there is no relationship in the population. We can infer that there are only 5 chances in 100 that that a correlation of at least 0.9412 could have risen by chance alone; here the degree of risk is reasonably small. That is, there are less chances in a 100 that there is no correlation in the population.
7. Conclusion
Based on the results from data analysis and findings of the research, it can safely conclude that:
There is a very strong relationship between the taxpayers’ attitudes and tax compliance behavior in the SMES of Botswana. This means that taxpayers’ attitudes do influence tax compliance behavior since the correlation is 0.94123.
The reasons that make taxpayers not to comply with the tax requirements of Botswana are because of their attitudes towards them. That is, the inability to understand tax laws; the taxpayers know that a certain percentage of their income is deducted for tax but do not fully know how it is calculated or why that percentage and not another is used. The taxpayers further feel that they are not paying a fair share of tax. This is because they do not know what a fair share is and who it should be imposed on. There is a factor of positive reinforcement which involves rewarding taxpayers that would make them comply.
Most taxpayers view the tax system in Botswana as unfair. This is because nobody ever wants their income to be reduced for any reason whatsoever, not even for their own development purposes. Whatever activity that leads to a lower disposable income for employees across the SMEs sampled is always viewed in a negative way despite the efforts by government to distribute wealth evenly amongst our fellow countrymen.
The taxpayers of SMEs across the city actually comply with the requirements as they have registered with BURS, file their tax returns and pay taxes on or before the 30th June, which they do themselves. Most taxpayers have not received any audits by tax collectors since it was not considered obligatory, as they were not suspected of anything. Most of them have not received any visits from BURS and have not been assessed for non-payment of tax or non-filling of income tax returns. Half of the taxpayers have kept up to date transaction records and books of accounts while the other half keep incomplete records. There is some sort of compliance here too.
On the payment of fines and penalties for overdue taxes, most taxpayers have paid them in the past, an indication that they did not comply at first, which led to drastic measures like shutdowns and even more tax liability than what had been required before (See Chart 19) that shows the distribution of those who have paid fines and penalties. This is for the past tax years even stretching to years they began business. The question posted to them was if they have ever paid them, referring to even the past years not only the recent tax year. Now taxpayers comply with the requirements as the research data shows that they actually do.
Business and Management Horizons ISSN 2326-0297
2013, Vol. 1, No. 1
www.macrothink.org/bmh 135
Most taxpayers attitude towards tax audits, prosecution, tax fines and penalties, which is of fear has led them to Complying with the requirements because they have agreed; shown by a mean of 4. This means that although psychological factors emphasize positive reinforcement, the degree of an auditors risk aversion de-emphasize them. They will comply with requirements if it is what they should do to avoid getting in trouble. It also means that although the attitude influence compliance behavior; not all the time. For example, one may understand and have a positive image about the tax system but not comply with it when time for paying taxes comes and also one may have a very negative attitude, but be the one who always abides by the laws. This is a very slight variation though.
As recommendation, BURS must do a lot to educate small businesses on issues relating to Tax. It came out strongly that a lot of SMEs are in the dark regarding Tax issues. SMEs too must be careful since non-compliance will come back to haunt. The government may introduce other ways of motivating tax payers such as introducing rewards for those who comply. In conclusion, the issue of tax is a complex one across the world and the government should do its best to address it.
References
Addison, J. T., & Belfield, C. R. (1998): Increasing Taxpayers Compliance: A discussion of the Negligence Penalty. Paper presented to the ways & Means Committee of U.S. House of Representatives in May, Washington DC.
Allingham, M. G., & Sandmo, A. (1972). Income Tax Evasion: A Theoretical Analysis. Journal of Public Economics, 1, 323-338. http://dx.doi.org/10.1016/0047-2727(72)90010-2
Armstrong, G. (2006). Taxpayers Behaviour and Government Policy. Retrieved from www.nber.org/reporter/winter 04/aurebach.html
Aucland, P., & Tibert, I. (1991). Theory of Planned Behavior. Organizational Behavior and Human Decision Processes, 50(2), 179-211. http://dx.doi.org/10.1016/0749-5978(91)90020-T
Barter, A. (1880). Babylonian Proverbs, Rules for Living, Babylon’s’ Epigrams.
Brown, R. E., & Mazur, M. J. (2003). IRS’sComprehensive Approach to Compliance. Paper presented at National Tax Association Spring Symposium in May (2003), Washington D.C.
Bryman & Bell. (2007). Business Research Methods (2nd ed.). (pp. 75-125, 180-204, 367-371).
Charles, A. (2006). Economics as a Science of Human Behavior. Boston/Dorduecht/London: Kluwer.
Christian, A. (2005). The shirts off their backs: How Tax Policies fleece the poor. Christian Aid Briefing. Retrieved from http://www.christianaidorg.uk/indepth/50tax/
Cobham, L. (2005). Role of Tax Agencies in Increasing Voluntary Tax Compliance.
Donald C. Mead. (2003). Possible Causes of Tax Evasion. Journal of Economic Psychology, 5, 371-384.
Business and Management Horizons ISSN 2326-0297
2013, Vol. 1, No. 1
www.macrothink.org/bmh 136
Eden, C. (1992). Improving Tax Compliance. In Richard M. Bird and Milka Casanegra de Janfcher (Eds.), Improving Tax Administration in Developing Countries. Washington D.C., International Monetary Fund.
Erard & Ho. (2002). Developing an Economic Model for Measuring Tax Non Compliance using Operational Audit Data. Paper presented at 2002. American Statistical Association.
Falk, A., & Kosfeld, M. (2006). Distrust-The Hidden Cost of Control, Forthcoming in. American Economic Review. http://dx.doi.org/10.1257/aer.96.5.1611
Field, L. S, Frey, B., &Targler, B. (2006). Rewarding Honest Taxpayers? Evidence on the Impacts of Rewards from Field Experiments. Paper presented on April 9-11 2006 on “Managing and Maintaining Compliance”.
Furnharn, T. (1983). The Protestant Work Ethic, Human Values and Attitudes towards Taxation. Journal of Economic Psychology, 2, 113-128. http://dx.doi.org/10.1016/0167-4870(83)90068-5
Jackson, B. R, & Milliron, V. C. (1986). Tax Compliance research: Findings, Problems and Prospects. Journal of Accounting Literature, 5125-165.
Jensen, G. F. (1969). Crime doesn’t pay: Correlates of a Shared misunderstanding. Social Problems, 17, 189-201. http://dx.doi.org/10.2307/799865
Le, B. S. (1992). Comments on Improving Tax Compliance. In Richard M. Bird & Milka Casnegra De Jantscher (Eds.), Improving Tax Administration in Developing Countries. Washington D. C., International Monetary Funds, Publication Service.
Lewis, I. B. (2005). Consultant in Small and Medium Enterprise. Department of World Bank Group.
Murphey, K. (2004). An Examination of Tax Payers attitudes towards the Australian Tax System: Findings from a survey of tax scheme investors. Center for Tax System Integrity, Research School of Social Sciences, Australian University Working Paper No. 46.
Obara, M., & Mageto, J. M. (2010). A History of Taxation: Why and how taxes came to being.
Occasional research paper. (2008). No. 38 Preliminary Findings from the What’s Fair and what’s Unfair Survey about Justice.
Org. for Eco.Cooperation and Dev. (2001). Tax Laws in Developing Countries, 26-30.
Otiende, J. E., & Muia, D. M. (Eds). (2004). Introduction to Development Studies for Africa. Nairobi: Acacia Publishers.
Pyle, D. J. (1991). Economics of Tax Compliance. Journal Of Economic Surveys, 5, 163-198. http://dx.doi.org/10.1111/j.1467-6419.1991.tb00131.x
Rawlings, B. (2003). Introductionto Development Studies For Africa (6th ed.).
Business and Management Horizons ISSN 2326-0297
2013, Vol. 1, No. 1
www.macrothink.org/bmh 137
Republic of Botswana. (1998a). Small, Medium and Micro Enterprises Task Force Report. Gaborone: Government Printer, April.
Republic of Botswana. (1998b). Policy on Small, Medium and Micro Enterprises in Botswana. Gaborone: Government Printer.
Seidl & Traub. (2001). How to think straight about psychology (8th ed.).
Slemnod, J. (Ed.). (1992). Why People Pay Taxes. Tax Compliance and Enforcement. Ann Arbor University of Michigan Press.
Taxworld Org. (1999). A History of Taxation. Retrieved from http://www.taxworld.org
Tiberius Caesar. (1889). What belongs to Caesar Give to Caesar- The Romans guidelines.
Toumi, C., Hasseldine, C., Hite, S. A., James, A., & Conner, B. (2000). Industrial and Organizational psychology: Research and practice (4th ed.).
Trivedi & Shehata. (2005). Attitudes, Incentives, and Tax Compliance.
Trivia, A. V. (2009). Attitudes, Incentives, and Tax Compliance.
U. S. News and World Report. (2003). Awake! Newspaper Report. Local News December 8.
US Statesmen Benjamin Franklin. (1789). American Laws and Statues Act 1, sec 211.
Wallschutzky, I. G. (1984). Possible Causes of Tax Evasion. Journal of Economic Psychology, 5, 371-384. http://dx.doi.org/10.1016/0167-4870(84)90034-5
Washington D.C. (1960). The Behaviour of Organism. New York: Academic Press.
Wearing, A., & Heady, B. (1997). The Would –be Tax Evader: A Profile. Australian Tax Forum, 13, 3-17.
Copyright Disclaimer
Copyright reserved by the author(s).
This article is an open-access article distributed under the terms and conditions of the Creative Commons Attribution license (http://creativecommons.org/licenses/by/3.0/).