93
0 Tax Year 2013 Rollforward/Rollback Beaufort County, South Carolina
0
Tax Year 2013 Rollforward/Rollback
Beaufort County, South Carolina
1
Presentation Outline
South Carolina Code of Laws Section12-37-251
Effects of Rollforward/Rollback on All Beaufort
County Taxing Entities
Tax Year 2011/Fiscal Year 2012 Ad Valorem Tax
Collections Data by Tax District
Questions

2
South Carolina 12-37-251
As revised June 14, 2011
Rollback millage is calculated by dividing:
Prior year property taxes levied as adjusted by
abatements and additions by
The adjusted total assessed value as of the
reassessment year
Works the same in rollback and rollforward
calculations

3
South Carolina 12-37-251
Rollbacks and rollforwards are not tax increases or
decreases
As a whole, assuming no ad valorem tax increases or
decreases, the same amount of ad valorem taxes are billed
in the prior year and in the year of reassessment
If a property increases or declines in value at the average
level of the County and tax district, there will be no
change in a property tax bill
If a property increases more or decreases less than the
average, then that property tax bill will increase
If a property increases less or decreases more than the
average, then that property tax bill will decrease

4
Rollforward/Rollback by Taxing Entity
Assumptions:
No changes in millage from TY 2012 to TY 2013
No assumed factors for non-collections or appeals
All calculations are based on the Beaufort County
Assessor’s real property estimates as of August 2012
These figures can and will change
Some changes can be material
Thus, the rollforward/rollback calculations can
materially change from now until millage is set in
August 2013

5
Rollforward/Rollback by Taxing Entity:
Beaufort County Ops
Estimated TY 2012 ad valorem revenues = $72,468,251
Millage = 40.21
Without a rollforward, the estimated TY 2013 ad valorem
revenues = $63,602,608
Revenue difference = ($8,865,643) or (12.23%)
Millage = 40.21
With a full rollforward, the estimated TY 2013 ad valorem
revenues = $72,460,470
Revenue difference = ($7,781) or (0.01%)
Millage = 45.81

6
Rollforward/Rollback by Taxing Entity:
Beaufort County Debt
Estimated TY 2012 ad valorem revenues = $8,001,966
Millage = 4.44
Without a rollforward, the estimated TY 2013 ad valorem
revenues = $7,023,019
Revenue difference = ($978,947) or (12.23%)
Millage = 4.44
With a full rollforward, the estimated TY 2013 ad valorem
revenues = $8,003,710
Revenue difference = $1,745 or 0.02%
Millage = 5.06

7
Rollforward/Rollback by Taxing Entity:
Beaufort County Purchase Property
Estimated TY 2012 ad valorem revenues = $6,974,686
Millage = 3.87
Without a rollforward, the estimated TY 2013 ad valorem
revenues = $6,121,415
Revenue difference = ($853,271) or (12.23%)
Millage = 3.87
With a full rollforward, the estimated TY 2013 ad valorem
revenues = $6,975,566
Revenue difference = $880 or 0.01%
Millage = 4.41
8
Rollforward/Rollback by Taxing Entity:
Further Considerations
If ad valorem taxes are not rolled forward, all differences in
debt millages have to be “made up” by operations.
Debt service requirements do not change and still must be
paid in full
General Fund monies always fill in deficiencies in other
funds, which are restricted for specific purposes
For example, the revenue deficiency in the County General
Fund would not just be $8,865,643, it would be a total of
$10,697,861, as the debt fund deficiencies would be “made
up” by the General Fund as well.

9
Rollforward/Rollback by Taxing Entity:
Beaufort County School District Ops
Estimated TY 2012 ad valorem revenues = $114,842,831
Millage = 91.26
Without a rollforward, the estimated TY 2013 ad valorem
revenues = $101,391,466
Revenue difference = ($13,451,365) or (11.71%)
Millage = 91.26
With a full rollforward, the estimated TY 2013 ad valorem
revenues = $114,845,889
Revenue difference = $3,058 or 0.003%
Millage = 103.37

10
Rollforward/Rollback by Taxing Entity:
Beaufort County School District Debt
Estimated TY 2012 ad valorem revenues = $51,375,260
Millage = 28.00
Without a rollforward, the estimated TY 2013 ad valorem
revenues = $45,050,482
Revenue difference = ($6,324,778) or (12.31%)
Millage = 28.00
With a full rollforward, the estimated TY 2013 ad valorem
revenues = $51,373,639
Revenue difference = ($1,621) or (0.003%)
Millage = 31.93
11
Rollforward/Rollback by Taxing Entity:
Town of Port Royal
Estimated TY 2012 ad valorem revenues = $1,815,471
Millage = 69.00
The Town of Port Royal must rollback in TY 2013
The Port Royal TIF I ends at the conclusion of TY 2012
The incremental value of the TIF exceeds the decline in
Port Royal property value
With a rollback, the estimated TY 2013 ad valorem revenues =
$1,815,493
Revenue difference = $23 or 0.001%
Millage = 66.60

12
Rollforward/Rollback by Taxing Entity:
City of Beaufort
Estimated TY 2012 ad valorem revenues = $4,321,398
Millage = 60.62
Without a rollforward, the estimated TY 2013 ad valorem
revenues = $3,952,451
Revenue difference = ($368,947) or (8.54%)
Millage = 60.62
With a full rollforward, the estimated TY 2013 ad valorem
revenues = $4,321,486
Revenue difference = $88 or 0.002%
Millage = 66.28

13
Rollforward/Rollback by Taxing Entity:
Town of Hilton Head Island
Estimated TY 2012 ad valorem revenues = $17,660,087
Millage = 19.33
Without a rollforward, the estimated TY 2013 ad valorem
revenues = $15,568,857
Revenue difference = ($2,091,230) or (11.84%)
Millage = 19.33
With a full rollforward, the estimated TY 2013 ad valorem
revenues = $17,662,961
Revenue difference = $2,873 or 0.02%
Millage = 21.93

14
Rollforward/Rollback by Taxing Entity:
Town of Bluffton
Estimated TY 2012 ad valorem revenues = $5,238,210
Millage = 38.00
Without a rollforward, the estimated TY 2013 ad valorem
revenues = $4,309,897
Revenue difference = ($928,313) or (17.72%)
Millage = 38.00
With a full rollforward, the estimated TY 2013 ad valorem
revenues = $5,237,659
Revenue difference = ($550) or (0.01%)
Millage = 46.18
15
Rollforward/Rollback by Taxing Entity:
Town of Hardeeville
Estimated TY 2012 ad valorem revenues = $803
Millage = 147.00
No rollforward or rollback is required
Estimated TY 2013 ad valorem revenues = $803
Millage = 147.00

16
Rollforward/Rollback by Taxing Entity:
Town of Yemassee
Estimated TY 2012 ad valorem revenues = $26,228
Millage = 70.00
The Town of Yemassee must rollback in TY 2013
Assessed value estimated to grow from $374,690 to
$645,220 in the reassessment
With a rollback, the estimated TY 2013 ad valorem revenues =
$26,228
Revenue difference = $0
Millage = 40.65

17
Rollforward/Rollback by Taxing Entity:
Burton Fire District Ops
Estimated TY 2012 ad valorem revenues = $4,109,020
Millage = 58.21
Without a rollforward, the estimated TY 2013 ad valorem
revenues = $3,959,807
Revenue difference = ($149,213) or (3.63%)
Millage = 58.21
With a full rollforward, the estimated TY 2013 ad valorem
revenues = $4,108,785
Revenue difference = ($235) or (0.01%)
Millage = 60.40
18
Rollforward/Rollback by Taxing Entity:
Burton Fire District Debt
Estimated TY 2012 ad valorem revenues = $390,360
Millage = 5.53
Without a rollforward, the estimated TY 2013 ad valorem
revenues = $376,185
Revenue difference = ($14,175) or (3.63%)
Millage = 5.53
With a full rollforward, the estimated TY 2013 ad valorem
revenues = $390,471
Revenue difference = $110 or 0.03%
Millage = 5.74

19
Rollforward/Rollback by Taxing Entity:
LISH Fire District Ops
Estimated TY 2012 ad valorem revenues = $4,729,399
Millage = 33.34
Without a rollforward, the estimated TY 2013 ad valorem
revenues = $4,420,647
Revenue difference = ($308,752) or (6.53%)
Millage = 33.34
With a full rollforward, the estimated TY 2013 ad valorem
revenues = $4,729,589
Revenue difference = $190 or 0.004%
Millage = 35.67

20
Rollforward/Rollback by Taxing Entity:
LISH Fire District Debt
Estimated TY 2012 ad valorem revenues = $212,780
Millage = 1.50
Without a rollforward, the estimated TY 2013 ad valorem
revenues = $198,889
Revenue difference = ($13,891) or (6.53%)
Millage = 1.50
With a full rollforward, the estimated TY 2013 ad valorem
revenues = $212,149
Revenue difference = ($632) or (0.30%)
Millage = 1.60

21
Rollforward/Rollback by Taxing Entity:
Bluffton Fire District Ops
Estimated TY 2012 ad valorem revenues = $9,497,083
Millage = 20.49
Without a rollforward, the estimated TY 2013 ad valorem
revenues = $7,882,019
Revenue difference = ($1,615,064) or (17.01%)
Millage = 20.49
With a full rollforward, the estimated TY 2013 ad valorem
revenues = $9,497,660
Revenue difference = $577 or 0.01%
Millage = 24.69
22
Rollforward/Rollback by Taxing Entity:
Bluffton Fire District Debt
Estimated TY 2012 ad valorem revenues = $0
Millage = 0

23
Rollforward/Rollback by Taxing Entity:
Sheldon Fire District Ops
Estimated TY 2012 ad valorem revenues = $1,105,179
Millage = 33.11
Without a rollforward, the estimated TY 2013 ad valorem
revenues = $961,364
Revenue difference = ($143,815) or (13.01%)
Millage = 33.11
With a full rollforward, the estimated TY 2013 ad valorem
revenues = $1,105,090
Revenue difference = ($89) or (0.01%)
Millage = 38.06

24
Rollforward/Rollback by Taxing Entity:
Sheldon Fire District Debt
Estimated TY 2012 ad valorem revenues = $72,766
Millage = 2.18
Without a rollforward, the estimated TY 2013 ad valorem
revenues = $63,297
Revenue difference = ($9,469) or (13.01%)
Millage = 2.18
With a full rollforward, the estimated TY 2013 ad valorem
revenues = $72,879
Revenue difference = $113 or 0.15%
Millage = 2.51

25
Rollforward/Rollback by Taxing Entity:
Daufuskie Fire District Ops
Estimated TY 2012 ad valorem revenues = $980,118
Millage = 33.07
Without a rollforward, the estimated TY 2013 ad valorem
revenues = $892,428
Revenue difference = ($87,690) or (8.95%)
Millage = 33.07
With a full rollforward, the estimated TY 2013 ad valorem
revenues = $980,133
Revenue difference = $15 or 0.002%
Millage = 36.32

26
Rollforward/Rollback by Taxing Entity:
Daufuskie Fire District Debt
Estimated TY 2012 ad valorem revenues = $0
Millage = 0
27
Rollforward/Rollback by Taxing Entity:
Fripp Island PSD Ops
Estimated TY 2012 ad valorem revenues = $572,553
Millage = 10.60
Without a rollforward, the estimated TY 2013 ad valorem
revenues = $487,205
Revenue difference = ($85,348) or (14.91%)
Millage = 10.60
With a full rollforward, the estimated TY 2013 ad valorem
revenues = $572,696
Revenue difference = $143 or 0.02%
Millage = 12.46

28
Rollforward/Rollback by Taxing Entity:
Fripp Island PSD Debt
Estimated TY 2012 ad valorem revenues = $388,904
Millage = 7.20
Without a rollforward, the estimated TY 2013 ad valorem
revenues = $330,932
Revenue difference = ($57,972) or (14.91%)
Millage = 7.20
With a full rollforward, the estimated TY 2013 ad valorem
revenues = $388,845
Revenue difference = ($59) or (0.02%)
Millage = 8.46

29
Rollforward/Rollback by Taxing Entity:
Hilton Head #1 PSD Ops
Estimated TY 2012 ad valorem revenues = $1,011,187
Millage = 3.00
Without a rollforward, the estimated TY 2013 ad valorem
revenues = $878,198
Revenue difference = ($132,989) or (13.15%)
Millage = 3.00
With a full rollforward, the estimated TY 2013 ad valorem
revenues = $1,009,927
Revenue difference = ($1,259) or (0.12%)
Millage = 3.45

30
Rollforward/Rollback by Taxing Entity:
Hilton Head #1 PSD Debt
Estimated TY 2012 ad valorem revenues = $1,186,459
Millage = 3.52
Without a rollforward, the estimated TY 2013 ad valorem
revenues = $1,030,419
Revenue difference = ($156,040) or (13.15%)
Millage = 3.52
With a full rollforward, the estimated TY 2013 ad valorem
revenues = $1,185,567
Revenue difference = ($892) or (0.08%)
Millage = 4.05

31
Rollforward/Rollback by Taxing Entity:
Broad Creek PSD
Estimated TY 2012 ad valorem revenues = $1,579,321
Millage = 10.00
Without a rollforward, the estimated TY 2013 ad valorem
revenues = $1,436,635
Revenue difference = ($142,686) or (9.03%)
Millage = 10.00
With a full rollforward, the estimated TY 2013 ad valorem
revenues = $1,578,862
Revenue difference = ($459) or (0.03%)
Millage = 10.99

32
Rollforward/Rollback by Taxing Entity:
Town of Port Royal TIF II
Estimated TY 2012 ad valorem revenues = $0
Without a rollforward, the estimated TY 2013 ad valorem
revenues = ($2)
Revenue difference = ($2)
With a full rollforward, the estimated TY 2013 ad valorem
revenues = ($3)
Revenue difference = ($3)

33
Rollforward/Rollback by Taxing Entity:
City of Beaufort TIF II
Estimated TY 2012 ad valorem revenues = $2,060,222
Without a rollforward, the estimated TY 2013 ad valorem
revenues = $1,836,790
Revenue difference = ($223,432) or (10.85%)
With a full rollforward, the estimated TY 2013 ad valorem
revenues = $2,065,665
Revenue difference = $5,443 or 0.26%

34
Rollforward/Rollback by Taxing Entity:
Town of Hilton Head Island TIF
Estimated TY 2012 ad valorem revenues = $6,570,696
Without a rollforward, the estimated TY 2013 ad valorem
revenues = $5,039,591
Revenue difference = ($1,531,105) or (23.30%)
With a full rollforward, the estimated TY 2013 ad valorem
revenues = $5,725,686
Revenue difference = ($845,010) or (12.86%)
35
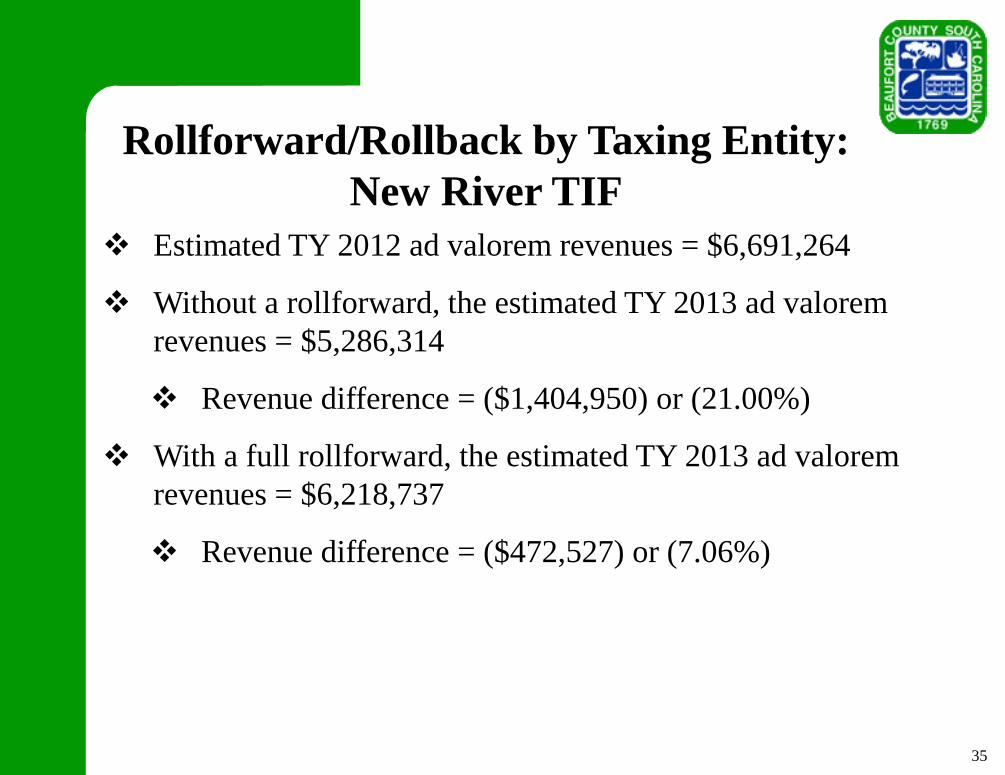
Rollforward/Rollback by Taxing Entity:
New River TIF
Estimated TY 2012 ad valorem revenues = $6,691,264
Without a rollforward, the estimated TY 2013 ad valorem
revenues = $5,286,314
Revenue difference = ($1,404,950) or (21.00%)
With a full rollforward, the estimated TY 2013 ad valorem
revenues = $6,218,737
Revenue difference = ($472,527) or (7.06%)
36
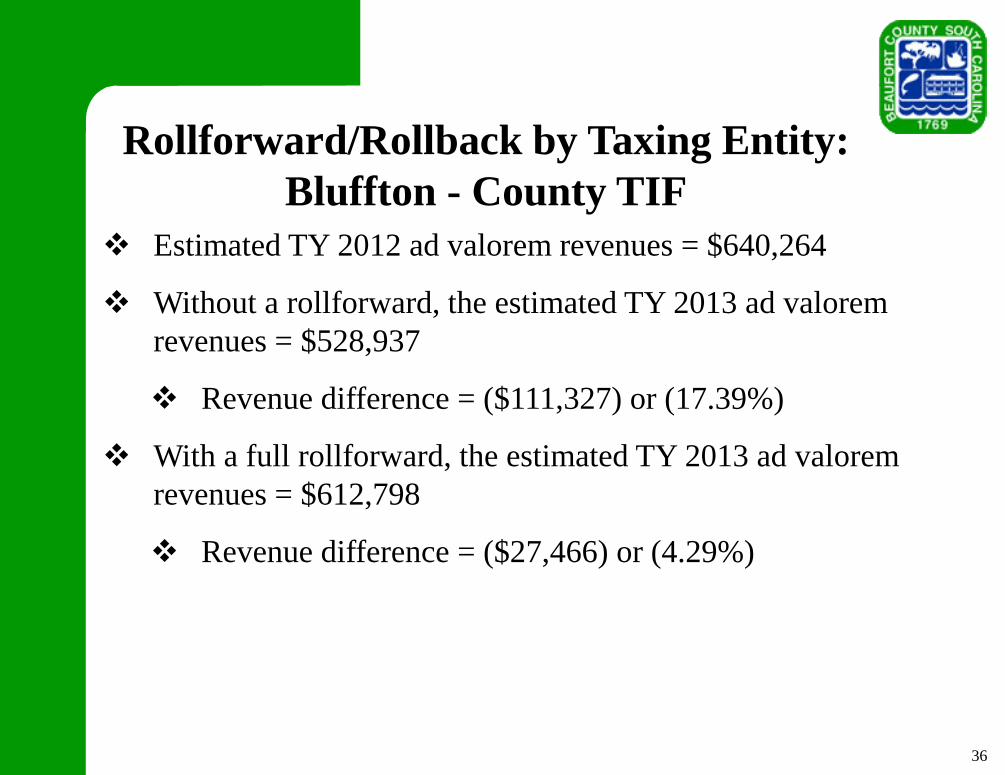
Rollforward/Rollback by Taxing Entity:
Bluffton - County TIF
Estimated TY 2012 ad valorem revenues = $640,264
Without a rollforward, the estimated TY 2013 ad valorem
revenues = $528,937
Revenue difference = ($111,327) or (17.39%)
With a full rollforward, the estimated TY 2013 ad valorem
revenues = $612,798
Revenue difference = ($27,466) or (4.29%)

37
TY 2011/FY 2012 Ad Valorem Tax
Collections by District
Billed, collected, and outstanding amounts detail all
corresponding taxing entities within each district
TIF districts only contain real property

38
TY 2011/FY 2012 Ad Valorem Tax
Collections by District
District 100: Unincorporated - Burton
Property Type Percentage Collected
Total Taxes Billed
Total Taxes Collected
Total Taxes Outstanding
Total Taxable Assessed Value
Real Property - 4% 98.73%
3,159,816
3,119,798
40,018
22,892,390
Real Property - 6% 95.66%
6,592,693
6,306,668
286,025
29,075,966
Personal Property 89.66%
2,533,185
2,271,321
261,864
11,464,390
Automobiles 76.60%
1,731,301
1,326,255
405,046
5,478,641
Total 92.92%
14,016,995
13,024,042
992,953
68,911,387 Percentage of Entire
County 4.36% 4.19% 9.46% 3.63%

39
TY 2011/FY 2012 Ad Valorem Tax
Collections by District
District 110: Town of Port Royal
Property Type Percentage Collected
Total Taxes Billed
Total Taxes Collected
Total Taxes Outstanding
Total Taxable Assessed Value
Real Property - 4% 97.91%
442,706
433,467
9,239
3,058,070
Real Property - 6% 97.42%
1,671,353
1,628,153
43,200
7,128,300
Personal Property 84.02%
480,916
404,049
76,867
2,080,970
Automobiles 76.53%
298,358
228,336
70,022
914,370
Total 93.11%
2,893,333
2,694,005
199,328
13,181,710 Percentage of Entire
County 0.90% 0.87% 1.90% 0.69%

40
TY 2011/FY 2012 Ad Valorem Tax
Collections by District
District 111: Town of Port Royal TIF I
Property Type Percentage Collected
Total Taxes Billed
Total Taxes Collected
Total Taxes Outstanding
Total Taxable Assessed Value
Real Property - 4% 100.00%
25,594
25,594 -
177,070
Real Property - 6% 96.44%
823,439
794,091
29,348
3,506,980
Total 96.54%
849,033
819,685
29,348
3,684,050 Percentage of Entire
County 0.26% 0.26% 0.28% 0.19%

41
TY 2011/FY 2012 Ad Valorem Tax
Collections by District
District 112: Town of Port Royal
Property Type Percentage Collected
Total Taxes Billed
Total Taxes Collected
Total Taxes Outstanding
Total Taxable Assessed Value
Real Property - 4% 99.90%
549,122
548,585
537
3,782,620
Real Property - 6% 94.94%
1,699,182
1,613,175
86,007
7,243,957
Personal Property 50.49%
26,549
13,405
13,144
127,040
Automobiles 66.47%
144,878
96,298
48,580
385,710
Total 93.87%
2,419,731
2,271,463
148,268
11,539,327 Percentage of Entire
County 0.75% 0.73% 1.41% 0.61%

42
TY 2011/FY 2012 Ad Valorem Tax
Collections by District
District 113: Town of Port Royal TIF II
Property Type Percentage Collected
Total Taxes Billed
Total Taxes Collected
Total Taxes Outstanding
Total Taxable Assessed Value
Real Property - 4% N/A -
-
-
-
Real Property - 6% 100.00%
4,212
4,212 -
17,940
Total 100.00%
4,212
4,212 -
17,940
Percentage of Entire County 0.00% 0.00% 0.00% 0.00%
43
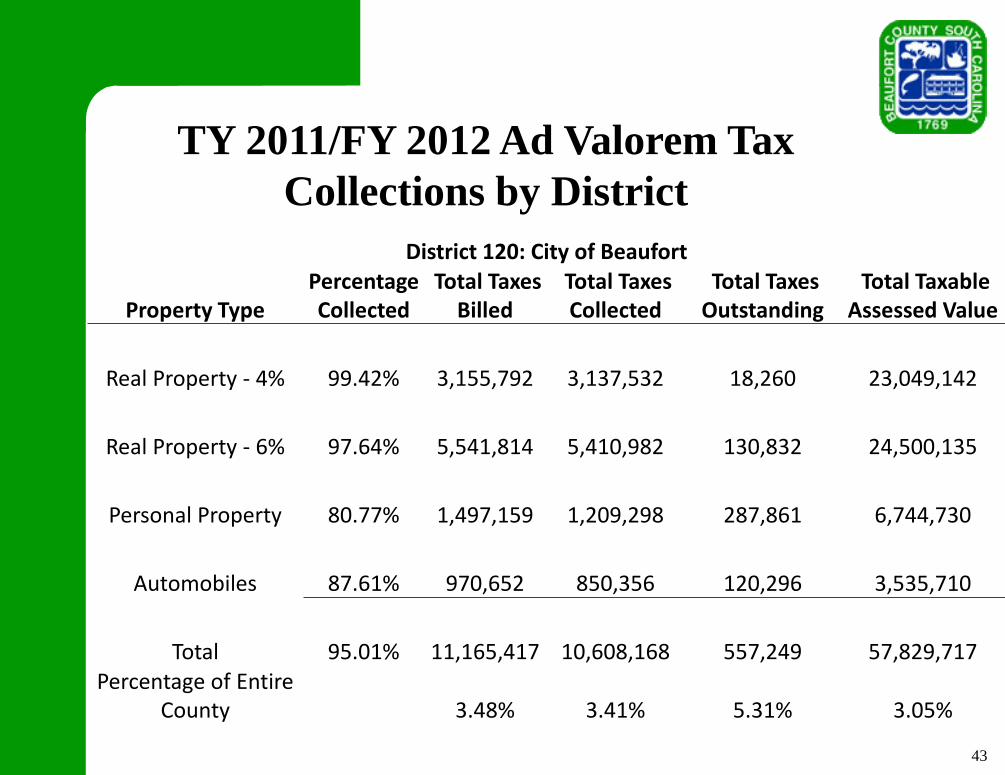
TY 2011/FY 2012 Ad Valorem Tax
Collections by District
District 120: City of Beaufort
Property Type Percentage Collected
Total Taxes Billed
Total Taxes Collected
Total Taxes Outstanding
Total Taxable Assessed Value
Real Property - 4% 99.42%
3,155,792
3,137,532
18,260
23,049,142
Real Property - 6% 97.64%
5,541,814
5,410,982
130,832
24,500,135
Personal Property 80.77%
1,497,159
1,209,298
287,861
6,744,730
Automobiles 87.61%
970,652
850,356
120,296
3,535,710
Total 95.01%
11,165,417
10,608,168
557,249
57,829,717 Percentage of Entire
County 3.48% 3.41% 5.31% 3.05%

44
TY 2011/FY 2012 Ad Valorem Tax
Collections by District
District 121: City of Beaufort TIF I
Property Type Percentage Collected
Total Taxes Billed
Total Taxes Collected
Total Taxes Outstanding
Total Taxable Assessed Value
Real Property - 4% 95.77%
73,424
70,321
3,103
525,200
Real Property - 6% 99.18%
1,051,449
1,042,789
8,660
4,643,800
Total 98.95%
1,124,873
1,113,110
11,763
5,169,000 Percentage of Entire
County 0.35% 0.36% 0.11% 0.27%

45
TY 2011/FY 2012 Ad Valorem Tax
Collections by District
District 122: City of Beaufort TIF II
Property Type Percentage Collected
Total Taxes Billed
Total Taxes Collected
Total Taxes Outstanding
Total Taxable Assessed Value
Real Property - 4% 100.00%
11,418
11,418 -
83,860
Real Property - 6% 98.99%
2,852,847
2,823,985
28,862
12,599,800
Total 98.99%
2,864,265
2,835,403
28,862
12,683,660 Percentage of Entire
County 0.89% 0.91% 0.27% 0.67%

46
TY 2011/FY 2012 Ad Valorem Tax
Collections by District
District 123: City of Beaufort - Ladys Island
Property Type Percentage Collected
Total Taxes Billed
Total Taxes Collected
Total Taxes Outstanding
Total Taxable Assessed Value
Real Property - 4% 95.59%
116,976
111,819
5,157
844,520
Real Property - 6% 85.80%
700,548
601,055
99,493
3,059,510
Personal Property 72.34%
6,761
4,891
1,870
30,460
Automobiles 93.93%
9,380
8,811
569
37,660
Total 87.15%
833,665
726,576
107,089
3,972,150 Percentage of Entire
County 0.26% 0.23% 1.02% 0.21%

47
TY 2011/FY 2012 Ad Valorem Tax
Collections by District
District 200: Unincorporated - Ladys Island
Property Type Percentage Collected
Total Taxes Billed
Total Taxes Collected
Total Taxes Outstanding
Total Taxable Assessed Value
Real Property - 4% 99.32%
4,275,706
4,246,422
29,284
38,860,749
Real Property - 6% 97.87%
5,746,447
5,624,012
122,435
28,908,164
Personal Property 85.02%
984,640
837,128
147,512
5,098,740
Automobiles 87.66%
1,177,807
1,032,475
145,332
4,861,450
Total 96.35%
12,184,600
11,740,037
444,563
77,729,103 Percentage of Entire
County 3.79% 3.78% 4.23% 4.10%

48
TY 2011/FY 2012 Ad Valorem Tax
Collections by District
District 201: Unincorporated - Ladys Island
Property Type Percentage Collected
Total Taxes Billed
Total Taxes Collected
Total Taxes Outstanding
Total Taxable Assessed Value
Real Property - 4% N/A -
-
-
-
Real Property - 6% 100.00%
407
407 -
2,040
Personal Property 97.51%
963
939
24
4,830
Automobiles 91.41%
6,763
6,182
581
29,930
Total 92.56%
8,133
7,528
605
36,800 Percentage of Entire
County 0.00% 0.00% 0.01% 0.00%

49
TY 2011/FY 2012 Ad Valorem Tax
Collections by District
District 300: Unincorporated - St. Helena
Property Type Percentage Collected
Total Taxes Billed
Total Taxes Collected
Total Taxes Outstanding
Total Taxable Assessed Value
Real Property - 4% 98.12%
2,401,359
2,356,160
45,199
21,855,073
Real Property - 6% 97.38%
6,833,016
6,653,918
179,098
34,383,538
Personal Property 90.35%
711,218
642,600
68,618
3,717,280
Automobiles 91.05%
685,570
624,203
61,367
3,003,500
Total 96.67%
10,631,163
10,276,881
354,282
62,959,391 Percentage of Entire
County 3.31% 3.31% 3.37% 3.32%

50
TY 2011/FY 2012 Ad Valorem Tax
Collections by District
District 400: Unincorporated - Fripp Island
Property Type Percentage Collected
Total Taxes Billed
Total Taxes Collected
Total Taxes Outstanding
Total Taxable Assessed Value
Real Property - 4% 99.49%
706,384
702,786
3,598
7,566,160
Real Property - 6% 99.18%
8,150,436
8,083,833
66,603
44,398,710
Personal Property 82.90%
237,340
196,753
40,587
1,378,040
Automobiles 91.68%
119,806
109,835
9,971
562,390
Total 98.69%
9,213,966
9,093,207
120,759
53,905,300 Percentage of Entire
County 2.87% 2.93% 1.15% 2.84%

51
TY 2011/FY 2012 Ad Valorem Tax
Collections by District
District 501: Unincorporated - Hilton Head Island
Property Type Percentage Collected
Total Taxes Billed
Total Taxes Collected
Total Taxes Outstanding
Total Taxable Assessed Value
Real Property - 4% 99.90%
832,490
831,658
832
8,145,690
Real Property - 6% 97.79%
1,597,611
1,562,264
35,347
8,323,910
Personal Property 87.59%
143,797
125,952
17,845
783,720
Automobiles 90.02%
126,357
113,747
12,610
562,160
Total 97.53%
2,700,255
2,633,621
66,634
17,815,480 Percentage of Entire
County 0.84% 0.85% 0.63% 0.94%

52
TY 2011/FY 2012 Ad Valorem Tax
Collections by District
District 510: Town of Hilton Head Island - Hilton Head #1 PSD
Property Type Percentage Collected
Total Taxes Billed
Total Taxes Collected
Total Taxes Outstanding
Total Taxable Assessed Value
Real Property - 4% 99.64%
12,325,996
12,281,534
44,462
121,343,180
Real Property - 6% 98.52%
30,416,823
29,966,222
450,601
158,791,201
Personal Property 80.01%
3,396,763
2,717,742
679,021
18,501,610
Automobiles 88.16%
3,021,195
2,663,426
357,769
13,182,980
Total 96.88%
49,160,777
47,628,924
1,531,853
311,818,971 Percentage of Entire
County 15.30% 15.32% 14.59% 16.43%
53
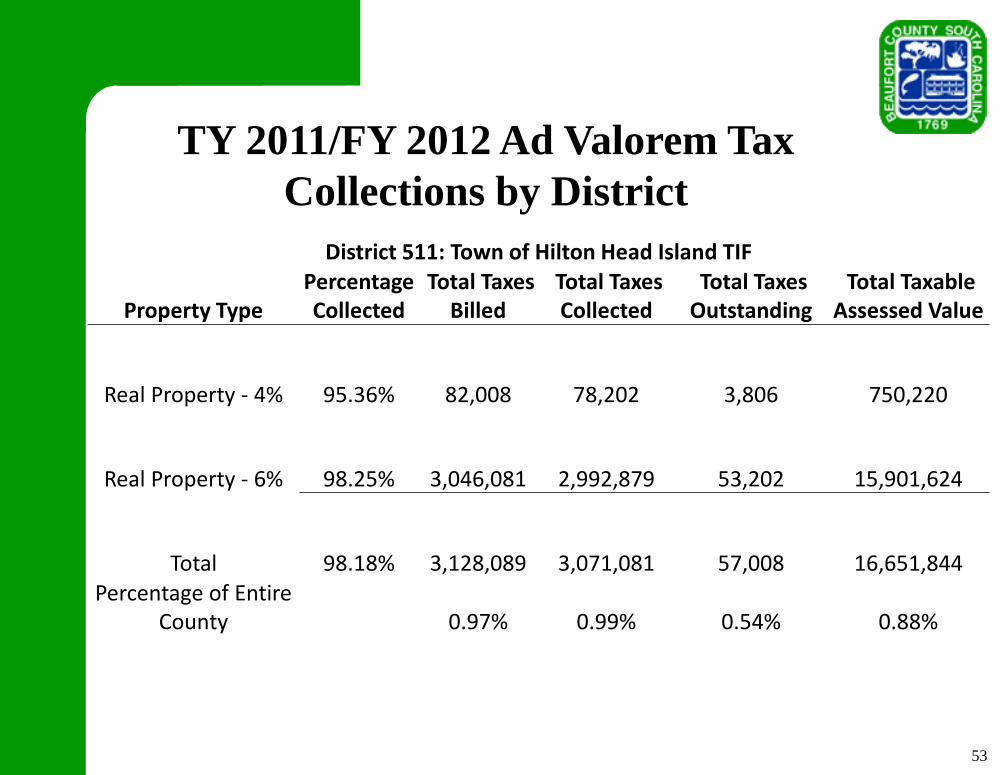
TY 2011/FY 2012 Ad Valorem Tax
Collections by District
District 511: Town of Hilton Head Island TIF
Property Type Percentage Collected
Total Taxes Billed
Total Taxes Collected
Total Taxes Outstanding
Total Taxable Assessed Value
Real Property - 4% 95.36%
82,008
78,202
3,806
750,220
Real Property - 6% 98.25%
3,046,081
2,992,879
53,202
15,901,624
Total 98.18%
3,128,089
3,071,081
57,008
16,651,844 Percentage of Entire
County 0.97% 0.99% 0.54% 0.88%
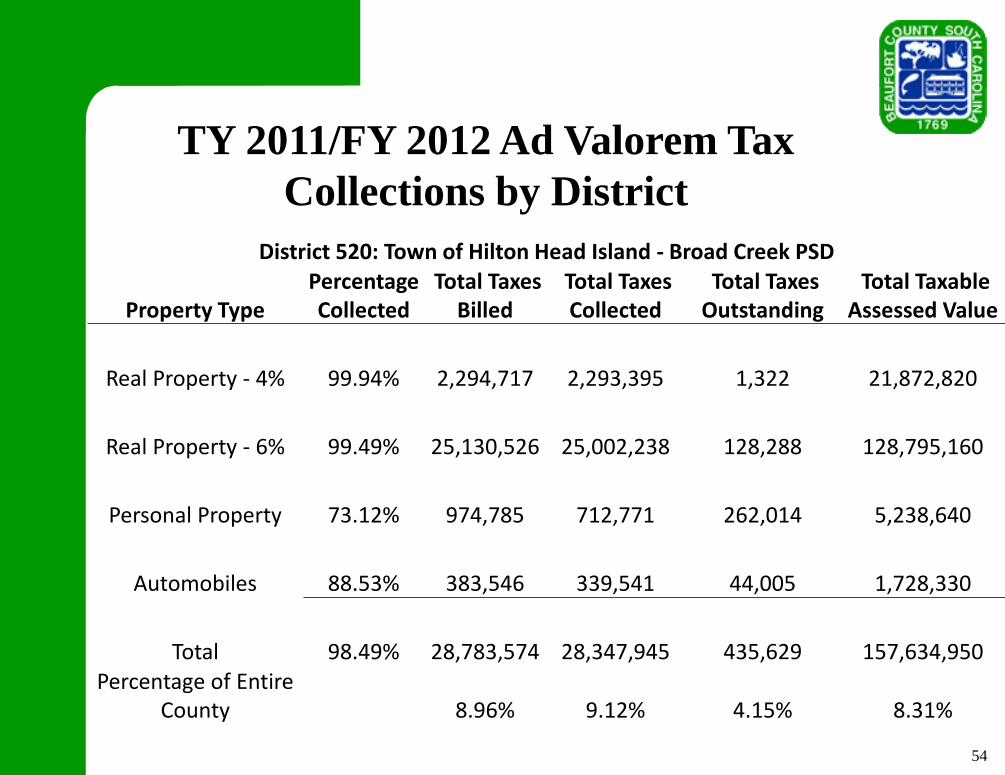
54
TY 2011/FY 2012 Ad Valorem Tax
Collections by District
District 520: Town of Hilton Head Island - Broad Creek PSD
Property Type Percentage Collected
Total Taxes Billed
Total Taxes Collected
Total Taxes Outstanding
Total Taxable Assessed Value
Real Property - 4% 99.94%
2,294,717
2,293,395
1,322
21,872,820
Real Property - 6% 99.49%
25,130,526
25,002,238
128,288
128,795,160
Personal Property 73.12%
974,785
712,771
262,014
5,238,640
Automobiles 88.53%
383,546
339,541
44,005
1,728,330
Total 98.49%
28,783,574
28,347,945
435,629
157,634,950 Percentage of Entire
County 8.96% 9.12% 4.15% 8.31%

55
TY 2011/FY 2012 Ad Valorem Tax
Collections by District
District 550: Town of Hilton Head Island
Property Type Percentage Collected
Total Taxes Billed
Total Taxes Collected
Total Taxes Outstanding
Total Taxable Assessed Value
Real Property - 4% 99.90%
9,434,932
9,425,506
9,426
99,285,457
Real Property - 6% 99.56%
52,515,745
52,285,935
229,810
283,697,130
Personal Property 68.04%
2,562,962
1,743,802
819,160
14,694,730
Automobiles 90.94%
1,838,791
1,672,211
166,580
8,550,370
Total 98.15%
66,352,430
65,127,454
1,224,976
406,227,687 Percentage of Entire
County 20.65% 20.95% 11.67% 21.40%

56
TY 2011/FY 2012 Ad Valorem Tax
Collections by District
District 552: Town of Hilton Head Island TIF
Property Type Percentage Collected
Total Taxes Billed
Total Taxes Collected
Total Taxes Outstanding
Total Taxable Assessed Value
Real Property - 4% 98.20%
53,687
52,720
967
565,900
Real Property - 6% 96.79%
5,671,772
5,489,878
181,894
30,636,680
Total 96.81%
5,725,459
5,542,598
182,861
31,202,580 Percentage of Entire
County 1.78% 1.78% 1.74% 1.64%

57
TY 2011/FY 2012 Ad Valorem Tax
Collections by District
District 553: Town of Hilton Head Island TIF
Property Type Percentage Collected
Total Taxes Billed
Total Taxes Collected
Total Taxes Outstanding
Total Taxable Assessed Value
Real Property - 4% 99.39%
142,563
141,687
876
1,499,450
Real Property - 6% 97.39%
5,210,398
5,074,355
136,043
28,144,500
Total 97.44%
5,352,961
5,216,042
136,919
29,643,950 Percentage of Entire
County 1.67% 1.68% 1.30% 1.56%

58
TY 2011/FY 2012 Ad Valorem Tax
Collections by District
District 600: Unincorporated - Bluffton
Property Type Percentage Collected
Total Taxes Billed
Total Taxes Collected
Total Taxes Outstanding
Total Taxable Assessed Value
Real Property - 4% 99.61%
12,518,448
12,470,082
48,366
129,972,198
Real Property - 6% 97.42%
23,652,986
23,043,811
609,175
127,475,141
Personal Property 84.55%
3,347,504
2,830,404
517,100
18,541,330
Automobiles 90.36%
4,525,259
4,089,237
436,022
20,724,415
Total 96.34%
44,044,197
42,433,534
1,610,663
296,713,084 Percentage of Entire
County 13.71% 13.65% 15.34% 15.63%

59
TY 2011/FY 2012 Ad Valorem Tax
Collections by District
District 601: Unincorporated - Bluffton - County TIF
Property Type Percentage Collected
Total Taxes Billed
Total Taxes Collected
Total Taxes Outstanding
Total Taxable Assessed Value
Real Property - 4% 98.71%
25,586
25,257
329
267,660
Real Property - 6% 99.38%
1,651,545
1,641,312
10,233
8,886,550
Total 99.37%
1,677,131
1,666,569
10,562
9,154,210 Percentage of Entire
County 0.52% 0.54% 0.10% 0.48%

60
TY 2011/FY 2012 Ad Valorem Tax
Collections by District
District 602: Unincorporated - Bluffton - County TIF
Property Type Percentage Collected
Total Taxes Billed
Total Taxes Collected
Total Taxes Outstanding
Total Taxable Assessed Value
Real Property - 4% 93.95%
529
497
32
5,530
Real Property - 6% 99.30%
17,580
17,457
123
94,590
Total 99.14%
18,109
17,954
155
100,120 Percentage of Entire
County 0.01% 0.01% 0.00% 0.01%

61
TY 2011/FY 2012 Ad Valorem Tax
Collections by District
District 603: Unincorporated - New River TIF
Property Type Percentage Collected
Total Taxes Billed
Total Taxes Collected
Total Taxes Outstanding
Total Taxable Assessed Value
Real Property - 4% 99.96%
2,256,754
2,255,945
809
23,531,912
Real Property - 6% 99.26%
3,762,673
3,734,690
27,983
20,267,153
Total 99.52%
6,019,427
5,990,635
28,792
43,799,065 Percentage of Entire
County 1.87% 1.93% 0.27% 2.31%

62
TY 2011/FY 2012 Ad Valorem Tax
Collections by District
District 610: Town of Bluffton
Property Type Percentage Collected
Total Taxes Billed
Total Taxes Collected
Total Taxes Outstanding
Total Taxable Assessed Value
Real Property - 4% 99.15%
2,118,582
2,100,574
18,008
15,810,070
Real Property - 6% 93.69%
7,148,026
6,696,957
451,069
31,955,839
Personal Property 79.05%
2,815,977
2,226,111
589,866
13,178,040
Automobiles 86.00%
1,773,282
1,525,052
248,230
6,372,315
Total 90.57%
13,855,867
12,548,694
1,307,173
67,316,264 Percentage of Entire
County 4.31% 4.04% 12.45% 3.55%

63
TY 2011/FY 2012 Ad Valorem Tax
Collections by District
District 611: Town of Bluffton - Bluffton - County TIF
Property Type Percentage Collected
Total Taxes Billed
Total Taxes Collected
Total Taxes Outstanding
Total Taxable Assessed Value
Real Property - 4% 99.28%
42,949
42,639
310
318,720
Real Property - 6% 97.21%
247,399
240,507
6,892
1,113,780
Total 97.52%
290,348
283,146
7,202
1,432,500 Percentage of Entire
County 0.09% 0.09% 0.07% 0.08%
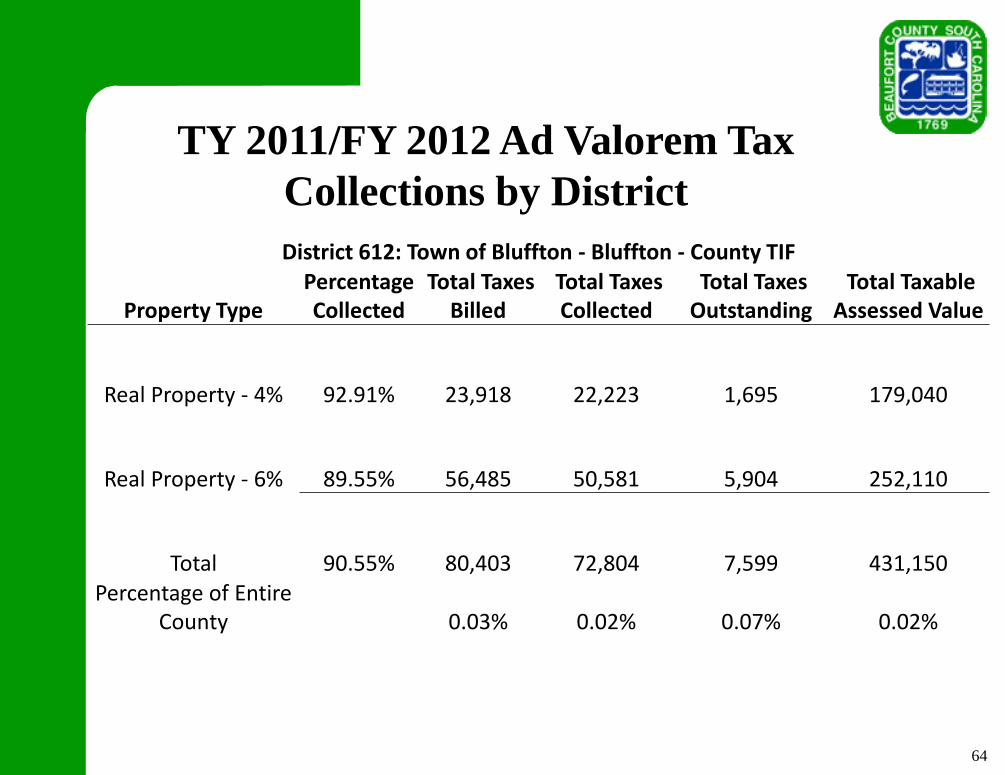
64
TY 2011/FY 2012 Ad Valorem Tax
Collections by District
District 612: Town of Bluffton - Bluffton - County TIF
Property Type Percentage Collected
Total Taxes Billed
Total Taxes Collected
Total Taxes Outstanding
Total Taxable Assessed Value
Real Property - 4% 92.91%
23,918
22,223
1,695
179,040
Real Property - 6% 89.55%
56,485
50,581
5,904
252,110
Total 90.55%
80,403
72,804
7,599
431,150 Percentage of Entire
County 0.03% 0.02% 0.07% 0.02%

65
TY 2011/FY 2012 Ad Valorem Tax
Collections by District
District 613: Town of Bluffton - New River TIF
Property Type Percentage Collected
Total Taxes Billed
Total Taxes Collected
Total Taxes Outstanding
Total Taxable Assessed Value
Real Property - 4% 100.00%
2,506
2,506 -
18,760
Real Property - 6% 99.98%
117,193
117,175
18
523,530
Total 99.98%
119,699
119,681
18
542,290 Percentage of Entire
County 0.04% 0.04% 0.00% 0.03%

66
TY 2011/FY 2012 Ad Valorem Tax
Collections by District
District 614: Town of Bluffton - Town of Bluffton TIF
Property Type Percentage Collected
Total Taxes Billed
Total Taxes Collected
Total Taxes Outstanding
Total Taxable Assessed Value
Real Property - 4% N/A
2,873,487
2,872,297
1,190
21,460,620
Real Property - 6% 98.60%
10,835,837
10,684,628
151,209
48,460,652
Total 98.89%
13,709,324
13,556,925
152,399
69,921,272 Percentage of Entire
County 4.27% 4.36% 1.45% 3.68%

67
TY 2011/FY 2012 Ad Valorem Tax
Collections by District
District 615: Town of Bluffton - Bluffton - County TIF
Property Type Percentage Collected
Total Taxes Billed
Total Taxes Collected
Total Taxes Outstanding
Total Taxable Assessed Value
Real Property - 4% 100.00%
1,047
1,047 -
6,870
Real Property - 6% 100.00%
6,377
6,377 -
28,490
Total 100.00%
7,424
7,424 -
35,360
Percentage of Entire County 0.00% 0.00% 0.00% 0.00%

68
TY 2011/FY 2012 Ad Valorem Tax
Collections by District
District 616: Town of Bluffton - Bluffton - County TIF
Property Type Percentage Collected
Total Taxes Billed
Total Taxes Collected
Total Taxes Outstanding
Total Taxable Assessed Value
Real Property - 4% N/A -
-
-
-
Real Property - 6% 100.00%
14,747
14,747 -
65,880
Total 100.00%
14,747
14,747 -
65,880
Percentage of Entire County 0.00% 0.00% 0.00% 0.00%

69
TY 2011/FY 2012 Ad Valorem Tax
Collections by District
District 617: Town of Bluffton - New River TIF
Property Type Percentage Collected
Total Taxes Billed
Total Taxes Collected
Total Taxes Outstanding
Total Taxable Assessed Value
Real Property - 4% N/A -
-
-
-
Real Property - 6% 99.98%
221,166
221,119
47
988,010
Total 99.98%
221,166
221,119
47
988,010 Percentage of Entire
County 0.07% 0.07% 0.00% 0.05%
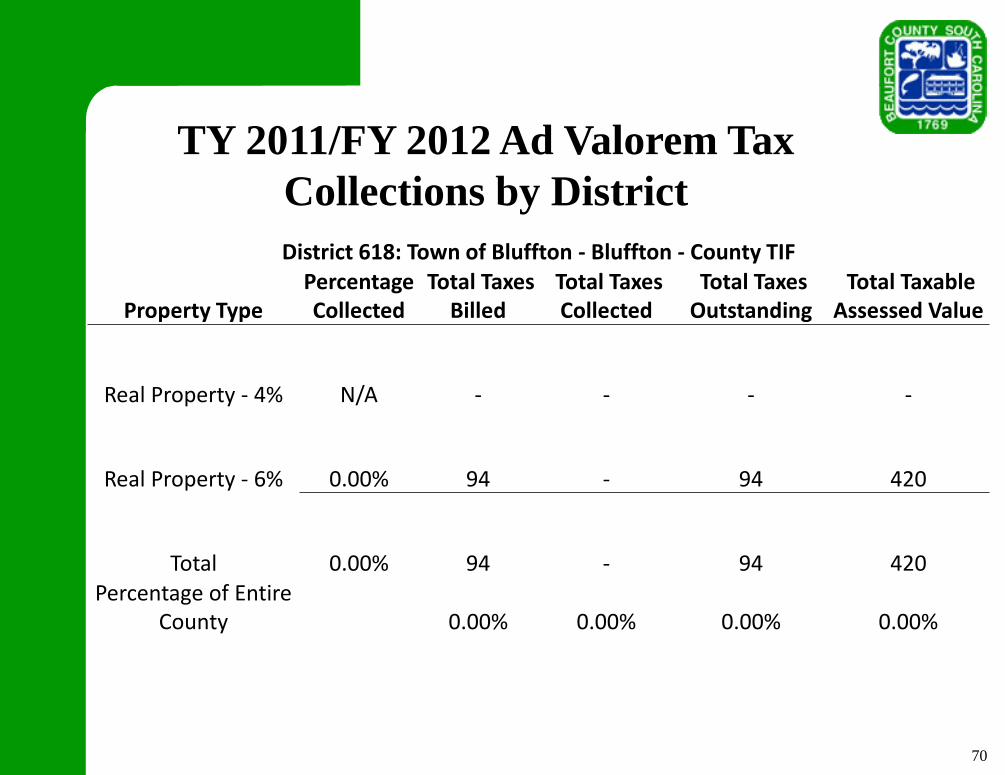
70
TY 2011/FY 2012 Ad Valorem Tax
Collections by District
District 618: Town of Bluffton - Bluffton - County TIF
Property Type Percentage Collected
Total Taxes Billed
Total Taxes Collected
Total Taxes Outstanding
Total Taxable Assessed Value
Real Property - 4% N/A -
-
-
-
Real Property - 6% 0.00%
94 -
94
420
Total 0.00%
94 -
94
420
Percentage of Entire County 0.00% 0.00% 0.00% 0.00%

71
TY 2011/FY 2012 Ad Valorem Tax
Collections by District
District 619: Town of Bluffton - Bluffton - County TIF
Property Type Percentage Collected
Total Taxes Billed
Total Taxes Collected
Total Taxes Outstanding
Total Taxable Assessed Value
Real Property - 4% N/A -
-
-
-
Real Property - 6% 100.00% -
-
-
-
Total 100.00% -
-
-
-
Percentage of Entire County 0.00% 0.00% 0.00% 0.00%

72
TY 2011/FY 2012 Ad Valorem Tax
Collections by District
District 620: Town of Bluffton
Property Type Percentage Collected
Total Taxes Billed
Total Taxes Collected
Total Taxes Outstanding
Total Taxable Assessed Value
Real Property - 4% N/A -
-
-
-
Real Property - 6% 100.00%
38
38 -
170
Personal Property N/A -
-
-
-
Automobiles N/A -
-
-
-
Total 100.00%
38
38 -
170
Percentage of Entire County 0.00% 0.00% 0.00% 0.00%

73
TY 2011/FY 2012 Ad Valorem Tax
Collections by District
District 621: Town of Bluffton - Bluffton - County TIF
Property Type Percentage Collected
Total Taxes Billed
Total Taxes Collected
Total Taxes Outstanding
Total Taxable Assessed Value
Real Property - 4% N/A -
-
-
-
Real Property - 6% 100.00%
7,564
7,564 -
33,790
Total 100.00%
7,564
7,564 -
33,790
Percentage of Entire County 0.00% 0.00% 0.00% 0.00%

74
TY 2011/FY 2012 Ad Valorem Tax
Collections by District
District 622: Town of Bluffton
Property Type Percentage Collected
Total Taxes Billed
Total Taxes Collected
Total Taxes Outstanding
Total Taxable Assessed Value
Real Property - 4% N/A -
-
-
-
Real Property - 6% 100.00% -
-
-
-
Personal Property N/A -
-
-
-
Automobiles N/A -
-
-
-
Total 100.00% -
-
-
-
Percentage of Entire County 0.00% 0.00% 0.00% 0.00%
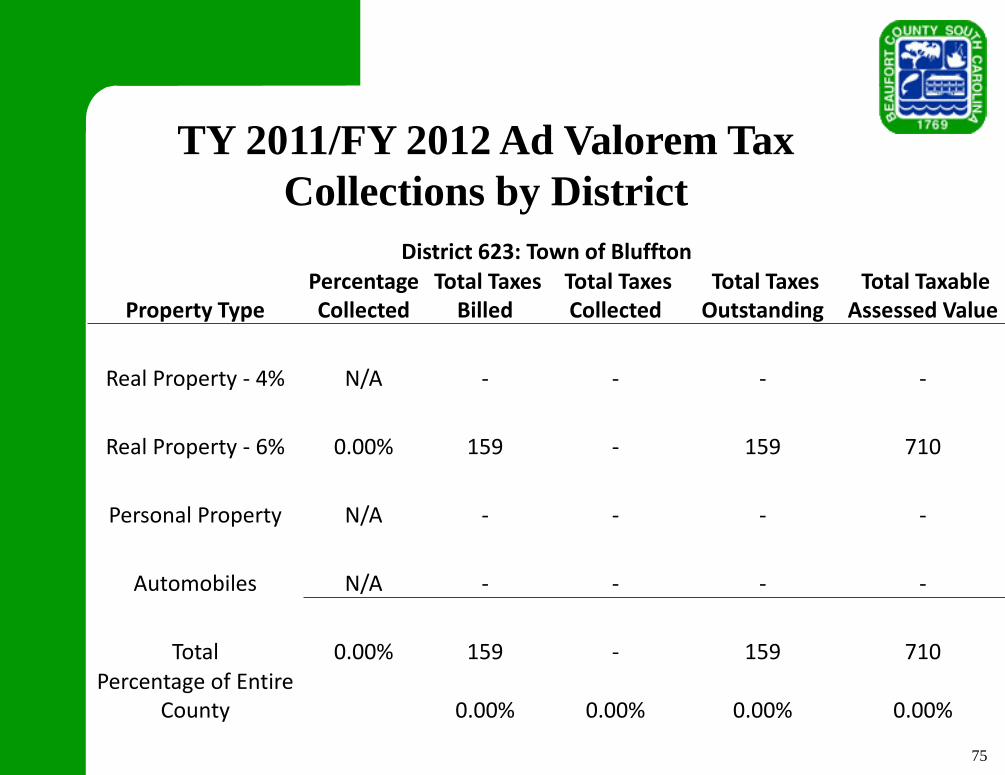
75
TY 2011/FY 2012 Ad Valorem Tax
Collections by District
District 623: Town of Bluffton
Property Type Percentage Collected
Total Taxes Billed
Total Taxes Collected
Total Taxes Outstanding
Total Taxable Assessed Value
Real Property - 4% N/A -
-
-
-
Real Property - 6% 0.00%
159 -
159
710
Personal Property N/A -
-
-
-
Automobiles N/A -
-
-
-
Total 0.00%
159 -
159
710
Percentage of Entire County 0.00% 0.00% 0.00% 0.00%

76
TY 2011/FY 2012 Ad Valorem Tax
Collections by District
District 624: Town of Bluffton - Bluffton - County TIF
Property Type Percentage Collected
Total Taxes Billed
Total Taxes Collected
Total Taxes Outstanding
Total Taxable Assessed Value
Real Property - 4% N/A -
-
-
-
Real Property - 6% 100.00%
16,854
16,854 -
75,290
Total 100.00%
16,854
16,854 -
75,290
Percentage of Entire County 0.01% 0.01% 0.00% 0.00%

77
TY 2011/FY 2012 Ad Valorem Tax
Collections by District
District 650: Town of Hardeeville
Property Type Percentage Collected
Total Taxes Billed
Total Taxes Collected
Total Taxes Outstanding
Total Taxable Assessed Value
Real Property - 4% N/A -
-
-
-
Real Property - 6% N/A -
-
-
-
Personal Property 100.00%
1,323
1,323 -
4,150
Automobiles 100.00%
188
188 -
590
Total 100.00%
1,511
1,511 -
4,740
Percentage of Entire County 0.00% 0.00% 0.00% 0.00%

78
TY 2011/FY 2012 Ad Valorem Tax
Collections by District
District 651: Town of Hardeeville - New River TIF
Property Type Percentage Collected
Total Taxes Billed
Total Taxes Collected
Total Taxes Outstanding
Total Taxable Assessed Value
Real Property - 4% N/A -
-
-
-
Real Property - 6% 100.00%
261,792
261,792 -
821,180
Total 100.00%
261,792
261,792 -
821,180
Percentage of Entire County 0.08% 0.08% 0.00% 0.04%

79
TY 2011/FY 2012 Ad Valorem Tax
Collections by District
District 700: Unincorporated - Sheldon
Property Type Percentage Collected
Total Taxes Billed
Total Taxes Collected
Total Taxes Outstanding
Total Taxable Assessed Value
Real Property - 4% 98.69%
1,099,586
1,085,181
14,405
9,754,413
Real Property - 6% 96.20%
4,098,324
3,942,681
155,643
20,502,170
Personal Property 92.54%
292,375
270,565
21,810
1,589,690
Automobiles 89.79%
312,475
280,584
31,891
1,329,335
Total 96.14%
5,802,760
5,579,011
223,749
33,175,608 Percentage of Entire
County 1.81% 1.80% 2.13% 1.75%

80
TY 2011/FY 2012 Ad Valorem Tax
Collections by District
District 710: Town of Yemassee
Property Type Percentage Collected
Total Taxes Billed
Total Taxes Collected
Total Taxes Outstanding
Total Taxable Assessed Value
Real Property - 4% 68.99%
1,764
1,217
547
12,120
Real Property - 6% 91.37%
46,638
42,613
4,025
202,130
Personal Property 96.56%
33,606
32,451
1,155
142,520
Automobiles 95.93%
4,522
4,338
184
17,050
Total 93.17%
86,530
80,619
5,911
373,820 Percentage of Entire
County 0.03% 0.03% 0.06% 0.02%
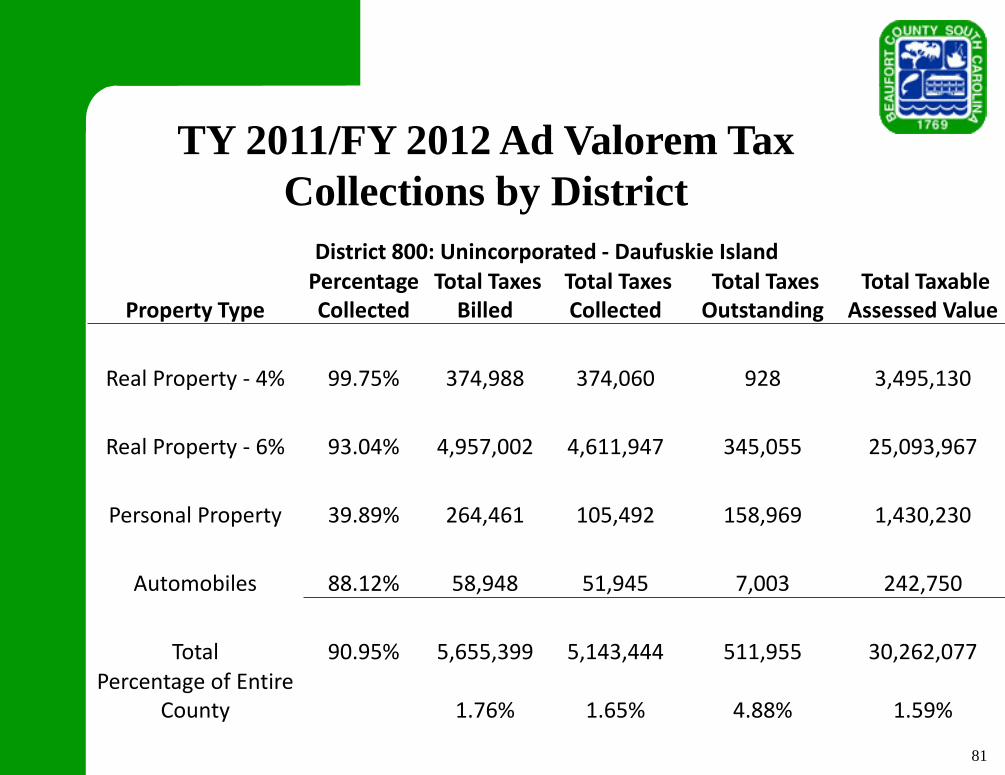
81
TY 2011/FY 2012 Ad Valorem Tax
Collections by District
District 800: Unincorporated - Daufuskie Island
Property Type Percentage Collected
Total Taxes Billed
Total Taxes Collected
Total Taxes Outstanding
Total Taxable Assessed Value
Real Property - 4% 99.75%
374,988
374,060
928
3,495,130
Real Property - 6% 93.04%
4,957,002
4,611,947
345,055
25,093,967
Personal Property 39.89%
264,461
105,492
158,969
1,430,230
Automobiles 88.12%
58,948
51,945
7,003
242,750
Total 90.95%
5,655,399
5,143,444
511,955
30,262,077 Percentage of Entire
County 1.76% 1.65% 4.88% 1.59%

82
TY 2011/FY 2012 Ad Valorem Tax
Collections by District
Total
Property Type Percentage Collected
Total Taxes Billed
Total Taxes Collected
Total Taxes Outstanding
Total Taxable Assessed Value
Real Property - 4% 99.5%
61,424,834
61,122,129
302,705
580,990,614
Real Property - 6% 98.2%
222,377,278
218,313,901
4,063,377
1,140,600,597
Personal Property 80.5%
20,312,284
16,346,997
3,965,287
104,751,140
Automobiles 87.4%
17,189,078
15,023,020
2,166,058
71,519,656
Total 96.7%
321,303,474
310,806,047
10,497,427
1,897,862,007
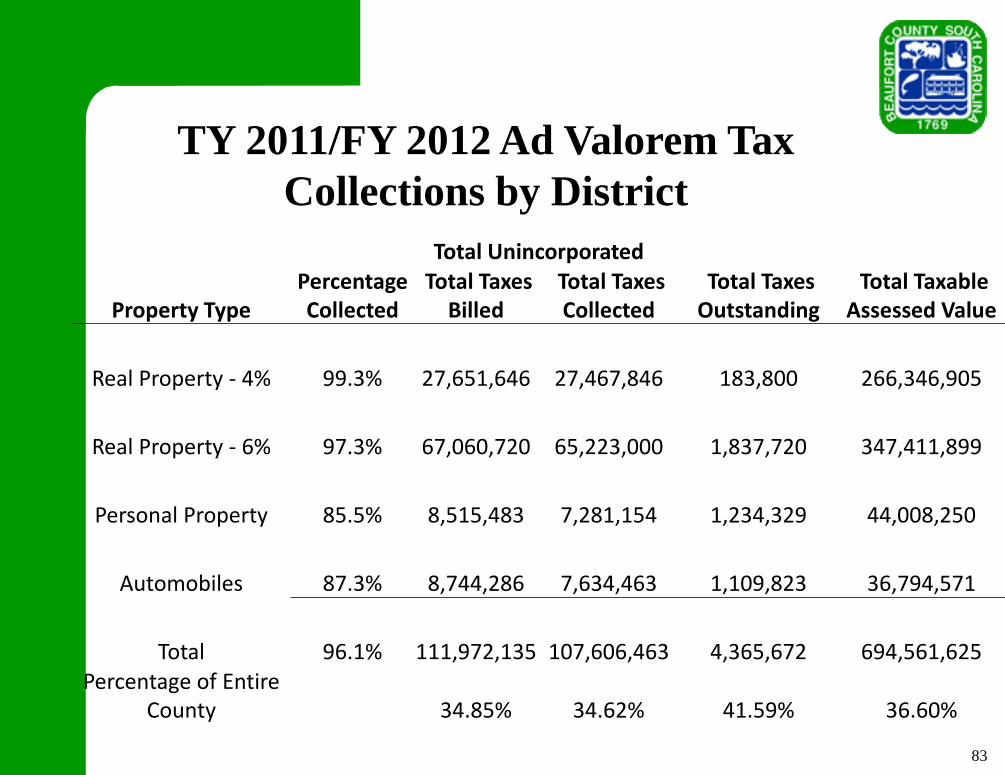
83
TY 2011/FY 2012 Ad Valorem Tax
Collections by District
Total Unincorporated
Property Type Percentage Collected
Total Taxes Billed
Total Taxes Collected
Total Taxes Outstanding
Total Taxable Assessed Value
Real Property - 4% 99.3%
27,651,646
27,467,846
183,800
266,346,905
Real Property - 6% 97.3%
67,060,720
65,223,000
1,837,720
347,411,899
Personal Property 85.5%
8,515,483
7,281,154
1,234,329
44,008,250
Automobiles 87.3%
8,744,286
7,634,463
1,109,823
36,794,571
Total 96.1%
111,972,135
107,606,463
4,365,672
694,561,625 Percentage of Entire
County 34.85% 34.62% 41.59% 36.60%

84
TY 2011/FY 2012 Ad Valorem Tax
Collections by District
Total Town of Port Royal
Property Type Percentage Collected
Total Taxes Billed
Total Taxes Collected
Total Taxes Outstanding
Total Taxable Assessed Value
Real Property - 4% 99.0%
1,017,422
1,007,646
9,776
7,017,760
Real Property - 6% 96.2%
4,198,186
4,039,631
158,555
17,897,177
Personal Property 82.3%
507,465
417,454
90,011
2,208,010
Automobiles 73.2%
443,236
324,634
118,602
1,300,080
Total 93.9%
6,166,309
5,789,365
376,944
28,423,027 Percentage of Entire
County 1.92% 1.86% 3.59% 1.50%

85
TY 2011/FY 2012 Ad Valorem Tax
Collections by District
Total City of Beaufort
Property Type Percentage Collected
Total Taxes Billed
Total Taxes Collected
Total Taxes Outstanding
Total Taxable Assessed Value
Real Property - 4% 99.2%
3,357,610
3,331,090
26,520
24,502,722
Real Property - 6% 97.4%
10,146,658
9,878,811
267,847
44,803,245
Personal Property 80.7%
1,503,920
1,214,189
289,731
6,775,190
Automobiles 87.7%
980,032
859,167
120,865
3,573,370
Total 95.6%
15,988,220
15,283,257
704,963
79,654,527 Percentage of Entire
County 4.98% 4.92% 6.72% 4.20%

86
TY 2011/FY 2012 Ad Valorem Tax
Collections by District
Total Town of Hilton Head Island
Property Type Percentage Collected
Total Taxes Billed
Total Taxes Collected
Total Taxes Outstanding
Total Taxable Assessed Value
Real Property - 4% 99.7%
24,333,903
24,273,044
60,859
245,317,027
Real Property - 6% 99.0%
121,991,345
120,811,507
1,179,838
645,966,295
Personal Property 74.6%
6,934,510
5,174,315
1,760,195
38,434,980
Automobiles 89.2%
5,243,532
4,675,178
568,354
23,461,680
Total 97.7%
158,503,290
154,934,044
3,569,246
953,179,982 Percentage of Entire
County 49.33% 49.85% 34.00% 50.22%

87
TY 2011/FY 2012 Ad Valorem Tax
Collections by District
Total Town of Bluffton
Property Type Percentage Collected
Total Taxes Billed
Total Taxes Collected
Total Taxes Outstanding
Total Taxable Assessed Value
Real Property - 4% 99.6%
5,062,489
5,041,286
21,203
37,794,080
Real Property - 6% 96.7%
18,671,939
18,056,547
615,392
83,498,671
Personal Property 79.1%
2,815,977
2,226,111
589,866
13,178,040
Automobiles 86.0%
1,773,282
1,525,052
248,230
6,372,315
Total 94.8%
28,323,687
26,848,996
1,474,691
140,843,106 Percentage of Entire
County 8.82% 8.64% 14.05% 7.42%

88
TY 2011/FY 2012 Ad Valorem Tax
Collections by District
Total Town of Hardeeville
Property Type Percentage Collected
Total Taxes Billed
Total Taxes Collected
Total Taxes Outstanding
Total Taxable Assessed Value
Real Property - 4% N/A -
-
-
-
Real Property - 6% 100.0%
261,792
261,792 -
821,180
Personal Property 100.0%
1,323
1,323 -
4,150
Automobiles 100.0%
188
188 -
590
Total 100.0%
263,303
263,303 -
825,920
Percentage of Entire County 0.08% 0.08% 0.00% 0.04%

89
TY 2011/FY 2012 Ad Valorem Tax
Collections by District
Total Town of Yemassee
Property Type Percentage Collected
Total Taxes Billed
Total Taxes Collected
Total Taxes Outstanding
Total Taxable Assessed Value
Real Property - 4% 69.0%
1,764
1,217
547
12,120
Real Property - 6% 91.4%
46,638
42,613
4,025
202,130
Personal Property 96.6%
33,606
32,451
1,155
142,520
Automobiles 95.9%
4,522
4,338
184
17,050
Total 93.2%
86,530
80,619
5,911
373,820 Percentage of Entire
County 0.03% 0.03% 0.06% 0.02%

90
TY 2011/FY 2012 Ad Valorem Tax
Collections by District
Total North of the Broad River
Property Type Percentage Collected
Total Taxes Billed
Total Taxes Collected
Total Taxes Outstanding
Total Taxable Assessed Value
Real Property - 4% 98.9%
16,019,647
15,850,300
169,347
132,461,387
Real Property - 6% 97.3%
45,812,805
44,572,574
1,240,231
220,173,140
Personal Property 86.5%
6,804,712
5,883,400
921,312
32,378,690
Automobiles 83.6%
5,461,512
4,567,673
893,839
20,155,746
Total 95.6%
74,098,676
70,873,947
3,224,729
405,168,963 Percentage of Entire
County 23.06% 22.80% 30.72% 21.35%

91
TY 2011/FY 2012 Ad Valorem Tax
Collections by District
Total South of the Broad River
Property Type Percentage Collected
Total Taxes Billed
Total Taxes Collected
Total Taxes Outstanding
Total Taxable Assessed Value
Real Property - 4% 99.7%
45,405,187
45,271,829
133,358
448,529,227
Real Property - 6% 98.4%
176,564,473
173,741,327
2,823,146
920,427,457
Personal Property 77.5%
13,507,572
10,463,597
3,043,975
72,372,450
Automobiles 89.2%
11,727,566
10,455,347
1,272,219
51,363,910
Total 97.1%
247,204,798
239,932,100
7,272,698
1,492,693,044 Percentage of Entire
County 76.94% 77.20% 69.28% 78.65%

92
Questions?


