38
Taxing Sugar Drinks: A Tool for Obesity Prevention, Cost Savings and Health Improvement A Policy Options Brief May 2011

Taxing Sugar Drinks:
A Tool for Obesity Prevention, Cost Savings and Health Improvement
A Policy Options Brief May 2011


A Policy Options Brief by the Public Health Law CenterDecember 2010
Taxing Sugar Drinks:
A Tool for Obesity Prevention, Cost Savings and Health Improvement
A Policy Options Brief May 2011
Suggested citation: Mary Winston Marrow, Public Health Law Center, TAXING SUGAR DRINKS: A Tool for Obesity Prevention, Cost Savings and Health Improvement (2011).
May 2011
This publication was prepared by the Public Health Law Center at William Mitchell College of Law, St. Paul, Minnesota, with financial support provided by Blue Cross and Blue Shield of Minnesota.
This issue brief is provided for educational purposes only and is not to be construed as legal advice or as a substitute for obtaining legal advice from an attorney. Laws and rules cited are current as of the issue brief ’s
publication date. The Public Health Law Center provides legal information and education about public health, but does not provide legal representation. Readers with questions about the application of the law to
specific facts are encouraged to consult legal counsel familiar with the laws of their jurisdictions.
Acknowledgements
The author thanks Helen Rubenstein for her initial work on this project. The author also thanks Roberta Freidman with the Rudd Center for Food Policy and Obesity, Mary Story with the University of Minnesota School of Public Health, and Jenna M. Carter with the Center for Prevention of Blue Cross and Blue Shield of Minnesota for their critical review and feedback. The author also recognizes Doug Blanke, Natasha Frost
and Susan Weisman for their editing and production assistance.
Copyright © 2011 by the Public Health Law Center
Public Health Law Center875 Summit Avenue
St. Paul, Minnesota 55105-3076851.290.7506 . Fax: 651.290.7515
www.publichealthlawcenter.org

Table of ContentsEXECUTIVE SUMMARY............................................................................................................................1INTRODUCTION: The Obesity Epidemic................................................................................................2 The Epidemic............................................................................................................................................4 Obesity’s Disparate Impact.........................................................................................................................5 The Impact on Health................................................................................................................................5 The Impact on Society...............................................................................................................................5 Impact on the health care system...........................................................................................................6 Impact on employee productivity .........................................................................................................7 Impact on national security...................................................................................................................7THE ROLE OF SUGAR DRINKS..............................................................................................................7POLICY CONSIDERATIONS...................................................................................................................8 Types of Pricing Policies............................................................................................................................9 Regulatory fees......................................................................................................................................9 Sales taxes..............................................................................................................................................9 Excise taxes..........................................................................................................................................10 Proportional pricing policies................................................................................................................11 Size of the Tax or Fee...............................................................................................................................12 Types of Beverages to Include in a Pricing Policy......................................................................................13 Use of Tax Revenue.................................................................................................................................14OTHER IMPACTS OF PRICING POLICIES...........................................................................................14 Low-Income Consumers.........................................................................................................................14 SNAP Benefits........................................................................................................................................16 Artificially Sweetened Beverages..............................................................................................................17RESPONSE OF THE BEVERAGE INDUSTRY.......................................................................................18 Industry Opposition to Sugar Drink Pricing Policies...............................................................................18 Beverage Industry Pricing Strategies.........................................................................................................19THE WAY FORWARD..............................................................................................................................19CONCLUSION.........................................................................................................................................20


ExEcutivE Summary
Sugar drinks are one of the largest contributors of excess empty calories in our nation’s diet. A growing body of evidence suggests that reducing consumption of these drinks could be the single most effective intervention in reducing the prevalence of obesity in the United States. New dietary guidelines issued by the United States Department of Agriculture in 2011 specifically identify reducing consumption of sugar drinks as a key to helping Americans control their calorie intake and manage their weight.1
Over the past decade, initiatives to reduce consumption of sugar drinks have focused primarily on schools and workplaces. These initiatives have failed to significantly reduce the consumption of these drinks because the vast majority of these beverages are consumed outside the school and work environments. Cognizant of the tremendous impact pricing policies have had in reducing use of tobacco products, policy-makers and health advocates are turning their attention to taxes and other pricing policies to reduce consumption of sugar drinks.
State taxation of sugar drinks is in a considerable state of flux. Most states currently impose small taxes on sodas and other sugar drinks, with many states seeking to expand the taxation of these beverages in 2010 and 2011. Efforts to expand these taxes have been met with stiff resistance and push-back by the beverage and grocery industries. Some states are also considering ending the existing taxes on these beverages Public support for taxing sugar drinks depends largely on how the tax revenue will be used, and is strongest when the revenue generated from these initiatives is used to fund obesity prevention or other public health initiatives.
This policy brief reviews the scientific evidence linking consumption of sugar drinks to obesity. It then evaluates the use of pricing policies as a tool to reduce consumption of these beverages and improve weight, while discussing potential drawbacks and likely industry opposition to these policies. Finally, this analysis summarizes some of the most recent national and state initiatives and considers future developments in the implementation of pricing policies to reduce the consumption of sugar drinks and improve weight in the United States.
Public Health Law Center 1

introduction: The Obesity EpidemicObesity rates in the United States have been steadily increasing for over three decades. Indeed, since 1980, obesity rates for adults have doubled, while obesity rates for children ages 7 to 11 have quadrupled. Obesity rates for adolescents ages 12 to 19 have tripled since 1970.2 3 Often referred to as an “obesity epidemic,” the increased prevalence of obesity in the past three decades has affected health outcomes, quality of life, and health costs, and is becoming one of the most pressing public health issues in the United States today. The obesity epidemic has far-reaching impacts, from reducing the projected life expectancy and quality of life of today’s children, to lowering the productivity of the national workforce, to threatening the strength of the United States military and national security. By some estimates, obesity may cause even more preventable chronic disease and death in the United States than either poverty or smoking.4 As a result, urgent calls to action have been made by government leaders, the medical and business communities, health advocates, military and school officials, and many others.
Reversing the increasing prevalence of obesity will require multi-faceted and coordinated action across disciplines. Until recently, most initiatives to stem the steady increase in obesity have focused on changing individual behaviors, without system-wide or policy-based interventions.5 These efforts have failed to reduce weight in the United States. As a result, there is a growing consensus that reversing the trend requires policy initiatives that go beyond changing individual behaviors and instead increase access to nutritious food, decrease access to unhealthy food, and develop built environments promoting physical activity, so that individuals are able to make healthier choices.6 7
Consumption of sugar drinks is closely linked to the increased prevalence of unhealthy weights and many other health problems associated with unhealthy weight, including cardiovascular disease, the alarming recent increase in diabetes, increased dental cavities, and poor nutrition.8 9 Taxing sugar drinks is a key strategy to reduce consumption of these beverages
2 Public Health Law Center
Determining Weight StatusWeight status is determined through a calculation of an individual’s body mass index (“BMI”). For adult women and men, a determination of BMI is made by calculating the ratio of weight to height using the following formula:
A BMI between 18.5 and 24.9 is a “normal” or “healthy” weight. A BMI between 25.0 and 29.9 is considered to be “overweight”. A BMI greater than or equal to 30 indicates obesity. A BMI status of either overweight or obese is considered unhealthy.
Determining if a child, ages 7 to 11, or an adolescent, ages 12 to 19, is overweight or obese is made by comparing where the BMI of an individual child or adolescent falls within the percentile range established for children and adolescents of the same age. Children and adolescents are determined to be at a healthy weight if they fall between the 5th and 85th percentile of their peers. The weight of overweight children and adolescents is between the 85th to less than the 95th percentile of the weight of their peers. The weight of obese children and adolescents is equal to or greater than the 95th percentile of the weight of their peers.
See: Healthy Weight - it’s not a diet, it’s a lifestyle, CTR. FOR DISEASE CONTROL AND PREVENTION, http://www.cdc.gov/healthy-weight/assessing/index.html for additional information on determin-ing the weight status for children, adolescents and adults.
weight in pounds(height in inches) X (height in inches) X 703BMI =
Public Health Law Center 3
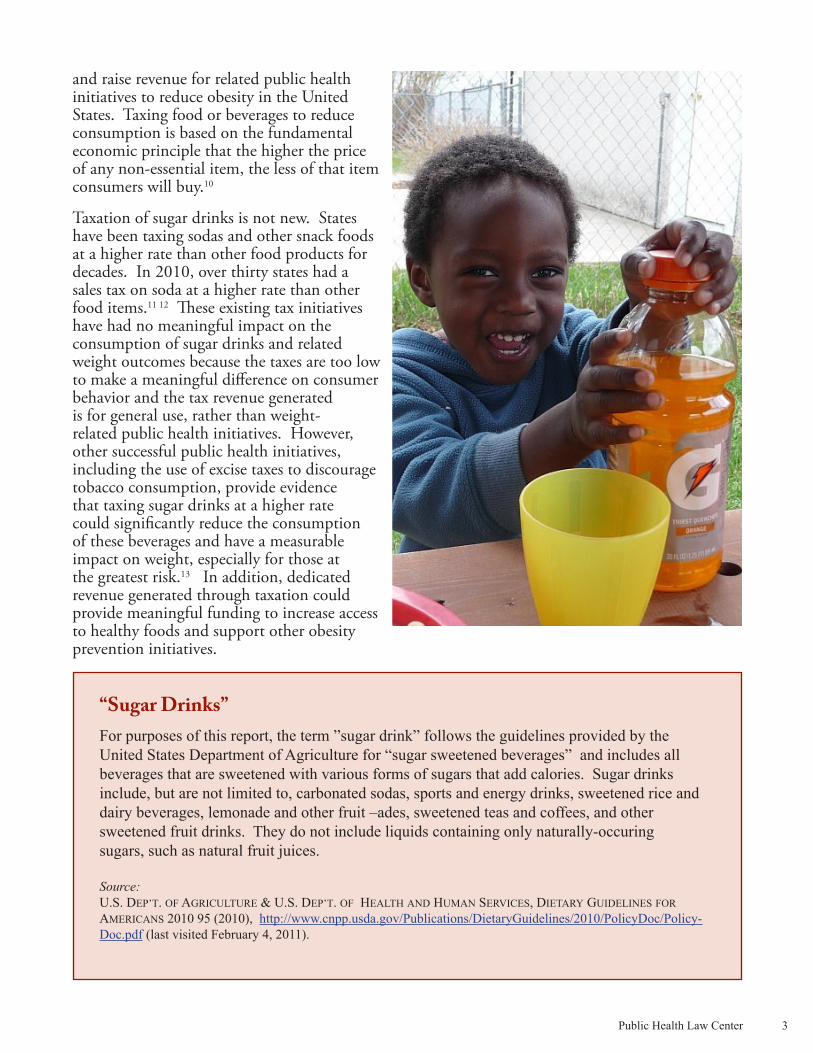
and raise revenue for related public health initiatives to reduce obesity in the United States. Taxing food or beverages to reduce consumption is based on the fundamental economic principle that the higher the price of any non-essential item, the less of that item consumers will buy.10
Taxation of sugar drinks is not new. States have been taxing sodas and other snack foods at a higher rate than other food products for decades. In 2010, over thirty states had a sales tax on soda at a higher rate than other food items.11 12 These existing tax initiatives have had no meaningful impact on the consumption of sugar drinks and related weight outcomes because the taxes are too low to make a meaningful difference on consumer behavior and the tax revenue generated is for general use, rather than weight-related public health initiatives. However, other successful public health initiatives, including the use of excise taxes to discourage tobacco consumption, provide evidence that taxing sugar drinks at a higher rate could significantly reduce the consumption of these beverages and have a measurable impact on weight, especially for those at the greatest risk.13 In addition, dedicated revenue generated through taxation could provide meaningful funding to increase access to healthy foods and support other obesity prevention initiatives.
“Sugar Drinks”For purposes of this report, the term ”sugar drink” follows the guidelines provided by the United States Department of Agriculture for “sugar sweetened beverages” and includes all beverages that are sweetened with various forms of sugars that add calories. Sugar drinks include, but are not limited to, carbonated sodas, sports and energy drinks, sweetened rice and dairy beverages, lemonade and other fruit –ades, sweetened teas and coffees, and other sweetened fruit drinks. They do not include liquids containing only naturally-occuring sugars, such as natural fruit juices.
Source: U.S. DEP’T. OF AGRICULTURE & U.S. DEP’T. OF HEALTH AND HUMAN SERVICES, DIETARY GUIDELINES FOR AMERICANS 2010 95 (2010), http://www.cnpp.usda.gov/Publications/DietaryGuidelines/2010/PolicyDoc/Policy-Doc.pdf (last visited February 4, 2011).
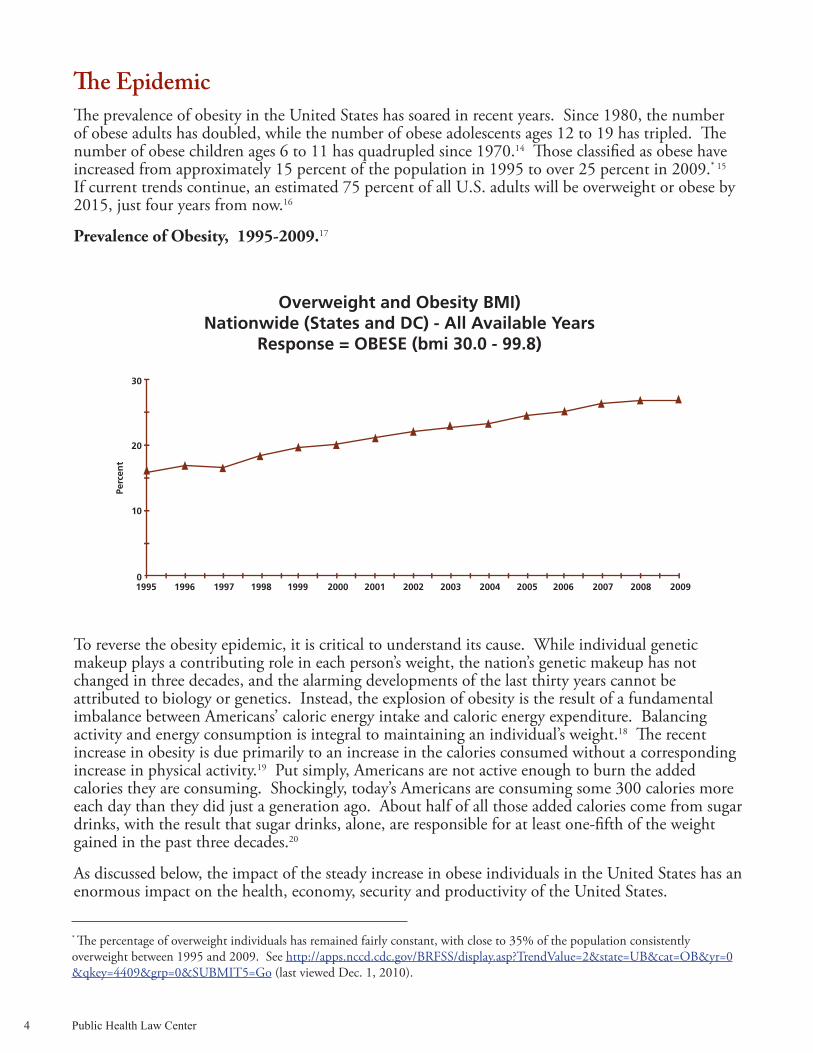
The Epidemic The prevalence of obesity in the United States has soared in recent years. Since 1980, the number of obese adults has doubled, while the number of obese adolescents ages 12 to 19 has tripled. The number of obese children ages 6 to 11 has quadrupled since 1970.14 Those classified as obese have increased from approximately 15 percent of the population in 1995 to over 25 percent in 2009.* 15 If current trends continue, an estimated 75 percent of all U.S. adults will be overweight or obese by 2015, just four years from now.16
Prevalence of Obesity, 1995-2009.17
To reverse the obesity epidemic, it is critical to understand its cause. While individual genetic makeup plays a contributing role in each person’s weight, the nation’s genetic makeup has not changed in three decades, and the alarming developments of the last thirty years cannot be attributed to biology or genetics. Instead, the explosion of obesity is the result of a fundamental imbalance between Americans’ caloric energy intake and caloric energy expenditure. Balancing activity and energy consumption is integral to maintaining an individual’s weight.18 The recent increase in obesity is due primarily to an increase in the calories consumed without a corresponding increase in physical activity.19 Put simply, Americans are not active enough to burn the added calories they are consuming. Shockingly, today’s Americans are consuming some 300 calories more each day than they did just a generation ago. About half of all those added calories come from sugar drinks, with the result that sugar drinks, alone, are responsible for at least one-fifth of the weight gained in the past three decades.20
As discussed below, the impact of the steady increase in obese individuals in the United States has an enormous impact on the health, economy, security and productivity of the United States.
4 Public Health Law Center
* The percentage of overweight individuals has remained fairly constant, with close to 35% of the population consistently overweight between 1995 and 2009. See http://apps.nccd.cdc.gov/BRFSS/display.asp?TrendValue=2&state=UB&cat=OB&yr=0&qkey=4409&grp=0&SUBMIT5=Go (last viewed Dec. 1, 2010).
Public Health Law Center 5
Obesity’s Disparate ImpactWhile obesity is increasing in all segments of the U.S. population, some ethnic and racial groups have higher levels of obesity than others.21 Adult obesity rates are also linked to household income and educational background, with higher rates of obesity among the poor and those with less education.22
Because obesity carries many health risks these disparities have important health consequences for the groups involved. Not surprisingly, the higher rates of obesity in these populations are closely linked to a much greater prevalence of chronic disease.23
The Impact on Health Obesity increases the risk for over 20 major chronic diseases, leads to reduced quality of life and life expectancy, and increases health costs associated with treating these chronic health conditions.24 25 Health outcomes associated with obesity include: increased cardiovascular disease; colon cancer, prostate cancer, breast cancer, and numerous other cancers; type 2 diabetes; asthma; hypertension; depression; sleep apnea; joint problems; and liver disease.26 27 28 29 Children are especially vulnerable to the medical risks associated with an unhealthy weight.30 31 When looking at the high prevalence of obese and overweight children, the Institute of Medicine has indicated that today’s children may actually have a reduced quality of life and a lower life expectancy than their parents as a direct result of their unhealthy weight.32
The Impact on SocietyThe increased prevalence of obesity in the United States has far reaching impacts across multiple sectors of society. These impacts can be seen in the health care system through rising medical costs, in the employment sector through the lower productivity of the workforce, and on the U.S. military through compromised national security.
Racial Disparities in Obesity QuantifiedSeveral studies point out the differences in obesity rates among racial groups. Between 2003 and 2006, African American women were 70 percent more likely to be obese than Non-Hispanic Caucasian women; American Indians and Alaskan Natives were 1.6 times as likely to be obese as Non-Hispanic Caucasians; and Native Hawaiian and Pacific Islanders were 3.7 times more likely to be obese than the overall Asian American population.1 Additionally, 5 percent more Latino adults are obese than Caucasian adults.2
Sources: 1. Obesity Data/Statistics, OFFICE OF MINORITY HEALTH, http://minorityhealth.hhs.gov/templates/browse.aspx?lvl=3&lvlID=537 (last modified Jan. 28, 2011).
2. TRUST FOR AMERICA’S HEALTH, F AS IN FAT: HOW OBESITY THREATENS AMERICA’S FUTURE 77 (2010), http://www.rwjf.org/files/research/20100629fasinfatmainreport.pdf (last visited Dec. 21, 2010).

Impact on the health care system
The impact of obesity on the health care system is shared by individuals, health insurance providers, employers, and society as a whole. This impact is felt primarily through direct medical costs related to unhealthy weights, including preventive, diagnostic, and treatment services. These medical costs are almost entirely the result of costs generated from treating obesity-related chronic diseases, such as diabetes.33 The costs of providing health care for obese individuals are evident from a study finding that in 2006, annual medical spending for obese individuals was a stunning 42 percent greater than for individuals at a healthy weight, or approximately $1,429 per year more for the medical costs of obese individuals than individuals with a healthy weight.
Calculating the costs associated with treating weight-related medical conditions depends on who measures the cost, what costs are measured, and how the costs are measured. Even so, all measurements of these costs show a deeply troubling rise in the past three decades. From 1987 through 2001, 12 percent of the total growth in U.S. health care spending was attributed to medical issues related to an unhealthy weight.35 According to the Centers for Disease Control, in 1998 over 9 percent of total U.S. medical expenditures were related to weight issues.36 In 2008, medical costs related to unhealthy weights were estimated to be 10 percent of all annual medical spending in the United States.37
With the steady increase in unhealthy weight in the United States, medical costs will increase significantly in coming decades unless the current trends are reversed.38 39 Of particular concern is the fact that medical costs associated with weight increase as individuals become heavier. As a result, projections show medical costs associated with weight status increasing even more rapidly than the increased prevalence of obesity.40 In fact, if current trends continue, the total health-care costs attributable to unhealthy weights could more than double every decade.41 Reducing the prevalence of unhealthy weight is therefore critical to slowing the increase in medical spending in the United States.
The medical costs associated with treating weight-related health problems impose a significant economic burden on both public and private payers.42 Public medical programs, like Medicare and Medicaid, pay approximately half of these costs.43 In 2006, costs associated with treating obesity-related conditions accounted for 8.5 percent of Medicare spending, 11.8 percent of Medicaid spending, and 12.9 percent of private payer spending.44 On a state level, the costs of treating obesity related illnesses are estimated to range from $87 million in Wyoming to over $7 billion in California.45
6 Public Health Law Center
Socioeconomic Disparities in Obesity Quantified
Thirty-five percent of adults earning less than $15,000 per year were classified as obese as compared to 24.5 percent of adults earning $50,000 or more per year. In 2007, nearly 45 percent of children living in poverty were overweight or obese, compared with 22.2 percent of children living in households four times above the poverty level.
Source: TRUST FOR AMERICA’S HEALTH, F AS IN FAT: HOW OBESITY THREATENS AMERICA’S FUTURE 6, 79 (2010), http://www.rwjf.org/files/research/20100629fasinfatmainreport.pdf (last visited Dec. 21, 2010).
34

Public Health Law Center 7
Impact on employee productivity
The impact of obesity on employee productivity represents a significant burden on the economic prosperity of the United States. These “indirect costs” of obesity include the value of income lost from decreased productivity, restricted activity, absenteeism, and bed days, in addition to the value of future income lost by premature death.46 47 The unhealthy weight of both employees and their family members also contributes to higher health care costs for employers.48
Many employers are as concerned about childhood obesity as they are about adult obesity, in recognition of the increased medical costs of treating employees’ obese children, as well as the time and productivity lost when employees provide care to those children.49 More fundamentally, employers are focusing increasingly on the link between childhood obesity and adult obesity because today’s obese children are much more likely to become tomorrow’s obese workforce.50
Impact on national security The U.S. military has also identified the impact of rising obesity rates on both military recruitment and military readiness as a critical national security issue. The prevalence of obesity presents significant challenges for military recruitment as fewer civilian military-age women and men meet military enlistment standards.51 Currently, nearly a quarter of military applicants are rejected for being overweight or obese.52 In addition, unhealthy weight is also “associated with decreased military operational effectiveness . . . and both acute and chronic adverse health effects” of active members of the U.S. Armed Forces.53
The Role of Sugar Drinks Although sugar drinks are a primary source of America’s increased calorie consumption, they have little or no nutritional value and contribute to numerous chronic health conditions associated with unhealthy weights, including cardiovascular diseases, type 2 diabetes, and dental cavities, to name three.54 55
In the United States, sugar drinks account for approximately one-half of the recent increased calorie consumption, represent the largest source of added sugars, and are one of the single most significant sources of energy contributing to excess calorie consumption. Per capita consumption of sugar drinks has increased dramatically over the past few decades along with the increased prevalence in unhealthy weights.56 57
There are several measures that demonstrate the increase in the consumption of sugar drinks. Since 1977, both the serving size and number of daily servings of sugar drinks consumed have increased.58 Between 1977 and 1996, the portion size of a sugar drink increased from 13.6 fluid ounces to 21.0 fluid ounces.59 Similarly, in 1977 a typical American was consuming 1.96 servings of sugar drinks each day. Just nineteen years later, this daily diet had increased to 2.39 servings,60 even as the size of each serving was increasing.

In the period from 1988 to 1994, Americans took in 158 calories every day from sugar drinks; only ten years later, this had jumped to 203 calories per day.61 In 1997, beverages accounted for less than 15 percent of America’s calories. Only five years later, this had leapt to more than 20 percent, with most of these calories from sugar drinks.62 63 The contribution of sugar drinks to total caloric intake is particularly significant because a healthy diet does not require fluids to provide energy or nutrient needs.64
Numerous peer-reviewed studies have identified a strong positive association between consumption of sugar drinks and weight gain in children, adolescents and adults.65 66 67 68 69 70 71 Perhaps not surprisingly, studies funded by the beverage industry have generally found weak links or inconclusive evidence regarding a connection between consumption of sugar drinks and weight gain.72 73 Nevertheless, the wealth of studies by independent researchers leaves little doubt that sugar drinks play a central role in the obesity epidemic. In fact, the odds of becoming obese increase significantly for each additional daily serving of a sugar drink. Adding a single serving of sugar drink to a child’s daily diet increases that child’s likelihood of becoming obese by anywhere from one to six times.74
Experts hypothesize that consumption of sugar drinks contributes to weight gain because liquid calories are not as filling as calories from solid food. Those consuming excess liquid calories do not appear to offset these liquid calories by reducing the number of calories they consume from other sources. As a result, they consume more total calories than those who do not consume liquid calories.75 76 77
Just as increased consumption of sugar drinks has been linked to increasing body weight, reducing consumption of sugar drinks is linked to a reduction in body weight, with heavier individuals experiencing a greater weight loss than those who weigh less.78 79 In fact, reducing sugar drink consumption produces a greater weight loss than does a reduction in solid calories.80 In contrast, reducing one’s consumption of other beverages, without added sugars, produces no comparable loss of weight.81
Consumption of sugar drinks also causes health and medical issues unrelated to weight. A few studies have found an independent and significant association between consumption of sugar drinks and increased risk of type 2 diabetes, even after adjusting for weight.82 83 A higher risk of cardiovascular disease has also been found in women who regularly consume sugar drinks.84 Other health problems disproportionately impacting children and adolescents, such as an increased incidence of dental cavities from the high sugar content and acidity of sugar drinks, have also been associated with consumption of sugar drinks.85 For all these reasons, experts agree that public health initiatives to reduce obesity, reduce the prevalence of type 2 diabetes, and improve the dental health of children and adolescents should focus on discouraging and reducing the consumption of sugar drinks while promoting the consumption of other beverages, such as water, low-fat milk, and unsweetened coffee and tea.86 87 88
Policy conSidErationS
Arguably, the best way to reduce sugar drink consumption is to make these drinks more expensive. Indeed, no less an authority than the Director of the Centers for Disease Control and Prevention, Dr. Thomas Frieden, has argued that taxing sugar drinks at a rate of 1 cent per ounce could be the “single most effective measure to reverse the obesity epidemic.”89
As a result, health advocates are increasingly looking to pricing initiatives as a tool to increase the price of sugar drinks and generate revenue for public health initiatives.90 91 92 Proponents of this approach generally focus on three over-arching goals for increasing the price of these beverages:
8 Public Health Law Center

Public Health Law Center 9
reducing the consumption of sugar drinks, improving health outcomes caused by the consumption of sugar drinks, and generating revenue to fund obesity prevention initiatives and pay for rising health care costs associated with obesity.
The use of pricing policies, such as taxes or regulatory fees, to support public health initiatives has been shown to be one of the most powerful tools for reducing the use of other unhealthy products, such as tobacco and alcohol.93 94 As with these products, the use of pricing strategies to reduce consumption of sugar drinks is based on the bedrock principle of economics that, with few exceptions, the higher the price of any product, the less of that product consumers will purchase.95
The precise quantitative impact of different pricing policies on reducing the consumption of sugar drinks and the impact of that reduction on weight and health outcomes continue to be the subject of ongoing debate. Several studies have attempted to evaluate the impact of taxing sugar drinks on weight outcomes. While it appears reasonable to believe that a significant price increase will result in a significant reduction in consumption and a demonstrable weight reduction, it remains difficult at this point to assess the research. The published results to date are affected by multiple variables which are not evaluated consistently across different studies. As more communities use pricing policies to reduce the consumption of sugar drinks, researchers will be able to provide measurable results on the effectiveness of these initiatives.
The effectiveness of a pricing policy in reducing the consumption of sugar drinks and improving related weight and health outcomes is closely related to four key policy considerations: 1) the type of pricing policy; 2) the impact of the policy on the cost of the beverage; 3) what beverages are targeted by the policy; and 4) the use of revenue from the policy.
Types of Pricing PoliciesGenerally, four types of pricing policies have been identified to reduce consumption of sugar drinks and improve related weight and health issues: 1) regulatory fees; 2) sales taxes; 3) excise taxes; and 4) proportional pricing initiatives. When considering the use of different pricing policies on sugar drinks, it is important to recognize that every state has a different political and legal landscape. Therefore, each state or local government must go through its own multilevel analysis to determine which policy option is best suited for the impacted community.
Regulatory fees
Depending on state-specific legal requirements for the imposition of regulatory fees, a state or local government may impose a fee as part of its police power to protect the public health, safety and welfare.96 97 Unlike taxes, regulatory fees are charged to the business that manufactures or distributes a product or provides a specific service. The right to engage in a particular activity is contingent on the payment of the fee.98 Revenue generated through a fee must be used for regulatory activities related to the specific product or activity on which the fee is placed.99 Very broadly speaking, the fee cannot be higher than necessary to carry out the activities for which the fee was created.100 For example, the State of Minnesota imposes a fee on dry cleaning facilities which use specific dry cleaning solvents in their operations.101 The revenue from this fee is deposited in a dry cleaner environmental response and reimbursement account in the state’s remediation fund.102 Funds from this account are used to cover environmental response costs incurred as a result of the operation of dry cleaning facilities.103
Sales taxes
A sales tax is a tax assessed on the retail price of goods. Sales taxes are imposed on the consumer at the “point of purchase” and are collected by the retailer.104

The success of sales taxes in reducing purchases and consumption of sugar drinks may be limited. Generally, for consumers to respond to an increased price caused by a taxing scheme, they must be aware of the tax-induced price change at the time they decide to purchase the item involved. A fundamental weakness in using a sales tax to impact consumer behavior is the fact that the after-tax price of items subject to sales taxes is not apparent to consumers until after they decide to make a purchase.105 Sales taxes are not ordinarily included in the prices identified in advertisements, package markings, price tags, signs or other price displays included with products. Sales taxes are not added to the cost of an item until after the consumer has decided to make the purchase.106 In the course of completing the purchase, the sales tax is applied automatically and invisibly, and usually in a way that does not associate it clearly with any particular item. Therefore, customers are generally not aware of the impact of a sales tax on the price of an individual item. In addition, even when consumers are aware of the additional cost of a sales tax, the consumer may simply be motivated to purchase a less expensive brand or a larger quantity priced to allow the purchaser a “volume discount.”107 108 Accordingly, use of a sales tax on sugar drinks may not have the same impact on consumer behavior as an excise tax, discussed below. Despite its more limited impact on changing consumer behavior, the fact that many states already impose sales taxes on sugar drinks suggests a general acceptance of these taxes, at least at a low rate. Earmarking the revenue from a sales tax for obesity prevention initiatives could increase the impact these taxes have on the consumption of sugar drinks.
Excise taxes
Excise taxes are another taxing mechanism that can be used to increase the cost of sugar drinks and generate revenue for public health initiatives. Excise taxes are generally placed on “the production, sale, or consumption of a commodity” and are usually imposed on a specific type of business for the privilege of conducting that business.109 As applied to sugar drinks, excise taxes could be placed on either the entire beverage sold or on the volume or weight of a unit of sweetener, such
10 Public Health Law Center
California ExperiencePrior to the 2010 election, health advocates in California had an interest in using regulatory fees on sugar drinks to fund activities to reverse the obesity epidemic. This interest grew in part from a legal situation unique to California that made imposing regulatory fees easier than imposing a new tax in that state. Specifically, imposing a new regulatory fee only required a majority vote of the state or local legislative body creating the fee. In contrast, adoption of most new state or local taxes in California required a supermajority, or two-thirds, vote of the legislative body. In November 2010, however, California voters approved an amendment to the state constitution, now requiring a supermajority for most regulatory fees, as well. Given this setback in the use of regulatory fees in California, and the lack of any clear examples where regulatory fees on sugar drinks have successfully been used to generate revenue for obesity prevention initiatives, additional assessment of the use of regulatory fees to fund obesity prevention initiatives is needed, at least in California.
Sources:
Using Regulatory Fees to Combat the Adverse Effects of Sugar-Sweetened Beverages, PUB. HEALTH LAW AND POLICY (2009), http://www.phlpnet.org/sites/phlpnet.org/files/PHLP-SodaFeePolicyBrief_FINAL_091218_0.pdf (last visited Dec. 21, 2010).
JILL E.C. YUNG, SANJAY M. RANCHOD & GORDON E. HART, PASSAGE OF PROPOSITION 26 ALTERS FUTURE OF REGULATORY FEES IN CALIFORNIA (2010), http://www.paulhastings.com/assets/publica-tions/1780.pdf?wt.mc_ID=1780.pdf (last visited Feb. 18, 2011).

Public Health Law Center 11
as per ounce or gram of added sugar or high-fructose corn syrup. The additional cost associated with excise taxes would be placed on the producer, wholesaler or distributor of the beverages being taxed.110 111
While the costs associated with excise taxes on sugar drinks are expected to be passed on to the retailer and consumer, the extent to which an excise tax impacts the price of an item is largely determined by the producer, wholesaler or distributor when establishing the pricing structure of specific products.112 Excise taxes would most likely be passed on to retailers and incorporated into a higher retail price, which would be displayed with the product in a retail environment or on the menu of an eating establishment, such as a fast-food restaurant.113 Accordingly, excise taxes would affect not only beverages purchased for home consumption, but also those beverages sold as fountain drinks at restaurants and convenience stores, in vending machines, and at other locations, like school stores and worksite cafeterias.
Proportional pricing policies
Proportional pricing initiatives would require that the price of sugar drinks be based on the quantity of beverage sold, and would prohibit today’s common pricing arrangements under which larger quantities of a sugar drink can be purchased at a lower price per ounce than a smaller size.114 That is to say, in place of today’s commonplace arrangements under which consumers are invited to “super-size” a drink and receive a much greater quantity of beverage (and sugar) for a nominal additional sum of money, proportional pricing laws would require that these beverages be sold for the same price per ounce or portion, no matter how large
Minnesota Sales Tax and Sugar DrinksMinnesota has a long history of using tax policy as a tool for differentiating between foods that are deemed more or less desirable for health. As discussed below, Minnesota recognizes that soft drinks are less desirable than other more nutritious beverages and food items by taxing soft drinks at a higher rate than more nutritious items. Generally, food and food ingredients are exempt from the general sales tax in Minnesota.1 2 However, this exemption from the sales tax has not applied to soft drinks since at least 2000. In 2000, “soft drinks”, including carbonated and noncarbonated beverages or drinks sold in liquid form, but not including beverages containing milk or more than 15 percent fruit juice, were made subject to taxation under Minnesota’s general sales tax. The legal definition of “soft drink” under Minnesota law changed in 2001 to its current definition and is now defined as nonalcoholic beverages in liquid form that contain natural or artificial sweeteners. Beverages that contain milk or milk products; soy, rice, or similar milk substitutes; or beverages with greater than 50 percent vegetable or fruit juice by volume are not included in the definition of “soft drinks” and have been exempted from the general sales tax as a food item since 2001.3 In Minnesota, local governments are prohibited from imposing local sales taxes without legislative approval. Accordingly, local governments in Minnesota do not currently have the authority to impose local sales taxes on sugar drinks.4
Sources:1. MINN. STAT. §297A.62 (2010). 2. MINNESOTA SALES AND USE TAX INSTRUCTION BOOKLET, MINN. DEP’T. OF REVENUE (2009), http://taxes.state.mn.us/sales/Documents/instructions_st_bk_ rev0709.pdf (last visited Feb. 18, 2011).2. MINN. STAT. §297A.61 (2000). 3. MINN. STAT. §297A.61 (2001).4. MINN. STAT. §297A.99, Subd. 1 (2010).
the drink. Under a proportional pricing requirement, therefore, doubling the size of a drink would double its price. These proportional pricing initiatives focus on removing economic incentives encouraging consumers to purchase larger sizes of sugar drinks.115
Proportional pricing initiatives could reverse recent trends in which consumers buy larger portions of sugar drinks for a lower per ounce cost.116 Encouraging customers to “buy more for less” is a common tactic in many convenience stores and fast food restaurants offering relatively cheaper “super size” portions to customers. Convenience store chain 7-Eleven, for example, introduced a 32-ounce “Big Gulp” drink in 1980.117 Eight years later, 7-Eleven began offering the 64-ounce “Double Gulp” with continuing claims that the “Double Gulp” is one of the “biggest fountain soft drinks on the market.”118 The Double Gulp contains approximately 45 teaspoons of sugar and 744 calories.119
To date, proportional pricing initiatives on sugar drinks are untested and may face legal challenges from the beverage industry.120 Additional research on the use of proportional pricing strategies to reduce consumption of sugar drinks is needed to better understand the potential benefits and risks associated with these strategies.121
Size of the Tax or Fee
The impact of a pricing policy on changing the consumption of sugar drinks involves how much the price of a sugar drink is impacted and the related “price-elasticity” of the drink. “Price-elasticity” refers to “the responsiveness of the quantity demanded of a good to its price” and reflects the extent to which consumers will continue to purchase a specific item as its price increases.122 Because of their limited financial resources, children, adolescents and lower income populations are generally more sensitive to increased prices than others.123 124 125 126 Some research specifically indicates that increasing the price of sugar drinks through taxes would have a greater impact on the behavior of lower income groups than on higher income groups.127 In addition, some research indicates that heavier individuals may be more price-sensitive, and that significant pricing interventions on sugar drinks could have a measurable effect on reducing the consumption of sugar drinks and improving weight outcomes in this population.128
A number of studies have tried to evaluate the impact of increased price on the consumption of
12 Public Health Law Center
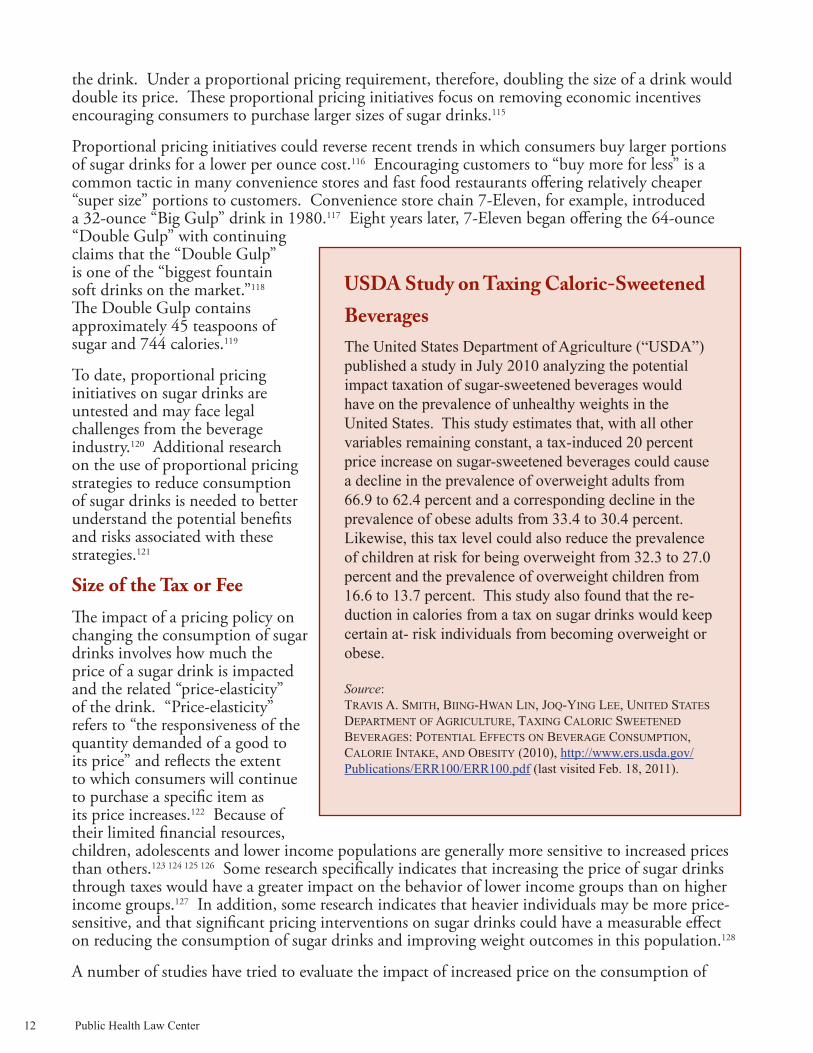
USDA Study on Taxing Caloric-Sweetened BeveragesThe United States Department of Agriculture (“USDA”) published a study in July 2010 analyzing the potential impact taxation of sugar-sweetened beverages would have on the prevalence of unhealthy weights in the United States. This study estimates that, with all other variables remaining constant, a tax-induced 20 percent price increase on sugar-sweetened beverages could cause a decline in the prevalence of overweight adults from 66.9 to 62.4 percent and a corresponding decline in the prevalence of obese adults from 33.4 to 30.4 percent. Likewise, this tax level could also reduce the prevalence of children at risk for being overweight from 32.3 to 27.0 percent and the prevalence of overweight children from 16.6 to 13.7 percent. This study also found that the re-duction in calories from a tax on sugar drinks would keep certain at- risk individuals from becoming overweight or obese.
Source:TRAVIS A. SMITH, BIING-HWAN LIN, JOQ-YING LEE, UNITED STATES DEPARTMENT OF AGRICULTURE, TAXING CALORIC SWEETENED BEVERAGES: POTENTIAL EFFECTS ON BEVERAGE CONSUMPTION, CALORIE INTAKE, AND OBESITY (2010), http://www.ers.usda.gov/Publications/ERR100/ERR100.pdf (last visited Feb. 18, 2011).

Public Health Law Center 13
sugar drinks and related weight outcomes. However, the results of these studies vary considerably. These differences are a result of several factors, such as using different methodologies, studying different tax structures, and looking at different populations. Some studies show that a “penny-per-ounce” excise tax could potentially reduce consumption of sugar drinks by up to 23 percent.129 Other studies have found that for every 10 percent increase in price, consumption of sugar drinks would decrease between 8 and 10 percent.130 131 Still others indicate that imposition of a 35 percent price increase would decrease soft drink consumption by over 25 percent.132
Despite the variations in study results, larger price increases than those currently in use will be needed for pricing policies to have a significant impact on reducing the consumption of sugar drinks and improving related weight outcomes.133 The average sales tax rate on sugar drinks among states currently taxing these beverages is 5.2 percent.134 There is a growing consensus that, at a minimum, a penny per ounce excise tax on sugar drinks, or a tax rate of approximately 10 percent, is needed to see a meaningful reduction in consumption of sugar drinks as a result of taxation.135 A tax rate at this level is expected to reduce the annual caloric consumption of an average individual in the United States by 8,000 calories per year, translating into the elimination of approximately 2.3 pounds of excess weight.136 That said, smaller taxes can still contribute to obesity prevention initiatives if the revenue generated from these taxes is dedicated to increasing access to healthy foods or funding other obesity prevention initiatives.137 The failure of current sales taxes imposed on sugar drinks to impact consumption of sugar drinks and related weight outcomes is generally attributed to the fact that these taxes are too small to impact consumption and fail to earmark revenues for obesity prevention initiatives.138
Types of Beverages to Include in a Pricing Policy
One of the most controversial policy decisions in these pricing policies is determining which beverages to include in a tax or other pricing initiative. Generally, discussions on this point focus on whether any caloric sweetener has been added to a particular beverage. Advocates and policy-makers also typically consider the level of public support for taxing sugar drinks, including considerations of calorie content and the percentage of fruit juice in the beverage, and anticipated industry response to the inclusion of a specific beverage or group of beverages.
Most health advocates focus on whether or not any caloric sweetener has been added to a beverage when considering if a specific beverage should be included in a pricing initiative. Others make a distinction between beverages with little to no nutritional value and beverages with some nutritional benefits, such as dairy products and fruit juices. For example, the decision whether or not to include 100 percent fruit juice as a taxed beverage has been debated. Increased consumption of 100 percent fruit juice has been identified as a potential contributor to the increase in unhealthy weights, with some arguing that 100 percent fruit juice should also be included in initiatives to decrease consumption of other calorie-laden drinks.139 However, most advocates for taxing sugar drinks do not support the taxation of 100 percent fruit juice but do support the taxation of drinks containing some fruit juice and added sugars.140
Definitions of sugar drinks vary across the country. The Congressional Budget Office in 2008 and the Senate Finance Committee in 2009 identified the possibility of imposing a federal excise tax on sugar drinks to generate revenue to fund health care reform. The sugar drinks targeted in these discussions included a variety of sugar-sweetened carbonated and un-carbonated beverages, such as non-diet soft drinks, fruit and vegetable drinks, energy and sports drinks, iced teas and coffees, and flavored milk and dairy drinks.141 142 These federal discussions also included the possibility of a tax on sugar-sweetened fountain drink syrup at a higher rate per ounce to ensure that the tax per ounce of a fountain drink would be equivalent to that of other taxed sugar drinks.143 144
The State of Colorado recently removed the sales tax exemption for sales of candy and “soft drinks,” making these items subject to the state’s sales tax as of May 1, 2010.145 “Soft drinks” are defined as “nonalcoholic beverages that contain natural or artificial sweeteners” but not including beverages that contain milk or milk products; soy, rice or similar milk substitutes; or greater than fifty percent of vegetable or fruit juice by volume”146 This initiative is in a state of flux as a bill was pending in the Colorado legislature in early 2011 to reinstate the sales tax exemption for sales of candy and “soft drinks”.147 Still others try to balance industry concerns with public health concerns. This is evident in New York’s recent, albeit unsuccessful, effort to pass legislation taxing sugar drinks. In the State of New York, former Governor David A. Paterson proposed an excise tax on sugar-sweetened beverages containing more than ten calories per eight ounces, including soda, sports drinks, energy drinks, colas, fruit or vegetable drinks containing less than 70 percent natural fruit or vegetable juice, and sweetened bottled tea and coffee.148 The decision to include lightly sweetened beverages in this proposal was seen as a way to respond to industry concerns, while discouraging consumption of high-calorie beverages and making lower-calorie beverages more affordable.149 Revenue generated from the proposed New York tax would have been dedicated to health care spending through the Health Care Reform Act.150 The proposal was not adopted.
Determining what sugar drinks should be contained in a pricing strategy is a complex, highly-political decision. Communities pursuing pricing strategies need to weigh definitions carefully and should look to other jurisdictions for examples of successes and failures of a particular definition.
Use of Tax Revenue
Taxes on sugar drinks will be more effective in reducing weight if the revenue generated is dedicated to obesity prevention measures.151 Typically, the proponents of these taxes advocate for dedication of the tax revenue to such prevention measures. Some groups, such as the American Heart Association, have specifically stated that any support for taxing sugar drinks should be contingent on dedicating all tax-generated revenue to obesity prevention and other public health initiatives.152
While most advocates would agree that dedicating revenue from sugar drink taxes to obesity prevention initiatives is desirable, in light of current fiscal challenges, taxes on sugar drinks are also being considered by lawmakers as a mechanism for general funding purposes. The precedence for this so-called “earmarking” can be seen in tobacco control efforts, in which tax-generated revenue has been used for tobacco control and prevention programs and other public health initiatives.153 Public support for taxing sugar drinks also increases if the revenue generated from sugar drink taxes is used to support obesity prevention initiatives.154 155
othEr imPactS of Pricing PoliciES
Those considering increasing the price of sugar drinks through taxes or fees should also consider the impact these increased prices will have on low-income consumers, recipients of federal Supplemental Nutrition Assistance Program (“SNAP”) benefits, and on the consumption of artificially sweetened beverages.
Low-Income ConsumersA key concern raised about increasing the prices of sugar drinks through taxes or fees is the extent to which this tax would be regressive with regard to its disproportionate impact on low-income consumers.156 Concerns about regressivity stem from the fact that lower-income populations spend a higher percentage of their budget on food and beverages than higher-income populations. As a result, lower-income populations choosing to buy taxed sugar drinks will end up spending an even greater percentage of their income on these beverages than before the beverages were taxed.
14 Public Health Law Center

Public Health Law Center 15
However, as discussed below, there is some evidence indicating that lower-income consumers of sugar drinks will not end up spending a disproportionately larger share of their income on these beverages than higher-income consumers after a tax is imposed.
While it is important to recognize the potential that low-income consumers could be burdened with the increased costs from a tax or fee on sugar drinks, it is also critical to recognize that low-income people are disproportionately affected by the illnesses which are associated with poor diets and obesity. Therefore, reducing the consumption of sugar drinks through taxes or fees could have the biggest positive impact on the health and well-being of those low-income populations at greatest risk for an unhealthy weight.157
SNAP Benefits and the WIC ProgramEfforts to prohibit the purchase of sugar drinks with SNAP benefits have been met with stiff resistance from some community advocates, who argue that these types of initiatives serve to police the poor and create additional hardships and stigma for those using federal benefits.1 While SNAP benefits may be used to purchase a wide assortment of foods or food products intended for human consumption, hot foods and hot food products prepared for immediate consumption are not eligible for purchase with SNAP benefits.2 In addition, the federal Women, Infants, and Children program (“WIC”) has strict guidelines on what foods can be purchased. The WIC program was developed to be a supplemental program to the food stamp program and provide supplemental foods and nutrition education to pregnant, postpartum and breastfeeding women, infants and young children from families with inadequate income. Foods currently included in the WIC program include infant cereal, iron-fortified adult cereal, vitamin C-rich fruit or vegetable juice, eggs, milk, cheese, peanut butter, dried and canned beans/peas, canned fish, soy-based beverages, tofu, fruits and vegetables, baby foods, whole wheat bread, and other whole-grain options.3 The WIC program does not include sugar drinks or other high energy, low-nutritious foods such as processed snack foods and candy.4
The fact that sugar drinks and other foods with little nutritional value are excluded from the WIC program while these foods are eligible under the SNAP program is striking, especially considering that the SNAP program was specifically created to raise the nutrition levels of low-income households.5 The current efforts by New York City and some states to ban the use of SNAP benefits to purchase sugar drinks highlights some of the inconsistencies between these federal nutrition programs and renews the question as to what items should be eligible for purchase with SNAP benefits.
Sources:
1. Letter to Tom Vilsack, Sec’y of Agric., U.S. Dep’t. of Agric. from New York City Coal. Against Hunger (Oct.12, 2010), http://www.nyccah.org/files/Vilsack_SNAP_restrictions.pdf.2. See 7 CFR §271.2 (2010) for definition of Eligible Foods.3. THE SPECIAL SUPPLEMENTAL NUTRITION PROGRAM FOR WOMEN, INFANTS AND CHILDREN, U.S. DEP’T OF AGRIC. (2009), http://www.fns.usda.gov/wic/WIC-Fact-Sheet.pdf (last visited Feb. 18, 2011). 4. 7 CFR §246.10 (2010).5. 7 CFR §271.1 (2010).
16 Public Health Law Center
A recent study challenges the assumption that a tax or fee on sugar drinks would be regressive.158 Specifically, this study found that even though lower-income households tended to purchase more sugar drinks than higher-income households, lower-income households were more sensitive to price and purchased sugar drinks at a lower average price than middle- or higher-income households.159 As a result of the price sensitivity of low-income households, this study found that the cost of a 40 percent sales tax on sugar drinks was distributed unequally among different socio-economic groups, with low-income households paying roughly 20 percent of the tax, middle-income households paying approximately 50 percent of the tax, and the highest-income households paying 30 percent of the tax.160
This study provides some evidence that low-income consumers would not pay a disproportionate amount of any tax or fee imposed on sugar drinks as is often assumed. In addition, the exemption of SNAP benefits from state sales taxes would make sugar drinks taxed with state sales taxes less expensive when the sugar drinks are purchased with SNAP benefits.
Another possible way a tax on sugar drinks could have an impact on obesity is if revenue generated through the tax is used to subsidize healthier foods such as fruits and vegetables, thereby making them more affordable to low-income individuals. This may offset any perceived regressivity of the tax.
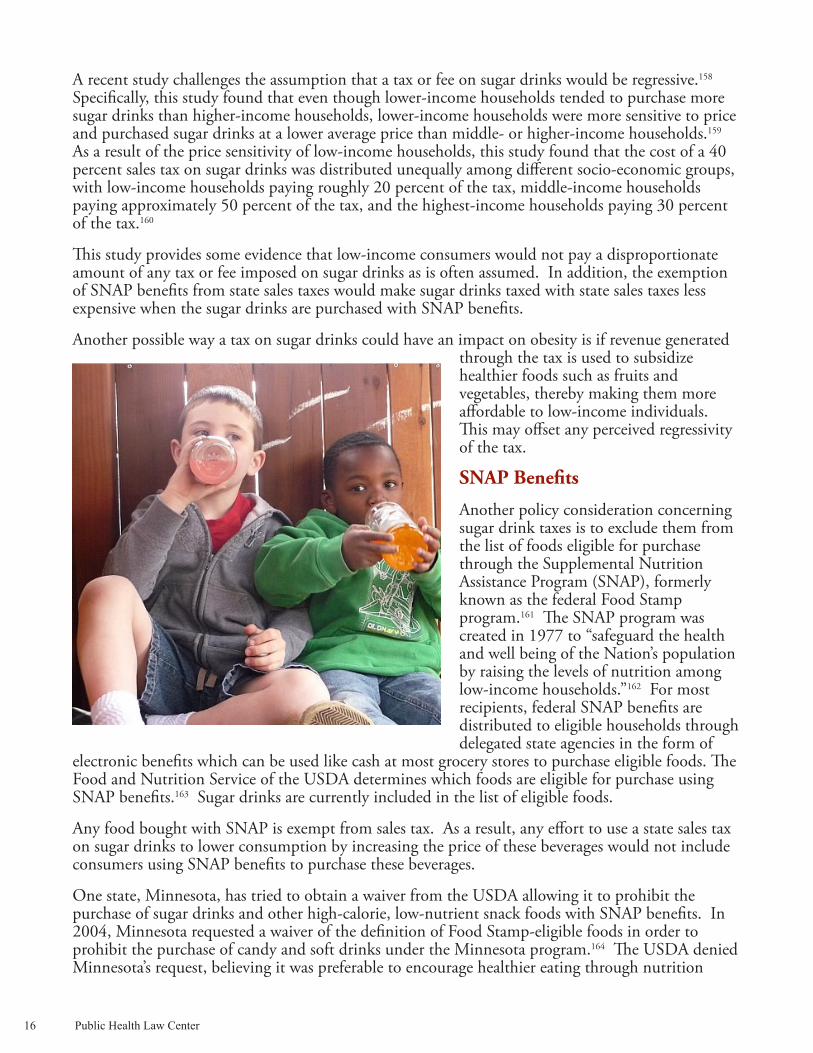
SNAP Benefits
Another policy consideration concerning sugar drink taxes is to exclude them from the list of foods eligible for purchase through the Supplemental Nutrition Assistance Program (SNAP), formerly known as the federal Food Stamp program.161 The SNAP program was created in 1977 to “safeguard the health and well being of the Nation’s population by raising the levels of nutrition among low-income households.”162 For most recipients, federal SNAP benefits are distributed to eligible households through delegated state agencies in the form of
electronic benefits which can be used like cash at most grocery stores to purchase eligible foods. The Food and Nutrition Service of the USDA determines which foods are eligible for purchase using SNAP benefits.163 Sugar drinks are currently included in the list of eligible foods.
Any food bought with SNAP is exempt from sales tax. As a result, any effort to use a state sales tax on sugar drinks to lower consumption by increasing the price of these beverages would not include consumers using SNAP benefits to purchase these beverages.
One state, Minnesota, has tried to obtain a waiver from the USDA allowing it to prohibit the purchase of sugar drinks and other high-calorie, low-nutrient snack foods with SNAP benefits. In 2004, Minnesota requested a waiver of the definition of Food Stamp-eligible foods in order to prohibit the purchase of candy and soft drinks under the Minnesota program.164 The USDA denied Minnesota’s request, believing it was preferable to encourage healthier eating through nutrition

Public Health Law Center 17
education and health promotion than through policy change.165 More recently, in October 2010, New York City Mayor Michael Bloomberg requested a waiver from USDA to allow the city to conduct a two-year demonstration program to evaluate the impact of prohibiting the use of SNAP benefits to purchase sugar drinks. As of early 2011, the USDA had yet to rule on this request.166 Illinois, Nebraska and Texas also considered legislation in 2011 to remove certain items, including sugar drinks, from the list of SNAP-eligible foods.167
While federal regulations currently exempt SNAP purchases from state sales taxes, federal regulations do not exempt SNAP purchases from state excise taxes. Thus, the price of sugar drinks purchased with SNAP benefits would be impacted by state excise tax initiatives. Accordingly, state excise taxes on sugar drinks would have a greater impact on those beverages purchased with SNAP benefits than would a sales tax of the same size.168
Artificially Sweetened BeveragesArtificially-sweetened, non-caloric beverages have not been included in most discussions of sugar drink taxation, as these beverages do not contain calories and are not generally believed to
Safety of Artificial SweetenersWhile the Food and Drug Administration (“FDA”) has approved the use of artificial sweeteners in beverages, there is ongoing debate about potential health risks associated with these sweeteners, especially for children and adolescents. The safety of two commonly used artificial sweeteners, aspartame and saccharin, continues to be evaluated by the Environmental Protection Agency (“EPA”). In 2010, the EPA renewed the scrutiny of aspartame as part of an ongoing analysis of up to 200 chemicals commonly found in many household and food products. At the same time, the EPA decided to remove saccharin from its list of hazardous substances on December 14, 2010. Saccharin, an artificial sweetener used in diet soft drinks, chewing gum and juice, was labeled as a potentially cancer-causing substance in the late 1980s. The National Toxicology Program and the International Agency for Research on Cancer re-evaluated the available scientific information on saccharin and its salts in the late 1990s and concluded that they are not potential human carcinogens. EPA removed saccharin and its salts from its lists of hazardous substances because the EPA determined that the scientific basis for these substances remaining on EPA’s lists no longer applied. Additionally, some studies are finding a connection between consumption of diet soda and an increased incidence of strokes.
Sources:Sheila Kaplan, EPA develops neurotoxicants list, new testing, AM. U. SCH. OF COMM. INVESTIGATIVE REPORTING WORKSHOP, Dec. 22, 2010, http://investigativereportingworkshop.org/investigations/toxic-influence/story/epa-develops-neurotoxicants-list/ (last visited Feb. 18, 2011).
Press Release, U.S. Envtl. Protection Agency, EPA Removes Saccharin from Hazardous Substances Listing (Dec. 14, 2010), http://yosemite.epa.gov/opa/admpress.nsf/d0c-f6618525a9efb85257359003fb69d/ea895a11ea50a56d852577f9005e2690!OpenDocument (last visited Feb. 18, 2011).
Marilynn Marchione, Diet soda tied to stroke risk, but reasons unclear, THE WASHINGTON POST (February 9, 2011), http://groups.yahoo.com/i?i=vxyidr5lnirhffolmrhfbqzm2xb2cxn5&e=mwmarrow%40aol%2Ecom (last visited Feb. 20, 2011).
18 Public Health Law Center
contribute to the obesity epidemic. Some are concerned that increasing the price of sugar-sweetened beverages relative to the price of artificially-sweetened ones will lead to increased consumption of artificially-sweetened beverages, which may prove in the future to be harmful to health in other ways.169
Notwithstanding the fact that artificial sweeteners are currently classified as safe by the Food and Drug Administration (see text panel, below), any effort to reduce the consumption of sugar drinks should be sensitive to the potential for unanticipated health impacts from an increase in the consumption of artificially-sweetened beverages. Initiatives to encourage the consumption of water, unsweetened low- and non-fat milk and alternative dairy products (e.g. rice and soy milk), and unsweetened tea and coffee in place of sugar drinks could reduce the risk that consumers will respond to taxes and fees on sugar drinks by replacing these beverages with artificially-sweetened beverages.
Response of the Beverage IndustryWhen considering the implementation of a tax or fee on sugar drinks, it is imperative to anticipate the response of the beverage industry to these pricing initiatives. This response can have a tremendous impact not only on whether or not sugar drink taxes are successfully enacted, but also on the effectiveness of the taxes in reducing consumption of these beverages and related obesity rates.
Industry Opposition to Sugar Drink Pricing Policies
Not surprisingly, the beverage industry opposes taxation of sugar drinks. The “industry” is broadly defined for purposes of this brief as consisting of manufacturers, bottlers and distributors, grocery and convenience stores, and other retailers and restaurants. Industry opposition to these price initiatives generally focuses on political, rather than legal, arguments. Industry argues, among other things, that taxes will have a disproportionate and unfair impact on low-income consumers, and will cause job losses. Industry also asserts that it is unfair to single out the consumption of sugar drinks as a cause of the obesity epidemic, and that taxation will not produce meaningful health benefits.170
Legal challenges to taxing sugar drinks do not appear to be a significant obstacle to the success of these initiatives at this time. Federal and state governments have broad authority to impose taxes on consumer products. As a result, courts generally defer to the government’s authority to impose these types of taxes. Therefore, tax initiatives avoid the legal issues seen with other efforts to impact commercial activity, such as laws impacting commercial speech and advertising.171 Unlike taxes, regulatory fee initiatives must ensure that there is the legally required connection between the amount of the fee, the service or item on which the fee is placed, and the activities funded by the fee. The beverage industry may challenge regulatory fees on sugar drinks by attacking the links between consumption of these beverages, the negative health or weight outcomes attributed to the consumption of these beverages, and any government program funded by the fee.
While the policy and legal arguments against imposing taxes or fees on sugar drinks do not appear to be much of an obstacle, the biggest challenge the beverage industry may pose to the success of these taxes and fees is through the mobilization of public opposition to these initiatives. The beverage industry has invested vast resources in large scale media and lobbying campaigns to defeat proposals for state and municipal taxes on sodas and snack foods. Despite the fact that the well-funded opposition has been effective in derailing state and local efforts to implement new taxes on sugar drinks, the 2011 legislative session has seen a resurgence of tax legislation being filed throughout the country.
Public Health Law Center 19
In 2010 industry opposition effectively stopped efforts to pass soda taxes at the local and state level, including those in Mississippi, New Mexico, New York, Philadelphia and Washington, D.C.172 173 One of the most dramatic illustrations of the power of the corporate interests arrayed against these taxes was seen in the State of Washington, which in 2010 enacted a temporary excise tax of 2 cents per twelve ounces on soda and other sugar drinks to help address a $2.8 billion state budget gap.174 In response, the beverage industry mounted the most expensive ballot initiative in the state’s history, spending more than $16,000,000 on successful media campaigns to overturn the tax.175 Almost all of the funding for the ballot campaign came from the American Beverage Association, the trade association representing Coca Cola, Pepsi and other beverage manufacturers, bottlers and distributors.
Beverage Industry Pricing Strategies
The effectiveness of any increase in the price of sugar drinks will also be affected by the competitive strategies used by beverage manufacturers and food retailers in response to the price increase.176 For example, manufacturers could spread the cost of an excise tax across both sugar-sweetened and artificially-sweetened products, creating a situation in which the relative price of a sugar-sweetened beverage as compared to an artificially-sweetened or other beverage remains unchanged.177
How the industry will respond to the imposition of new fees or taxes on sugar drinks is unknown. However, there are several lessons to be learned from tobacco control efforts. For example, many tobacco control initiatives involve increased taxes on tobacco products. The tobacco industry has responded with creative, strategically-targeted price reductions, coupon programs and promotional prices that have limited the impact of taxes on consumer behavior.178 However, even though the tobacco industry has tried to counter the effect of tobacco taxes on the use of tobacco products, the taxation of tobacco products has played a fundamental role in reducing the use of tobacco products.179
The Way ForwardDespite the success of industry opposition to recent proposals to tax sugar drinks, many states and municipalities continue to pursue taxation of sugar drinks both to generate revenue in response to the current fiscal crisis and to curtail the obesity epidemic. Deciding the best pricing policy to pursue to reduce consumption of sugar drinks and generate revenue is dependent on the taxing authority of the state or locality considering a pricing policy and on how each of the four key policy considerations, discussed above, is approached.
As of early 2011, as many as fourteen states were considering taxes on sugar drinks to reduce obesity rates and generate revenue to help close state and local budget gaps and to fund obesity prevention or other health programs. These include bills proposed in Mississippi, Connecticut, Hawaii, New Mexico, New York, Oregon, and Vermont.180 The scope of these bills varies considerably. An unsuccessful bill proposed in Hawaii would have established a one cent per ounce tax on sugar-sweetened beverages, to be paid by distributors or retailers, and would have created a children’s health promotion fund with the tax revenue. Vermont is also considering a one cent per ounce excise tax, while Oregon is weighing an excise tax of a half-penny per ounce on the sale of sugar-sweetened beverages and concentrates to establish a Health Promotion Fund to support programs designed to reduce and prevent obesity.181
At the same time, the beverage industry is continuing to invest millions of dollars in aggressive media campaigns and lobbying efforts at the national, state, and local levels against sugar drink tax initiatives. The beverage industry launched an intensive lobbying effort in response to discussions regarding a federal tax on sugar sweetened beverages in 2009. Specifically, the American Beverage
20 Public Health Law Center
Association alone spent over $18.8 million in 2009 and almost $10 million in 2010 lobbying Congress and federal agencies.182 It appears that opponents to taxes on sugar drinks are mounting campaigns against specific state initiatives on a state-by-state basis. For example, a media campaign has been launched against the proposed initiative in New Mexico, as evidenced by a recent website launched by “No New Mexico Food Taxes” located at: http://www.nonmfoodtaxes.com/.183 A similar campaign has been launched in Vermont, as seen by the “Stop the Vermont Beverage Tax” website, located at http://www.novermontbeveragetax.com/.184 Most recently, a new national television advertising campaign warns ominously about invasive government efforts to control the public’s eating habits, carefully describing the products involved, not as sugar drinks, but rather as “food” and “groceries,” notwithstanding their lack of nutritional value.
Several national public health organizations are closely monitoring state and local developments, and have created numerous resources to assist policy-makers considering these tax initiatives. Advocates and policy-makers can use these resources to find up-to-date information on federal, state, and local sugar drink tax initiatives. For example, the Yale Rudd Center for Food Policy and Obesity, perhaps the leading authority on the topic, has developed a searchable database for current and past state legislation proposing taxes on sugar drinks (found at http://www.yaleruddcenter.org/legislation/search.aspx) and a revenue calculator to determine how much revenue each state and select cities could generate with a sugar drink tax, as well as background papers and other materials (general information found at http://www.yaleruddcenter.org/). The National Policy and Legal Analysis Network to Prevent Childhood Obesity (“NPLAN”) has also developed valuable resources, including model sugar-sweetened beverage tax legislation, a policy brief, and an overview of the sugar-sweetened beverage state tax legislation considered in 2010 (found at: http://www.phlpnet.org/). The Center for Science in the Public Interest has created fact sheets on sugar drinks and tax initiatives and also has a tax calculator to determine potential revenue generation from a sugar drink tax (found at: http://www.cspinet.org/liquidcandy/).
Other national organizations involved in the sugar drink tax debate include ImpacTeen, an interdisciplinary collaboration of nationally recognized health experts and part of the Robert Wood Johnson Foundation’s Bridging the Gap program. ImpacTeen focuses on economic, environmental, and policy influences on youth substance use, obesity and physical activity, and has developed several resources regarding sugar drink taxes (found at http://www.impacteen.org/). In addition, the Public Health Law Center at William Mitchell College of Law provides legal technical assistance to health leaders, officials, and advocates advancing public health initiatives, including obesity prevention initiatives (found at http://publichealthlawcenter.org/).
ConclusionThe use of pricing policies on sugar drinks holds promise to reduce consumption of these beverages, improve weight outcomes, and generate revenue for obesity prevention and public health initiatives. While reducing the consumption of these beverages will not single-handedly halt the obesity epidemic in the United States, growing evidence supports the use of pricing policies on sugar drinks as one of the most significant components of a comprehensive effort to reduce the prevalence of obesity and unhealthy weights. While some obstacles exist to the implementation of these pricing policies, much can be learned from other public health initiatives using taxes or fees to impact consumption patterns, including tobacco control initiatives.
Dedicating revenue generated from sugar drink pricing initiatives to obesity prevention initiatives, including the funding of incentives to promote the consumption of healthier foods, will ensure the greatest impact of these initiatives on weight outcomes. It is important to acknowledge that dedicating this revenue to public health initiatives may be politically difficult in the current fiscal
climate. At the same time, however, the need to generate funds to bridge state and local budget gaps may actually provide additional political support for these taxes and create a climate in which there is greater awareness of the issues associated with the increased consumption of sugar drinks and related health and weight outcomes. Recognizing the potential need to compromise on the use of revenue generated from the taxation of sugar drinks, public health advocates should focus attention on opportunities to use revenue from sugar drink taxes to support the consumption of healthy foods and public health initiatives supporting healthy weight.
Public Health Law Center 21

EndnotesU.S. DEP’T. OF AGRICULTURE & U.S DEP’T OF HEALTH AND HUMAN SERVICES, DIETARY GUIDELINES FOR AMERICANS 2010 16 (2010), http://www.cnpp.usda.gov/Publications/DietaryGuidelines/2010/PolicyDoc/PolicyDoc.pdf (last visited Feb. 4, 2011). Katherine M. Flegal et al., Prevalence and Trends in Obesity Among US Adults, 1999-2008, 303 J. OF THE AM. MED. ASS’N. 235, 235-236 (2010), http://jama.ama-assn.org/content/303/3/235.full.pdf+htmlhttp://jama.ama-assn.org/con-tent/303/3/235.full.pdf+html.
ROBERT WOOD JOHNSON FOUND., TRUST FOR AMERICA’S HEALTH, F AS IN FAT: HOW OBESITY THREATENS AMERICA’S FUTURE 4 (2010), http://www.rwjf.org/files/research/20100629fasinfatmainreport.pdf (last visited Feb. 18, 2011).
Roland Sturm and Kenneth B. Wells. Does obesity contribute as much to morbidity as poverty or smoking?, 115 PUBLIC HEALTH 229, 234 (2001), http://www.rand.org/content/dam/rand/pubs/reprints/2008/RP952.pdf (last visited January 28, 2011). INST. OF MED. OF THE NAT’L. ACAD., BRIDGING THE EVIDENCE GAP IN OBESITY PREVENTION: A FRAMEWORK TO INFORM DECISION MAKING 35 (Shiriki K. Kumanyika et al. eds., 2010).
Youfa Wang et al., Will All Americans Become Overweight or Obese? Estimating the Progression and Cost of the US Obesity Epidemic, 16 OBESITY 2323, 2329 (2008), http://www.nature.com/oby/journal/v16/n10/pdf/oby2008351a.pdf (last visited Feb. 18, 2011).
INST. OF MED. OF THE NAT’L. ACAD., supra note 5, at 35–54.
ROBERT WOOD JOHNSON FOUND., supra note 3, at 42.
Vasanti S. Malik et al., Intake of sugar-sweetened beverages and weight gain: a systematic review, 84 AM. J. CLINICAL. NUTRITION 274, 285 (2006), http://www.ajcn.org/content/84/2/274.full.pdf+html (last visited Feb. 18, 2011).
TRAVIS A. SMITH, BIING-HWAN LIN, JOQ-YING LEE, UNITED STATES DEPARTMENT OF AGRICULTURE, TAXING CALORIC SWEETENED BEVERAGES: POTENTIAL EFFECTS ON BEVERAGE CONSUMPTION, CALORIE INTAKE, AND OBESITY 2 (2010), http://www.ers.usda.gov/Publications/ERR100/ERR100.pdf (last visited Feb. 18, 2011).
ROBERT WOOD JOHNSON FOUND., supra note 3, at 42.
Jame F. Chriqui et al., State Sales Tax Rates for Soft Drinks and Snacks Sold through Grocery Stores and Vending Machines, 2007, 29 JOURNAL OF PUBLIC HEALTH POLICY 226, 238-241 (2008).
ROBERT WOOD JOHNSON FOUND., supra note 3, at 42.
Id. at 4.
National Center for Chronic Disease Prevention and Health Promotion, CTR FOR DISEASE CONTROL AND PREVENTION, Behavioral Risk Factor Surveillance System: Prevalence and Trends Data: Nationwide (States and DC) – All Available Years Overweight and Obesity (BMI), http://apps.nccd.cdc.gov/BRFSS/display.asp?TrendValue=3&state=UB&cat=OB&yr=0&qkey=4409&gr (last visited (Lp=0&SUBMIT5=Go (last visited Feb. 8, 2011).
Liwei Chen et al., Reduction in consumption of sugar-sweetened beverages is associated with weight loss: the PREMIER trial, 89 AM. J. CLINICAL NUTRITION 1299, 1299 (2009), http://www.ajcn.org/content/early/2009/04/01/ajcn.2008.27240.full.pdf+html (last visited Feb. 18, 2011).
Id.
U.S. DEP’T. OF AGRICULTURE & U.S DEP’T OF HEALTH AND HUMAN SERVICES, supra note 1, at 8.
HODAN FARAH WELLS & JEAN C. BUZBY, U. S. DEP’T. OF AGRICULTURE, DIETARY ASSESSMENT OF MAJOR TRENDS IN U.S. FOOD CONSUMPTION, 1970-2005 1 (2008), http://www.ers.usda.gov/Publications/EIB33/EIB33.pdf (last visited Feb. 18, 2011).
Gail Woodward-Lopez et al., To what extent have sweetened beverages contributed to the obesity epidemic?, 14 PUBLIC HEALTH NUTRITION 1 (2010).
1
2
3
4
5
6
7
8
9
11
12
13
14
15
10
22 Public Health Law Center
16
17
18
19
20

ROBERT WOOD JOHNSON FOUND., supra note 3, at 77–79.
Id. at 20–21.
Id. at 77.
Flegal et al., supra note 2, at 240.
ROBERT WOOD JOHNSON FOUND., supra note 3.
Id. at 102.
Malik et al., supra note 9, at 274.
Jonathan D. Klein & William Dietz, Childhood Obesity: The New Tobacco, 29 HEALTH AFF. 388, 388 (2010).
U.S. DEP’T. OF AGRICULTURE & U.S DEP’T OF HEALTH AND HUMAN SERVICES, supra note 1, at 9.
Klein & Dietz, supra note 28.
ROBERT WOOD JOHNSON FOUND., supra note 3, at 102.
INST. OF MED. OF THE NAT’L. ACAD., LOCAL GOVERNMENT ACTIONS TO PREVENT CHILDHOOD OBESITY 14 (Lynn Parker et al. eds., 2009).
Eric A. Finkelstein et al., Annual Medical Spending Attributable to Obesity: Payer- And Service-Specific Estimates, 28 HEALTH AFFAIRS w822, w829 (2009) [hereinafter Finkelstein, Annual Medical Spending].
Id. at w826.
INST. OF MED. OF THE NAT’L. ACAD., PROGRESS IN PREVENTING CHILDHOOD OBESITY: HOW DO WE MEASURE UP? 25 (Jeffrey P. Koplan et al. eds. 2007).
CTR FOR DISEASE CONTROL AND PREVENTION, Overweight and Obesity, Economic Consequences, http://www.cdc.gov/obesity/causes/economics.html (last updated Aug. 19, 2009) [hereinafter CTR FOR DISEASE CONTROL AND PREVENTION, Overweight and Obesity, Economic Consequences].
ROBERT WOOD JOHNSON FOUND., supra note 3.
Eric A. Finkelstein et al., The Lifetime Medical Cost Burden of Overweight and Obesity: Implications for Obesity Prevention, 16 OBESITY 1843, 1847 (2008).
Youfa Wang et al., supra note 6, at 2329–2330.
Id.
Id. at 2329.
Finkelstein et al., Annual Medical Spending Attributable to Obesity, supra note 33, at w828.
CTR FOR DISEASE CONTROL AND PREVENTION, Overweight and Obesity, Economic Consequences, supra note 36.
Finkelstein et al., Annual Medical Spending Attributable to Obesity, supra note 33, at w828–w829.
CTR FOR DISEASE CONTROL AND PREVENTION, Overweight and Obesity, Economic Consequences, supra note 36. See Table 2 for state specific costs attributed to obesity.
Youfa Wang et al., supra note 6, at 2324.
CTR FOR DISEASE CONTROL AND PREVENTION, Overweight and Obesity, Economic Consequences, supra note 36.
ROBERT WOOD JOHNSON FOUND., supra note 3.
Martin-J Sepulveda et al., Impact of Childhood Obesity on Employers, 29 HEALTH AFFAIRS 513, 518 (2010).
38
36
37
39
40
21
22
23
24
25
26
27
28
29
30
32
33
34
31
35
Public Health Law Center 23
42
41
43
44
45
46
48
47
49

Id. at 516.
John Cawley & Johanna Catherine Maclean. Unfit for Service: The Implications of Rising Obesity for U.S. Military Recruitment 20 (NAT’L. BUREAU OF ECON. RESEARCH, Working Paper 16408) (2010), http://www.nber.org/papers/w16408 (last visited Feb. 20, 2011).
Id. at 4.
Diagnoses of overweight/obesity, active component, U.S. Armed Forces, 1998-2008, 16 Medical Surveillance Monthly Report 2, 6 (2009), http://www.afhsc.mil/viewMSMR?file=2009/v16_n01.pdf (last visited Feb. 18, 2011).
Barry M. Popkin et al., A new proposed guidance system for beverage consumption in the United States, 83 AM. J. CLINICAL NUTRITION 529, 536, 538 (2006).
Malik et al., supra note 9, at 285.
Sara N. Bleich et al., Increasing consumption of sugar-sweetened beverages among US adults: 1988-1994 to 1999-2004, 89 AM. J. CLINICAL NUTRITION 372, 380 (2009), http://www.ajcn.org/content/89/1/372.full.pdf+html (last visited Feb. 18, 2011).
Woodward-Lopez et al., supra note 20., at 7.
Popkin et al., supra note 54, at 529.
Id.
Id.
Bleich et al., supra note 56, at 374.
SMITH, LIN & LEE, supra note 10, at 4.
Popkin et al., supra note 54, at 529.
Id. at 529, 537.
Y. Claire Wang et al., Increasing Caloric Contribution from Sugar-Sweetened Beverages and 100% Fruit Juices Among US Children and Adolescents, 1988 - 2004, 121 PEDIATRICS e1604, e1604 (2008), http://pediatrics.aappublications.org/cgi/reprint/121/6/e1604 (last visited Feb. 18, 2011).
Kelly D. Brownell et al., The Public Health and Economic Benefits of Taxing Sugar-Sweetened Beverages, 361 NEW ENG. J. OF MED. 1599, 1599 (2009), http://www.nejm.org/doi/pdf/10.1056/NEJMhpr0905723 (last visited Feb. 18, 2011) [hereinafter Brownell et al., The Public Health and Economic Benefits of Taxing Sugar-Sweetened Beverages].
Malik et al., supra note 9, at 282, 285.
Woodward-Lopez et al., supra note 20., at 7.
Lenny R. Vartanian et al., Effects of Soft Drink Consumption on Nutrition and Health: A Systematic Review and Meta-Analysis, 97 AM. J. OF PUB. HEALTH 667, 674 (2007), http://ajph.aphapublications.org/cgi/reprint/97/4/667 (last visited Feb. 18, 2011).
Catherine S. Berkey et al., Sugar-Added Beverages and Adolescent Weight Change, 12 OBESITY RESEARCH 778, 778 (2004) available at http://www.nature.com/oby/journal/v12/n5/pdf/oby200494a.pdf (last visited Feb. 18, 2011).
David S. Ludwig et al., Relation between consumption of sugar-sweetened drinks and childhood obesity: a prospective, observational analysis, 357 THE LANCET 505, 505 (2001).
Brownell et al., The Public Health and Economic Benefits of Taxing Sugar-Sweetened Beverages, supra note 66, at 1599.
Vartanian et al., supra note 69, at 673.
Ludwig et al., supra note 71, at 507.
Malik et al., supra note 9, at 284, 286.
50
51
52
53
54
55
56
57
58
64
65
66
67
68
69
70
71
72
24 Public Health Law Center
59
60
61
62
63
73
74
75
Vartanian et al., supra note 69, at 669.
D.P. DiMeglio & Richard D. Mattes. Liquid versus solid carbohydrate: effects on food intake and body weight, 24 INT’L. J. OF OBESITY 794, 798-799 (2000), http://www.nature.com/ijo/journal/v24/n6/pdf/0801229a.pdf (last visited Feb. 18, 2011).
Liwei Chen et al., supra note 16., at 1304.
Cara B. Ebbeling et al., Effects of Decreasing Sugar-Sweetened Beverage Consumption on Body Weight in Adolescents: A Randomized, Controlled Pilot Study, 117 PEDIATRICS 673, 673, 678 (2006), http://pediatrics.aappublications.org/cgi/reprint/117/3/673 (last visited Feb. 18, 2011).
Liwei Chen et al., supra note 16., at 1304–1305.
Id.
Malik et al., supra note 9, at 284.
Bleich et al., supra note 56, at 380.
Teresa T. Fung et al., Sweetened beverage consumption and risk of coronary heart disease in women, 89 American Journal of Clinical Nutrition 1037 (2009).
Malik et al., supra note 9, at 285.
Id. at 286.
Popkin et al., supra note 54, at 537–538.
Vartanian et al., supra note 69, at 673.
Thomas R. Frieden et al., Reducing Childhood Obesity Through Policy Change: Acting Now to Prevent Obesity, 29 HEALTH AFFAIRS 357, 358 (2010).
Lisa M. Powell & Frank J. Chaloupka. Food Prices and Obesity: Evidence and Policy Implications for Taxes and Subsidies, 87 MILBANK QUARTERLY 229, 230 (2009).
Frank J. Chaloupka & Patricia A. Davidson, TOBACCO CONTROL LEGAL CONSORTIUM, Applying Tobacco Control Lessons to Obesity: Taxes and Other Pricing Strategies to Reduce Consumption 2 (2010), http://publichealthlawcenter.org/sites/default/files/resources/tclc-syn-obesity-2010.pdf (last visited Feb. 18, 2011).
Brownell et al., The Public Health and Economic Benefits of Taxing Sugar-Sweetened Beverages, supra note 66.
Chaloupka & Davidson, supra note 91, at 2.
Frieden et al., supra note 89, at 358.
SMITH, LIN & LEE, supra note 10, at 2.
Lawrence O. Gostin. Public Health Law: Power, Duty, Restraint 91-95 (2nd ed. 2008).
Using Regulatory Fees to Combat the Adverse Effects of Sugar-Sweetened Beverages, PUB. HEALTH LAW AND POLICY 2 (2009), http://www.phlpnet.org/sites/phlpnet.org/files/PHLP-SodaFeePolicyBrief_FINAL_091218_0.pdf (last visited Feb. 20, 2010).
Id.
Id.
Id.
MINN. STAT. §115B.49 (2010).
MINN. STAT. §115B.49, Subd. 1.
76
77
78
79
80
81
Public Health Law Center 25
82
83
84
85
86
87
88
89
90
91
92
93
94
95
96
97
98
99
100
101
102
MINN. STAT. §115B.49, Subd. 3.
SMITH, LIN & LEE, supra note 10, at 14.
Id.
Brownell et al., The Public Health and Economic Benefits of Taxing Sugar-Sweetened Beverages, supra note 66, at 1602.
Kelly D. Brownell & Thomas R. Frieden, Ounces of Prevention –The Public Policy Case for Taxes on Sugared Beverages, 360 NEW ENG. J. MED. 1805, 1807 (2009).
Brownell et al., The Public Health and Economic Benefits of Taxing Sugar-Sweetened Beverages, supra note 66, at 1602.
American Heritage Dictionary of the English Language, (4th ed., Houghton Mifflin Company, 2006).
Brownell et al., The Public Health and Economic Benefits of Taxing Sugar-Sweetened Beverages, supra note 66, at 1602.
SMITH, LIN & LEE, supra note 10, at 15.
Id.
Brownell et al., The Public Health and Economic Benefits of Taxing Sugar-Sweetened Beverages, supra note 66, at 1602.
Chaloupka & Davidson, supra note 91, at 9–10.
Id.
Id.
7-Eleven Fun Facts, http://corp.7-eleven.com/AboutUs/FunFacts/tabid/77/Default.aspx (last visited Feb. 18, 2011).
Id.
Sugar Stacks, http://www.sugarstacks.com/beverages.htm.
Chaloupka & Davidson, supra note 91, at 9–10.
Id.
Daniel Kim & Ichiro Kawachi. Food Taxation and Pricing Strategies to “Thin Out” the Obesity Epidemic, 30 AM. J. PREVENTITIVE MED. 430, 433 (2006).
Powell & Chaloupka, supra note 90, at 245, 249.
Jason M. Fletcher et al., Can Soft Drink Taxes Reduce Population Weight?, 28 CONTEMPORARY ECON. POL’Y. 23, 24, 30 (2010), http://onlinelibrary.wiley.com/doi/10.1111/j.1465-7287.2009.00182.x/pdf (last visited Feb. 18, 2011).
Roland Sturm et al., Soda Taxes, Soft Drink Consumption, and Children’s Body Mass Index, 29 HEALTH AFFAIRS 1052, 1052 (2010).
Tatiana Andreyeva et al., The Impact of Food Prices on Consumption: A Systematic Review of Research on the Price Elasticity of Demand for Food, 100 AM. J. OF PUB. HEALTH 216, 220 (2009), http://www.yaleruddcenter.org/resources/upload/docs/what/economics/FoodPricesElasticity_AJPH_2.10.pdf (last visited Feb. 18, 2011).
Fletcher et al., supra note 124, at 30.
Powell & Chaloupka, supra note 90, at 245, 249.
ROBERT WOOD JOHNSON FOUND., supra note 3 at 72.
Brownell et al., The Public Health and Economic Benefits of Taxing Sugar-Sweetened Beverages, supra note 66, at 1602.
Andreyeva et al., supra note 126.
26 Public Health Law Center
103
104
105
106
107
108
109
110
111
112
113
114
115
116
117
118
119
120
121
122
123
124
125
126
127
128
129
130
131
Jason P. Block et al., Point-of-Purchase Price and Education Intervention to Reduce Consumption of Sugary Soft Drinks, 100 AM. J. OF PUB. HEALTH 1427, 1432 (2010).
Brownell et al., The Public Health and Economic Benefits of Taxing Sugar-Sweetened Beverages, supra note 66, at 1599.
Id.
Frieden et al., supra note 89, at 358.
Id.
Powell & Chaloupka, supra note 90, at 248– 249.
Chaloupka & Davidson, supra note 91, at 7.
Wang et al., supra note 65, at e1604–e1605.
Id.
SENATE FINANCE COMMITTEE, DESCRIPTION OF POLICY OPTIONS: FINANCING COMPREHENSIVE HEALTH CARE REFORM: PROPOSED HEALTH SYSTEM SAVINGS AND REVENUE OPTIONS 36 (2009).
CONGRESSIONAL BUDGET OFFICE, Budget Options Vol. 1, Health Care 192 (2008).
SENATE FINANCE COMMITTEE, DESCRIPTION OF POLICY OPTIONS: FINANCING COMPREHENSIVE HEALTH CARE REFORM: PROPOSED HEALTH SYSTEM SAVINGS AND REVENUE OPTIONS 36 (2009).
CONGRESSIONAL BUDGET OFFICE, Budget Options Vol. 1, Health Care 192 (2008).
Colo. Rev. Stat. §39-26-707 (2010).
Id.
YALE RUDD CENTER FOR FOOD POLICY AND OBESITY, http://www.yaleruddcenter.org/legislation/search.aspx (last visited March 29, 2011).
GOVERNOR DAVID A. PATERSON. STATE OF NEW YORK 2010-2011 EXECUTIVE BUDGET BRIEFING BOOK, 130-131 (2010), http://www.budget.state.ny.us/pubs/archive/fy1011archive/eBudget1011/fy1011littlebook/BriefingBook.pdf (last visited Feb. 18, 2011).
Press Release, City of New York, Statement of Mayor Michael R. Bloomberg on the Revised Sugar-Sweetened Beverage Tax, PR-219-10 (May 20, 2010), http://www.nyc.gov/portal/site/nycgov/menuitem.c0935b9a57bb4ef3daf2f1c701c789a0/index.jsp?pageID=mayor_press_release&catID=1194&doc_name=http%3A%2F%2Fwww.nyc.gov%2Fhtml%2Fom%2Fhtml%2F2010a%2Fpr219-10.html&cc=unused1978&rc=1194&ndi=1(last visited Feb. 18, 2011).
GOVERNOR PATERSON, supra note 148.
Sturm et al., supra note 125, at 1052.
AMERICAN HEART ASSOCIATION/AMERICAN STROKE ASSOCIATION, POSITION STATEMENT ON BEVERAGE TAXES AND OBESITY PREVENTION 2, http://www.americanheart.org/downloadable/heart/1253908320586Beverage%20Tax%20Position%20Statement%20-%20final.pdf (last visited Feb. 18, 2011).
Chaloupka & Davidson, supra note 91, at 3–4.
Frieden et al., supra note 89, at 358.
Brownell et al., The Public Health and Economic Benefits of Taxing Sugar-Sweetened Beverages, supra note 66, at 1603.
Id.
Powell & Chaloupka, supra note 90, at 247.
Eric A. Finkelstein et al., Impact of Targeted Beverage Taxes on Higher- and Lower-Income Households, 170 ARCHIVES INTERNAL MED. 2028, 2033 (2010) [hereinafter Finkelstein et al., Impact of Targeted Beverage Taxes].
Public Health Law Center 27
132
133
134
135
136
137
138
139
140
141
142
143
144
145
146
147
148
149
150
151
152
153
154
155
156
157
158

Id. at 2030–2033.
Id. at 2032.
SMITH, LIN & LEE, supra note 10, at 15.
7 CFR §271.1 (2010).
See generally 7 CFR §271 (2010).
See Letter from Ollice C. Holden, Reg’l Adm’r, Supplemental Nutrition Assistance Program, U.S. Dep’t of Agriculture to Maria Gomez, Assistant Comm’r, Econ. and Cmty. Support Strategies, Minn. Dep’t of Human Servs. (May 4, 2004), http://www.fns.usda.gov/snap/rules/Memo/2004/050404.htm (last visited Feb. 18, 2011).
Id.
See Press Release, City of New York, Mayor Bloomberg and Governor Paterson Propose Excluding Sugary Drinks from Food Stamp Purchases in New York City (Oct. 7, 2010), http://www.nyc.gov/portal/site/nycgov/menuitem.c0935b9a57bb4ef3daf2f1c701c789a0/index.jsp?pageID=mayor_press_release&catID=1194&doc_name=http%3A%2F%2Fwww.nyc.gov%2Fhtml%2Fom%2Fhtml%2F2010b%2Fpr424-10.html&cc=unused1978&rc=1194&ndi=1(last visited Feb. 18, 2011).
YALE RUDD CENTER FOR FOOD POLICY AND OBESITY, supra note 147.
SMITH, LIN & LEE, supra note 10, at 15.
CENTER FOR SCIENCE IN THE PUBLIC INTEREST, http://www.cspinet.org/reports/chemcuisine.htm#safety_summary (last visited March 29, 2011).
Brownell et al., The Public Health and Economic Benefits of Taxing Sugar-Sweetened Beverages, supra note 66, at 1603.
Chaloupka & Davidson, supra note 91, at 5.
Joey Peters, Industry lobbying turns soda taxes from fizzy to flat, STATELINE: STATE POLICY & POLITICS, UPDATED DAILY (July 7, 2010), http://www.stateline.org/live/details/story?contentId=496567 (last visited Feb. 18, 2011).
Valerie Bauerlein & Betsy McKay, Soda Tax Uncaps a Fight: Beverage Makers Step Up Campaigns Against Levy as Cities, States Weigh Idea, WALL ST. J. (May 23, 2010), http://online.wsj.com/article/SB10001424052748704904604575262530291194198.html (last visited Feb. 18, 2011).
See Washington Repeal Tax Law Amendments, Initiative 1107 (2010), BALLOT PEDIA, http://ballotpedia.org/wiki/index.php/Washington_Repeal_Tax_Law_Amendments,_Initiative_1107_(2010)#cite_note-18 (last visited Jan. 8, 2011).
Id.
SMITH, LIN & LEE, supra note 10, at 15.
Id.
Chaloupka & Davidson, supra note 91, at 4–5.
Id. at 3.
YALE RUDD CENTER FOR FOOD POLICY AND OBESITY, supra note147.
Id.
OPENSECRETS.ORG: CENTER FOR RESPONSIVE POLITICS, http://www.opensecrets.org/lobby/clientsum.php?id=D000000491&year=2010.
NO FOOD AND BEVERAGE TAXES NEW MEXICO, http://www.nonmfoodtaxes.com/.
STOP THE VERMONT BEVERAGE TAX, http://www.novermontbeveragetax.com/.
28 Public Health Law Center
159
160
161
162
163
164
165
166
167
168
169
170
171
172
173
174
175
176
177
178
179
180
181
182
183
184

Public Health Law Center 29


Public Health Law Center875 Summit Avenue
St. Paul, Minnesota 55105-3076651.290.7506 . Fax: 651.290.7515
www.publichealthlawcenter.org


