37
Working paper Taxing vacant urban land in Kampala Astrid R.N. Haas Mihaly Kopanyi July 2018 When citing this paper, please use the title and the following reference number: C-43407-UGA-1
Working paper
Taxing vacant urban land in Kampala
Astrid R.N. Haas Mihaly Kopanyi
July 2018 When citing this paper, please use the title and the followingreference number:C-43407-UGA-1

1
Key Messages
• Vacant land constitutes an estimated 8-10% of Kampala’s land. However, this does not take into account abandoned or derelict buildings, space used for parking, or large pieces of land attached to small buildings. These are all types of land that have been categorised as vacant in other countries.
• Currently, vacant land is not classified as property under the Ugandan Ratings Act 2005, therefore it is not subject to property tax and is a potential source of lost revenue for Kampala Capital City Authority (KCCA).
• To help the city understand the magnitude of this potential lost revenue, this paper uses newly collected urban cadastre data to provide some initial estimates. Two parishes from the centre of the Kampala were selected as test cases.
• The researchers find that there is an estimated loss of revenue between UGX 245 million ($65,000) and UGX 1.8 billion (USD 478,000) depending on the model chosen. Therefore, the KCCA may want to consider requesting legislation that allows the taxation of vacant urban land.
• In addition, implementing such a tax requires various legal and policy considerations to be taken into account. The researchers provide six policy and legal considerations for city policymakers to deliberate in regards to any changes to vacant land policy.
Introduction
Taxing land in general, but taxing unimproved land in particular has a major potential and untapped source of revenue for cities in developing countries. Economists has been advocating a tax on unimproved land for centuries as it is arguably a non-distortionary and therefore efficient form of taxation (George 1879). This is due to the fact that land is in a fixed supply with its value derived primarily from its location, economic and population growth, and public investments, thus holding vacant land for long is very beneficial for owners who often keep land for speculative gains (Nam 2010, Freire and Kopanyi 2018). Land value appreciates commensurately and without a tax, owners realize the full value-gain. A fair way to channel a portion of value-gain to public budgets is through a property tax and a capital-gain tax the government can collect and invest for the growth of the city.
There are, however, a multitude of reasons that land in a city may be vacant (see Haas and Kopanyi 2017). Therefore, in addition to the lost value in terms of revenue, vacant urban land can also present major urban planning challenge to cities. For example, in Kampala, there is a substantial amount of vacant land in the city centre the highest value zone in Uganda. This is inefficient for city growth, from urban development, connectivity and density perspectives; but also because it hinders most efficient use of land. Therefore, taxing vacant land is particularly important in Uganda where most land

2
is privately held, vacant land is untaxed, and an estimated 8-10% of land remains undeveloped and therefore vacant.
The evidence on whether a tax can induce any urban planning benefits or not, is mixed and strongly depends on the reason it is vacant (Haas and Kopanyi 2017). For the city of Kampala, no specific research into why land is vacant has been done to date. However, as vacant land falls outside the definition of “property” as per what can be taxed under the Ratings Act 2005, it does mean that the various unbuilt areas of the city, are a potential untapped source of revenue (Kopanyi 2015).
Taxing vacant land in Uganda would require changes both legislation and policies. Imposing any type of tax on land or property, however, can be an unpopular and politically difficult undertaking. Therefore, to inform policy dialogues toward such legislation, this paper assesses the potential of revenue that is being lost through excluding vacant land from the tax-roll. Following a comprehensive review of the evidence from research and case studies from other countries (Haas and Kopanyi 2017) this paper now extends analysis to Kampala data from the recently completed urban cadastre and property valuation using the Civic Centre and the Kololo I parishes of the Central Business District of Kampala.
The paper first addresses key legislative and policy issues to describe the context in which the potential for taxing vacant urban land should be considered, as the objective of this research is to provide reasonable structured evidence for a national policy dialogue on this issues. The second and longer part of the paper presents five different options and methodologies for estimating the potential from taxing vacant urban land based on the sample of two parishes. The analysis of valuation options goes beyond traditional tax potential estimates, that otherwise also depend on serious assumptions, to provide short explanations on how these methods would be applicable in Kampala context. The paper closes by summarizing conclusions and further research options. As a reference, the authors have also annexed a short summary of the Kampala Capital City Authority’s (KCCA) property valuation system and methodology that was used for the most recent round of valuation.
Policy Issues and Options for Taxing Vacant Land in Kampala
Rough calculations suggest that over 8-10% of land in KCCA’s jurisdiction remains undeveloped. However, this is probably underestimated as it does not include abandoned buildings or excessive open spaces attached to properties, which may also fall into a definition of vacant land. Furthermore, as will be elaborated upon later in this paper, even though there are developments, many have a very low floor-area-ration (FAR). Kampala has also extended beyond KCCA’s jurisdiction. In the Greater Kampala Area, where the urban sprawl is taking place, this figure may be even higher.
3
Therefore, it seems that capturing this vacant land as part of the overall tax bracket for the city would improve equity and has very substantial tax-revenue potential (Haas & Kopanyi 2017, Lafuente 2009). Furthermore, this also underpins current KCCA policy; for example, the loss of potential revenue as well as the unfairness of leaving urban vacant land untaxed has already been mentioned by the KCCA as well as in national dialogues1 (Nam 2010). However, to date, this issue still has yet to be addressed systematically and strategically.
Policymakers in the KCCA face multiple challenges when considering the options and modalities for taxing vacant land. Therefore, understanding these is a first step to any further change in legislation:
Legal Issues
The Ratings Act 2005 defines only buildings and structures as taxable property. Therefore, vacant land, is excluded from the property tax bracket by definition, thus exempting it from any tax payment. It is worth noting that changing the Ratings Act 2005 to enable KCCA levy property tax on vacant land is a necessary, albeit not sufficient condition for implementation.
The property valuation base in Uganda, is the rental value. This seriously limits possibilities for taxing vacant land, since this type of land is usually not leased out for rent; from discussions with various policy-makers, there seems to be a consensus that this is the case. However, we do believe, as demonstrated in this paper, that reference values can be obtained, and there are therefore options to overcome this challenge.
In Uganda, capital gains tax is a national tax paid upon the disposal of a non-depreciable asset. Therefore, under this definition, land and buildings are included as well. However, these are included as part of the income base of the tax payer and assessed as business income (URA 2015). Land and other real properties are subject of capital-gains tax in many other countries, however, not as part of the income tax. Capital-gains tax on financial assets are national tax and can be part of the income tax; in contrast, tax on transfer of property is mostly local government tax, especially in developed countries. Property tax and a capital gains tax are not mutually exclusive levies, rather, they both have their own functions and roles. Thus, legislators should therefore consider two changes: a) separating the capital-gain tax on real properties from income tax
1 “Owners of idle urban land could soon start paying tax for it… artificial scarcity of land and land hoarding, is holding Kampala from robust and meaningful growth… Land has become a popular investment pass-time for those with money to buy land and wait for its value to appreciate. This kind of land should attract an annual capital gains tax because its value keeps on rising astronomically.” said the secretary of Uganda National Urban Forum, Samuel Mabala” (Nam 2010)
4
and b) turning this tax to local government revenue, beyond and above annual property tax.
Policy issues
There is precedence with the KCCA’s jurisdiction to tax properties based on evidence of market rates from other properties. For example, commercial and industrial properties are taxed regardless if they are rented, leased or used by the owners themselves. International experience shows that this same policy is usually applicable for vacant urban land as well; i.e. that vacant land is taxed based on evidence from the best possible use from other land. (Freire and Kopanyi 2018, Haas and Kopanyi 2017, Lafuente 2009). Therefore, given there is already precedence, similar methodologies can be adapted to vacant land. Furthermore, this particular option would most likely not require any legal intervention, but rather be considered a policy decision by the KCCA.
Countries that levy property taxes on market value, rather than rental value, have rich databases to establish the potential market value of vacant land. This can then be done using a simple definition of the tax base and procedures. For these countries, the tax base remains similar across developed, under-developed, abandoned, or vacant land. However, the tax rates are usually much higher for vacant land, often twice as much as the rate for developed urban land, e.g. tax on market value of land plus buildings is 1%, vacant land 2%. (Haas and Kopanyi 2017). Thus administering a next-best-use tax in property tax systems based on rental incomes, functions as an alternative that emulates higher tax rates on vacant land in market value system. Setting the next-best-use tax, however, can be challenging and requires, amongst other considerations, an unbiased definition.
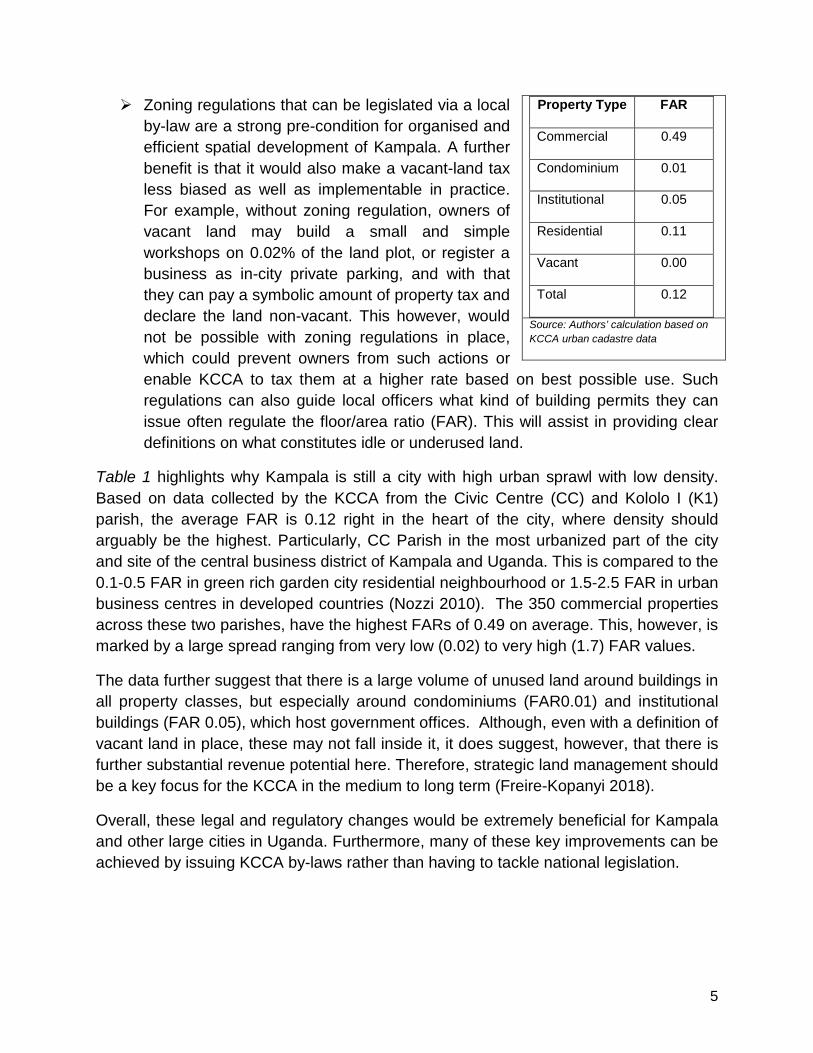
Table 1: FAR Values in Civic Centre and Kololo I Parishes
5
Zoning regulations that can be legislated via a local by-law are a strong pre-condition for organised and efficient spatial development of Kampala. A further benefit is that it would also make a vacant-land tax less biased as well as implementable in practice. For example, without zoning regulation, owners of vacant land may build a small and simple workshops on 0.02% of the land plot, or register a business as in-city private parking, and with that they can pay a symbolic amount of property tax and declare the land non-vacant. This however, would not be possible with zoning regulations in place, which could prevent owners from such actions or enable KCCA to tax them at a higher rate based on best possible use. Such regulations can also guide local officers what kind of building permits they can issue often regulate the floor/area ratio (FAR). This will assist in providing clear definitions on what constitutes idle or underused land.
Table 1 highlights why Kampala is still a city with high urban sprawl with low density. Based on data collected by the KCCA from the Civic Centre (CC) and Kololo I (K1) parish, the average FAR is 0.12 right in the heart of the city, where density should arguably be the highest. Particularly, CC Parish in the most urbanized part of the city and site of the central business district of Kampala and Uganda. This is compared to the 0.1-0.5 FAR in green rich garden city residential neighbourhood or 1.5-2.5 FAR in urban business centres in developed countries (Nozzi 2010). The 350 commercial properties across these two parishes, have the highest FARs of 0.49 on average. This, however, is marked by a large spread ranging from very low (0.02) to very high (1.7) FAR values.
The data further suggest that there is a large volume of unused land around buildings in all property classes, but especially around condominiums (FAR0.01) and institutional buildings (FAR 0.05), which host government offices. Although, even with a definition of vacant land in place, these may not fall inside it, it does suggest, however, that there is further substantial revenue potential here. Therefore, strategic land management should be a key focus for the KCCA in the medium to long term (Freire-Kopanyi 2018).
Overall, these legal and regulatory changes would be extremely beneficial for Kampala and other large cities in Uganda. Furthermore, many of these key improvements can be achieved by issuing KCCA by-laws rather than having to tackle national legislation.
Property Type FAR
Commercial 0.49
Condominium 0.01
Institutional 0.05
Residential 0.11
Vacant 0.00
Total 0.12
Source: Authors’ calculation based on KCCA urban cadastre data
6
Modelling the Revenue Potential for Taxing Vacant Urban Land
There are several options and approaches conceptually to estimate the revenue potential from taxing vacant urban land. It should be noted that estimating revenue potential to inform policy dialogue, which is what this paper aims to do, is a different exercise to estimating values to enter into the tax roll; the latter requires higher precision and valuation experts’ opinion. Therefore, interpretations of these methodologies and results is open to some flexibility. However, even these rough estimates are a vital step to support evidence-based policy dialogue about the rational, modalities, system, and procedures for taxing vacant land.
To outline potential methodologies, we have approached analysis from various different angles. These includes: estimating based on best possible use from aggregate figures, which is akin to a rough ball-park estimate; estimating best possible use by identified comparative taxation value evidence; regression modelling based on the relation between land size, taxable values and location amenities. We also outline two other methods that can be used for estimation, namely based on points based assessments and value-zones.
Zones selected for modelling
The Central Division was selected for analysis because this is the Division KCCA has updated property valuation and the rateable values gazetted and applied in practice in 2018. Furthermore, it is part of the central business district and therefore value of land, and potential loss of revenue from urban vacant land, may be highest. From this division, as previously noted, we selected two parishes: Civic Centre (CC) Parish and Kololo 1 (K1) parish. CC was selected as it is at the heart of the CBD that is the prime business area of Kampala where commercial activities are concentrated. We added to the analysis K1 parish, which is primarily residential, because CC has hardly any residential properties.
The urban cadastre data, collected by the KCCA during the most recent property valuation exercise, provide for the information base for the analysis. To supplement and enhance the analysis, the KCCA GIS team also estimated the plot size (area) and shapes of vacant land-plots based on GIS coordinates. This was done because the urban cadastre does not include data on land areas.
Table 2 presents the key property features in CC and K1 parishes. In summary, our analysis includes 936 pieces of land and 911 taxable properties. The total built area, as per the urban cadastre, is 803,839 m2 with an average built area of a property being 846 m2. The largest property is 24,962 m2 and the smallest is 4 m2. The largest estimated plot area is 60,110 m2 and the smallest is 185 m2. The average land area is 7,393 m2 and the total area under analysis is 6,920,014 m2. The total rateable value of

7
all the buildings in these two parishes is UGX 72.5 billion (USD 19.5 million) and the potential property tax revenue is UGX 4.4 billion (USD 1.17million).
Table 2: Key Property Attributes, Tax-base and Tax Levies in Main Property Categories in Civic Centre and Kololo I Parishes
Property Type No. Average
Built Area (m2)
Average Land Plot Size (m2)
Average Rateable
Value UGX
Max Rateable Value in UGX
Average Property Tax UGX
Average Property
Tax in USD
Commercial 350 1,523 3,122 138,000,000 3,310,000,000 8,280,000 2,229
Condominium 163 128 10,197 14,600,000 58,100,000 876,000 236
Institutional 148 1,097 21,061 77,400,000 1,830,000,000 4,644,000 1,250
Residential 250 304 2,677 31,300,000 534,000,000 1,878,000 506
Vacant 25 0 15,157 N/A N/A N/A 0
Total 936 846 7,393 76,794,731 N/A 4,607,684 1,240
Source: Authors’ calculations based on KCCA urban cadaster data
This table further breaks down the descriptive statistics by property type to understand what the average built area, approximate average land plot size and average assessed rateable value as well as what a 6% property tax, the current rate levied by the KCCA, on the average value for each property type would render. From this, one can immediately discern, that on average commercial buildings have the highest rateable value and therefore are most important for property tax in Kampala’s Central Division. This conforms to the theory that building values, are higher closer to the centre of the city (Figure 1) and the reason why central business districts with large commercial buildings are located where they are (Lall et al 2017).
It is also interesting to note that institutional buildings, that include government offices, have very large land plot sizes relative to the built area per square metre, thus explaining the low FAR. Although in our analysis this is not included as vacant land, when thinking about densification of the city, this needs to be taken into account as well. The average built areas for residential and condominium buildings reflect the fact that aside from commercial buildings and some government office buildings are in fact single or at most double
Figure 1 – Residential Density in Kampala using Land-scan Data
Source: Venables (2015)
8
storied. Another interesting feature is the fact that for all building types, the range of rateable values is very broad, which indicates that even in the selection of two parishes in the centre of the city, there is very mixed use settlements in terms of both types of property but also in terms of size and quality.
There are 18 pieces of classified vacant land with complete information, as per the KCCA’s urban cadastre work, in the selected parishes2. This does not include land used, for example, for parking lots or washing bays in the middle of the city is not classified as vacant. Rather, together with structures like petrol stations, or telecom towers, where these sit on their own piece of land, they are classified as “special” properties and do fall into the tax bracket. In the analysis of the two parishes selected there were no properties of this category. For these properties, taxes are calculated based on reported revenue. However, one can assume that for these properties, taxable values are miniscule. In some places this would constitute part of the definition of urban vacant land.
In our models, only land with no structures, therefore undeveloped, was classified as vacant and land with abandoned or derelict buildings is not considered. However, as the review of the evidence and case studies from Haas and Kopanyi (2017) noted, there are many cities and countries that would include these types of buildings and areas of land into their definitions of vacant land or tax them with higher rate based on best use (Washington DC). This further underpinned by the fact that this type of use, such as a parking lot, may not be the most effective or efficient in the centre of the city where land values are high.
These 18 plots constitute a total area of 272,833 m2 vacant land, about 0.44% of the land in these jurisdictions. It is interesting to note that with an average plot size of 15,157 m2 the average vacant land plot is actually bigger than the average size of other properties, except plots with institutional buildings. Between the two parishes, K1 has more vacant land at approximately 164,564.14 m2 versus 108,269.21 m2 for CC parish. However, this is across fewer plots, namely 6 in K1 vs 12 in CC parish, thus the average vacant land plot size is significantly higher in K1 with 27,427.36 m2 compared to 9,022.43 m2 in CC. This large vacant land area suggests that there is an enormous potential for building and densification even in the very heart of Kampala. However, as noted before, this would require more research to clarify why these land-plots are vacant and if there are any legal constraints that hinder development, which would make some of these exempt from vacant-land tax.
2 It is important to keep in mind that there is no official legal definition of vacant land. Therefore, for purposes of this classification, the KCCA GIS team just took the plots of land that had no built structure on them as vacant land.
9
Tax potential estimates based on best possible use from aggregate figures
Using aggregate figures offers the first and very rudimentary way to estimate tax potential of vacant urban land in the two sample parishes. The supporting argument would be, that KCCA can simply assume that the vacant land should be valued at least based on the average rateable value of land in the respective parishes. In the Annex 3, which outlines the property valuation, it highlights that even though there is no official zoning, the city does take parishes as the administrative level for a zone for property valuation.
Table 3 summarises the results of the FAR. It shows that first, rateable values and FARs are closely correlated, second the average rateable value per square meter is UGX 10,695/m2, third, the average is about the same as the rateable value in residential area with single family homes. It is interesting to note that condominiums need more land, yet have low FARs; this is potentially a question that deserves further attention from the property valuation teams.
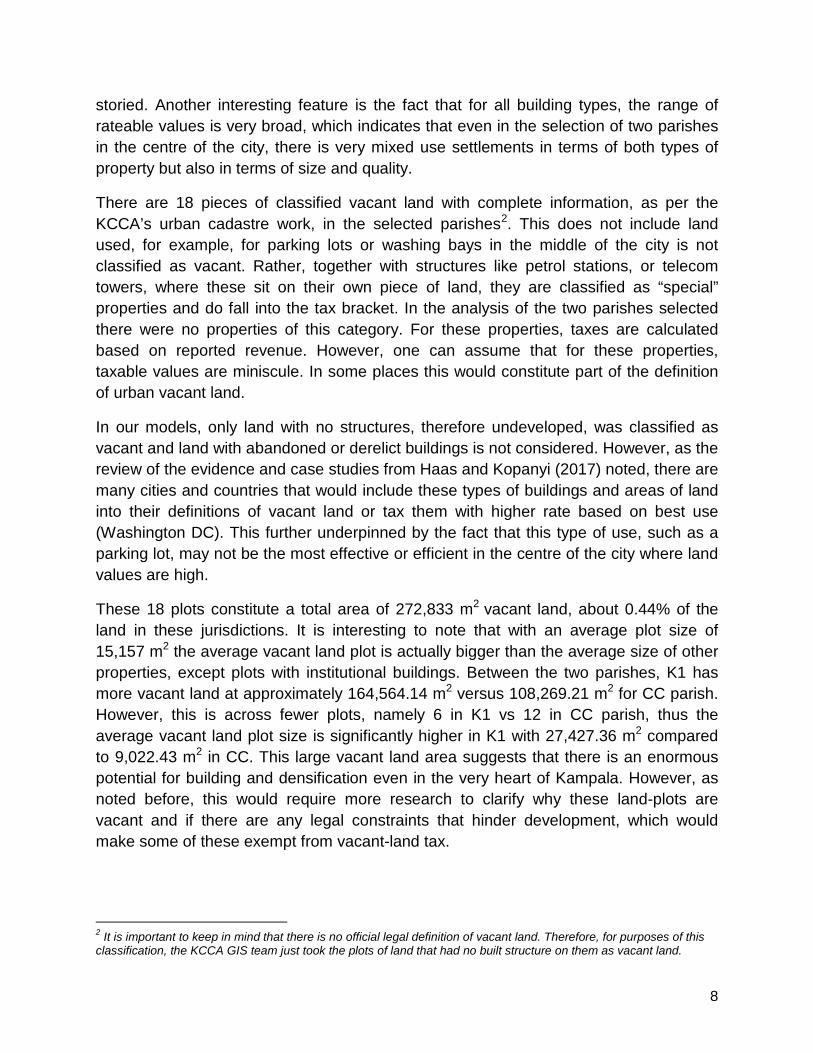
Figure 2 - Prime residential lot with 0.15 FAR in USA
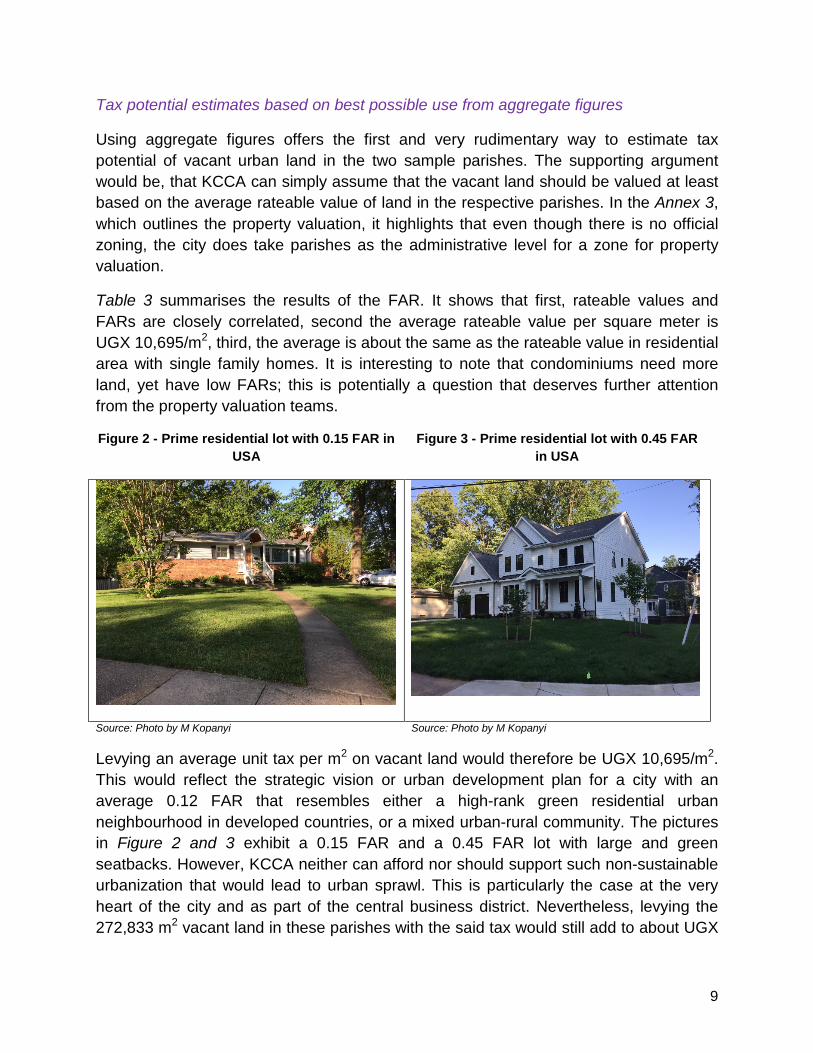
Figure 3 - Prime residential lot with 0.45 FAR in USA
Source: Photo by M Kopanyi Source: Photo by M Kopanyi
Levying an average unit tax per m2 on vacant land would therefore be UGX 10,695/m2. This would reflect the strategic vision or urban development plan for a city with an average 0.12 FAR that resembles either a high-rank green residential urban neighbourhood in developed countries, or a mixed urban-rural community. The pictures in Figure 2 and 3 exhibit a 0.15 FAR and a 0.45 FAR lot with large and green seatbacks. However, KCCA neither can afford nor should support such non-sustainable urbanization that would lead to urban sprawl. This is particularly the case at the very heart of the city and as part of the central business district. Nevertheless, levying the 272,833 m2 vacant land in these parishes with the said tax would still add to about UGX
10
3 billion (USD 795,000) rateable values and generate about, at the current 6% rate, UGX 175 million (USD 46,000) additional property tax.
KCCA can be more ambitious and more consistent with urban development and densification by levying the aggregate average unit tax (rateable value) of the commercial properties that is UGX 44,202/m2. This would result in about UGX 12 billion (USD 3 million) rateable values and generate about, at the current 6% rate, UGX 723 million (USD 192,000 USD) additional property tax. The arguments supporting this include the fact that sustainable urban development would require that new developments in the CBD and thus especially in CC Parish should aim a bare minimum 0.5 FAR ratio (i.e. the current average FAR of commercial properties in CC). This implies that any new developments in the centre should be pre-dominantly commercial or high-raise condominium, which could also be enshrined as part of a zoning regulation. It should, however, be re-emphasised, that these are ballpark figures and are therefore insufficient for the city to use as the actual basis for any fiscal cadastre or effective tax rates.
Tax potential estimates based on best possible use by comparative land-plots and ranking rated properties
Tax potential can be estimated more precisely and in line with the international best practices by levying vacant urban land plots with unit taxable values of comparative land-plots. These, however, can be challenging to establish as there are several important considerations:
a) Comparative plots should have identical or very similar off-site urban infrastructure amenities, i.e. access to road, water, sanitation, social services (schools, health-care facilities) and commercial services. These are largely available in CBD and especially in CC zone. It is also the reason why KCCA considers parishes as value zones.
b) It is unclear whether the size of the plot of land, between the vacant plot and the next best plot, should be identical or similar in size. In particular, when market forces are weak and the size of land may not correlate with the FAR or the value of the buildings on it. In this case, large plots may host small or low-value buildings that is unusual in well-developed cities but quite common in cities like Kampala (see Table 1 institutional buildings). Furthermore, the historic development, urban plans, and the economic power of a city will influence the median size of plots that host the highest unit value properties. In other words, should a plot appear to be too large for efficient development, developers will routinely subdivide the plot to maximize the value of the developed property. Table 3 illustrates the situation and challenges in CC and K1 parishes.

11
Table 3-Summary of Comparative Analysis of Land-plots and Rateable Values in CC and Kololo I Parishes
Source: Authors’ calculations based on KCCA data
Nevertheless, given the available data, in Kampala, we decided to estimate the value based on ranking related properties by the nearest plot of land in size. These results are also summarised in Table 3 with some interesting findings. In particular, there is a negative correlation between land size and rateable values in commercial properties, which is not something that one would predict at the centre of the city. In fact, one would assume that given the value of land in this area, developers would prefer to densify their land thoroughly, leading to a higher rateable value. Furthermore, land-plots of about 3,500 m2 seem to host the best investments measured in rateable value per m2 of land, i.e. UGX 323,128/m2 of land. This suggest that 3,500m2 plot is the current efficient size from developer’s perspective.
The smallest property shows the third largest comparative value at UGX 119,732/m2 of land (line 14 in Table 3). This could feasibly be a two-floor restaurant, or a similar property, with about 0.65 FAR. The group of smaller land-plots actually have three times larger average rateable values than the group of larger land-plots, UGX 76,670 and UGX 22,388 respectively. Finally, and perhaps most interestingly, the largest land-plots in the centre of the city, actually generate by far the least and in fact a negligible size of tax revenues UGX 85/m2.
12
Using these figures to undertake a mere comparable size of lot with commercial buildings which have the highest rateable values, the potential for property tax from vacant land in the two parishes under analysis is about UGX245 million (USD 67,000). Compared to the total rateable values in these two parishes UGX4.3 billion UGX (USD 1.13 million). This would only add about 0.06% to the total tax revenues for these two parishes, which is unrealistic. This is based on the fact that the top 4 properties in area size, include the National Theatre and Cultural Centre Buildings, which are classified as commercial properties. However, relative to the land that these buildings sit on, their built area is very small, the FARs are tiny (0.0014) and thus their rateable value is negligible. Based on this, it is clear that the simple comparable land size is not a good proxy to determine a rateable value for vacant urban land.
The data and international experiences suggest, however, that land-plots, larger than 3,000-8,000 m2 could be further subdivided if market forces are able to work smoothly. Therefore, using this size as reference, the comparative tax base could be a moderately high rateable value UGX107,482/m2 of land and 0.40 FAR value of the 8001m2 comparative property (Lines 9 and 10 in Table 3). From this calculation the total tax potential Kampala could gain from taxing vacant urban land in these two parishes at the very centre of the city is about UGX 29.3 billion (USD 6,1million) rateable value and UGX 1.8billion (USD 478,000) property tax revenue.
It should be noted that this estimate combines two factors: the comparative values and the principle of higher taxation of vacant than improved land by selecting a higher reference point for taxation (0.29 FAR) than the average (0.12FAR). The reference rateable value selected, UGX 107,482/m2, is compared to the average rateable value of UGX 24,296/m2 in the sample. Thus, this seems to be still a moderate estimate, since the smaller property (Line 18 in Table 3) has 0.40 FAR and the unit rateable value of UGX 119,723/m2 of land; selecting this as a taxation reference would trigger even higher taxation than the selected reference rate. Selecting the highest unit tax value (line 14) with 0.52 FAR would more than double the estimated property tax capacity.
Finally, it is important to note that this calculation is based on identifiable and verifiable reference property for calculating the taxable values. Therefore, it would be an applicable method and procedure for assigning property bases and levying property tax on urban vacant land. Furthermore, this methodology also includes a policy decision, namely to selecting the reference property from an actual sample and harmonizing the property tax with the urban development and zoning policies exemplified here by a selected FAR value for reference land plot.
13
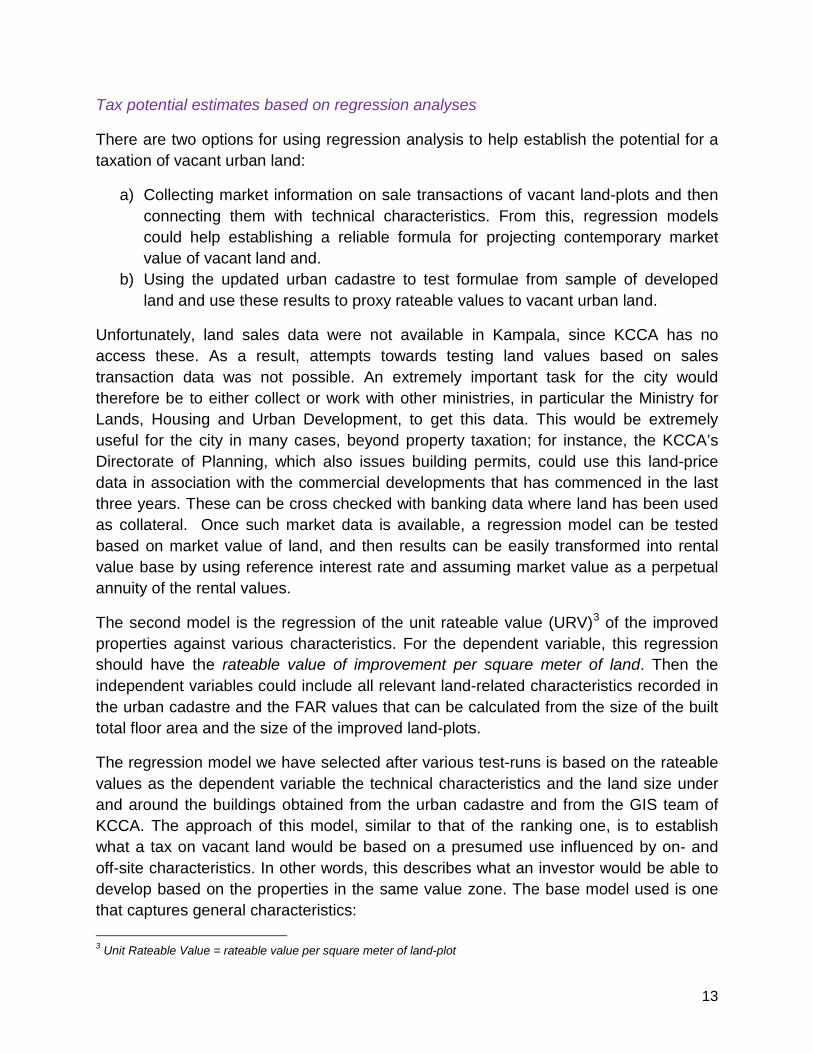
Tax potential estimates based on regression analyses
There are two options for using regression analysis to help establish the potential for a taxation of vacant urban land:
a) Collecting market information on sale transactions of vacant land-plots and then connecting them with technical characteristics. From this, regression models could help establishing a reliable formula for projecting contemporary market value of vacant land and.
b) Using the updated urban cadastre to test formulae from sample of developed land and use these results to proxy rateable values to vacant urban land.
Unfortunately, land sales data were not available in Kampala, since KCCA has no access these. As a result, attempts towards testing land values based on sales transaction data was not possible. An extremely important task for the city would therefore be to either collect or work with other ministries, in particular the Ministry for Lands, Housing and Urban Development, to get this data. This would be extremely useful for the city in many cases, beyond property taxation; for instance, the KCCA’s Directorate of Planning, which also issues building permits, could use this land-price data in association with the commercial developments that has commenced in the last three years. These can be cross checked with banking data where land has been used as collateral. Once such market data is available, a regression model can be tested based on market value of land, and then results can be easily transformed into rental value base by using reference interest rate and assuming market value as a perpetual annuity of the rental values.
The second model is the regression of the unit rateable value (URV)3 of the improved properties against various characteristics. For the dependent variable, this regression should have the rateable value of improvement per square meter of land. Then the independent variables could include all relevant land-related characteristics recorded in the urban cadastre and the FAR values that can be calculated from the size of the built total floor area and the size of the improved land-plots.
The regression model we have selected after various test-runs is based on the rateable values as the dependent variable the technical characteristics and the land size under and around the buildings obtained from the urban cadastre and from the GIS team of KCCA. The approach of this model, similar to that of the ranking one, is to establish what a tax on vacant land would be based on a presumed use influenced by on- and off-site characteristics. In other words, this describes what an investor would be able to develop based on the properties in the same value zone. The base model used is one that captures general characteristics: 3 Unit Rateable Value = rateable value per square meter of land-plot

14
URV = α + βj + ε
Where URV is the rateable value per square meter of the respective land-plot as per the gazetted 2017 valuation roll and βj is a vector of characteristics assumed to determine the value of the property from land perspective. From the urban cadastre we then, in conversation with the Chief Valuer of the KCCA, selected the following on- and off-site amenities as characteristics for modelling:
GPSN and GPSE coordinates of the property, the floor area (i.e. total built floor area) of the building in m2;
The approximate4 area of land that hosts the buildings in m2; FAR; Topography; The shape of the plot (i.e. whether it is a regular or irregular); The type neighbourhood; Whether the property has a water connection; Whether the property has an electricity connection; If there is regular garbage collection; If there is available street lighting; Whether the property is connected to the internet.
We ran two regressions using these independent variables: one with the total number of 813 properties with land and buildings, the other one with data from 284 commercial properties, because the Central Division is the site of the commercial business district and thus commercial developments for Kampala.
These two regression models indicate good prediction level R2=0.7000, and R2=0.6706 respectively, but many coefficients show very high relative standard errors. Furthermore, given the analysis is restricted to two zones in the central area of Kampala, many of these off-site amenities are generally available, thus do not add value to these particular regression models. If the analysis is extended further in the city, it is likely that there will be greater variation and therefore these variables may be re-included. Therefore, based on these first results, we ran regressions using less and less independent variables. Doing this, we ended up with a model with two independent variables, namely FAR and Neighbourhood. This actually improved the R2 for commercial properties to 0.6830 and did not significantly change the predictive value of the model with all properties.
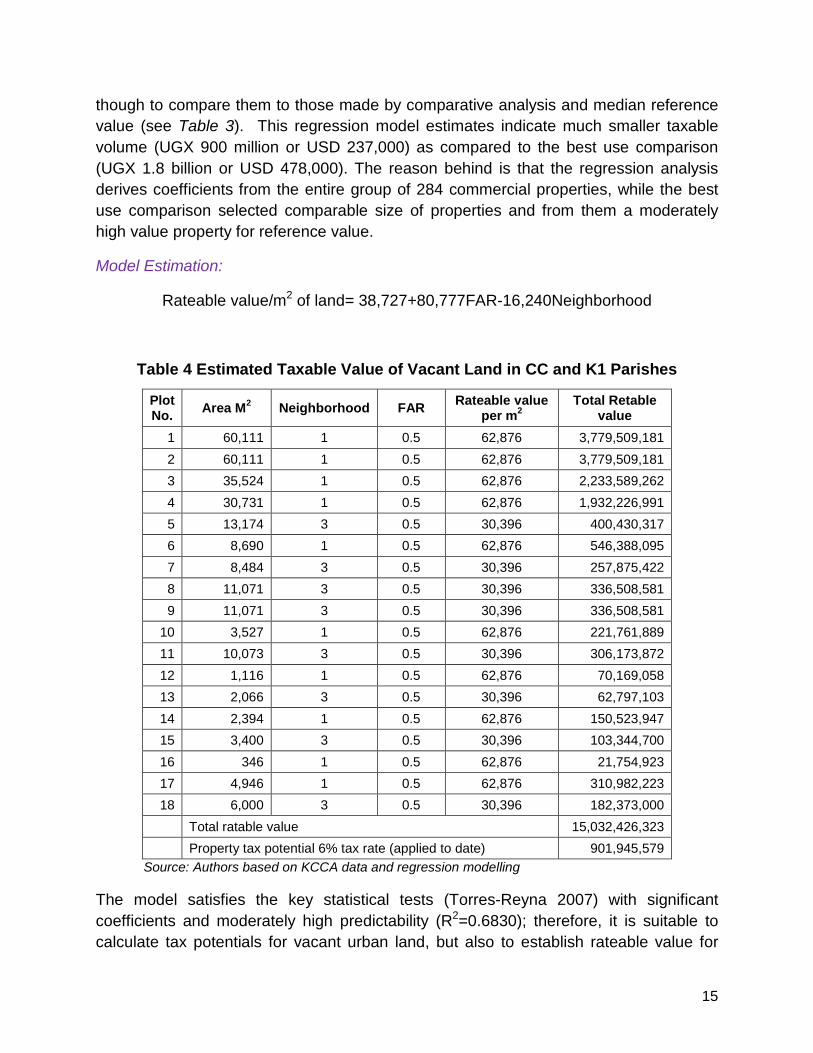
Table 4 summarizes the results and the estimated taxable values for the 18 vacant land-plots in CC and K1 parishes. The results, by magnitude of rateable value and tax potential, are very similar to estimates presented in above sections. It is more relevant
4 This is the approximate area of land as it does not conform to the land cadastre, rather is just an estimate provided by the KCCA GIS team for purposes of analysis.
15
though to compare them to those made by comparative analysis and median reference value (see Table 3). This regression model estimates indicate much smaller taxable volume (UGX 900 million or USD 237,000) as compared to the best use comparison (UGX 1.8 billion or USD 478,000). The reason behind is that the regression analysis derives coefficients from the entire group of 284 commercial properties, while the best use comparison selected comparable size of properties and from them a moderately high value property for reference value.
Model Estimation:
Rateable value/m2 of land= 38,727+80,777FAR-16,240Neighborhood
Table 4 Estimated Taxable Value of Vacant Land in CC and K1 Parishes
Plot No. Area M2 Neighborhood FAR Rateable value
per m2 Total Retable
value 1 60,111 1 0.5 62,876 3,779,509,181 2 60,111 1 0.5 62,876 3,779,509,181 3 35,524 1 0.5 62,876 2,233,589,262 4 30,731 1 0.5 62,876 1,932,226,991 5 13,174 3 0.5 30,396 400,430,317 6 8,690 1 0.5 62,876 546,388,095 7 8,484 3 0.5 30,396 257,875,422 8 11,071 3 0.5 30,396 336,508,581 9 11,071 3 0.5 30,396 336,508,581
10 3,527 1 0.5 62,876 221,761,889 11 10,073 3 0.5 30,396 306,173,872 12 1,116 1 0.5 62,876 70,169,058 13 2,066 3 0.5 30,396 62,797,103 14 2,394 1 0.5 62,876 150,523,947 15 3,400 3 0.5 30,396 103,344,700 16 346 1 0.5 62,876 21,754,923 17 4,946 1 0.5 62,876 310,982,223 18 6,000 3 0.5 30,396 182,373,000
Total ratable value 15,032,426,323 Property tax potential 6% tax rate (applied to date) 901,945,579
Source: Authors based on KCCA data and regression modelling
The model satisfies the key statistical tests (Torres-Reyna 2007) with significant coefficients and moderately high predictability (R2=0.6830); therefore, it is suitable to calculate tax potentials for vacant urban land, but also to establish rateable value for
16
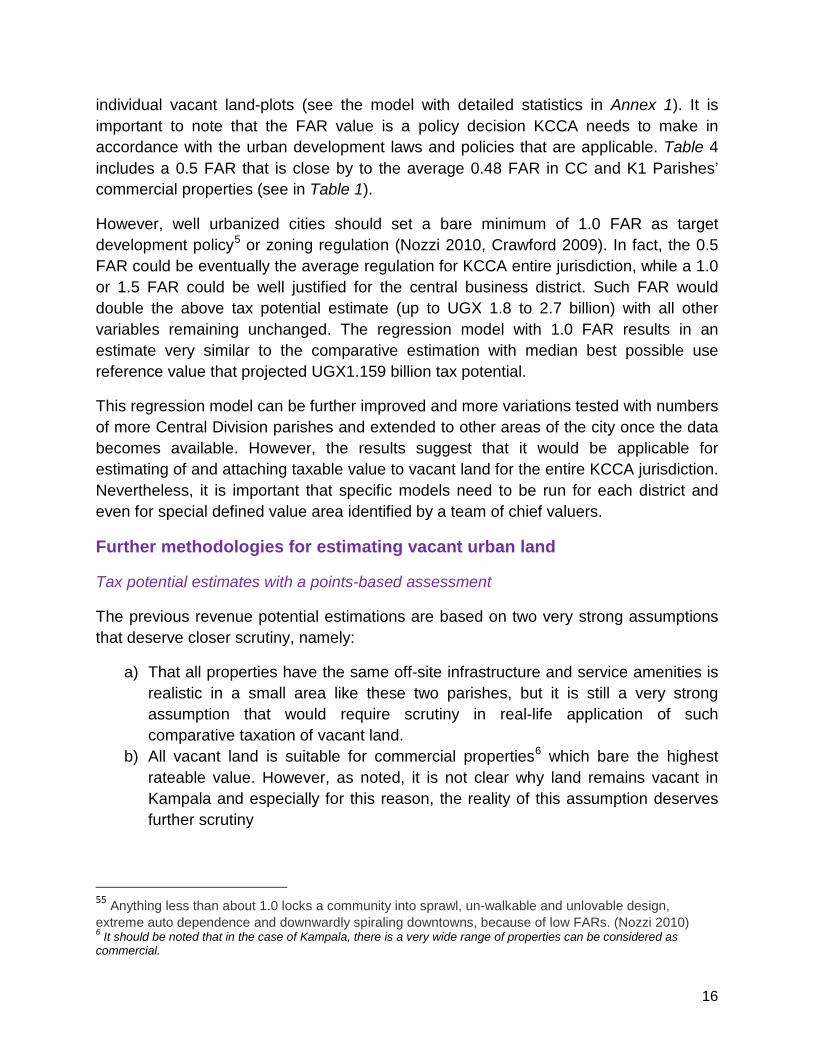
individual vacant land-plots (see the model with detailed statistics in Annex 1). It is important to note that the FAR value is a policy decision KCCA needs to make in accordance with the urban development laws and policies that are applicable. Table 4 includes a 0.5 FAR that is close by to the average 0.48 FAR in CC and K1 Parishes’ commercial properties (see in Table 1).
However, well urbanized cities should set a bare minimum of 1.0 FAR as target development policy5 or zoning regulation (Nozzi 2010, Crawford 2009). In fact, the 0.5 FAR could be eventually the average regulation for KCCA entire jurisdiction, while a 1.0 or 1.5 FAR could be well justified for the central business district. Such FAR would double the above tax potential estimate (up to UGX 1.8 to 2.7 billion) with all other variables remaining unchanged. The regression model with 1.0 FAR results in an estimate very similar to the comparative estimation with median best possible use reference value that projected UGX1.159 billion tax potential.
This regression model can be further improved and more variations tested with numbers of more Central Division parishes and extended to other areas of the city once the data becomes available. However, the results suggest that it would be applicable for estimating of and attaching taxable value to vacant land for the entire KCCA jurisdiction. Nevertheless, it is important that specific models need to be run for each district and even for special defined value area identified by a team of chief valuers.
Further methodologies for estimating vacant urban land
Tax potential estimates with a points-based assessment
The previous revenue potential estimations are based on two very strong assumptions that deserve closer scrutiny, namely:
a) That all properties have the same off-site infrastructure and service amenities is realistic in a small area like these two parishes, but it is still a very strong assumption that would require scrutiny in real-life application of such comparative taxation of vacant land.
b) All vacant land is suitable for commercial properties6 which bare the highest rateable value. However, as noted, it is not clear why land remains vacant in Kampala and especially for this reason, the reality of this assumption deserves further scrutiny
55 Anything less than about 1.0 locks a community into sprawl, un-walkable and unlovable design, extreme auto dependence and downwardly spiraling downtowns, because of low FARs. (Nozzi 2010) 6 It should be noted that in the case of Kampala, there is a very wide range of properties can be considered as commercial.
17
To analyse this, a procedure is required that can test each piece of vacant land against a set of pre-established criteria. The risk of getting it wrong may not be too high, because the onus would be on land owners to provide the evidence of why a plot of land is unsuitable for commercial development, either legal or technical reasons. Another method would be to implement a point-based property valuation system to value reference taxable values for vacant land.
The point-based system captures the on- and off-site amenities and characteristics of the properties and connects them with the market values or taxable values established through other valuation procedures. In the case of Kampala, the comparative values would be the ones established through Annex 3. A point-based system is therefore designed to help establish a tax base, rateable values, or tax levies by using technical information when there is shortage of market information that would hinder the applicability of sophisticated regression analyses, a common case in Africa (Fish, 2017).
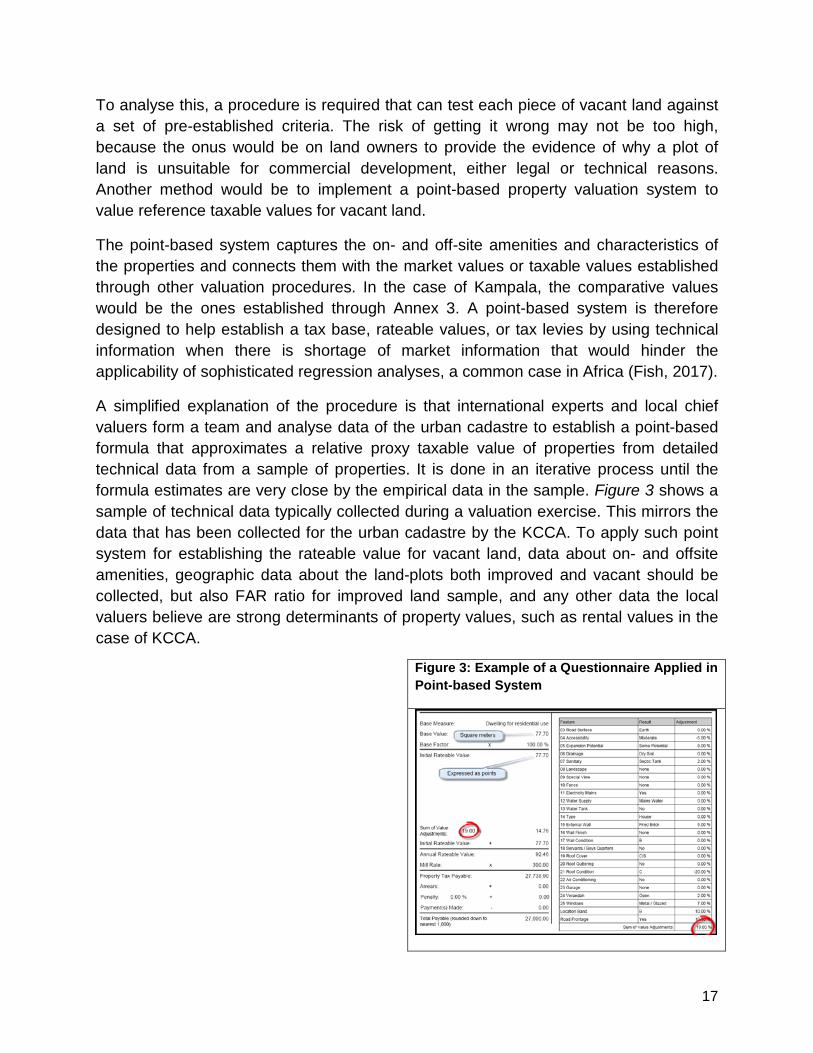
A simplified explanation of the procedure is that international experts and local chief valuers form a team and analyse data of the urban cadastre to establish a point-based formula that approximates a relative proxy taxable value of properties from detailed technical data from a sample of properties. It is done in an iterative process until the formula estimates are very close by the empirical data in the sample. Figure 3 shows a sample of technical data typically collected during a valuation exercise. This mirrors the data that has been collected for the urban cadastre by the KCCA. To apply such point system for establishing the rateable value for vacant land, data about on- and offsite amenities, geographic data about the land-plots both improved and vacant should be collected, but also FAR ratio for improved land sample, and any other data the local valuers believe are strong determinants of property values, such as rental values in the case of KCCA.
Figure 3: Example of a Questionnaire Applied in Point-based System
18
The essence of the procedure is attaching weights to the various factors that eventually define a formula that is applicable for the entire valuation zone in and urban cadastre. The point-based formulae include only relative weights. The so-called “mill rate” then establishes the bridge between the relative weights and the effective taxable values and/or levies.
The benefit of such point-based system, that is being tested in some African countries, such as Senegal, is that it does not require unbiased market data, which is usually very hard to find in most African cities. Furthermore, the results are easy to communicate with taxpayers, because people clearly understand the factors such as the land size and existence of on- and off-site amenities, for example if a road is tarmac or marram, if water and/or sanitation network is working in front of the property, if school is in close proximity etc.
Attempts has been made towards testing the point-based system for establishing the rateable values and calculating the tax potential of taxing vacant urban land in Kampala, but results have not yet been finalised at the time of this paper. Nevertheless, the authors, believe that a point-based valuation model would serve a cost-effective and reliable solution for attaching taxable values to vacant urban land in Kampala’s districts and valuation zones. As detailed valuation would be meaningful exercise, it is something that can be carried out in parallel to any legislative changes the KCCA decides to pursue, which will necessarily take time. The results from this would then be further evidence to underpin the policy dialogue and help address some of the assumptions that have been made in creating the other models in this paper.
Value-zones: Pragmatic tools for simple area-based assessment of taxable value
Most cities in developing countries face the same challenges as Kampala: a severe shortage of reliable information on land-sale transactions. When this data exists, it is usually marred by a strong underreporting bias of the sales price to avoid or reduce transfer or property taxes. Some cities in south-east Europe and India have circumvented these challenges by establishing valuation zones in a city solely for taxation purposes (Kelly 2018).
Valuation zones are standard parts of many property tax systems, and play an especially important role in mass valuation procedures. Innovative cities have emulated this with complicated econometric modelling using computer aided mass valuation (CAMA) and then establishing value zones through a committee comprised of expert valuers, urban planners, developers, and financial experts. The committee defines simple value scores (like A, B, C, D), assess the defined areas of the city and then attaches a relative value mark based on expert opinion and committee votes.
Source: Fish 2017
19
Value-zone procedures are usually well accepted, because citizens are well aware of that different areas of a city have variations in property values. Thus taxpayers tend to accept a committee decision, more than they would an individual’s valuation. Each value zone is then assigned a unit tax, which is defined for a base. Following this, higher value zones get a proportionately higher tax base, based on a defined scale attached to the scores. The taxable value is then calculated automatically by multiplying the land size (m2) and the respective tax coefficients. Experiences show, that there were negligible appeal cases in applying the value-zone systems.
A value-zone system could be applicable for Kampala as well, because an expert committee would be easily able to identify the various value areas and attach value scores. The important thing is to make sure that the scores fairly reflect the relative values and are transparently set. For example, they can fairly easily be verified by simple comparisons between properties. This system does not attach or state the market value or rental value of the properties; instead just establish a system of relative values. Then the taxable values are calculated based on the property/land side and tax policy decisions that establish the base tax for the lowest class of properties. In Pakistan, for example, the highest rank properties (A) are defined and reductions are applied down from A to G (Ellis, Kopanyi, Lee 2007). This method may be politically more acceptable, because people feel they got rebate due to lack of amenities in a poorer zone.
We have not attempted calculating the taxable value under a value-zone area based tax system, because the explained procedures would require wide guesses on the authors’ part in advance. However, the value-zone area based procedure is in harmony with the comparative ranking procedure explained above.
Conclusion
The four value estimating methods completed are based on different assumptions and policy choices and follow different procedures, therefore show different estimates, which however, seem to be in harmony and can be summarised as follows:
i. The average rateable value of properties in CC and K1 Parishes the estimated tax potential is only UGX 245million (USD 65,000), but this is an extremely low density model;
ii. The aggregate average unit tax (rateable value) of the commercial properties would result in UGX 723million (USD 191,000) additional tax;
iii. The best use and median reference value would generate UGX 1,759million (USD 464,000) additional taxes;
iv. Regression modelling and moderate 0.5 FAR value the estimated tax potential is about UGX900 million (USD 250,000) just in CC and K1 Parishes, that would jump to UGX 1.8 billion (USD 478,000) with 1.0 FAR.
20
Given these are two parishes of 74 in the whole of Kampala, and not even the ones with the largest amount of vacant land, these magnitudes, regardless of the model used, suggest that it is worthwhile for KCCA to seriously consider introducing a taxation system for vacant urban land. Furthermore, this should be considered in parallel with levying both an elevated annual property tax and a potential local capital gains tax at the time of divestitures.
Tax considerations should be taken in conjunction with the implementation zoning regulations. Kampala is still a sprawling city with low density and low FAR ratios (about 0.12 on average in the central areas). These indicate that the current building regulations, which do not take into account zoning or requirements with respect to FAR, are not sustainable and do not support the needed densification. Thus zoning regulations would be instrumental for both urban planning and thus the overall development of the city. It would also be critical ensuring that any future tax on urban vacant land is actually enforceable.
The tax potential of a vacant land tax will depend on key tax policy decisions; this will include what definition is selected for ‘vacant land’ thus how it is determined and tax. The paper presents and compares just a few. However, as noted, estimates from this paper suggest a potential of UGX 0.3 to 1.8 billion additional annual property tax revenue just from the CC and Kololo I parishes, which are among the richest areas of Kampala. Realizing any of this potential revenue, however, require amending the Ratings Act, which will, given the political nature, require evidence based policy dialogue; this note aims to encourage and support KCCA moving this forward.
Potential for Further Research
• Regression modelling could be significantly strengthened with land sales transaction data. Therefore, it will be critical in the future to either collect it or work with those institutions who have it. This can then be used to develop a formula for projecting market value of vacant urban land. ensuring that land transaction.
• Other data that is already available, such as land-lease transactions on KCCA land or building permits, could also be used to strengthen the modelling in different ways.
• Expanding these models to other parishes in the Central Division and other divisions in the city, when the data comes available, means that in the future the full tax potential of vacant urban land for the entire KCCA could be estimated.
21
• If the city wants to understand what urban planning implications such a vacant land tax may have, further research is needed to understand both what type of land remains vacant and why.
References
Al-Omran, A. (2015) “Saudi Arabia to Impose Taxes on Undeveloped Urban Land” The Wall Street Journal, March 23. Available at https://www.wsj.com/articles/saudi-arabia-to-impose-taxes-on-undeveloped-urban-land-1427131099
Bird, Richard and Slack, Enid (2006) “Taxing Land and Property in Emerging Economies: Raising Revenue… and More?” in Ingram, Gregory K. and Hong, Yu-Hong Land Policies and Their Outcomes. Cambridge: Lincoln Institute of Land Policy
Crawford, J.H. (2009) Carefree Design Manual International Books, Utrecht, The Nederland
Ellis, P., Kopanyi, M. and Lee, G. (2007): “Property Taxation in the Large Cities of Punjab Province, Pakistan.” Journal of Property Tax Assessment and Administration Vol 4 (No 2).
Fish, P. (2017) “Property Valuation for Taxation–Kampala Capital City Authority”. International Centre for Tax and Development (ITDC).
Freire, M. & Kopanyi, M (2018) “Asset and Debt Management for Cities”. Policy Note, International Growth Centre, London School of Economics.
George, H. (1879). Progress and Poverty: An Inquiry in the Cause of Industrial Depressions and of Increase of Want with Increases of Wealth… The Remedy.” Ed 1997. New York: Robert Schalkenbach Foundation.
Government of Uganda (2012) Kampala Physical Development Plan 2012”, KCCA
Government of Uganda (2005). “The Local Government (rating) Act” (Ratings Act 2005) Available at: https://www.kcca.go.ug/.../acts/local%20gorvenment%20rating%20Act%202005.pdf
Haas, A. R. N. & Kopanyi, M. (2017) Taxation of Vacant Urban Land: From Theory to Practice. London: International Growth Centre.
Kelly, R. (2018) “Property Tax: Characteristics, Trends, Challenges, and Approaches” Fundamentals of City Financing, TTL Training World Bank, Washington DC
Kopanyi, M. (2015) Local Revenue Reform of Kampala Capital City Authority. London: International Growth Centre.
Lall, Somik Vinay, Henderson, J. Vernon and Venables, Anthony J. (2017) Africa’s Cities: Opening Doors to the World. Washington D.C.: World Bank
Nam, J. (2010) ”Idle urban land could be taxed” New Vision, August 5. Available at: https://www.newvision.co.ug/new_vision/news/1285205/idle-urban-land-taxed
Nozzi, D. (2010) “What is a Floor Area Ratio (FAR) and Why is FAR Important to Urban Design?” Available at https://domz60.wordpress.com/.../what-is-a-floor-area-ratio-far-and-why-is-far-important?

22
Torres-Reyna, O. 2007. ”Linear Regression using Stata, v6.3”, Princeton University, Data and Statistical Services. Available at: https://dss.princeton.edu/training/Regression101.pdf
Venables, T. (2015) Productive and Liveable Cities: Economic Principals for Urban Development. Presentation to the Kampala Capital City Authority in November 2015
URA 2015. “Capital Gain Tax” Uganda Revenue Authority
23
ANNEXES
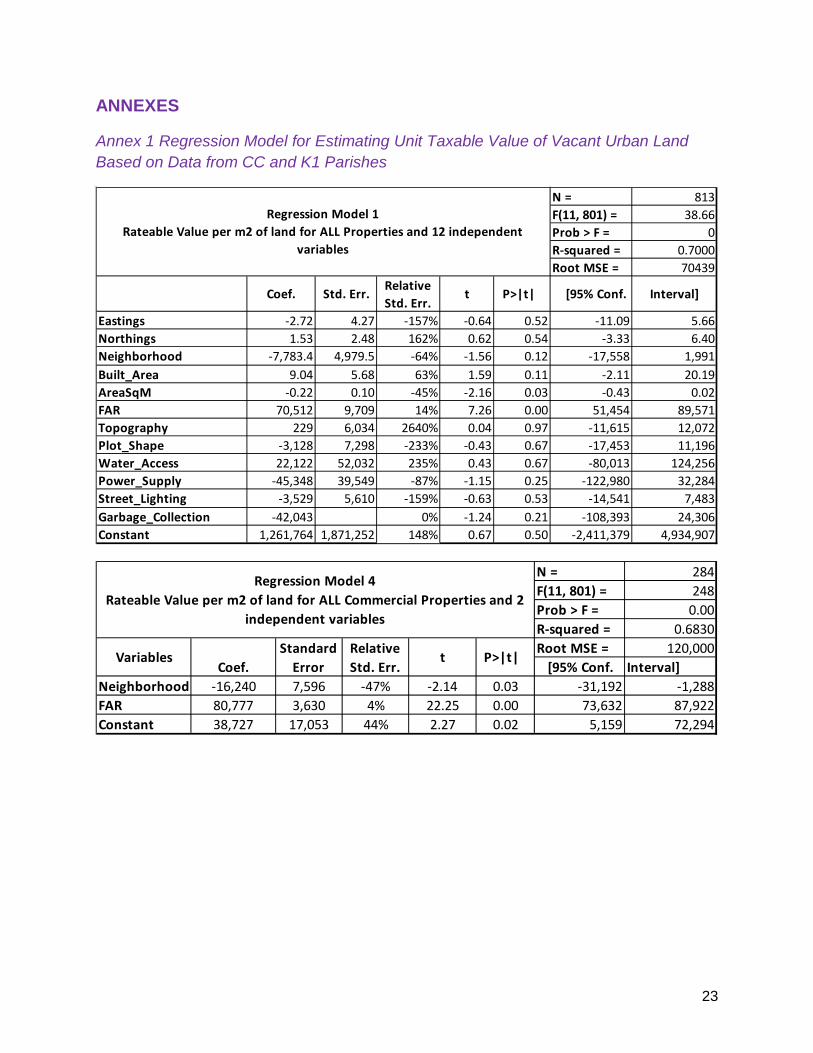
Annex 1 Regression Model for Estimating Unit Taxable Value of Vacant Urban Land Based on Data from CC and K1 Parishes
N = 813F(11, 801) = 38.66Prob > F = 0R-squared = 0.7000Root MSE = 70439
Coef. Std. Err. Relative Std. Err.
t P>|t| [95% Conf. Interval]
Eastings -2.72 4.27 -157% -0.64 0.52 -11.09 5.66Northings 1.53 2.48 162% 0.62 0.54 -3.33 6.40Neighborhood -7,783.4 4,979.5 -64% -1.56 0.12 -17,558 1,991Built_Area 9.04 5.68 63% 1.59 0.11 -2.11 20.19AreaSqM -0.22 0.10 -45% -2.16 0.03 -0.43 0.02FAR 70,512 9,709 14% 7.26 0.00 51,454 89,571Topography 229 6,034 2640% 0.04 0.97 -11,615 12,072Plot_Shape -3,128 7,298 -233% -0.43 0.67 -17,453 11,196Water_Access 22,122 52,032 235% 0.43 0.67 -80,013 124,256Power_Supply -45,348 39,549 -87% -1.15 0.25 -122,980 32,284Street_Lighting -3,529 5,610 -159% -0.63 0.53 -14,541 7,483Garbage_Collection -42,043 0% -1.24 0.21 -108,393 24,306Constant 1,261,764 1,871,252 148% 0.67 0.50 -2,411,379 4,934,907
Regression Model 1 Rateable Value per m2 of land for ALL Properties and 12 independent
variables
N = 284F(11, 801) = 248Prob > F = 0.00R-squared = 0.6830Root MSE = 120,000 [95% Conf. Interval]
Neighborhood -16,240 7,596 -47% -2.14 0.03 -31,192 -1,288FAR 80,777 3,630 4% 22.25 0.00 73,632 87,922Constant 38,727 17,053 44% 2.27 0.02 5,159 72,294
Regression Model 4 Rateable Value per m2 of land for ALL Commercial Properties and 2
independent variables
Coef.Standard
ErrorVariables Relative
Std. Err.t P>|t|
24
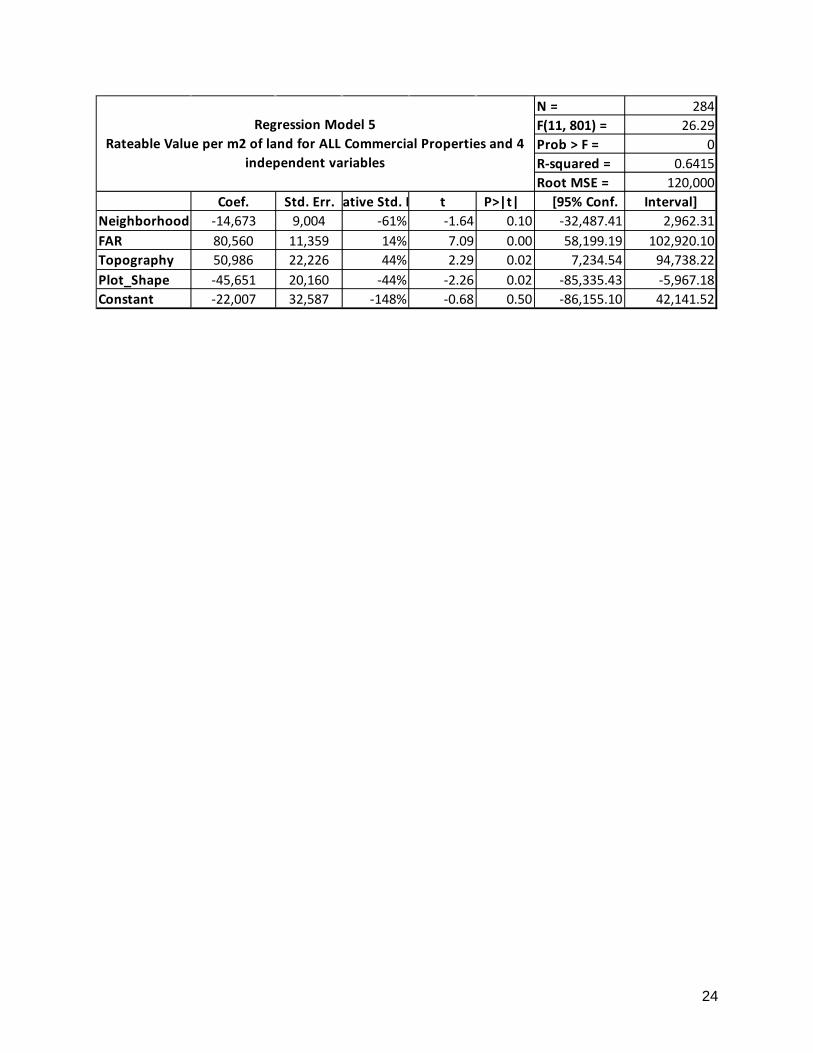
N = 284F(11, 801) = 26.29Prob > F = 0R-squared = 0.6415Root MSE = 120,000
Coef. Std. Err. ative Std. E t P>|t| [95% Conf. Interval]Neighborhood -14,673 9,004 -61% -1.64 0.10 -32,487.41 2,962.31FAR 80,560 11,359 14% 7.09 0.00 58,199.19 102,920.10Topography 50,986 22,226 44% 2.29 0.02 7,234.54 94,738.22Plot_Shape -45,651 20,160 -44% -2.26 0.02 -85,335.43 -5,967.18Constant -22,007 32,587 -148% -0.68 0.50 -86,155.10 42,141.52
Regression Model 5 Rateable Value per m2 of land for ALL Commercial Properties and 4
independent variables

25
Annex 2: Undeveloped Land in KCCA’s Jurisdiction per the Kampala Physical Development Plan (2012)
Undeveloped Land by Parish (Source KPDP 2012)
PARISH AREA (HA) KYANJA 158.35 LUBIA 146.96
KOMAMBOGA 125.56 SALAAMA 88.66 BUTABIKA 83.39 BUKOTO II 69.70 BUSEGA 57.63
MUTUNDWE_KAMPALA 48.72 KIKAYA 45.09 GGABA 38.39
KAWEMPE II 37.23 BUZIGA 37.11 LUZIRA 34.65
BANDA_KAMPALA 30.36 LUNGUJJA 30.23
NAKULABYE 29.90 KIREKA 29.07
UPPER ESTATE 28.83 KANSANGA - MUYENGA 28.81
RUBAGA 22.69 KIWATULE 21.08
BUKASA_KAMPALA 21.01 KABOWA 19.41 LUKULI 18.20
KIRA 16.46 MPERERWE 16.24
CIVIC CENTRE 13.14 NAGURU I 13.00 KISUGU 12.92 KASUBI 11.07
NAGURU II 10.87 KYEBANDO_KAMPALA 9.98 NSAMBYA CENTRAL 9.48 INDUSTRIAL AREA 9.33
KATWE II 9.02

26
BUKOTO I 8.78 MBUYA II 8.61
KANYANYA 8.38 BOGOLOBI 8.18 KYAMBOGO 7.00 MAKINDYE I 6.71 KAZO WARD 6.48
NSAMBYA RAILWAY 5.74 KAWEMPE I 5.70 MULAGO III 5.53
NDEEBA 5.27 MBUYA I 5.22 KOLOLO I 5.03
KIBULI 4.76 LUWAFU 4.61
MAGANJO 4.35 NATEETE 3.70 KATWE I 3.61 KIBUYE I 3.48
MAKERERE II 3.48 KAMWOKYA I 3.42 NABISUNSA 3.38
KITEEZI 2.90 WAMPEEWO 2.87 KABALAGALA 2.71
NTINDA 2.70 MUTUNGO_KAMPALA 2.45
MASOOLI 2.23 I.T.E.K 2.06
NSAMBYA HOUSING ESTATE 1.77 NAMIREMBE 1.75
NSAMBYA POLICE BARRACKS 1.73 MAKINDYE II 1.59
BWAISE I 1.32 WABIGALO 1.23
LUZIRA PRISONS 1.10 NAJJANANKUMBI I 0.52
MUTUNDWE_WAKISO 0.32 MASAJJA 0.17
TOTAL 1533.39
27
ANNEX 3: KCCA Valuation System and Procedure 2016/17
KCCA’s Cadastres
Urban Cadastre:
The KCCA’s urban cadastre is a multifunctional and integrated cadastre that includes a number of pieces of data about the city, such as property and building information, infrastructures and super-structures as well as urban and zoning information. It would also include information on the land from the land cadastre, when it becomes available. However, it is not dependent on this information. Overall, it is built on and sub-ordinated to a national land cadastre. The national land cadastre’s sole role is to determine the legal ownership of plots of land, whereas the urban cadastre is not particularly concerned with the legal ownership but rather various characteristics of properties. As the urban cadastre is subordinate to the national land cadastre, any changes in the national land cadastre would result in changes in the urban cadastre but not the other way around. To visualise the urban cadastre, the KCCA’s Physical Planning Directorate digitalized the information that was collected in the process of the valuation exercise. This was converted into interactive GIS maps that capture the properties with contours of structures, the underlying land plots with the identifiable borders, GPS coordinates, street names and numbers, house-numbers, the surrounding infrastructure and superstructures.
Fiscal Cadastre:
The fiscal cadastre is a central database, that is linked to and utilises the urban cadastre as well as including the location, i.e. division, parish, village, property codes, as well as all the field data collected in questionnaires and verified by a quality assurance process. This includes maps, size as well as floor numbers of the buildings. These maps of the buildings and other structures with measured sizes are refined in office based on the field sketches and measurements and then scanned and saved in the central database as well. The fiscal cadastre also includes the estimated gross and net rental value, the estimated property tax due, tax arrears, exemptions or other rebates or limitations, or enforcement information if any.
KCCA Property Tax Re-Valuation 2016
The Ugandan Ratings Act stipulates that revaluation of properties should take place every five years. The last gazetted property roll, however, was issued in 2005 with a supplementary roll issued in 2009. Therefore, an updated valuation of properties in KCCA’s jurisdiction was a long overdue task for the Directorate of Revenue Collection. In particular, given the rapid growth of the city during this time and thus the number of properties that do not even appear of the tax net. A very prominent example is the high-

28
end shopping malls Acacia Mall, in Central Division and Village Mall, in Nakawa Division, that were only built and opened in the last years. Therefore, the KCCA has presumably forfeited the collection of billions of Uganda shillings of property tax revenue through not having an updated role. This is further exacerbated by the fact that as a result of the rapid growth of the city, one can also assume that the annual rental values, the basis on which the property tax is set, have grown substantially since 2005.
Therefore, the Directorate of Revenue Collection announced the current valuation process on December 17, 2015 and this commenced in March 2016. To undertake this, KCCA considered various valuation methodologies, that would still work within the provisions of the Ratings Act. Their aim was that this exercise should aim to substantially improve the accuracy of the tax net by both capturing all taxable properties, including those that are currently exempted, updating technical, ownership, and location characteristics as well as revising the annual rental values based on fresh collection evidence on rental income.
The starting point for the new valuation and very good move overall was the decision to develop an urban cadastre, based on recommendations from Kopanyi (2015). An urban cadastre is essentially a database within which municipal governments can capture more specific data than a land cadastre does, yet it is not conflicting to have both in place. Furthermore, in the case of Uganda, it is even more important due to the fact that the national land cadastre is still under development and therefore the city does not yet have access to this information. To create the urban cadastre, and to complement and ensure the accuracy of the property revaluation, the KCCA also undertook street addressing and numbering programme. This is being done with the support of GIS maps and field verification and loosely follows the methodology set out by Farvacque-Vitkovic et. al (2005). At the time of writing, this process has already been completed in nearly two of the five divisions, namely the Central and Nakawa Divisions and Rubaga Division is set to be completed soon. However, to date, only the Central Division’s valuation roll was completed and gazetted in June 2017. This means that for this Division, the new rates came into effect with the 2017/18 fiscal year.
Before commencing the actual valuation, the team at KCCA considered two options on how to proceed:
a) Individual valuation through a large scale computer assisted mass valuation procedure, which is referred to as CAMV in KCCA;
b) A fully-fledged computer aided mass appraisal(CAMA)7.
7 Computer Aided Mass Appraisal refers to a property valuation technique that uses a variety of information on properties and then software that can calculate the rateable value and therefore tax for properties. By automating the
29
A major difference between CAMV and an internationally recognized computer aided mass appraisal (CAMA) is that in the CAMV the expert opinion of the Chief Valuers is used to define the value zones, instead of sampling and various econometric or statistical instruments. Furthermore, in CAMV the Chief Valuers are also responsible for determining the key factors that are likely to affect the value of a property and thus for estimating coefficients that determine the reference unit values in various property clusters and categories. Therefore, the CAMV is designed and based on individual property valuation principals and then converting them to mass valuation procedures. Initially the KCCA wanted to undertake the CAMA and therefore started undergoing the necessary steps towards procuring a firm who could help with them. However, due to a number of reasons, the procurement got delayed and therefore the KCCA decided to proceed with the CAMV valuation in Central Division.
One major benefit next to the fact that they were able to move forward fairly swiftly with this, is that by adopting the CAMV methodology, they were able to rely solely on their in-house capacity through their valuation and IT teams to carry out the valuation. In the future, the KCCA would still like to move toward implementing a fully-fledged CAMA system. With all the data that is being collected as part of the urban cadastre it should be fairly straight-forward for the KCCA to update its valuation rolls using a full-fledged CAMA mass valuation in the future. Furthermore, they may be able to start with just using one Division as a test, such as the Central Division, where property values are the highest. Having hybrid methodologies of valuation in one city is not uncommon and in fact the KCCA concluded they would do this after having visited Cape Town, which has a similar process in place. Therefore, in five years, when the Central Division is up for re-valuation, this could then also be done using the CAMA.
Computer Aided Mass Valuation (CAMV) – The KCCA Data Collection Methodology
KCCA’s property valuation was undertaken in various steps as outlined below:
1. Identification of Properties: The results of the street addressing (called CAM module) has provided the solid base for the data collection by attaching unique and consistent codes in the form of house numbers to each and every property in each of the divisions, starting with the Central Division. Thousands of properties were identified that had not been recorded in the previous valuation role. Some of these were omitted because they were only built following the gazetting of the previous valuation roll. However, during the previous valuation, groups of properties, such as those on compounds, were only recorded as one individual property. In this new valuation role, each property is recorded individually even if they are on the same larger plot. The total number of registered properties in the
system, it can more accurately and easily calculate property values and valuation roles can therefore be updated on a regular basis. However, it requires an initial investment into the system and capacity to run it.

30
role for the Central Division therefore increased from 7,286 properties (in the 2005 and 2009 supplementary role combined), which constituted a rateable value of about UGX 183 billion and property rate revenues of about UGX 11 billion to 15,021 properties, at a rateable value of about UGX 345 billion and property rates revenue of about 20.7 billion now. There are still approximately 600 properties that are located in the Central Division and are not captured in the register. These are largely properties where the enumeration was denied access to the properties, especially those owned by foreign missions. The KCCA will work with the Ministry of Foreign Affairs to ensure that these too are included as part of the valuation roll in the future.
2. GIS Maps: GIS maps were also developed and digitalized. These capture the properties with the known, practical, or identifiable borders8 of the underlying land plots, GPS coordinates, the maps of the buildings and all collected property information from the data collection exercise. All uploaded information can be visualized by clicking on the digitized maps. These land borders were used in the modelling in this paper, as access to the Land Information System, held by the Ministry of Lands, Housing and Urban Development, where the actual land plots and titles are stored was not possible. The KCCA GIS is currently piloting the use of drones to be able to design these maps to an even more accurate level. In the future, they expect these to be a key feature of the revaluation process for properties, such as being able to measure property size and shape exactly from the map itself.
3. Data Collection: The data collection questionnaire includes 155 questions across ten sections. These questions are based on the Ratings Act. The questionnaire has numerous mandatory fields such that the system will not allow uploading the questionnaire to the central database unless all the mandatory information are completed. Many of the mandatory questions are related to the owner of the property, such as their name and telephone number. The ten sections are as follows:
i. Property owner details;
ii. Property particulars;
iii. Property type;
iv. Building details;
v. Construction details; 8 These are not considered the legal borders as with the land cadastre. Rather they are only the borders that are identifiable.

31
vi. Accommodation;
vii. Site works;
viii. Condition of the building;
ix. Measurement of construction or area in m2;
x. Site works.
The electronically collected data is being uploaded to the central database on daily basis. Data collection commenced with rating zone one, i.e. the Central Division. All properties were evaluated as part of this exercise.
4. Verification Teams: KCCA assigned five senior government registered valuers to lead the valuation process who oversaw ten verification and data collection teams comprised of junior valuers and support staff. The verification teams visited each property in their assigned zones and collected data for the urban cadastre and valuation process. They did this by filling out 155 questions via electronic tablets. They further manually measured and sketched the property outline, which were scanned and added to the information for the property. These sketches were also used to calculate total floor space in m2. They also recorded GPS coordinates and took pictures on the buildings, which are details that were electronically uploaded to the database together with the data from the questionnaire. If the team failed to access to the property, they had to return again at a later time to obtain the data and only completed questionnaires could be uploaded to the system.
Following the completion of the data collection, valuation was undertaken. Procedures from previous valuations were followed initially. This included the following:
• Value Zones: Within the jurisdiction of the KCCA, parishes are implicitly considered as value zones, although this is not clearly communicated as such. Therefore, the dataset first is structured into parishes, or in some instances villages within the parishes. For instance, slums are basically recognized as particular villages and therefore zones within a parish and thus are considered as unique valuation zones.
• Property Type Categories: The datasets in each parish can be virtually restructured by main property type categories, namely: residential, commercial, office, industrial, slums, and mixed-use. The current dataset does not include the vacant land as a specific property type, because vacant land is exempt from taxation and the mandatory data for the questionnaire to be uploaded cannot be obtained for vacant land. This was an oversight that was recognised later in the

32
valuation process. However, data on vacant land is collected and stored in a separate database outside the urban cadastre. In the future, it is their aim to include the vacant urban land in the urban cadastre to make it consistent.
• Property Value Computation: The KCCA does not levy property taxes directly based on the reported or verified rental value of the various properties. This is because often property owners or renters do not disclose the actual rent paid. Additionally, there is the incentive to underreport, given that this is the value that property taxes are derived from. Instead, therefore, they established benchmark rates as averages of the collected effective annual rental revenues.
Following this, the valuation team at KCCA created a computer model to help set benchmark values for the main property types. This programme is based on computer aided sorting procedures that start with the Chief Valuers using their experience to define sets of specific technical characteristic indicators to sort a property cluster, namely commercial and industrial, into three categories based on different quality for all property types and residential properties into four quality categories9. For these categories, as previously discussed parishes, or in certain cases villages, are considered as distinct value zones. Following this, the Chief Valuers sort a specific property cluster in a parish zone by the set quality categories (Q1, Q2, Q3 or Q4 – where Q1 is the highest quality) and leave the properties that fall outside these quality categories for further individual review. They then sort the properties with measured gross (and net) rental values in each quality category. Finally, they establish average “unit rental value” per m2 in each quality category for each parish. This is the final value that is then used to establish the valuation.
Prior to the commencement of the exercise, in March 2016, the five designated senior government valuers for the process determined the Property Value Computations that would outline all relevant agreed upon adjustments for the computation of the rateable value that would take place. It follows agreed upon valuation principals and guidelines and is derived by property type. After the property is allocated a quality grade, the gross rental value is adjusted, for each property type, as follows:
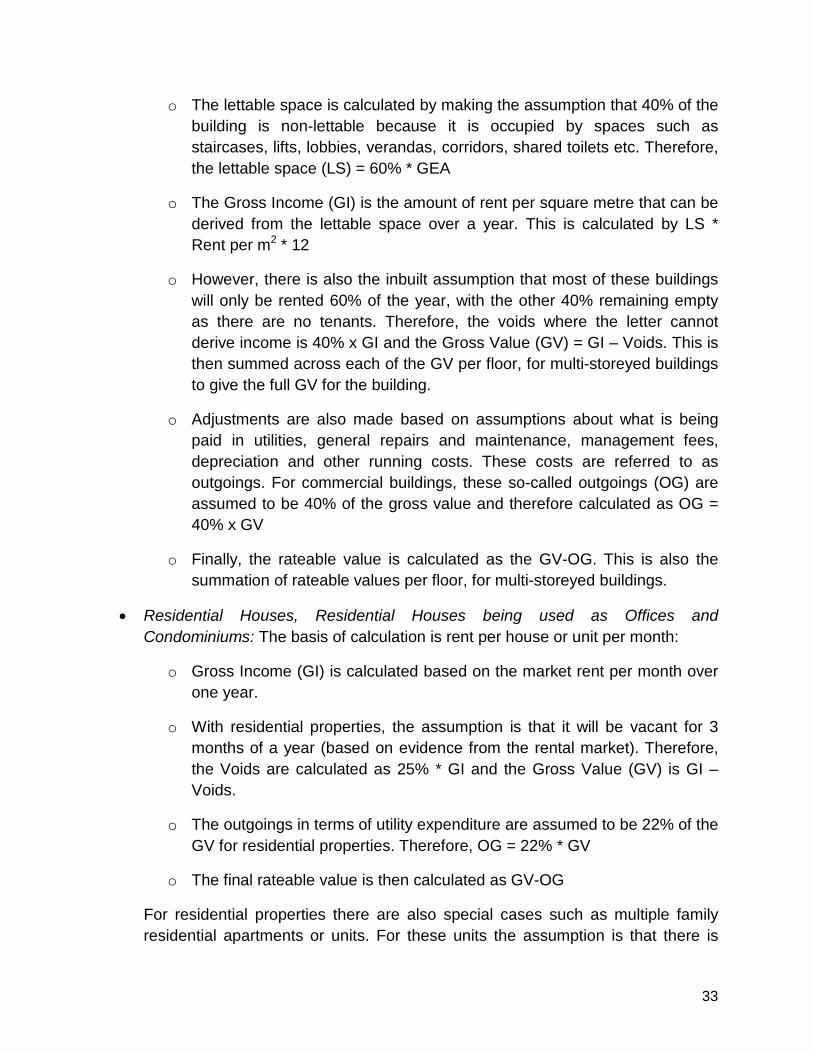
• Commercial, Industrial and Institutional (Office Buildings): The basis of calculation is rent per m2 per month. For multi-storeyed buildings, these calculations will be undertaken separately by level as the rent per m2 may vary significantly by floor.
o The Gross External Area (GEA) is derived by the built up area as captured by the CAMV;
9 Institutional buildings, including government offices were not classified further.
33
o The lettable space is calculated by making the assumption that 40% of the building is non-lettable because it is occupied by spaces such as staircases, lifts, lobbies, verandas, corridors, shared toilets etc. Therefore, the lettable space (LS) = 60% * GEA
o The Gross Income (GI) is the amount of rent per square metre that can be derived from the lettable space over a year. This is calculated by LS * Rent per m2 * 12
o However, there is also the inbuilt assumption that most of these buildings will only be rented 60% of the year, with the other 40% remaining empty as there are no tenants. Therefore, the voids where the letter cannot derive income is 40% x GI and the Gross Value (GV) = GI – Voids. This is then summed across each of the GV per floor, for multi-storeyed buildings to give the full GV for the building.
o Adjustments are also made based on assumptions about what is being paid in utilities, general repairs and maintenance, management fees, depreciation and other running costs. These costs are referred to as outgoings. For commercial buildings, these so-called outgoings (OG) are assumed to be 40% of the gross value and therefore calculated as OG = 40% x GV
o Finally, the rateable value is calculated as the GV-OG. This is also the summation of rateable values per floor, for multi-storeyed buildings.
• Residential Houses, Residential Houses being used as Offices and Condominiums: The basis of calculation is rent per house or unit per month:
o Gross Income (GI) is calculated based on the market rent per month over one year.
o With residential properties, the assumption is that it will be vacant for 3 months of a year (based on evidence from the rental market). Therefore, the Voids are calculated as 25% * GI and the Gross Value (GV) is GI – Voids.
o The outgoings in terms of utility expenditure are assumed to be 22% of the GV for residential properties. Therefore, OG = 22% * GV
o The final rateable value is then calculated as GV-OG
For residential properties there are also special cases such as multiple family residential apartments or units. For these units the assumption is that there is
34
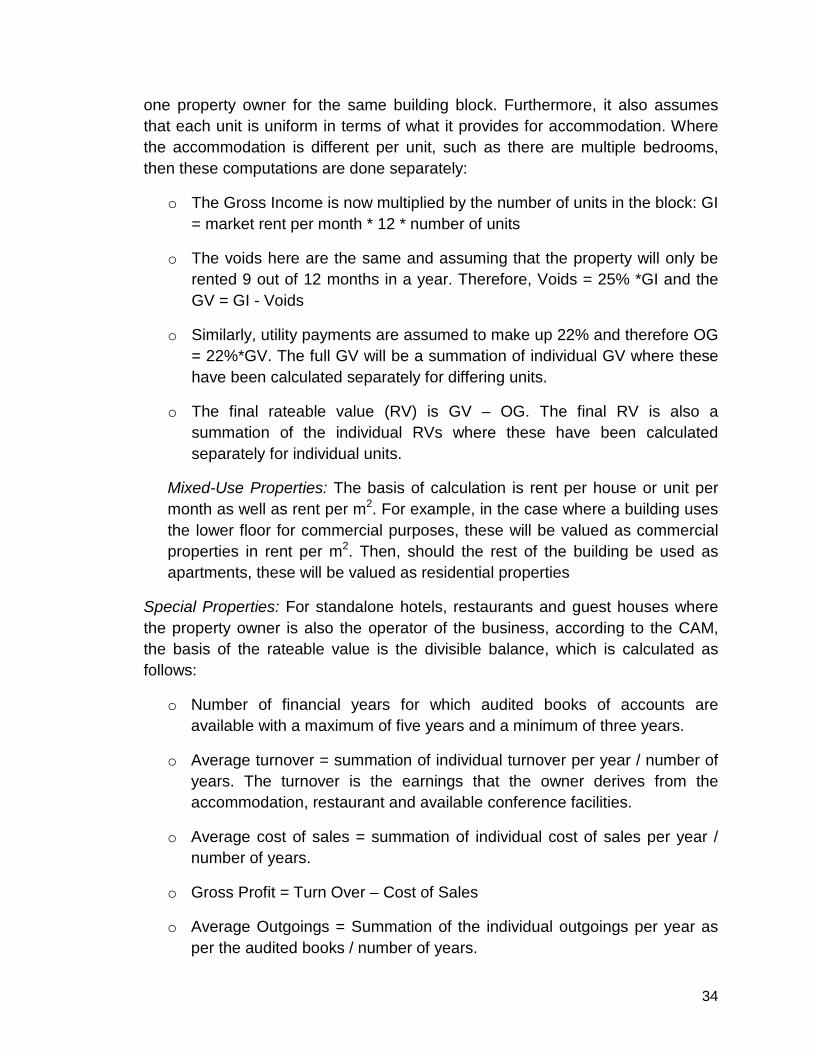
one property owner for the same building block. Furthermore, it also assumes that each unit is uniform in terms of what it provides for accommodation. Where the accommodation is different per unit, such as there are multiple bedrooms, then these computations are done separately:
o The Gross Income is now multiplied by the number of units in the block: GI = market rent per month * 12 * number of units
o The voids here are the same and assuming that the property will only be rented 9 out of 12 months in a year. Therefore, Voids = 25% *GI and the GV = GI - Voids
o Similarly, utility payments are assumed to make up 22% and therefore OG = 22%*GV. The full GV will be a summation of individual GV where these have been calculated separately for differing units.
o The final rateable value (RV) is GV – OG. The final RV is also a summation of the individual RVs where these have been calculated separately for individual units.
Mixed-Use Properties: The basis of calculation is rent per house or unit per month as well as rent per m2. For example, in the case where a building uses the lower floor for commercial purposes, these will be valued as commercial properties in rent per m2. Then, should the rest of the building be used as apartments, these will be valued as residential properties
Special Properties: For standalone hotels, restaurants and guest houses where the property owner is also the operator of the business, according to the CAM, the basis of the rateable value is the divisible balance, which is calculated as follows:
o Number of financial years for which audited books of accounts are available with a maximum of five years and a minimum of three years.
o Average turnover = summation of individual turnover per year / number of years. The turnover is the earnings that the owner derives from the accommodation, restaurant and available conference facilities.
o Average cost of sales = summation of individual cost of sales per year / number of years.
o Gross Profit = Turn Over – Cost of Sales
o Average Outgoings = Summation of the individual outgoings per year as per the audited books / number of years.
35
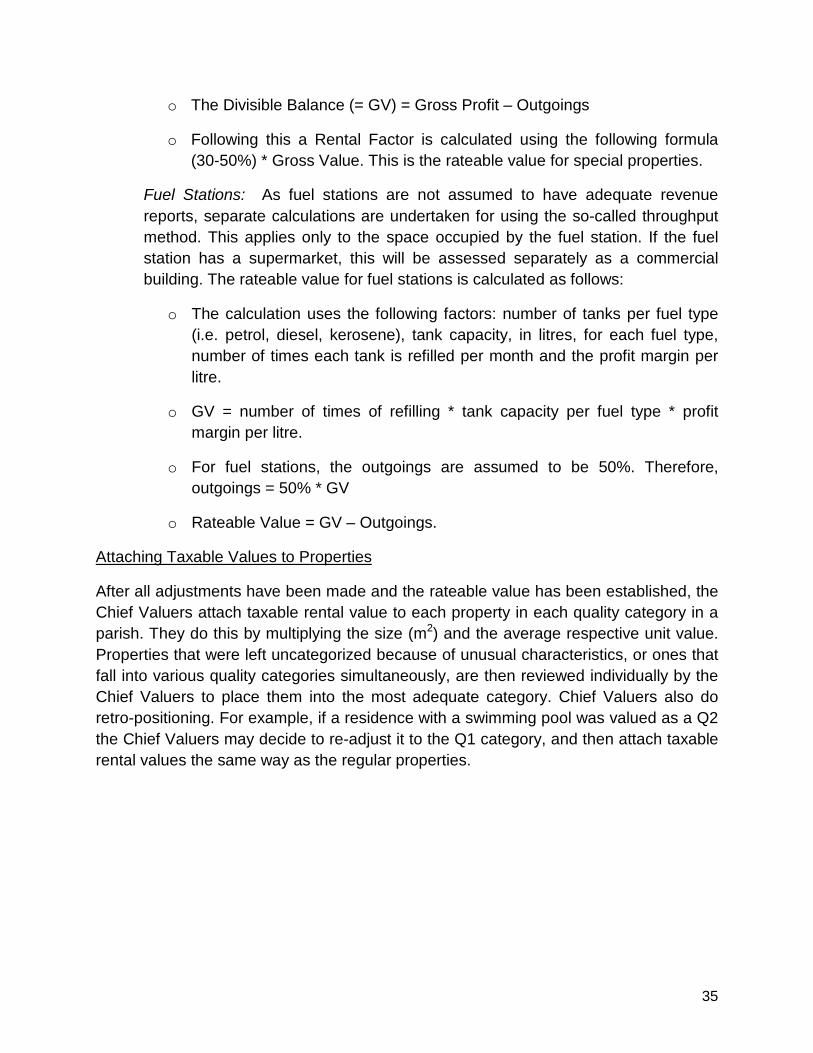
o The Divisible Balance (= GV) = Gross Profit – Outgoings
o Following this a Rental Factor is calculated using the following formula (30-50%) * Gross Value. This is the rateable value for special properties.
Fuel Stations: As fuel stations are not assumed to have adequate revenue reports, separate calculations are undertaken for using the so-called throughput method. This applies only to the space occupied by the fuel station. If the fuel station has a supermarket, this will be assessed separately as a commercial building. The rateable value for fuel stations is calculated as follows:
o The calculation uses the following factors: number of tanks per fuel type (i.e. petrol, diesel, kerosene), tank capacity, in litres, for each fuel type, number of times each tank is refilled per month and the profit margin per litre.
o GV = number of times of refilling * tank capacity per fuel type * profit margin per litre.
o For fuel stations, the outgoings are assumed to be 50%. Therefore, outgoings = 50% * GV
o Rateable Value = GV – Outgoings.
Attaching Taxable Values to Properties
After all adjustments have been made and the rateable value has been established, the Chief Valuers attach taxable rental value to each property in each quality category in a parish. They do this by multiplying the size (m2) and the average respective unit value. Properties that were left uncategorized because of unusual characteristics, or ones that fall into various quality categories simultaneously, are then reviewed individually by the Chief Valuers to place them into the most adequate category. Chief Valuers also do retro-positioning. For example, if a residence with a swimming pool was valued as a Q2 the Chief Valuers may decide to re-adjust it to the Q1 category, and then attach taxable rental values the same way as the regular properties.
Designed by soapbox.co.uk
The International Growth Centre (IGC) aims to promote sustainable growth in developing countries by providing demand-led policy advice based on frontier research.
Find out more about our work on our website www.theigc.org
For media or communications enquiries, please contact [email protected]
Subscribe to our newsletter and topic updates www.theigc.org/newsletter
Follow us on Twitter @the_igc
Contact us International Growth Centre, London School of Economic and Political Science, Houghton Street, London WC2A 2AE


