. . TBACY FISH COLL8CTIOW FACILITY STUDIES. CALIFOBMIA Uohne 7 Predator RenWal Acticlities hqraan and Intake aanne Studies . 199L 1992 United States Department of the Interior Bureau of Reclamation Mid - Pacific Region and Denver Technical Service Center June 1994
Transcript
. .
TBACY FISH COLL8CTIOW FACILITY STUDIES.
CALIFOBMIA
Uohne 7
Predator RenWal Acticlities hqraan and
Intake aanne Studies
. 199L 1992
United States Department of the Interior Bureau of Reclamation
Mid - Pacific Region and Denver Technical Service Center
June 1994
BUREAU OF RECLAMATION PROJECT STAFF
SACRAMENTO
Ron Brockman (Tracy Fish Collection Facility Program Coordinator)
Jim Arthur Herb Ng Gary Sackett
Technical Assistance (Tracy Fish Collection Facility)
Gary Jordan Scott Siegfried
DENVER
Charles R. Liston (Study Manager) Perry Johnson Steve Hiebert Lloyd Hess Catherine Karp
Technical Assistance
Rick Wydoski Tom LaCasse Judy Lyons
Technical Consultant
Johnson Wang (Fish Taxonomy)
‘Thii report presents the results of studies conducted by the Bureau of Reclamation as a member of the Interagency Ecological Program for the San Francisco Bay-Delta Estuary. The purpose of the report is to provide Program agencies with information for consideration in identifying and implementing measures to improve the conditions in the estuarine environment. Publication of any findings or recommendations in thii report should not be construed as representing the concurrence of Program agencies. Also, mention of trade names or commercial products does not constitute agency endorsement or recommendation.
Summary of the Fish Pr‘edator Removal Program and Intake Channel Studies, 1991-1992
Investigations by Charles Liston, Catherine Karp, Lloyd Hess, Steve Hiebert
TRACY FISH COLLECTION FACILITY STUDIES CALIFORNIA, VOLUME I
U.S. DEPARTMENT OF THE INTERIOR BUREAU OF RECLAMATION
PREDATORREMOVALPROGRAM ........................................ Predator Removal in the Secondary Channel ................................ Food Habits of Striped Bass and White Catfish .............................. Assessment of Angling Methods for Removing
Fish Predators ................................................... Mark-Recapture Program ............................................. Summary ........................................................
INTAKE CHANNEL PROGRAM ............................................ Summary ........................................................
Tracy Fish Collection Facility Studies, California Volume I: Summary of the Fish Predator
Removal Program and Intake Channel Studies, 199 I- 1992
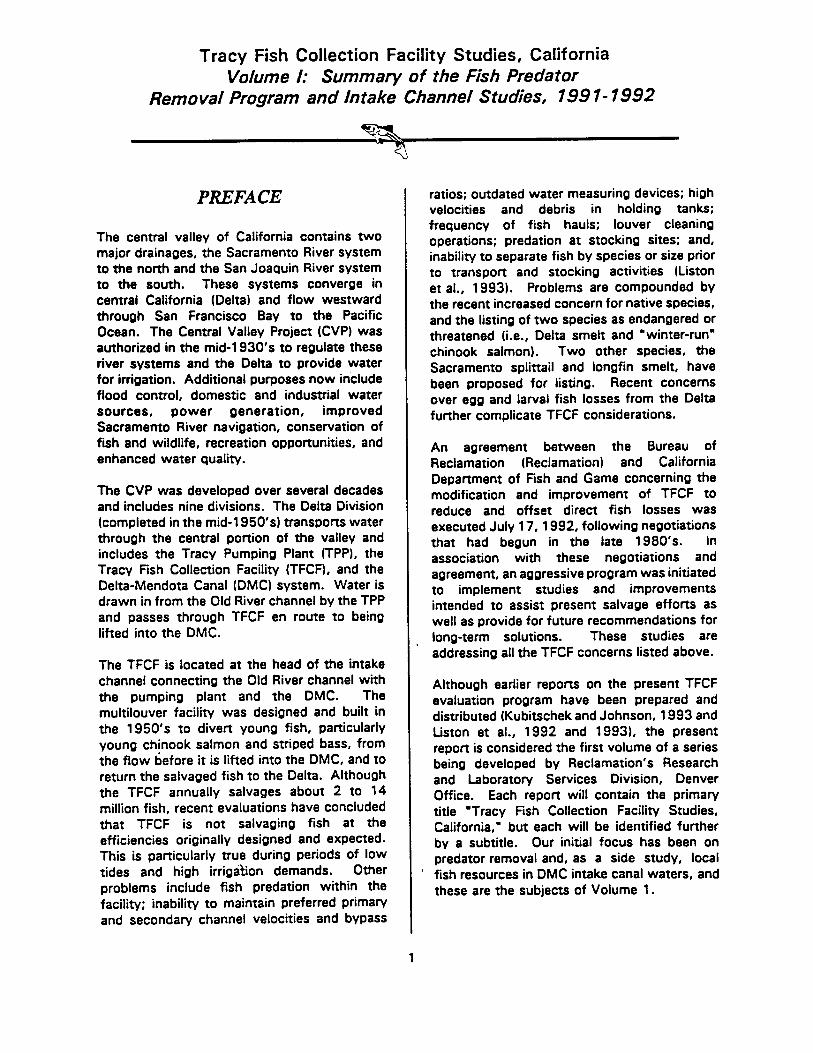
PREFACE
The central valley of California contains two major drainages, the Sacramento River system to the north and the San Joaquin River system to the south. These systems converge in central California (Delta) and flow westward through San Francisco Bay to the Pacific Ocean. The Central Valley Project (CVP) was authorized in the mid-l 930’s to regulate these river systems and the Delta to provide water for irrigation. Additional purposes now include flood control, domestic and industrial water sources, power generation, improved Sacramento River navigation, conservation of fish and wildlife, recreation opportunities, and enhanced water quality.
The CVP was developed over several decades and includes nine divisions. The Delta Division (completed in the mid-l 950’s) transpons water through the central portion of the valley and includes the Tracy Pumping Plant (TPP), the Tracy Fish Collection Facility (TFCF), and the Delta-Mendota Canal (DMCI system. Water is drawn in from the Old River channel by the TPP and passes through TFCF en route to being lifted into the DMC.
The TFCF is located at the head of the intake channel connecting the Old River channel with the pumping plant and the DMC. The multilouver facility was designed and built in the 1950’s to divert young fish, particularly young chinook salmon and striped bass, from the flow before it is lifted into the DMC, and to return the salvaged fish to the Delta. Although the TFCF annually salvages about 2 to 14 million fish, recent evaluations have concluded that TFCF is not salvaging fish at the efficiencies originally designed and expected. This is particularly true during periods of low tides and high irrigation demands. Other problems include fish predation within the facility; inability to maintain preferred primary and secondary channel velocities and bypass
1
ratios; outdated water measuring devices; high velocities and debris in holding tanks; frequency of fish hauls; louver cleaning operations; predation at stocking sites; and, inability to separate fish by species or size prior to transport and stocking activities (Liston et al., 1993). Problems are compounded by the recent increased concern for native species, and the listing of two species as endangered or threatened (i.e., Delta smelt and “winter-run. chinook salmon). Two other species, the Sacramento splittail and longfin smelt, have been proposed for listing. Recent concerns over egg and larval fish losses from the Delta further complicate TFCF considerations.
An agreement between the Bureau of Reclamation (Reclamation) and California Department of Fish and Game concerning the modification and improvement of TFCF to reduce and offset direct fish losses was executed July 17,1992, following negotiations that had begun in the late 1980’s. In association with these negotiations and agreement, an aggressive program was initiated to implement studies and improvements intended to assist present salvage efforts as well as provide for future recommendations for long-term solutions. These studies are addressing all the TFCF concerns listed above.
Although earlier reports on the present TFCF evaluation program have been prepared and distributed (Kubitschek and Johnson, 1993 and Liston et al., 1992 and 19931, the present repon is considered the first volume of a series being developed by Reclamation’s Research and Laboratory Services Division, Denver Office. Each report will contain the primary title ‘Tracy Fish Collection Facility Studies, California,’ but each will be identified further by a subtitle. Our initial focus has been on predator removal and, as a side study, local fish resources in DMC intake canal waters, and these are the subjects of Volume 1.
Tracy Fish Collection Facility Studies
INTRODUCTION
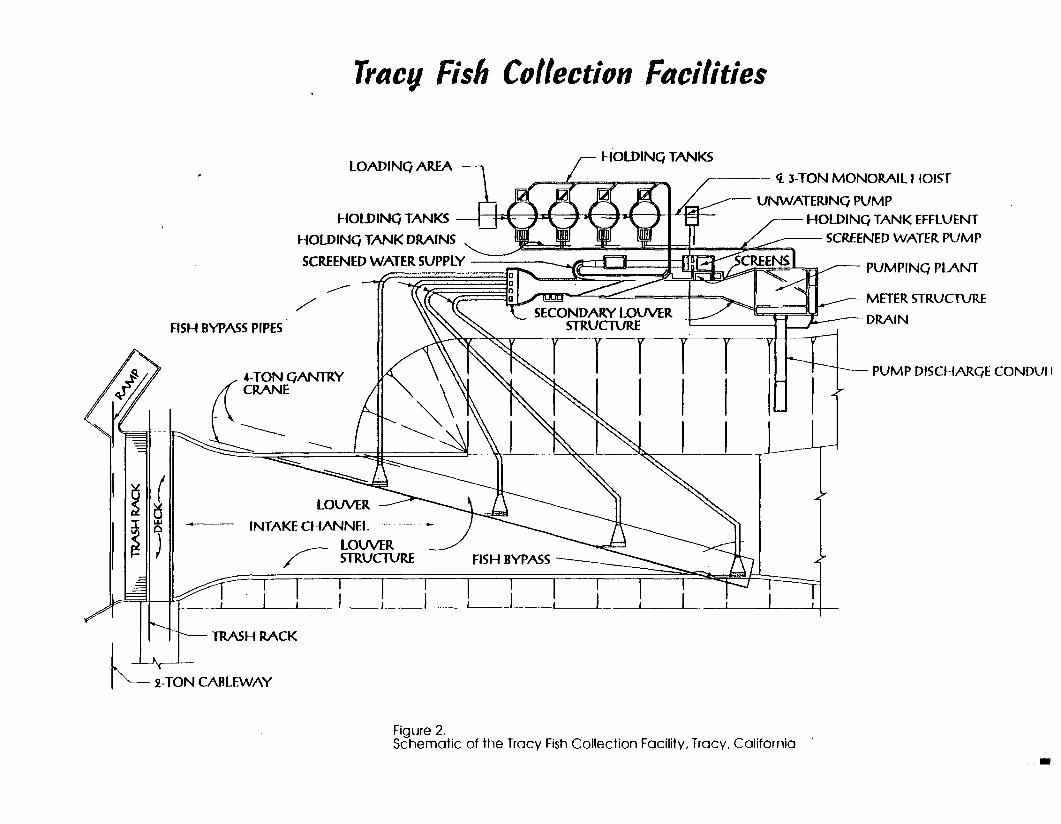
The TFCF is a fish salvage installation located in the South Sacramento-San Joaquin Delta about 9 miles northwest of Tracy, Alameda County, California (figure 1). The facility, completed in 1957, is operated by Reclamation’s CVP and was constructed to reduce fish losses associated with water export operations at the TPP. The TFCF and the TPP are situated on a canal (“the intake channel’) that connects the Old River with the DMC. The TFCF sits at the entrance of the intake channel and the TPP is about 2.5.miles downstream at the beginning of the DMC. The TPP draws water into the intake channel (from the Old River) where it passes through the fish facility on its way to being lifted into the DMC. The fish facility functions to screen, collect, and return entrained fish to points in the Delta that are outside the influence of the pumps (figure 21.
The fish facility uses a multiple louver system with bypass channels and holding tanks to deflect and salvage fish from exponed water. The louvers act as a type of behavioral barrier in that fish sense the obstruction and in trying to avoid the louvers, are diverted into bypass channels and eventually into the holding tanks (figure 2). The fish (and debris) are regularly removed from these tanks and transported to release sites in the southwestern Delta.
The louvers were designed to screen small juvenile striped bass and downstream migrating smolt chinook salmon, and are generally considered effective for these fish. However, smaller sized fish (including eggs) are not louvered as efficiently and these smaller life history stages may be more vulnerable to predation and entrainment into the intake channel. In addition, some larger fish are able to reside within the facility and are not swept into the holding ‘tanks with flow. The buildup and residence of large piscivorous fish, particularly striped bass and white catfish, throughout the fish facility have long been recognized as problems because of the
potential impact on salvage efficiency. Areas where the larger predatory fish are known to congregate include the channel upstream of the trashracks, the primary channel, the bypass channels, secondary channel, holding tanks, and the intake channel.
Reclamation, in cooperation with California Department of Fish and Game and the U.S. Fish and Wildlife Service, first noted that larger fish were residing within the facility in the mid- 1980’s. Because of continual invasion and establishment of residency by piscivorous fish, Reclamation initiated a cooperative program to identify key fish predator concentration areas, to regularly remove predatory fish from such areas, and to evaluate the fishery resources of the intake channel. This report presents the results of the predator removal and intake channel investigations at the TFCF from 199192. A preliminary reporting of the 1991 data was summarized in June 1992 (Liston et al., 1992).
BACKGROUND
The TPP (includes six large pumps for a total capacity of about 4,600 w/s) draws water from the Old River where it passes through the fish facility into the intake channel leading to the DMC. From there, water is conveyed throughout the central valley and to the San Luis Reservoir. Two smaller pump systems at the TFCF work together to maintain a prescribed velocity in the bypass channels (e.g., flow velocity in the bypass channels should exceed the velocity in the primary forebay by 1.2 to 1.4 times) and to drain the holding tanks. Water from the holding tanks is diverted into the intake channel.
The bypasses, forebays, and holding tanks are interconnected and flows (quantity and velocity) and water level fluctuate throughout with pumping rates, tidal action, and debris loading. Water (including fish and river debris) is drawn in from the Old River where it passes beneath a surface trash boom and through a trashrack (2.1 -inch openings) to the primary
Tracy Fish Collection Facility Studies
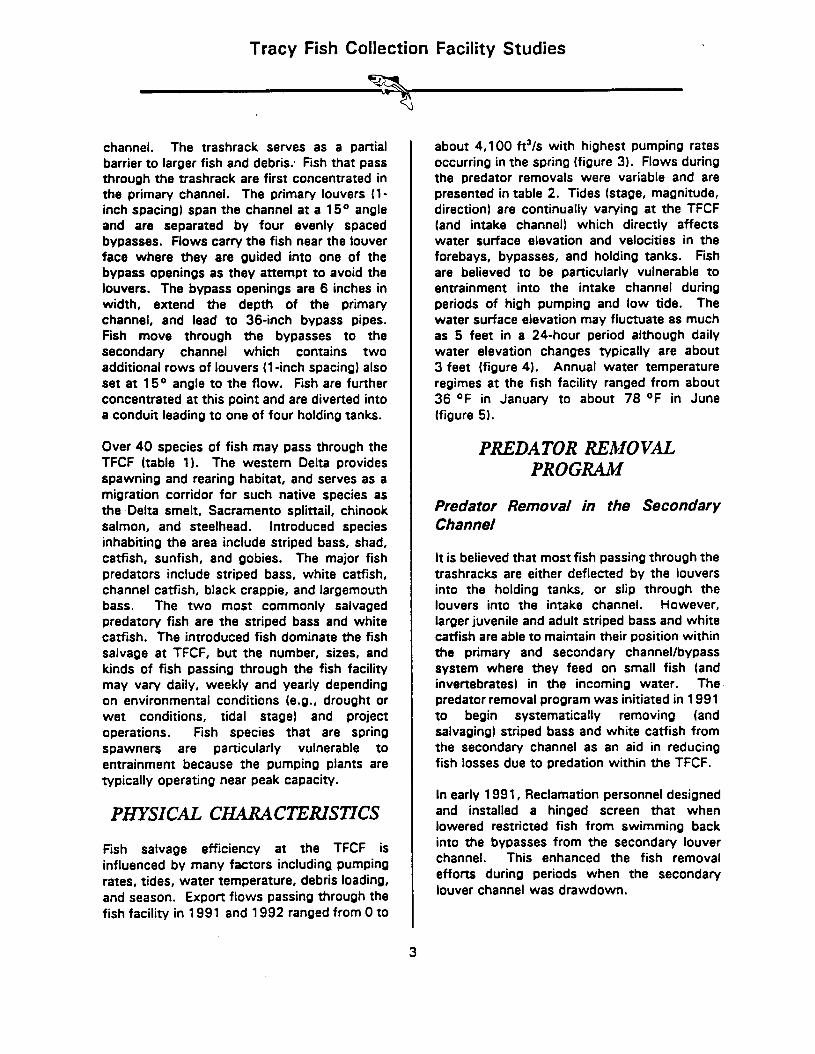
channel. The trashrack serves as a partial barrier to larger fish and debris., Fish that pass through the trashrack are first concentrated in the primary channel. The primary louvers (l- inch spacing) span the channel at a 15’ angle and are separated by four evenly spaced bypasses. Flows carry the fish near the louver face where they are guided into one of the bypass openings as they attempt to avoid the louvers. The bypass openings are 6 inches in width, extend the depth of the primary channel, and lead to 36-inch bypass pipes. Fish move through the bypasses to the secondary channel which contains two additional rows of louvers (1 -inch spacing) also set at 15O angle to the flow. Fish are further concentrated at this point and are diverted into a conduit leading to one of four holding tanks.
Over 40 species of fish may pass through the TFCF (table 1). The western Delta provides spawning and rearing habitat, and serves as a migration corridor for such native species as the ,Delta smelt, Sacramento splittail, chinook salmon, and steelhead. Introduced species inhabiting the area include striped bass, shad, catfish, sunfish, and gobies. The major fish predators include striped bass, white catfish, channel catfish, black crappie, and largemouth bass. The two most commonly salvaged predatory fish are the striped bass and white catfish. The introduced fish dominate the fish salvage at TFCF, but the number, sizes, and kinds of fish passing through the fish facility may vary daily, weekly and yearly depending on environmental conditions (e.g., drought or wet conditions, tidal stage) and project operations. Fish species that are spring spawners are particularly vulnerable to entrainment because the pumping plants are typically operating near peak capacity.
PHYSICAL CHARACZ?UUSTZCS
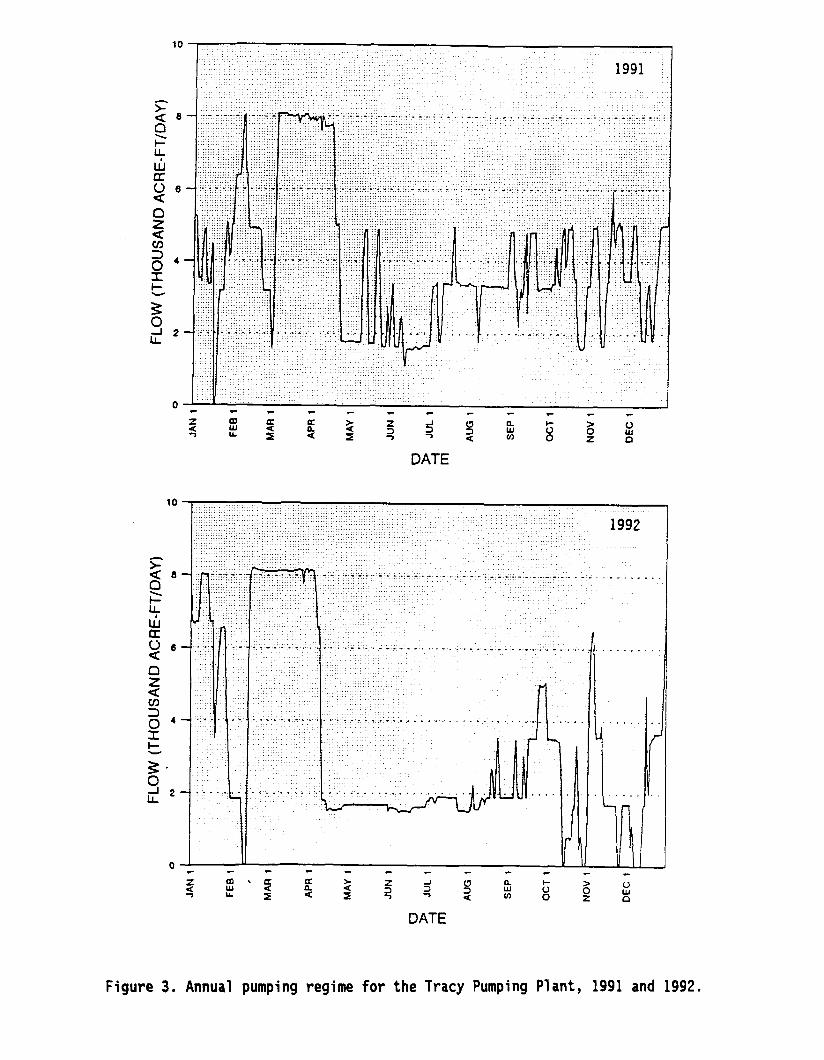
Fish salvage efficiency at the TFCF is influenced by many factors including pumping rates, tides, water temperature, debris loading, and season. Expon flows passing through the fish facility in 1991 and 1992 ranged from 0 to
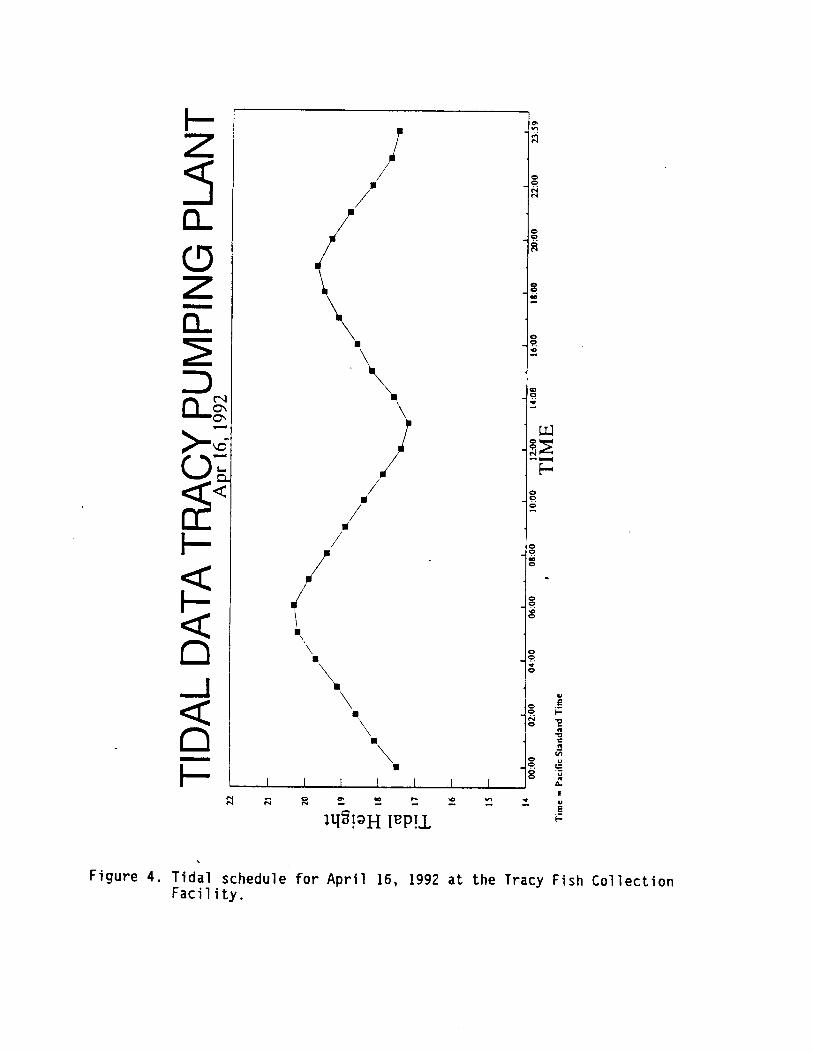
about 4,100 ft’/s with highest pumping rates occurring in the spring (figure 31. Flows during the predator removals were variable and are presented in table 2. Tides (stage, magnitude, direction) are continually varying at the TFCF (and intake channel) which directly affects water surface elevation and velocities in the forebays, bypasses, and holding tanks. Fish are believed to be particularly vulnerable to entrainment into the intake channel during periods of high pumping and low tide. The water surface elevation may fluctuate as much as 5 feet in a 24-hour period although daily water elevation changes typically are about 3 feet (figure 41. Annual water temperature regimes at the fish facility ranged from about 36 OF in January to about 78 OF in June (figure 51.
PREDATOR REMOVAL PROGZMM
Predator Removal in the Secondary Channel
It is believed that most fish passing through the trashracks are either deflected by the louvers into the holding tanks, or slip through the louvers into the intake channel. However, larger juvenile and adult striped bass and white catfish are able to maintain their position within the primary and secondary channel/bypass system where they feed on small fish (and invertebrates) in the incoming water. The predator removal program was initiated in 1991 to begin systematically removing (and salvaging) striped bass and white catfish from the secondary channel as an aid in reducing fish losses due to predation within the TFCF.
In early 1991, Reclamation personnel designed and installed a hinged screen that when lowered restricted fish from swimming back into the bypasses from the secondary louver channel. This enhanced the fish removal efforts during periods when the secondary louver channel was drawdown.
Tracy Fish Collection Facility Studies
A typical predator removal activity consisted of Shutting off the flow in the bypass/secondary system while simultaneously IowerinQ the trap screen. A second smaller screen was manually placed in front of the first secondary louver to prevent fish from entering the bypass leading to the holding tank. As water was drained from the secondary, fish were dip-netted, seined, and placed in 200-gallon temporary holding tanks. All fish were identified and counted; many were measured and weighed. Mass weights of white catfish were taken occasionally in 1992 because of time constraints. The fish were then placed in one of the holding tanks to await transportation to a release site.
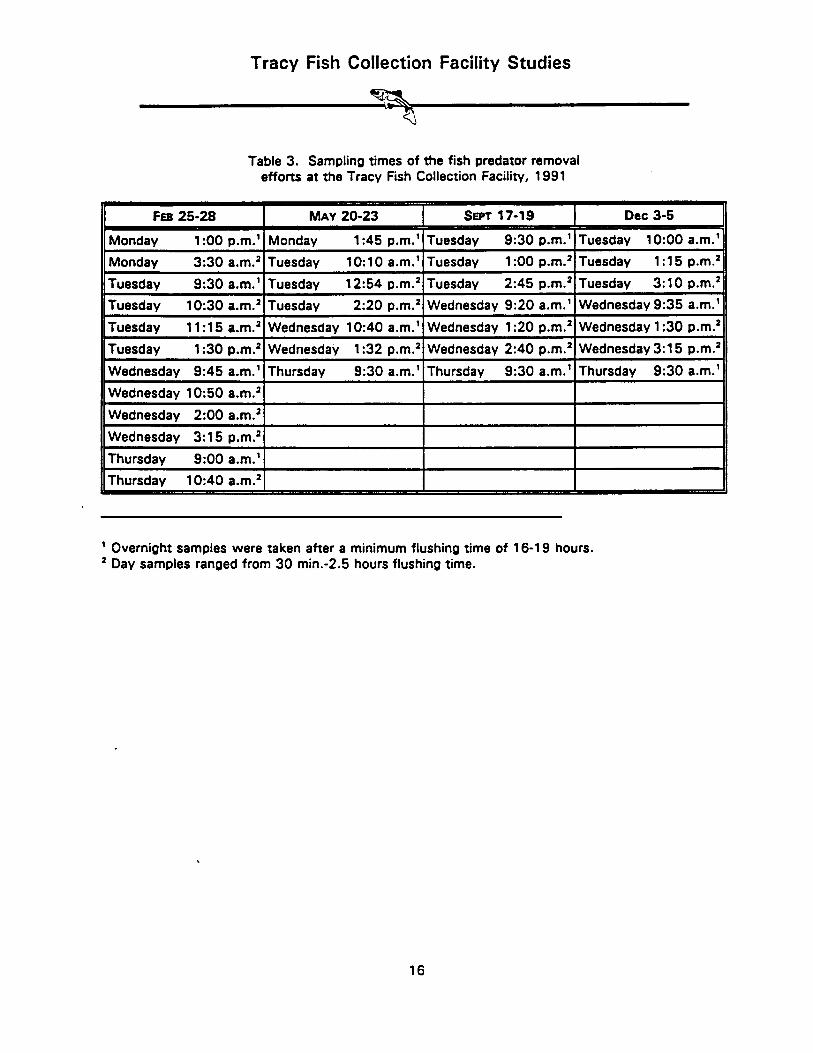
There were four predator removal efforts in 1991 and eight in 1992 (tables 3 and 4). The secondary channel was drained several times over a l- to 4-day period during each removal effort because it took several draininQ/neninQ/flushinQ cycles to effectively remove the larger fish. The number of fish removals (i.e., draining/netting/flushing procedures) varied somewhat among the 12 sampling periods due primarily to the number of fish being removed (i.e., the removal procedure was discontinued after the first or second day when few fish were present).
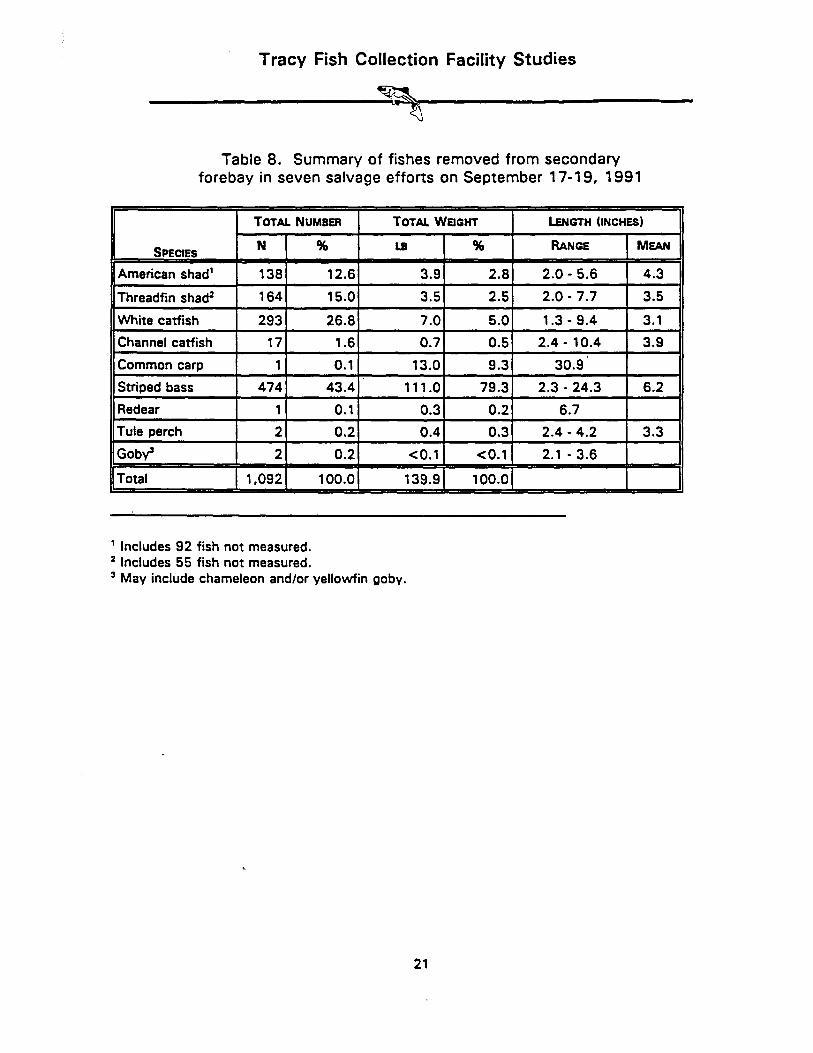
In 1991, predator removals were conducted during February 25-28 (seven removals), May 20-23 (seven removals), September 17-l 9 (seven removals), and December 3-5 (seven removals). A total of 7,272 fish comprising 19 species were removed from the secondary channel in 28 predator removals (tables 5 through 91. These fish weighed about 1,687 pounds. American shad (47.2 percent), striped bass (25.7 percent), and threadfin shad (18.1 percent) dominated the catch, while striped bass dominated the biomass (80.4 percent).
A total of 1,866 striped bass Weighing 1,356 pounds were removed from the secondary channel in 1991. Striped bass were captured year round with the numbers and
4
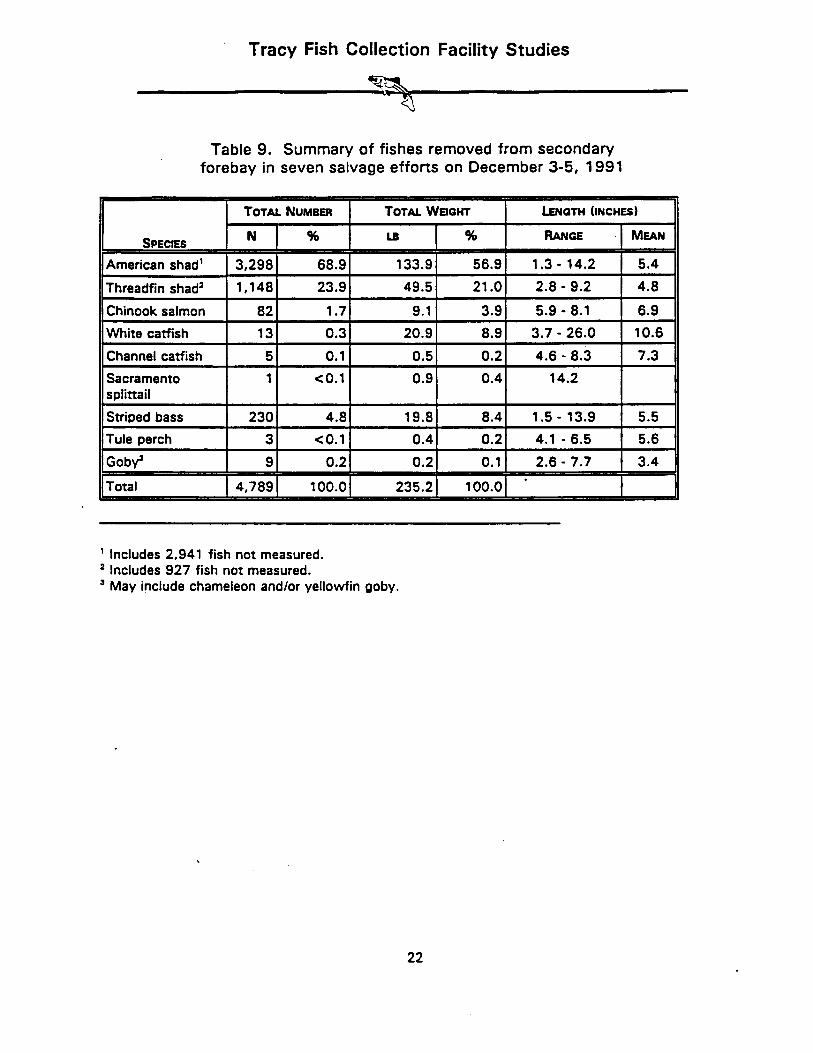
biomass decreasing from February to December. The February effort yielded more than half the striped bass biomass (62 percent), although the greatest numbers were collected in May (tables 6 and 71. The average size of striped bass decreased from 14.9 inches in February (range 3.5 to 28.4 inches), to 11.4 inches in May (range 4.1 to 25.5 inches), to 6.2 inches in September (range 2.3 to 24.3 inches), to 5.5 inches in December (range 1.5 to 13.9 inches).
White catfish was the second most abundant predator captured in 1991 (table 5). A total of 514 white catfish Weighing about 102 pounds were removed from the secondary channel. White catfish were captured year round but the majoriry were captured in May (39 percent) and September (57 percent; tables 6 through 91. White catfish averaged 6.7 inches in February (range 3.6 to 8.9 inches), 8.6 inches in May (range 2.4 to 16.1 inches), 3.1 inches in September (range 1.3 to 9.4 inches), and 10.6 inches in December (range 3.7 to 26.0 inches). May and December yielded the largest fish while the September collection yielded the most fish and was dominated by young-of-the-year.
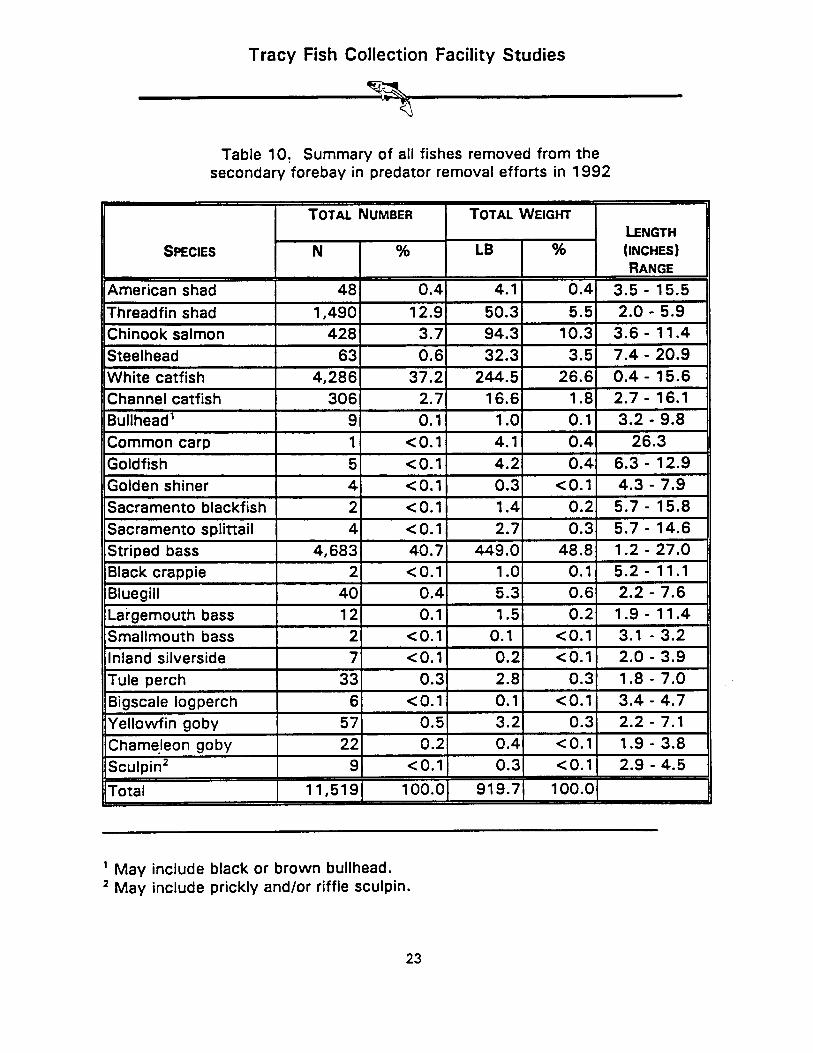
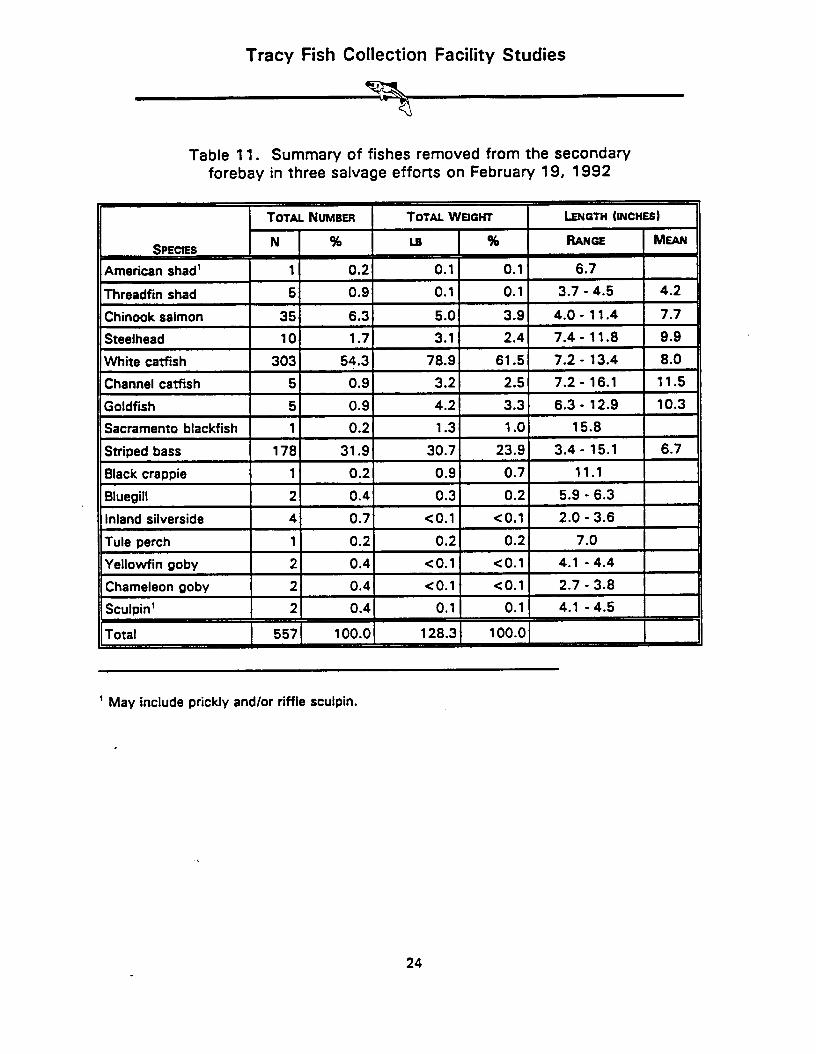
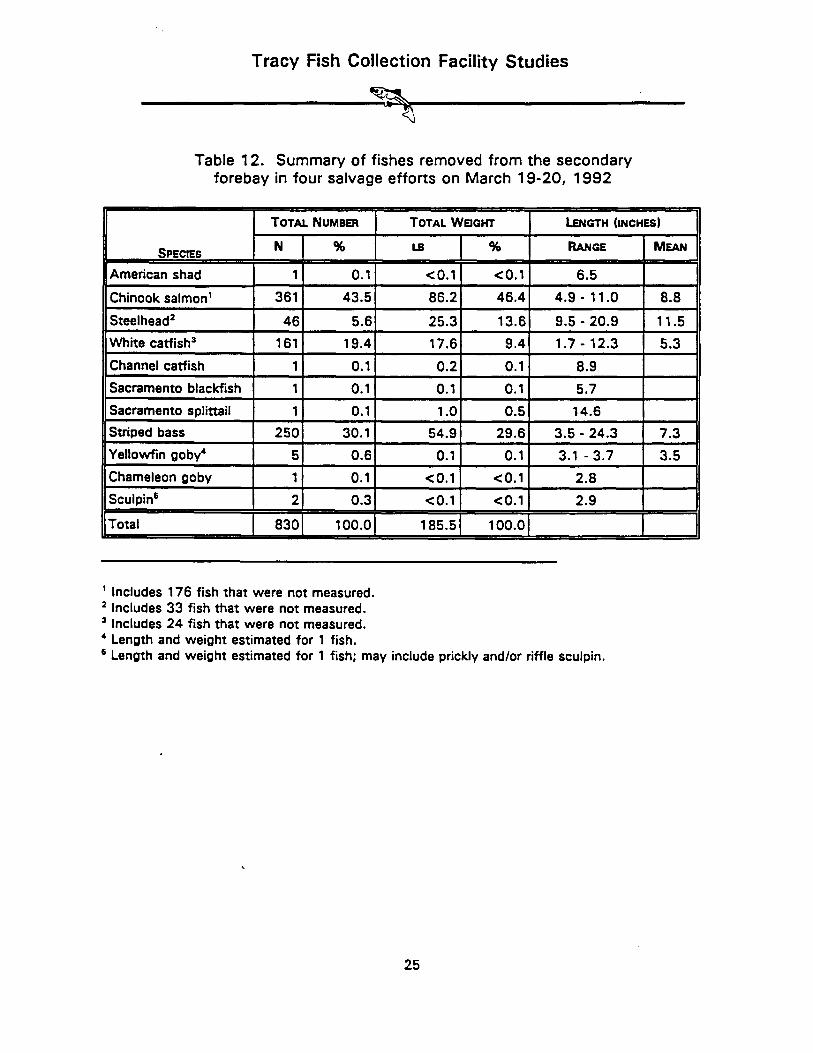
In 1992, predator removal activities were conducted on February 19 (three removals), March 19-20 (four removals), April 16-17 (three removals), May 19-20 (five removalsl, June 24 (five removals), September 29- October 1 (four removals), October 27-28 (three removals), and December 8-9 (five removals). A total of 11,5 19 fish comprised of 23 species were removed from the secondary channel in 32 predator removals (table 10). The estimated weight of these fish was about 920 pounds. Striped bass and white catfish dominated the catch (40.7 percent, 37.2 percent, respectively) and biomass (48.8 percent, 26.6 percent, respectively), followed by threadfin shad (12.9 percent of the catch, 5.5 percent of the biomass) and chinook salmon (3.7 percent of the catch, 10.3 percent of the biomass).
Tracy Fish Collection Facility Studies
Striped bass ranged in length from an average of 2.6 inches (range 1.2 to 11.5 inches) in June to an average of 8.0 inches (range 3.4 to 15.5 inches) in May (tables 11 through 18). Large adults were rare relative to 1991; the largest fish captured in six of the eight 1992 monthly predator removal efforts ranged from about 12 to 18 inches. Large fish appeared in March (24 inches) and December (27 inches). Young-of-the-year and yearlings appeared in June and dominated the entire catch through the October fish removal effort.
A total of 4,286 white catfish weighing about ,245 pounds were removed from the secondary channel in 1992 (table 10). They were collected year round in relatively high numbers and dominated the catch five of the eight sampling times (tables 11 through 18). White catfish ranged in length from an average of 3.3 inches in October (range 1.7 to 7.6 inches) to an average of 8.0 inches in February (range 7.2 to 13.4 inches). The largest fish were captured in May and June (13.5 to 15.6 inches). Young-of-the-year appeared in the March collection and increased through the year peaking in the September-October effort.
Threadfin shad was the third most abundant fish (14.9 percent, 2,803 fish) both years (tables 5 and 10). They were uncommon in most collections except in the December collection in 1991 (table 9) and the late September-October 1992 collection (table 16). American shad first appeared in September 1991 (table 8). They peaked in December in such numbers (3,298 fish) that the species dominated the 1991 catch. In 1992, American shad were relatively uncommon and only 48 fish were captured (table 101. Channel catfish were relatively uncommon in 1991, but were present year round in 1992. They began to increase in numbers May through October 1992 (tables 14 through 171, but never attained the abundance of white catfish.
I
Five native fishes were collected including chinook salmon, steelhead trout, Sacramento splittail, Sacramento blackfish, and tule perch
(tables 5 and 10). Of these, chinook salmon (total of 511 fish) and steelhead trout (total of 68 fish) were the most common while the remaining three species were rare (11 Sacramento splittail, 3 Sacramento blackfish, and 38 tule perch). Chinook salmon were more common in 1992 (428 fish) than 1991 (83 fish). In 1991, 82 salmon were collected in December (table 91 and in 1992, the majority appeared in March though individuals were present during February to May (tables 11 through 141. Chinook salmon ranged from 3.7 to 8.1 inches in 1991 and from 3.6 to 11.4 inches in 1992. The majority of steelhead (92.6 percent) were collected in 1992. This species was present primarily in March, and ranged 7.4 to 20.9 inches total length. Sacramento splittail ranged from 5.7 to 14.6 inches and 8 of the 11 fish were captured in May collections (tables 7 and 141. Tule perch ranged from 1.8 to 7.0 inches and 28 of the 38 fish were collected in December collections (tables 9 and 181.
Food Habits of Striped Bass and White Catfish
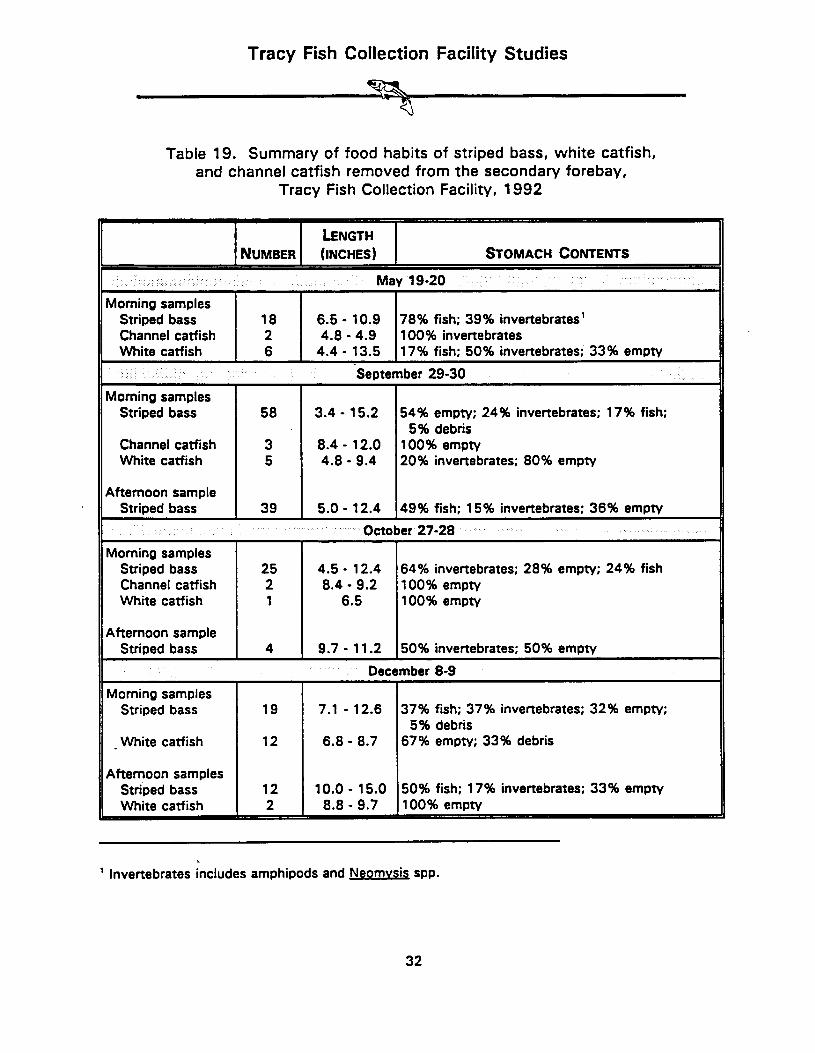
In 1992, we began to evaluate food habits of striped bass and catfish captured during the predator removals. Fish were selected to represent the juvenile and adult life history stages. Stomach contents were examined for 187 striped bass (3.4 to 15.2 inches in length), 26 white catfish (4.4 to 13.5 inches in length), and 7 channel catfish (4.8 to 12.0 inches in length) captured in the May, September, October, and December predator removal periods (table 191.
Stomachs of 68 striped bass (36 percent) contained fish remains including striped bass, chameleon goby, threadfin shad, American shad, bigscale logperch, and possibly smelt. Other major food items included amphipods and Neomvsis. The incidence of fish predation was highest in May (78 percent) and December (44 percent). The average size of the striped bass noted to consume fish was 9.2 inches (4.3 to 15.1 inches). The number of fish prey
Tracy Fish Collection Facility Studies
per stomach ranged to 51 in May (7.9inch striped bass) when postlarvae were being consumed. One 9.6-inch striped bass examined in September had eaten six fish and one 1 O.&inch striped bass captured in October contained seven prey fish.
Most catfish stomachs were empty (78 percent), and fish remains were present in 1 of 33 catfish stomachs examined. Other food items consumed included Neomvsis and debris.
Assessment of Angling Methods for Removing Fish Predators
Systematic angling can be a valuable technique for fish removal in confined areas for species such as striped bass which can be attracted to chum and readily bite when hungry. Early observations of resident, large striped bass at TFCF suggested this technique may be valuable for our overall predator removal program. Systematic angling was carried out with bait and anificial lures during February 25-27, May 20-23, and September 17-19, 1991. Areas fished included: immediately upstream of the trashracks; primary forebay; the DMC intake channel immediately downstream of the primary louvers; and waters between the secondary louvers and the return flow pumps. The angling was carried out and directed by Tom Burke, Bureau of Reclamation, Lower Colorado River Region (LC-150).
A total effort in February of 34 hours (14.5 night; 19.5 day) collected 15 striped bass (9.8 to 32.7 inches total length) and 5 white catfish (13.6 to 14.6 inches total length). Catch rates were slightly greater at night, and most of the angling success occurred between the trashracks and primary louvers with cut bait.
In May, a total of 50.5 angling hours (12.5 night; 38 tlay) produced 51 striped bass (11.4 to 32.3 inches total length). Unlike February results, the majority of May fish were taken on anificial lures in front of the
trashracks. Also, catch rates were greater during the day.
In September, a total of 11.5 angling hours produced 16 striped bass (15.0 to 32.7 inches total length) and 2 white catfish (12.8 to 16.3 inches total length). Seventeen of the 18 fish were taken with cut or live bait. Also, most of the fish (61 percent) were caught between the secondary louvers and the return flow pumps.
Considering all angling efforts, a total of 96 hours produced 89 fish for a catch rate of 0.93 fish per hour. Although this may be a respectable rate for recreational angling, it does not appear that these methods are feasible for TFCF, especially when other techniques can remove hundreds of fish predators in several hours of effort. However, seasonal angling (perhaps late spring) in front of the trashracks may remove enough large predators to justify angling, especially if small individuals of an endangered species are being threatened by predation.
Mark-Recapture Program
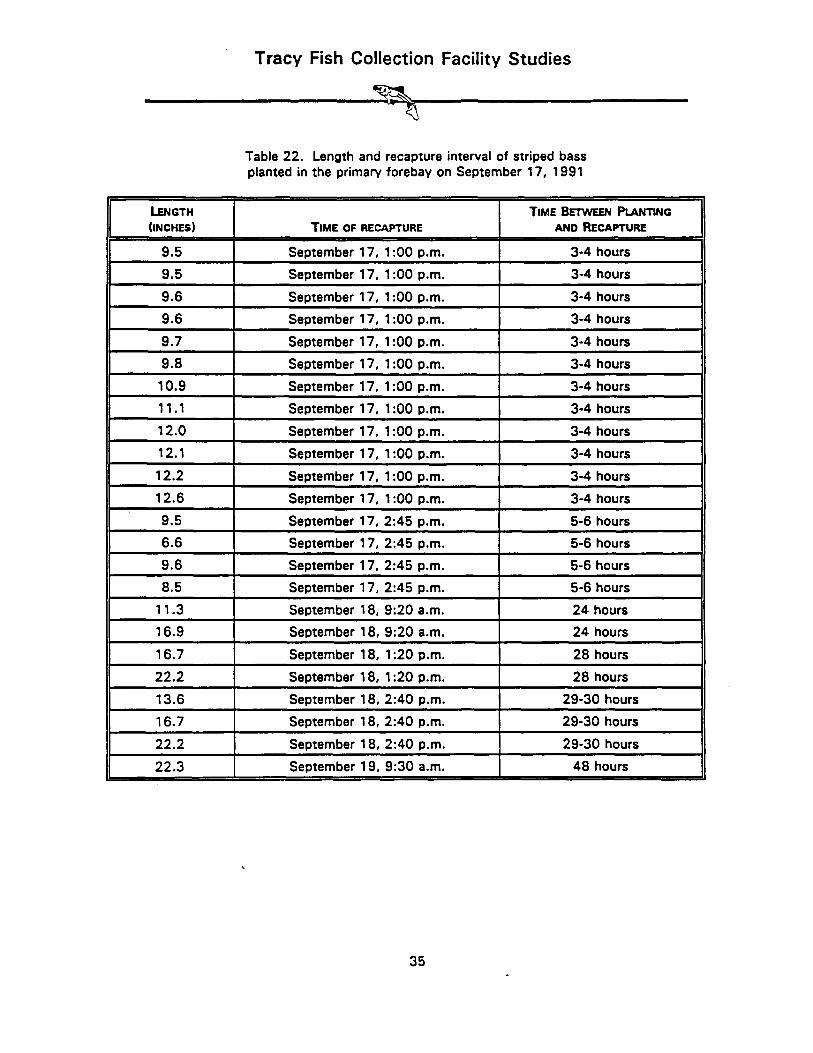
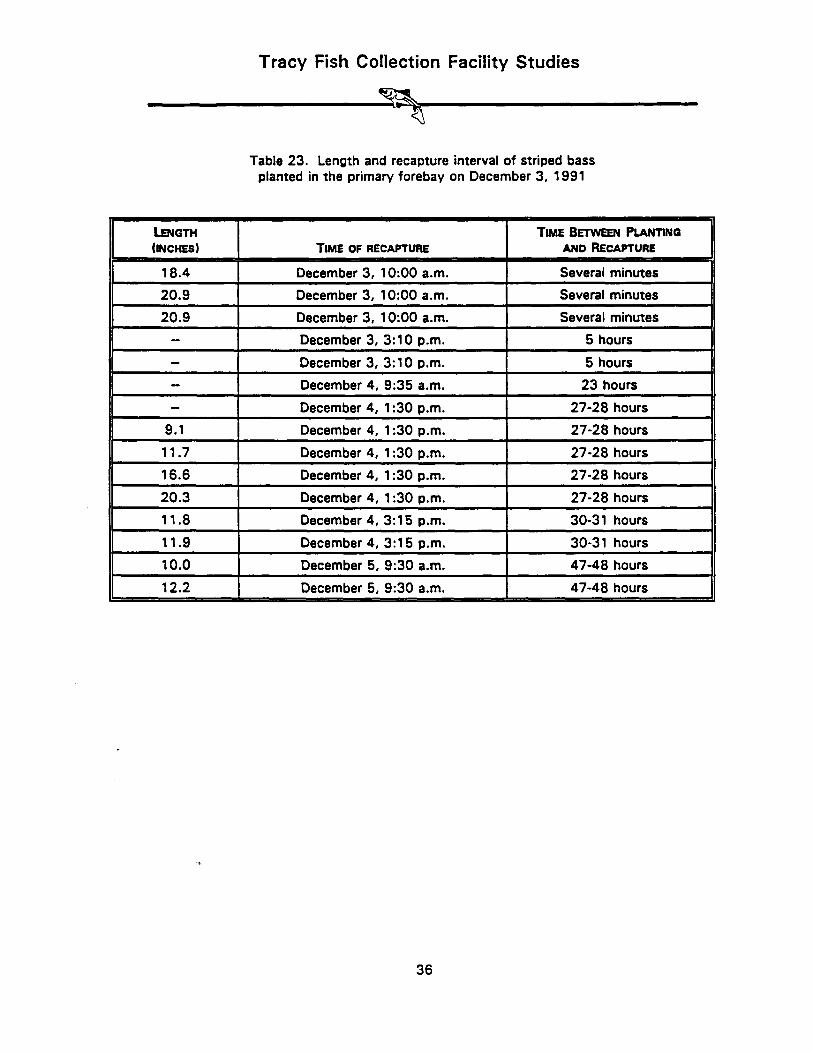
The mark-recapture program was initiated in 1991 to begin evaluating movements of striped bass within the fish facility. Of primary interest was whether fish released directly into the primary forebay would be recaptured in the secondary forebay within 1 week.
Striped bass were captured in the secondary forebay during a regular draining/predator removal effort, given either an assigned fin-clip or tagged with a flay-tag, and released into the primary forebay (methods used for tagging and releasing fish were presented earlier in Liston et al., 19921.
A total of 267 striped bass ranging from 6.6 to 27.6 inches total length were marked and released in 1991 (98 on February 25, 93 on May 20, 56 on September 17; and 20 on December 3; tables 20 through 23). Of these, 77 (28.8 percent) were recaptured in
Tracy Fish Collection Facility Studies
subsequent drawdowns of the secondary forebay, and most of the 77 recaptures occurred within the first 2 days following release. Nine recaptures in May were fish that had been released in February and presumably remained within the TFCF for 84 to 87 days.
The fate of the remaining 190 marked fish is unknown. Several flay-tagged fish were observed by the fish facility operators during the daily draining of the holding tanks, and presumably many of the released fish were louvered into the holding tanks during the days and months following their release. Some fish may have moved upstream through’ the trashracks and into the Old River (fish up to 12 to 14 inches in length may readily move through the 2-inch trashrack openings). Some fish may have moved downstream during the daily louver cleaning. Lastly, some fish may have taken up residence in the primary forebay or bypass tubes.
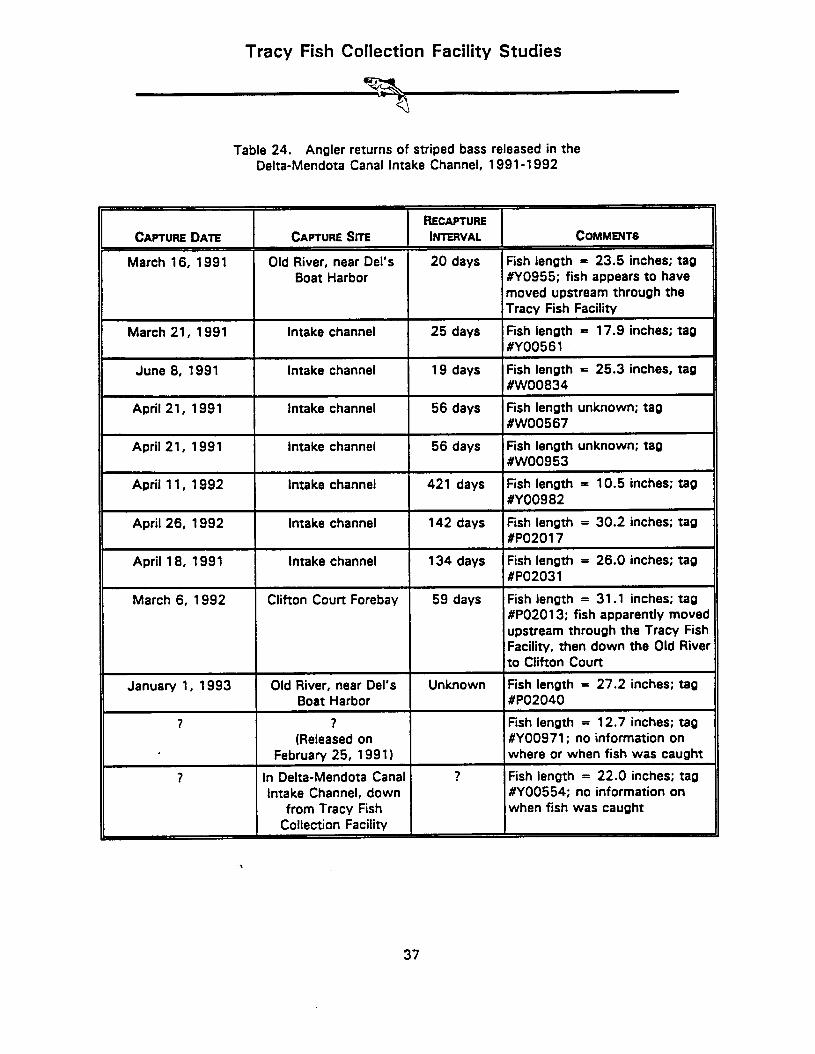
Tagged striped bass were also occasionally released into the Delta Mendota Canal Intake Channel downstream of TFCF to gain insight into local movements using potential angler returns.
Ten flay-tagged fish were captured by local anglers (table 24). Most of the recaptured fish were captured in the intake channel. However, three fish (23.5 to 31 .l inches in length) were angled in the nearby Old River channel (2) and Clifton Court Forebay (1 I. These latter recaptures indicate that large striped bass are able to move upstream through the fish facility including the trashracks to the neighboring Old River channel. The fact that the three fish were relatively large suggests that there may be holes in the trashracks through which larger sized fish may pass regularly.
Summary
A total 18,791 fish (2,606 pounds) comprising 24 species were captured during the predator removal program in 1991-92. Striped bass (6,549 fish, 1,805 pounds) and white catfish
7
(4,800 fish, 346 pounds) dominated the overall catch in numbers and biomass. Striped bass was the most common predator and was present year round. Large striped bass were captured during the first two salvage efforts (February and May, 1991) and we assume that these fish had been residing within the facility for years. Following their removal, the average size of striped bass declined for the remainder of 1991, and remained small (the average striped bass was under 8 inches) in 1992. We presume that the few large striped bass captured in 1992 either reinvaded the facility during cleaning of the primary louvers or had resided in the primary channel during the study.
White catfish was the second most abundant predator collected and also was present year round. Large white catfish were not common but the numbers suggest that a large population of white catfish lives in the area in and around the TFCF.
The preliminary food habit examinations suggests that juvenile striped bass feed opportunistically on small fish and that they can consume large numbers of fish prey in a short time period. This information together with the high numbers of striped bass and white catfish removed from the secondary forebay suggests that the predator removal program should be continued at least monthly as a means of reducing potentially significant predation. Striped bass and white catfish are able to find refugia within the facility but they can be regularly removed (and salvaged) with a draining/netting program.
Angling was only moderately successful in removing large predators from areas within the fish facility. However, angling upstream of the trashracks may yield more predators (for removal and salvage), particularly during periods when young fish (such as shad) are abundant.
Results of the mark-recapture program indicated that some juvenile and adult striped bass are readily louvered by the primary
Tracy Fish Collection Facility Studies
louvers. However, many fish are able to reside within the system and thus increase the risk of predation. Also, recapture of marked striped bass outside of the facility indicates that some fish were presumably able to pass upstream through the trashracks.
INTAKE CHANNEL PROGRAM
The intake channel to the DMC between the TFCF and the TPP is about 2.5 miles long, about 60 to 100 feet wide, and about 14 to 17 feet deep. The intake channel is earthen- lined and supports a diversity of animal and plant life. Fish may enter the intake channel either by slipping through the primary or secondary louver systems of the fish facility. In 1991 and 1992, we began to evaluate the fishery resources of the DMC intake channel using gill nets, fyke traps, and electrofishing gear.
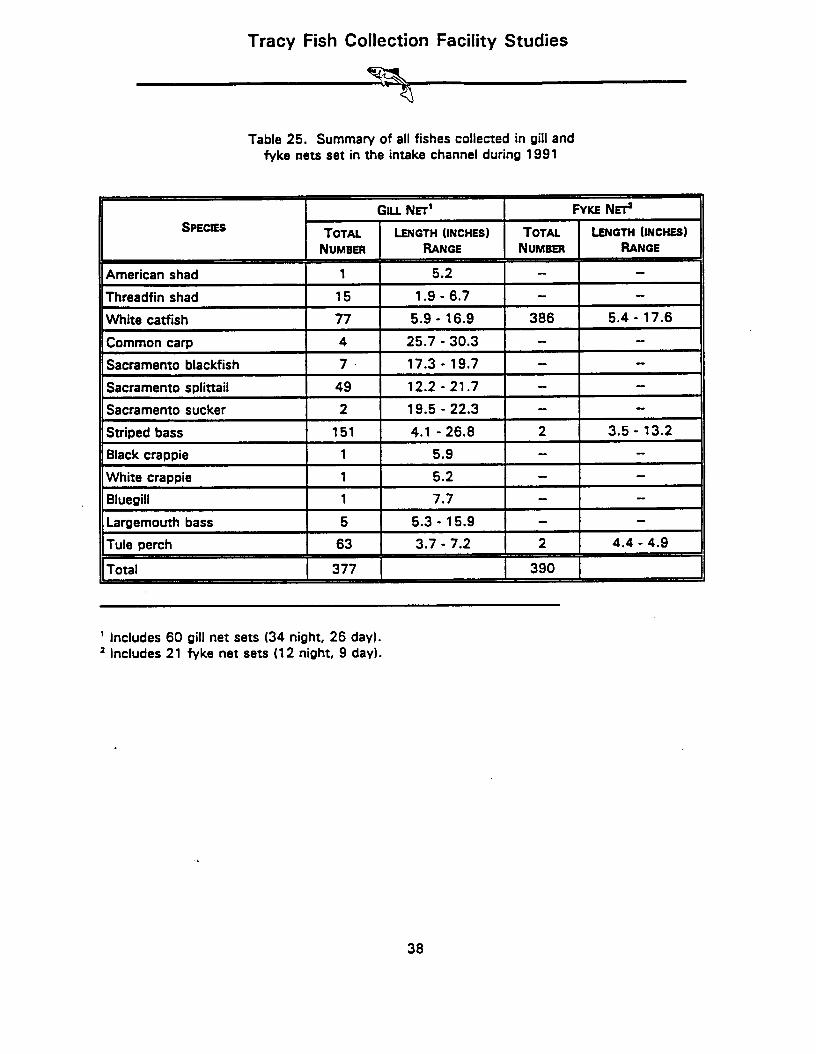
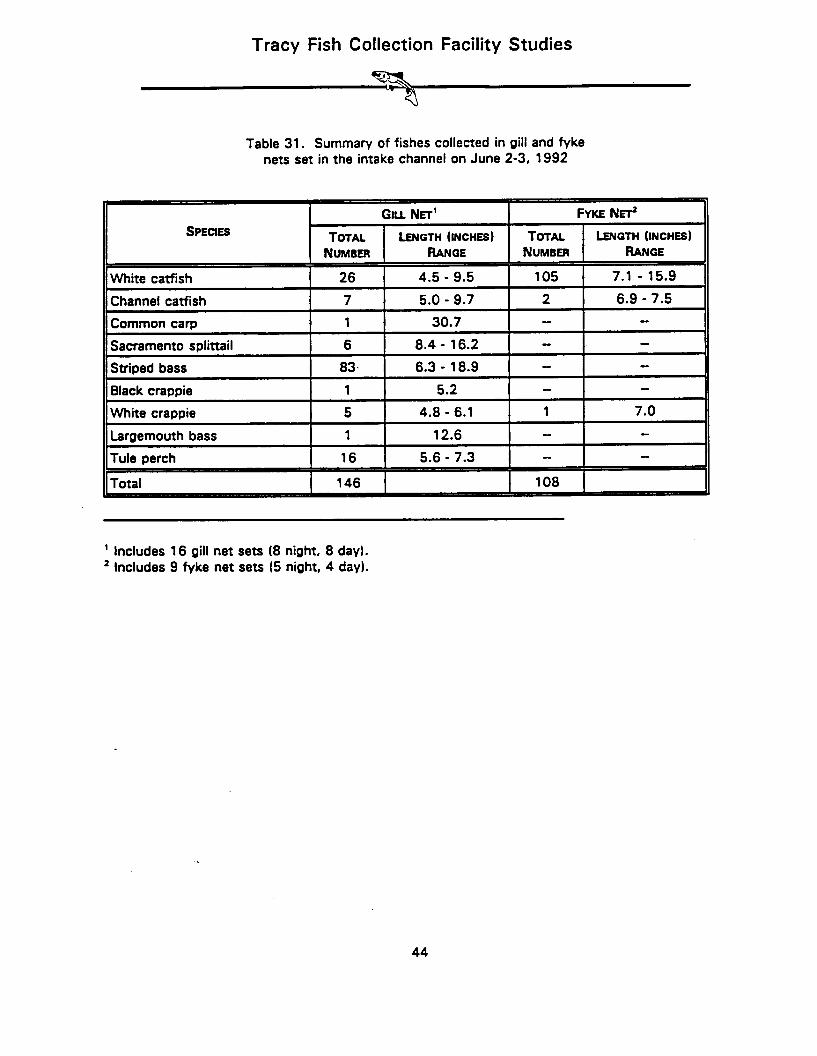
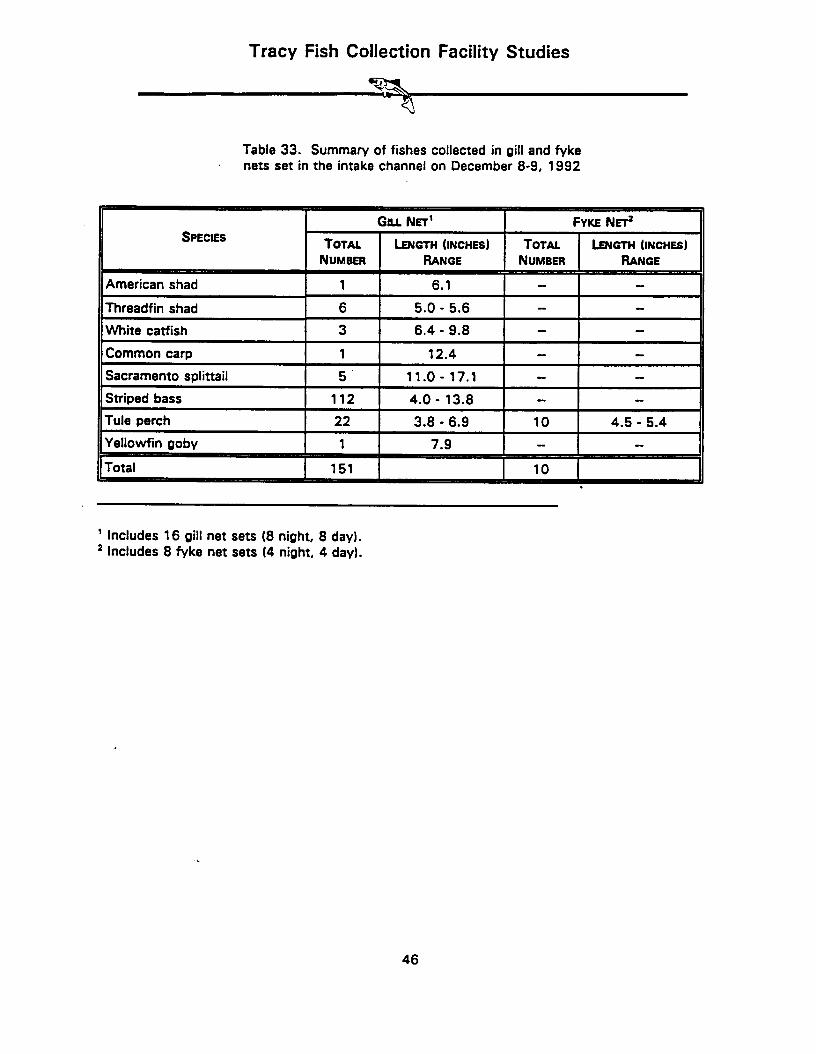
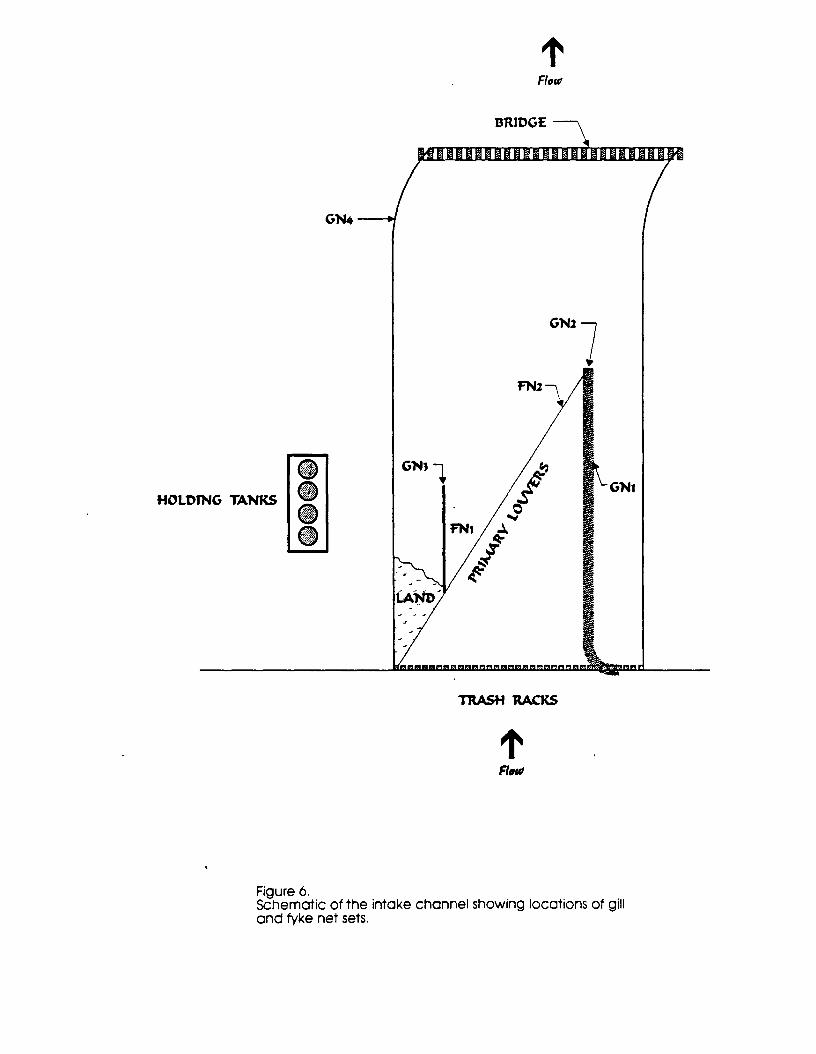
’ Bottom monofilament gill nets (100 feet long x 6 feet deep with panels of 0.5, 0.75, 1 .O, 1.25, and 1.5 inch bar mesh size) were fished during the day (about 8 hours) and at night (about 17 hours) at four stations upstream of the bridge (figure 6). Two fyke traps (0.5-inch bar mesh nylon) were used at stations FNl (net diameter 4 feet) and FN2 (net diameter 3 feet) again during day and night (figure 6). Gill and fyke netting was conducted in February, May, September, and December in 1991, and in June, September, and December 1992.
A total of 104 gill net sets were fished (60 in 1991; 44 in 1992) and yielded 872 fish representing 15 species (tables 25 through 33). Striped bass was the most abundant fish captured (48 percent) followed by tule perch (17 percent), white catfish (14 percent), and Sacramento splittail (8 percent).
Numbers of striped bass increased through the year and the catch was generally dominated by juveniles and smaller adults (4.0 to 26.8 inches in length). A few large adults were captured in 199 1. White catfish was more abundant in the gill net samples in May and June and relatively
rare at other times. Tule perch was most abundant in September both years and ranged in length from 3.7 to 7.8 inches. Sacramento splittail was fourth in abundance and captures included both juveniles and adults (8.4 to 21.7 inches). Two other native fishes, the Sacramento sucker (two fish in 1991) and the Sacramento blackfish (seven fish in 1991) were present but rare in gill net collections. Overnight net sets typically yielded more fish than day sets, in fact the day sets were often empty.
Fyke trapping was relatively unproductive both years except for catfish (tables 25 through 331. In May 1991, 10 fyke trap sets (8 to 17 hours) yielded 385 white catfish. Only 12 catfish were taken in day samples as compared to 373 from overnight collections. In 1992, the fyke trap catch was again dominated by catfish (92 percent of total catch), particularly white catfish (7.6 percent of total catch). Tule perch was the third most abundant fish captured with fyke traps (5 percent of catch).
Gill nets were also used to a limited extent in the outlet area of the TPP (beginning of the DMC). Two nets set overnight in February and May, and 1 in September of 1991 yielded 63 fish comprising 6 species. Channel catfish (46 percent, 3.0 to 19.1 inches) and white catfish (32 percent, 7.9 to 13.4 inches) dominated the catch. Sacramento splittail (11 percent, 13.6 .to 15.2 inches) and Sacramento sucker (8 percent, 18.3 to 20.3 inches) were locally common and the remaining two species, redear (1.5 percent, 9.5 inches) and striped bass (1.5 percent, 15.0 inches), were rare. We presume these fish came from the intake channel (Old River) and survived entrainment in the large pumps at the TPP.
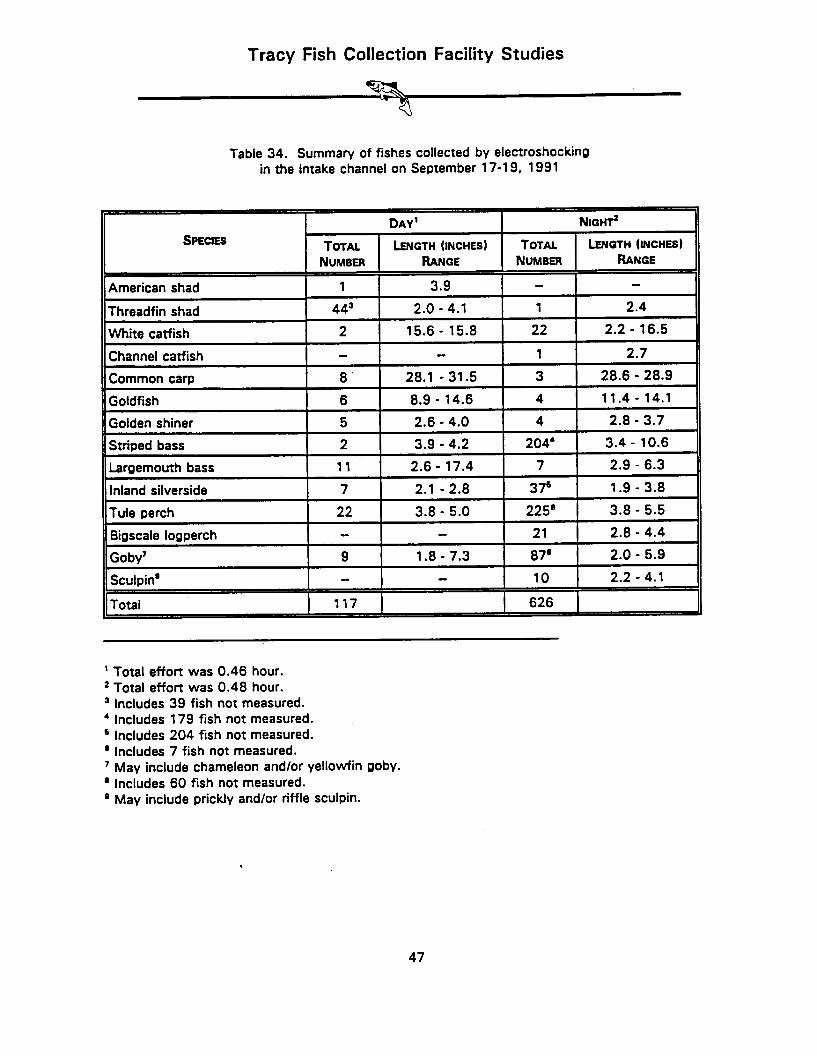
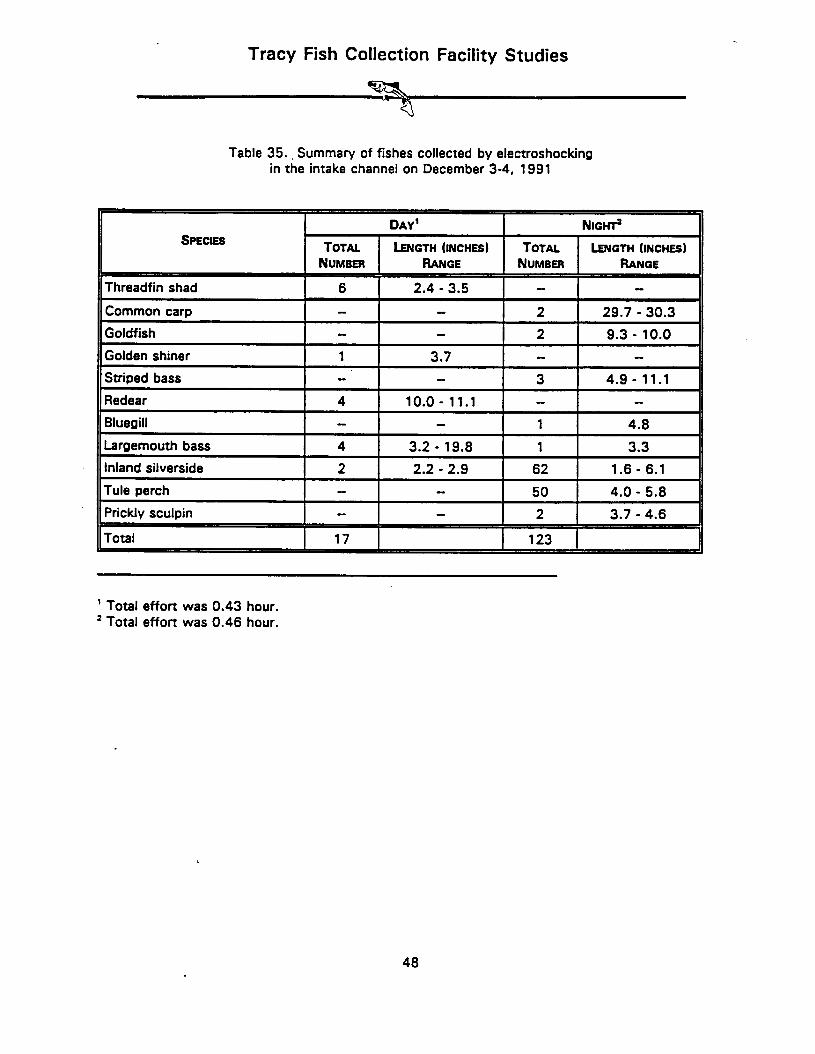
Electrofishing gear was used in September and December 1991 to aid in evaluating the fish resources of the intake channel. A total of 656 continuous yards of both shorelines just downstream of the bridge were sampled quantitatively, and several qualitative samples
Tracy Fish Collection Facility Studies
were taken in deeper water. The shoreline sampling area was divided into three sampling sites, each 218.7 yards in length. The day effort consisted of electrofishing the two outside sites on the south shore and the middle site on the north shore. The night effort sampled the remaining three sites. This design was repeated in both months so that there were two day samples and two night samples. Total shocking time for the daytime effort ranged from 0.43 hours (December) to 0.46 hours (September) and for nighttime from 0.46 hours (December) to 0.48 hours (September).
A total of 883 fish were captured comprising 16 species (tables 34 and 35). Sampling in September yielded more fish (84 percent of all fish captures) and species than the December effort (16 percent) but nighttime sampling was the most productive both in numbers of fish (85 percent of all fish captures) and species diversity (14 of 16 species versus 12 daytime species).
The September daytime electrofishing catch was dominated by threadfin shad (95.7 fish per hour) and tule perch (47.8 fish per hour); striped bass was rare (4.3 fish per hour). Threadfin shad were rare in the night catch (2.1 fish per hour) but tule perch (468.8 fish per hour) and striped bass (425.0 fish per hour) were abundant. Gobies were also relatively abundant (181.3 fish per hour) at night.
All fish were scarce in the shoreline sampling area during daytime electrofishing in December, but inland silverside (134.8 fish per hour) and tule perch (108.7 fish per hour) were relatively abundant at night.
Summary
Gill netting and electrofishing were adequate tools for sampling the fish resources of the intake channel. Fyke trapping seemed to target catfish and did not yield much diversity. The shoreline and deeper water habitats appear to support a rather diverse assemblage of native
9
and introduced fishes. Of particular note, juvenile and adult tule perch and Sacramento splittail were captured both years. Both these species are considered to be in decline throughout the Sacramento-San Joaquin system due partly to loss of usable habitat, and the intake channel may serve as a refugium to these species. Other native fishes captured included Sacramento sucker and Sacramento blackfish although these fish were incidental.
DISCUSSION
The TFCF was designed in the mid-1950’s to salvage young striped bass and young migrating chinook salmon from flows being exported in the DMC. However, it is now recognized that over 40 species of fish may pass through the facility, some of these endangered species, and that the facility may not be as efficient in salvaging all species equally. The predator removal program was directed at improving the overall salvage efficiency by removing the larger predators that had taken up residency within the facility. Special emphasis was placed on removing predators from the secondary channel where fish tend to concentrate and smaller fish may be most vulnerable to predation. A total of 65 drawdowns during 1991 and 1992 yielded 6,549 striped bass (1,805 pounds) and 4,800 white catfish (346.1 pounds). This program was successful at preventing the buildup of large predatory fish and has become a regular management activity.
The actual benefits of predator removals at TFCF on the overall salvage is difficult to demonstrate in statistical models. Fish population dynamics are no doubt complex in the Delta, as elsewhere, and are affected by many physical and biological factors. It is beyond the scope of present Tracy studies to explore this deeply. We have demonstrated that, left alone, fish predators tend to build up within TFCF, and, funher, many small fish are easy prey for these fish. Recent 1993 data at TFCF shows predation by striped bass on immature salmon also. We believe it is clearly
Tracy Fish Collection Facility Studies
in the best interest of all involved parties to keep predation at TFCF as low as possible through predator removals.
Minimizing predation at TFCF is a good beginning on the road to general overall improvement and modernization for this facility. As predator removals become routine, less time will be spent in data taking on this issue as other aspects of the Tracy studies grow in importance (i.e., experimentation with additional fish salvage methods such as sieve nets and fry nets positioned below trashracks and louvers, enhanced flow and temperature monitoring with new automated instruments, evaluations of fish survivorship in holding tanks, potential tests of new fish screen concepts, updated louver efficiency estimates, biology of native species in the DMC intake channel below TFCF, stocking site evaluations, new debris handling programs, refinement of
continuous monitoring of early life stages of fish entering TFCF, determinations of potential flexibility in the fish trucking and fish stocking program). We anticipate a series of reports in the next several years addressing each of these other TFCF aspects.
Major side benefits of the present studies were observations of fish resources in the DMC intake channel below TFCF. These early studies have increased our understanding of the potential of these man-made systems for supporting both native and nonnative fish species. Much remains’ unknown about these systems in regards to fish habitat. We feel it is important to continue assessing these systems with special focus on native species such as Sacramento splittail. Populations of rare or uncommon native fish species may potential benefit by manmade habitats, but basic data on present conditions must be acquired first.
10
Tracy Fish Collection Facility Studies
RECOMMENDATIONS n We recommend that predator removals
using drawdowns of the secondary louver sump become part of the regular facility operations and that they be conducted at least monthly when water temperatures are cool enough to avoid stressing the fish, or when fish are observed in either the primary or secondary channels. Structural modifications that may aid this effort (e.g., installation of a boom and bucket assembly whereby fish are quickly transported from the secondary channel to a holding, tank truck) should be investigated so that fish are efficiently moved from one location to another, and that the louvering function is interrupted for very short periods. Removing predators by angling appears to be too time consuming to consider.
n Recent evaluations have indicated that fish holding up in the outlet of the bypass pipes may be flushed into the secondary where they can be netted, or into the holding tanks
for removal. We suggest that additional studies be conducted to determine methods to flush fish from the bypass outlets to assist in removing potential predatory fish from the area.
n Large fish were occasionally observed in the area between the secondary louvers. Fish are diverted into the bypass pipes by the first set of secondary louvers and then some are able to swim against the current into the area between the louvers. We suggest that some type of structural modification in the bypass pipe between the secondary channel and holding tanks be evaluated to reduce this potential buildup of predatory fish.
n Biological information on native species residing in the intake channel below TFCF should be gathered (i.e., general indices of population size, movements, we composition, reproduction) and used in State and Federal programs aimed at protecting these species.
ACRNOWLEDGMENTS This work was conducted under the auspices of the Interagency Ecological Studies Program Fish Facility Technical Committee. The Tracy Fish Collection Facility fishery studies were funded through cooperative programs between Reclamation’s Mid-Pacific Regional and Denver Offices (D-3700). Staff from Bureau of Reclamation, U.S. Fish and Wildlife Service, and California Depanment of Fish and Game assisted with field collections and planning. We particularly acknowledge the following people for their support and assistance: Gary Sackett and Ron Brockman (MP-400); Walter Jourdan (TO-1 00); Herb Ng and Bob Martin (TO-400); Gary Jordan and staff at the Tracy Fish Collection Facility; Rick Wydoski, Tom LaCasse, Judy Lyons, and Henry Chambless (D-37421; Scott Barrow and staff from California Department of Fish and Game; and, Robert Pine, Christine Willis, and others from the U.S. Fish and Wildlife Service. In addition, we thank Gary Sacken and Ron Brockman (MP-4001, Jim Arthur (MP-7801, and Jim LaBounty ID-37421 for their overall support of the studies. Further, special thanks are due to Gordon Mueller (D-3742) for expertise and assistance in netting programs, and Tom Burke (LC-150) for carrying out the angling programs and providing essential help in electrofishing. Editorial assistance was provided by Danny King (D-37401.
11
Tracy Fish Collection Facility Studies
LITERA TURE Cl TED
California Academy of Sciences, 1975. Biological Studies of the Delta-Mendota Canal, Central Valley Project, California, II. San Francisco, California.
Kubitschek, J. and Johnson, P., 1993. Tracy Fish Facilities (TFCF) Instrumentation Selection Recommendations, Final Report. Bureau of Reclamation, Research and Laboratory Services Division, Denver Off ice.
Liston, C.R.; Hiebert, S.D.; and Mueller, G.A., 1992. Preliminary results of initial studies for increasing fish salvage efficiencies at the Tracy Fish Collection Facility, and assessing fishery resources in the upper Delta-Mendota Canal system, California. 1991 Progress Report, Bureau of Reclamation, Research and Laboratory Services Division, Denver Office.
Liston, C.R.; Brockman, R,; Sackett, G.; Karp, C.; Hess, L.; Johnson, P.; Hiebert, S.; and Mueller, G., 1993. Improvements in fish collection facilities at the Federal Tracy Pumping Plant in the South San Francisco Bay Delta, California. Proceedings of the American Fisheries Society Fish Passage Symposium, Portland, Oregon, September 1 and 2, 1993. In Press.
Moyle, P.B., 1973. Inland Fishes of California. University of California Press, Berkeley.
Robins, C.R.; Bailey, R.M.; Bond, C.E., et al., 1991. Common and Scientific Names of Fishes of the United States and Canada, 5th edition, American Fisheries Society, Special Publication 20.
12
Tracy Fish Collection Facility Studies
Table 1. List of fishes occurring in the South Sacramento-San Joaquin Delta, California’
’ May include black or brown bullhead. * May include prickly and/or riffle sculpin.
23
Tracy Fish Collection Facility Studies
Table 11. Summary of fishes removed from the secondary forebay in three salvage efforts on February 19, 1992
’ May include prickly and/or riffle sculpin.
24
Tracy Fish Collection Facility Studies
Table 12. Summary of fishes removed from the secondary forebay in four salvage efforts on March 19-20, 1992
Total 1 8301 lOO.Ol 185.51 lOO.Ol
’ Includes 176 fish that were not measured. 2 Includes 33 fish that were not measured. ’ Includes 24 fish that were not measured. l Length and weight estimated for 1 fish. 6 Length and weight estimated for 1 fish; may include prickly and/or riffle sculpin.
25
Tracy Fish Collection Facility Studies
Table 13. Summary of fishes removed from the secondary forebay in three salvage efforts on April 16-l 7, 1992
White catfish 390 47.5 26.8 30.4 1.6 - 11.9 5.4
Channel catfish 4 0.5 0.2 0.2 3.7 - 6.6 4.5
Striped bass 379 46.1 53.1 60.3 3.9 - 18.5 6.5
Chameleon goby 1 0.1 <O.l 0.15 3.3
Sculoin’ 1 0.1 <O.l 0.15 3.7
Total 1 8211 lOO.Ol
’ May include prickly and/or riffle sculpin.
26
Tracy Fish Collection Facility Studies
Table 14. Summary of fishes removed from the secondary forebay in five salvage efforts on May 19-20, 1992
II TOTAL NUMBER TOTAL WEIGHT LENGTH (INCHES) II
Black crappie 1 0.2 0.1 0.2 5.2 Tule perch 2 0.4 0.2 0.4 1 .B - 6.0 3.9
Table 15. Summary of fishes removed from the secondary forebay in five salvage efforts on June 2-4, 1992
White catfish’
Channel catfish
Bullhead’
Striped bass’
376
71
1
461
40.0
7.6
0.1
49.0
20.5
3.0
0.6
7.0
60.6
0.9
1.8
23.1
2.2 - 15.6
3.0 - 7.2
9.8
1.2 - 11.5
4.4
5.0
2.6
11 Total I 9401 lOO.Ol 33.81 lOO.Ol
’ Includes 213 fish that were not measured. ’ May include brown and/or black bullhead. ’ Includes 296 young-of-the-year that were not measured. ’ May include prickly and/or riffle sculpin.
28
Tracy Fish Collection Facility Studies
Table 16. Summary of fishes removed from the secondary forebay in four salvage efforts on September 29-October 1, 1992
II TOTAL NUMBER TOTAL WEIGHT ~NGTH (INCHES) II
Tule perch 1 <O.l 0.2 <O.l 6.4
Bigscale logperch 1 <O.l Cl.0 <O.l 4.7
Yellowfin goby 47 0.9 3.0 1.1 2.6 - 7.1 6.0
’ Includes 908 fish that were not measured; some numbers were estimated from mass weights.
2 Includes 1,250 fish that were not measured. ’ Includes 65 fish that were not measured. ’ May include brown and/or black bullhead. 6 Some numbers of fish were estimated from mass weights; 1,214 fish were not
measured.
29
Tracy Fish Collection Facility Studies
Table 17. Summary of fishes removed from the secondary forebay in three salvage efforts on October 27-28, 1992
’ Includes 290 fish that were not measured. ’ May include brown and/or black bullhead.
30
Tracy Fish Collection Facility Studies
cI,pI
Table 18. Summary of fishes removed from the secondary forebay in five salvage efforts on December 8-9, 1992
’ Includes 12 gill net sets (6 night, 6 day). 2 Includes 4 fyke net sets (3 night, 1 day).
39
Tracy Fish Collection Facility Studies
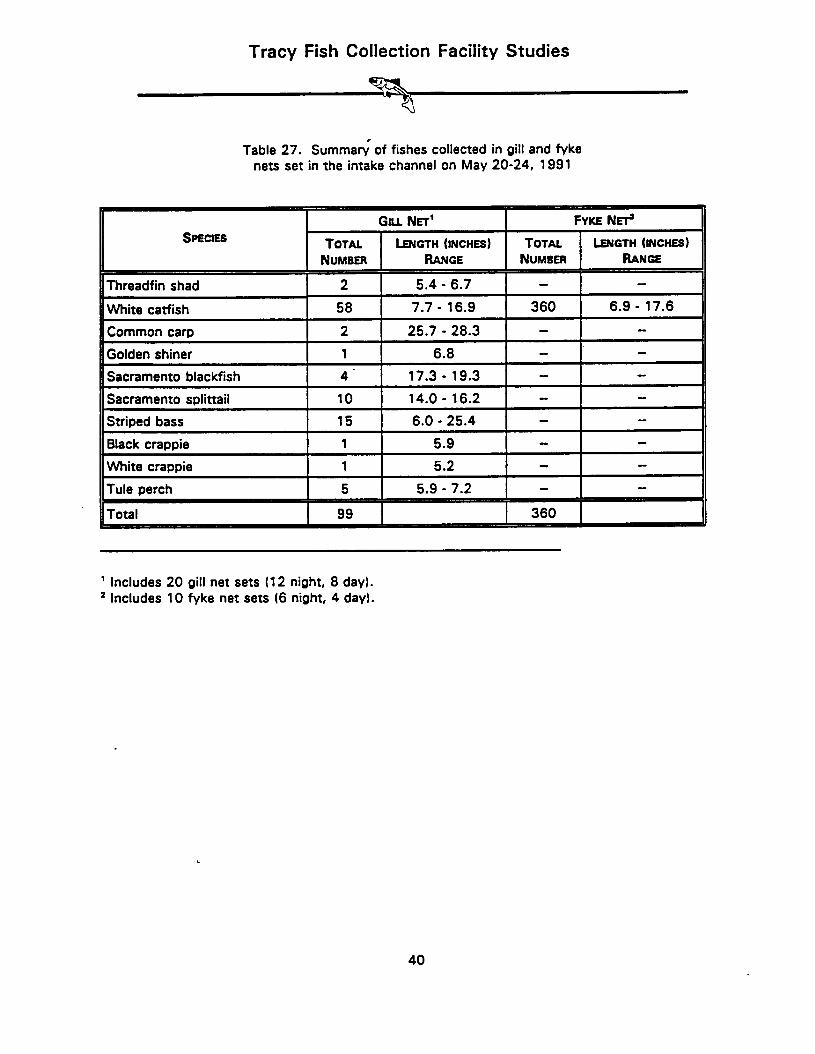
Table 27. Summa& of fishes collected in gill and fyke nets set in the intake channel on May 20-24, 1991
SPECrES GILL NET’ FYKE NE?
TOTAL UNGTH (INCHES) TOTAL IENGTH (bmi~l NUMBER RANGE NUMEER RANGE
’ Includes 20 gill net sets (12 night, 8 day). ’ Includes 10 fyke net sets (6 night, 4 day).
40
Tracy Fish Collection Facility Studies
Table 28. Summary of fishes collected in Qill nets from the intake channel on September 1991
SPECIES TOTAL NUMBER
American shad 1 5.2
Threadfin shad 2 1.9 - 4.9
White catfish 9 5.9 - 14.2
Common carp 1 30.3
Sacramento splittail 13 12.2 - 17.5
Striped bass 42 4.1 - 26.8
Bluegill 1 7.7
Largemouty bass 4 5.3 - 10.8
Tule perch 52 3.7 - 7.0
Total
’ Includes 12 gill net sets (8 night, 4 day); no fyke netting in September.
41
Tracy Fish Collection Facility Studies
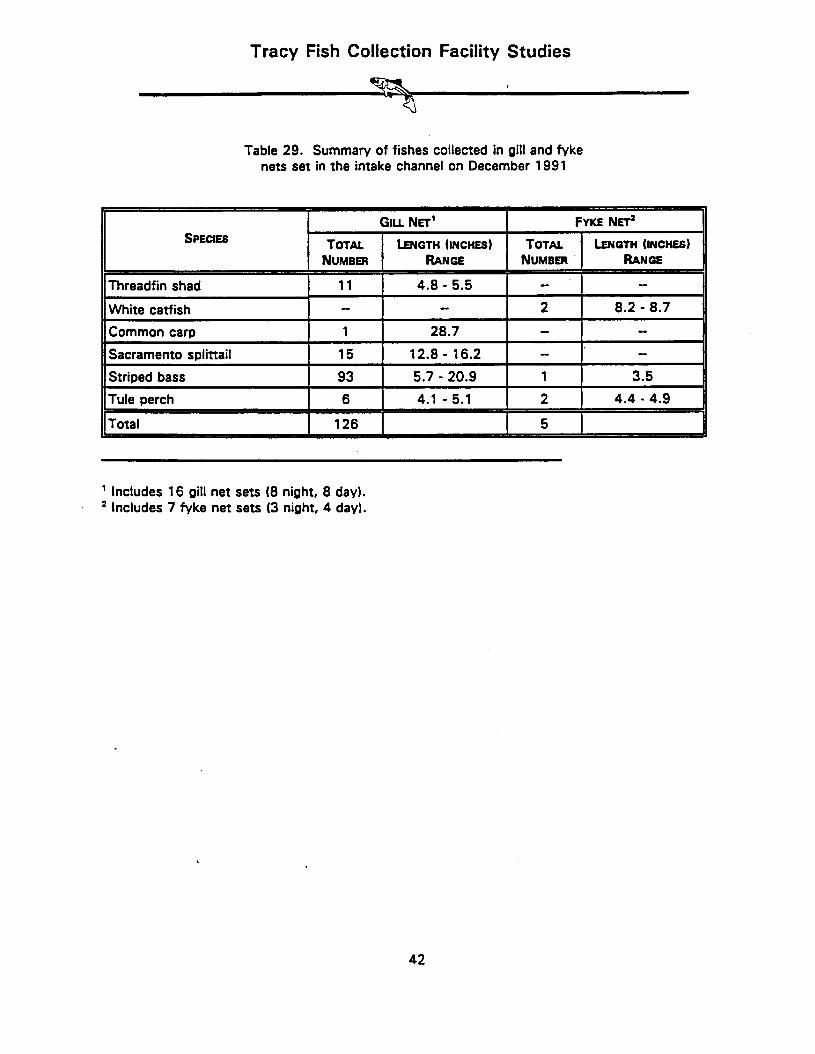
Table 29. Summary of fishes collected in gill and fVke nets set in the intake channel on December 1991
Threadfin shad 11 4.8 - 5.5
White catfish 2 a.2 - 0.7
Common carp 1 28.7
Sacramento splittail 15 12.8 - 16.2
Striped bass 93 5.7 - 20.9 1 3.5
Tule perch 6 4.1 - 5.1 2 4.4 - 4.9
Total I 126 1 5 I
’ Includes 16 gill net sets (8 night, 8 day). ’ Includes 7 fyke net sets (3 night, 4 day).
42
Tracy Fish Collection Facility Studies
Table 30. Summary of fishes collected in gill and fyke nets set in the intake channel during 1992
GILL NET’ FYKE Nrr’ SPECIES
TOTAL LENGTH (INCHES) TOTAL kNGTH (INCHES) NUMBER RANGE NUMBER
’ Includes 44 gill net sets (24 night, 20 day). 2 Includes 23 fyke net sets (13 night, 10 day).
43
Tracy Fish Collection Facility Studies
Table 31. Summary of fishes collected in gill and fyke nets set in the intake channel on June 2-3, 1992
SPECIES
GILL NET’ FYKE NE?
TOTAL 1 LENGTH (INCHES) TOTAL 1 LENG~ (INCHW
I 1 NUMBER 1 RANGE 1 NUMBER 1 RANGE
~ White catfish 26 4.5 - 9.5 105 7.1 - 15.9 P i Channel catfish 7 5.0 - 3.7 2 6.9 - 7.5
i Common carp ! 1 ! 30.7 ! ! Sacramento splittail 6 8.4 16.2 -
/ ~ Striped bass 83. 6.3 - 18.9
i Black crappie 1 5.2
~ White crappie 5 4.8 - 6.1 1 7.0
1 Largemouth bass 1 12.6
Tule aerch 16 5.6 - 7.3
FL&al 146 1 108 1
’ Includes 16 gill net sets (8 night, 8 day). 2 Includes 9 fyke net sets (5 night, 4 day).
44
Tracy Fish Collection Facility Studies
Table 32. Summary of fishes collected in Qill and fyke nets set in the intake channel on September 29-30, 1992
SPECIES
GILL Nn’ FYKE NE?
TOTAL LENGTH (INCHES) TOTAL tBJGTH (INCHES) NUMBER RANGE NUMBER RANGE
American shad 1 6.3
Threadfin shad 43 4.4 - 7.0 1 5.1
1 White catfish 12 6.2 - 9.2 a7 6.7 - 13.0
Channel catfish 1 9.4 39 8.1 - 10.9
Sacramento splittail 6 9.0 - 15.0
Striped bass 74 5.4 - 20.4
Black crappie 1 7.5 1--- ~ -1 3 7.5 - 9.1
8luegill 1 7.8
LargemOuth bass 14 4.0 - 12.9
Tule perch 44 3.8 - 7.8 3 4.6 - 5.1
’ includes 12 gill net sets (8 night, 4 day). ’ Includes 6 fyke net sets (4 night, 2 day).
45
Tracy Fish Collection Facility Studies
Table 33. Summary of fishes collected in gill and fVke nets set in the intake channel on December 8-9, 1992
SPECIES GILL NET’ FYKE NET’
TOTAL LENGTH MUCHES) TOTAL LENGTH (INCHES) NUMBER RANGE NUMBER RANGE
I American shad 1 6.1
Threadfin shad 6 5.0 - 5.6
White catfish
Common carp
Sacramento split-tail
~ Striped bass
Tule perch
Yellowfin oobv
3 6.4 - 9.0
1 12.4
5‘ 11.0 - 17.1
112 4.0 - 13.8
22 3.8 - 6.9 10 4.5 - 5.4
1 7.9
11 Total I 151 I I 10 I
’ Includes 16 gill net sets (8 night, 8 day]. ’ Includes 8 fvke net sets (4 night, 4 day).
46
Tracy Fish Collection Facility Studies
Table 34. Summary of fishes collected by electroshocking in the intake channel on September 17-l 9, 1991
SPEClES
DAY’ NIGH?
TOTAL LENGTH (INCW) TOTAL ~WTH (INCHES)
NUMBER RANGE NUMBER RANGE
’ Total effort was 0.46 hour. 2 Total effort was 0.48 hour. ’ Includes 39 fish not measured. ’ Includes 179 fish not measured. ’ includes 204 fish not measured. 6 Includes 7 fish not measured. ’ May include chameleon and/or yellowfin goby. * Includes 60 fish not measured. @ May include prickly and/or riffle sculpin.
47
Tracy Fish Collection Facility Studies
Table 35. Summary of fishes collected by electroshocking in the intake channel on December 3-4, 1991
SPECIES DAY’ NIGH?
TOTAL LENGTH (INCHES) TOTAL LENGTH (IN~MS) NUMBER RANGE NUMBER RANGE
11 Threadfin shad 2.4 - 3.5 -
II Common carp ! ! ! 2 1 29.7 - 30.3 II Goldfish 2 9.3 - 10.0
Golden shiner 1 3.7
Striped bass 3 4.9 - 11.1
Redear 4 10.0 - 11.1
Bluegill 1 4.8
Largemouth bass 4 3.2 - 19.8 1 3.3
II Inland silverside 2 2.2 2.9 - 62 1.6 6.1 -
’ Total effort was 0.43 hour. ’ Total effort was 0.46 hour.
48
Sacramento - San Joaq’uin I Estuary
Figure 1. Map of the Sacramento - San Joaquin Delta showing the location of the Tracy Fish Collection Facility
liiacy Fish Collection Facilities
LOADING AREA \
HOLDING TANKS
- ‘-iOLDlNG TANKS
‘Z S-TON MONORAIL HOIST
UNWATERING PUMP HOLDING TANK EFFLUENT
,- SCREENED WATER PUMP HOLDING TANK DRAINS
SCREENED WATER SVPP
FISH BYPASS PIPES.
-e------ INTAKE CHANNEL -.- ~~~ *
n-TON CABLEWAY
Y TRASH RACK
PUMPING PLANT
METER STRUCTURE
DRAIN
- PUMP DISCHARGE CONDWI I
Figure 2. Schematic of the Tracy Fish Collection Facility, Tracy, California ’