73
NAVIGATING THE NEW NORMAL David A. Rosenberg October 2012 TM
| Date post: | 18-Apr-2015 |
| Category: |
Documents |
| Upload: | annawitkowski88 |
| View: | 38,150 times |
| Download: | 4 times |

NAVIGATING THE NEW NORMAL
David A. Rosenberg
October 2012
TM

WHAT, ME WORRY?
1

Note:
Source: The Atlantic, April 2012 2
Yes, I am
more worried
than I look!

LET’S PLAY “RISK”
The staff also reported on potential risks to financial stability, including those owing to the developments in Europe and to the current environment of low interest rates.
The staff viewed the uncertainty around the forecast for economic activity as elevated and the risks skewed to the downside, largely reflecting concerns about the situation in Europe and the possibility of a more severe tightening in U.S. fiscal policy than anticipated.
In addition, participants still saw significant downside risks to the outlook for economic growth. Prominent among these risks were a possible intensification of strains in the euro zone, with potential spillovers to U.S. financial markets and institutions and thus to the broader U.S. economy; a larger-than-expected U.S. fiscal tightening; and the possibility of a further slowdown in global economic growth.
However, participants also observed that significant risks related to the euro-area banking and fiscal crisis remained, and that a number of important issues would have to be resolved in order to achieve further progress toward a comprehensive solution to the crisis.
Moreover, while the sovereign and banking crisis in Europe had eased some recently, members still saw strains in global financial conditions as posing significant downside risks to the economic outlook. The possibility of a larger-than-expected fiscal tightening in the United States and slower global growth were also seen as downside risks.
The Minutes from the September 12 - 13, 2012 Federal Open Market Committee Meeting, released on October 4, 2012
3
4

U.S. GOVERNMENT SPENDING $1.50 FOR EVERY $1.00 IN REVENUE
United States: Net Outlays/Net Receipts
Note:
Shaded bar and represents the OMB estimate
Source: Office of Management and Budget, U.S. Treasury
(ratio)
5
0.80
0.90
1.00
1.10
1.20
1.30
1.40
1.50
1.60
1.70
1.80
55 58 61 64 67 70 73 76 79 82 85 88 91 94 97 00 03 06 09 12
Deficit
Surplus
Unheard of
outside of WWII

CENTRAL BANKS RADICALLY EXPANDED THEIR BALANCE SHEETS
Note:
Source: Haver Analytics
U.S., U.K., ECB, and Japan Central Bank Assets as Percent of Combined GDP
6
(percent)
10.0%
12.0%
14.0%
16.0%
18.0%
20.0%
22.0%
24.0%
26.0%
2006 2007 2008 2009 2010 2011 2012
Unprecedented!

CALL IT THE WILE E. COYOTE ECONOMY
7

3.7%
3.3% 3.3%
4.5%
1.7% 1.7%
3.0%
1.4%
0%
1%
1%
2%
2%
3%
3%
4%
4%
5%
5%
61 Q1 70 Q4 75 Q1 82 Q4 91 Q1 01 Q4 Avg. Current
Last Quarter of Recession
5.0%
8.2%
9.2%
7.6%
3.8%4.0%
6.3%
3.1%
0%
1%
2%
3%
4%
5%
6%
7%
8%
9%
10%
61 Q1 70 Q4 75 Q1 82 Q4 91 Q1 01 Q4 Avg. Current
Last Quarter of Recession
A SUB-PAR U.S. ECONOMIC RECOVERY
Note:
Source: Bureau of Economic Analysis, Bureau of Labour Statistics
United States: 12 Quarters After A Recession Ends
Real GDP per capita (annualized percent change)
Nominal GDP per capita (annualized percent change)
8
9
-4.0
0.0
4.0
8.0
12.0
16.0
20.0
58 63 68 73 78 83 88 93 98 03 08
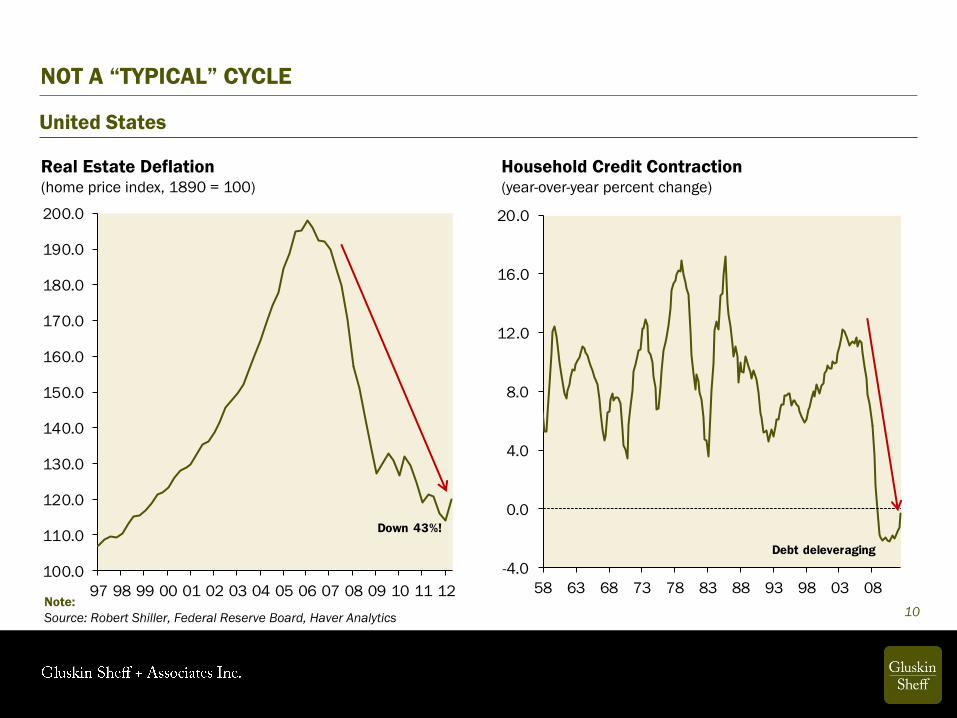
Debt deleveraging
100.0
110.0
120.0
130.0
140.0
150.0
160.0
170.0
180.0
190.0
200.0
97 98 99 00 01 02 03 04 05 06 07 08 09 10 11 12
Down 43%!
Real Estate Deflation (home price index, 1890 = 100)
NOT A “TYPICAL” CYCLE
Note:
Source: Robert Shiller, Federal Reserve Board, Haver Analytics
United States
Household Credit Contraction (year-over-year percent change)
10
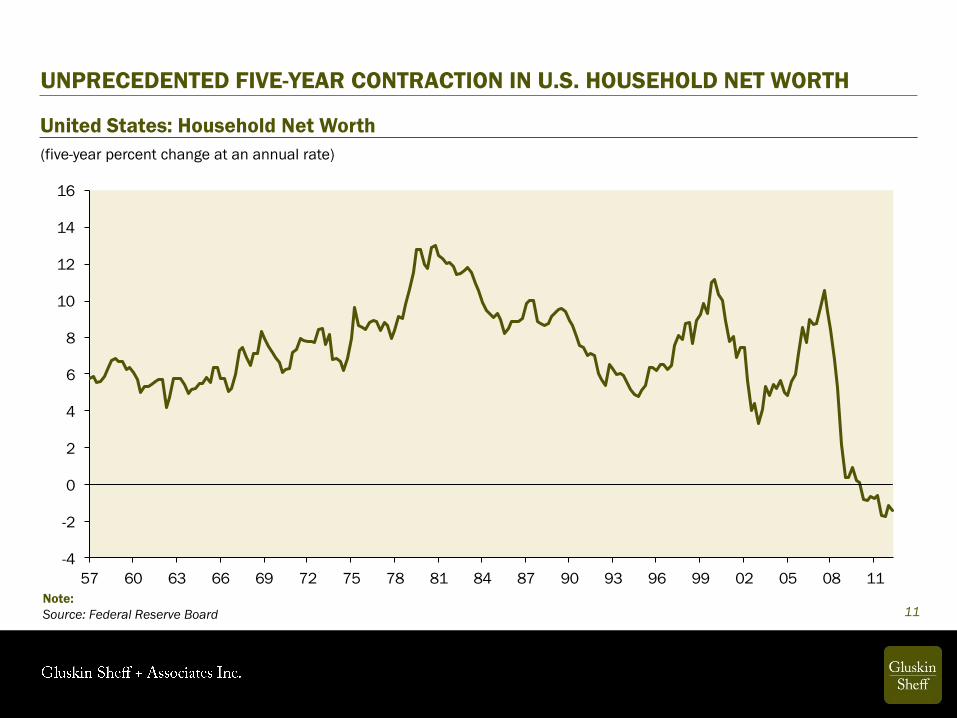
-4
-2
0
2
4
6
8
10
12
14
16
57 60 63 66 69 72 75 78 81 84 87 90 93 96 99 02 05 08 11
(five-year percent change at an annual rate)
UNPRECEDENTED FIVE-YEAR CONTRACTION IN U.S. HOUSEHOLD NET WORTH
Note:
Source: Federal Reserve Board
United States: Household Net Worth
11

11
12
13
14
15
16
17
18
19
20
21
22
23
'72 '77 '82 '87 '92 '97 '02 '07 '12
60
70
80
90
100
110
120
130
140
'72 '77 '82 '87 '92 '97 '02 '07 '12
STILL MORE TO GO BEFORE THE HOUSEHOLD BALANCE SHEET IS REPAIRED
Note:
Source: Federal Reserve Board
United States
Household Debt-to-Income Ratio Household Debt-to-Asset Ratio
Pre-bubble average Pre-bubble average
(percent)
12

Findings from McKinsey & Company:
“While we cannot say for certain whether
these sectors will deleverage, we do know
that nearly every significant financial crisis in
the post-World War II period was followed by
a lengthy and painful period of
deleveraging. These episodes lasted on
average six to seven years, with total debt
as a percentage of GDP declining by
roughly 25 percent. GDP contracted in the
initial years of deleveraging but rebounded
in the later years. If history is a guide,
therefore, we would expect a significant
period of deleveraging to come, which will
dampen GDP growth.”
MCKINSEY ON FINANCE: PERSPECTIVE ON CORPORATE FINANCE & STRATEGY
13

LIFE AFTER THE CREDIT COLLAPSE -- FAT TAIL RISK
14
Distribution of Outcomes before the Credit Collapse
Distribution of Outcomes after the Credit Collapse
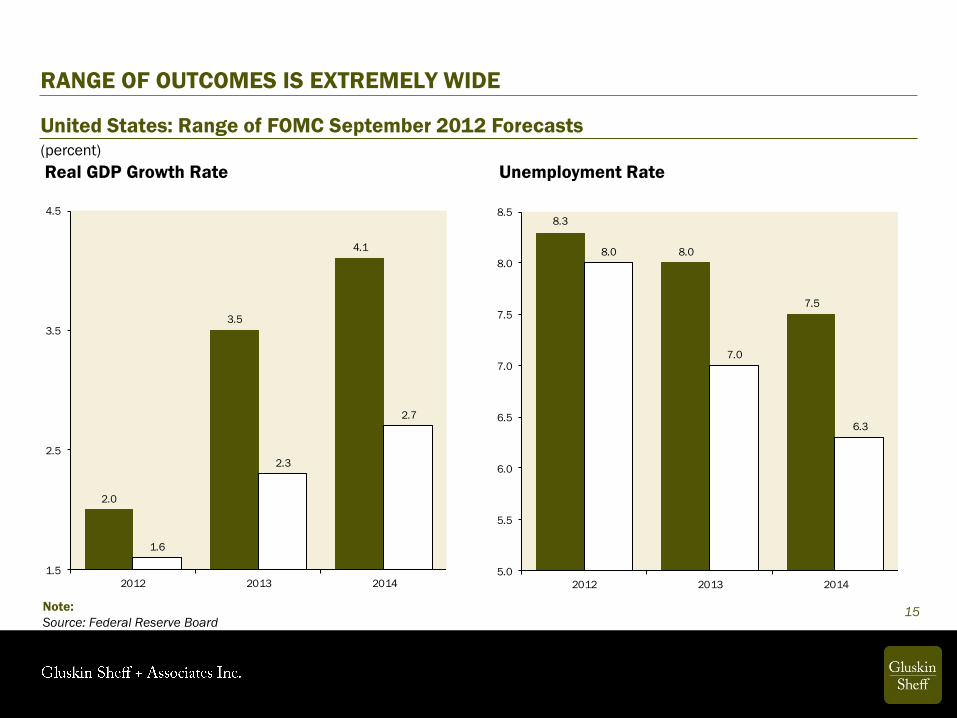
RANGE OF OUTCOMES IS EXTREMELY WIDE
Note:
Source: Federal Reserve Board
United States: Range of FOMC September 2012 Forecasts
Real GDP Growth Rate Unemployment Rate
15
2.0
3.5
4.1
1.6
2.3
2.7
1.5
2.5
3.5
4.5
2012 2013 2014
8.3
8.0
7.5
8.0
7.0
6.3
5.0
5.5
6.0
6.5
7.0
7.5
8.0
8.5
2012 2013 2014
(percent)

WHAT HAVE WE LEARNED IN 2,604 YEARS?
“The budget should be balanced, the Treasury should be
refilled, public debt should be reduced, the arrogance of
officialdom should be tempered and controlled, and the
assistance to foreign lands should be curtailed lest
Rome become bankrupt. People must again learn
to work, instead of living on public assistance.”
Cicero - 55 BC
16

64
69 7072
74 74 7473
70 7072
7375
7675
73
80
91
98
102
106
55
65
75
85
95
105
115
'92 '93 '94 '95 '96 '97 '98 '99 '00 '01 '02 '03 '04 '05 '06 '07 '08 '09 '10 '11 '12
THE WORLD IS AWASH IN DEBT
Notes:
Shaded bars represent OECD estimates
Source: OECD
OECD: Gross General Government Debt-to-GDP Ratio
(percent of nominal GDP)
17
18
0%
10%
20%
30%
40%
50%
60%
'94 '95 '96 '97 '98 '99 '00 '01 '02 '03 '04 '05 '06 '07 '08 '09 '10 '11 '12
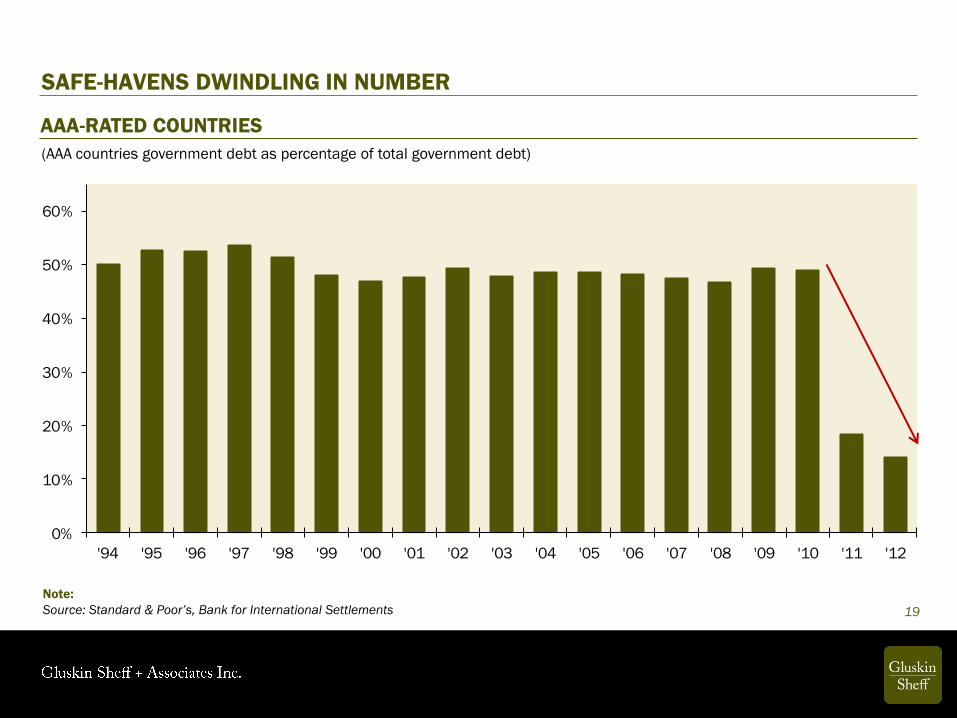
SAFE-HAVENS DWINDLING IN NUMBER
Note:
Source: Standard & Poor’s, Bank for International Settlements 19
AAA-RATED COUNTRIES
(AAA countries government debt as percentage of total government debt)

0
100
200
300
400
500
600
700
800
TOO MUCH DEBT AT ALL LEVELS
Note:
Source: Haver Analytics
* Q1 data are not available, using the last available data
Domestic Debt Outstanding as a % of adjusted GDP (Q1 2012)
20
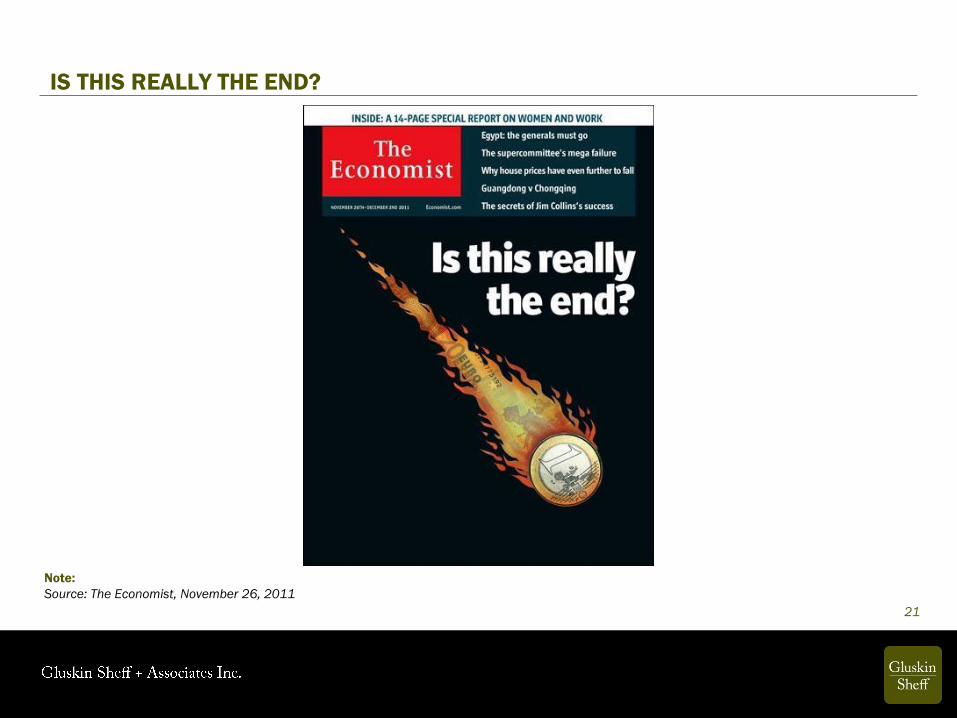
IS THIS REALLY THE END?
21
Note:
Source: The Economist, November 26, 2011

INTEREST RATES DIVERGE IN THE EUROZONE TO THE PRE-EMU LEVELS
Notes:
Source: Bloomberg
10-Year Government Bond Yield
(percent)
22
19.2
8.7
5.85.0 4.9
2.4 2.21.7 1.3
0
5
10
15
20
25
Greece Portugal Spain Ireland Italy Belgium France Netherlands Germany
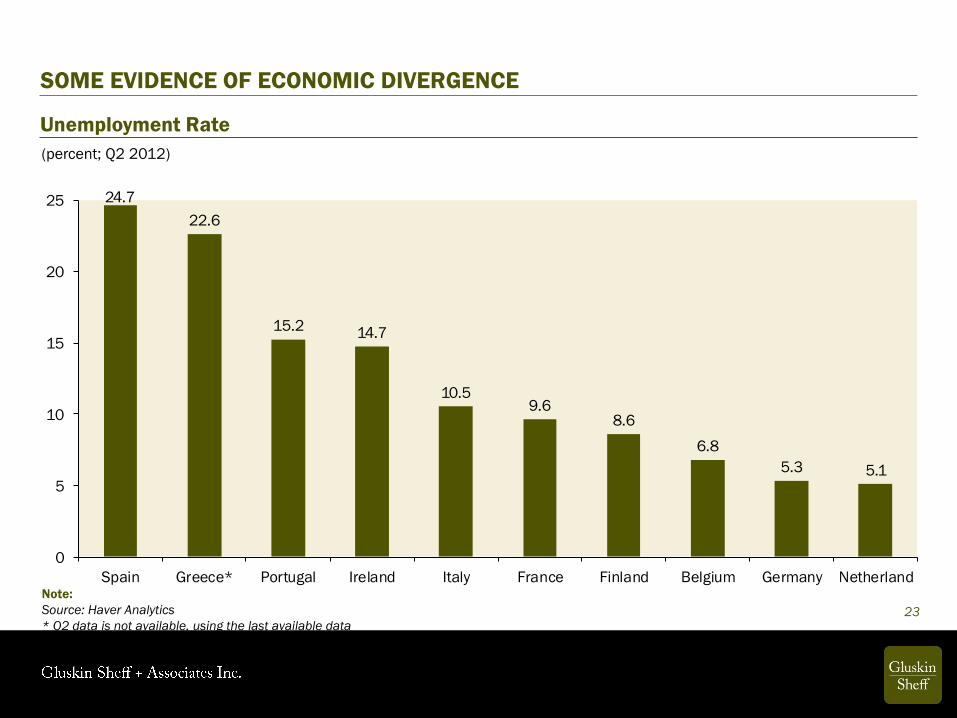
24.7
22.6
15.214.7
10.59.6
8.6
6.8
5.3 5.1
0
5
10
15
20
25
Spain Greece* Portugal Ireland Italy France Finland Belgium Germany NetherlandNote:
Source: Haver Analytics
* Q2 data is not available, using the last available data
Unemployment Rate
(percent; Q2 2012)
SOME EVIDENCE OF ECONOMIC DIVERGENCE
23

1.0
0.3 0.2
-0.3-0.6
-1.3
-2.6-3.2
-6.3-7
-6
-5
-4
-3
-2
-1
0
1
2
3
Germany France Finland Belgium Netherland Spain Italy Portugal Greece
MORE EVIDENCE OF ECONOMIC DIVERGENCE
Year-over-Year GDP Growth Rate
Notes:
Source: Haver Analytics, Gluskin Sheff
(percent; Q2 2012)
24
-2.5
-2.0
-1.5
-1.0
-0.5
0.0
0.5
1.0
1.5
2.0
'07 '08 '09 '10 '11 '12
-6
-5
-4
-3
-2
-1
0
1
2
3
4
'07 '08 '09 '10 '11 '12
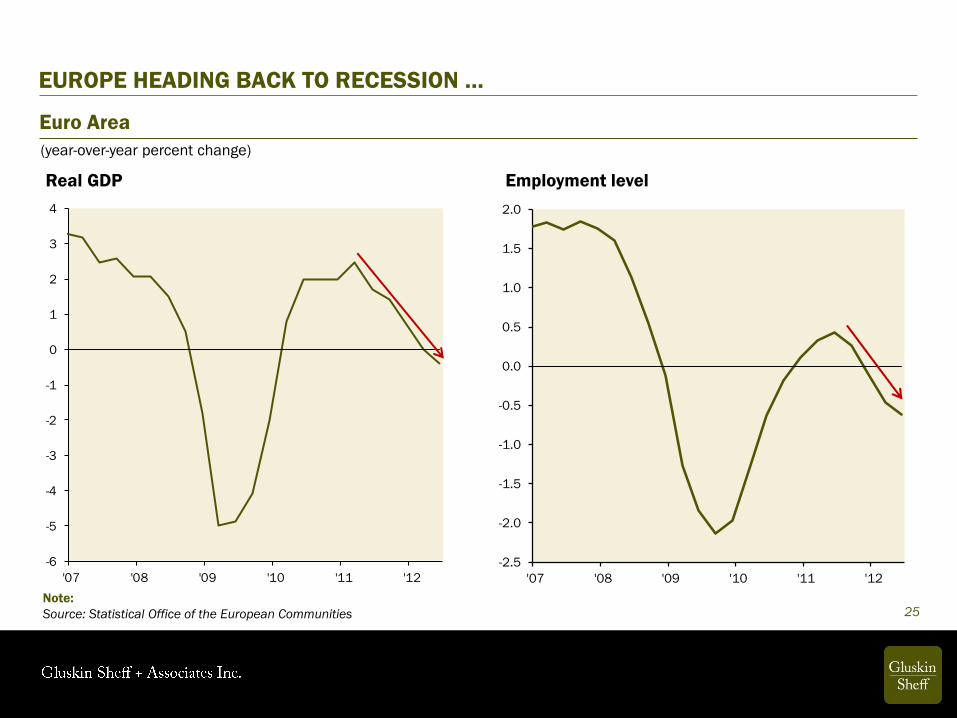
EUROPE HEADING BACK TO RECESSION …
Note:
Source: Statistical Office of the European Communities
Euro Area
25
Real GDP Employment level
(year-over-year percent change)

… AND LIKELY TO REMAIN THAT WAY FOR SOME TIME
Note:
Source: OECD, Haver Analytics
Euro Area: Leading Indicator
(year-over-year percent change)
26
-6
-4
-2
0
2
4
6
'00 '01 '02 '03 '04 '05 '06 '07 '08 '09 '10 '11 '12
-6.0
-4.0
-2.0
0.0
2.0
4.0
6.0
'03 '04 '05 '06 '07 '08 '09 '10 '11 '12
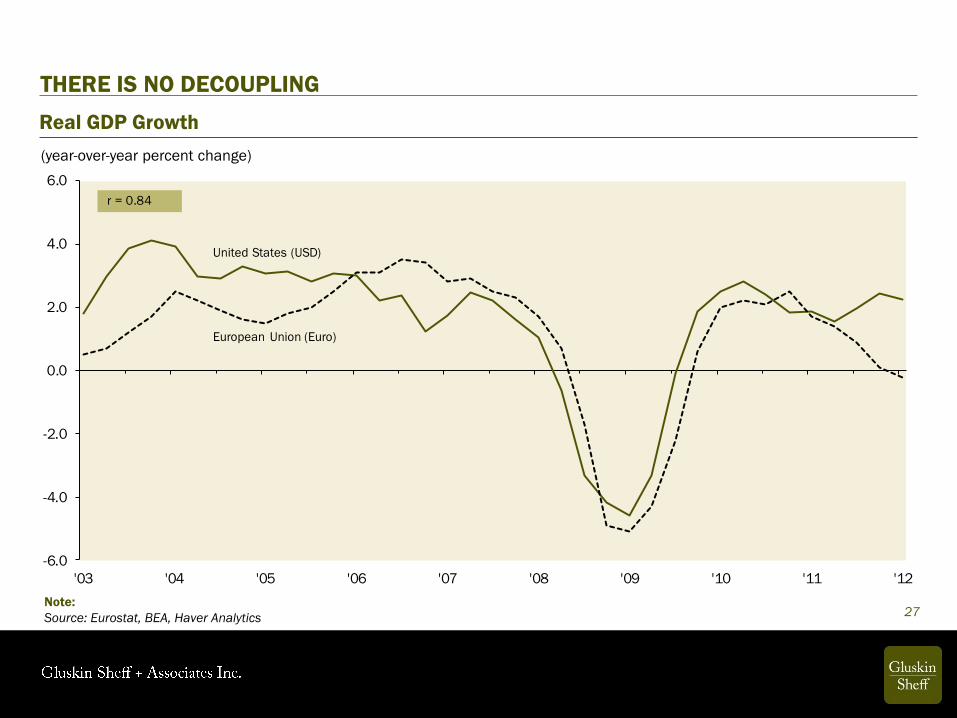
r = 0.84
United States (USD)
European Union (Euro)
THERE IS NO DECOUPLING
Note:
Source: Eurostat, BEA, Haver Analytics
Real GDP Growth
27
(year-over-year percent change)

-40
-30
-20
-10
0
10
20
30
40
50
'07 '08 '09 '10 '11 '12
-40
-30
-20
-10
0
10
20
30
40
50
60
'07 '08 '09 '10 '11 '12
EUROPEAN RECESSION ALREADY CAUSING ASIAN EXPORTS TO DECLINE
Note:
Source: China Customs, Korea Custom Services, Haver Analytics
Exports
Korea China
28
(year-over-year percent change)
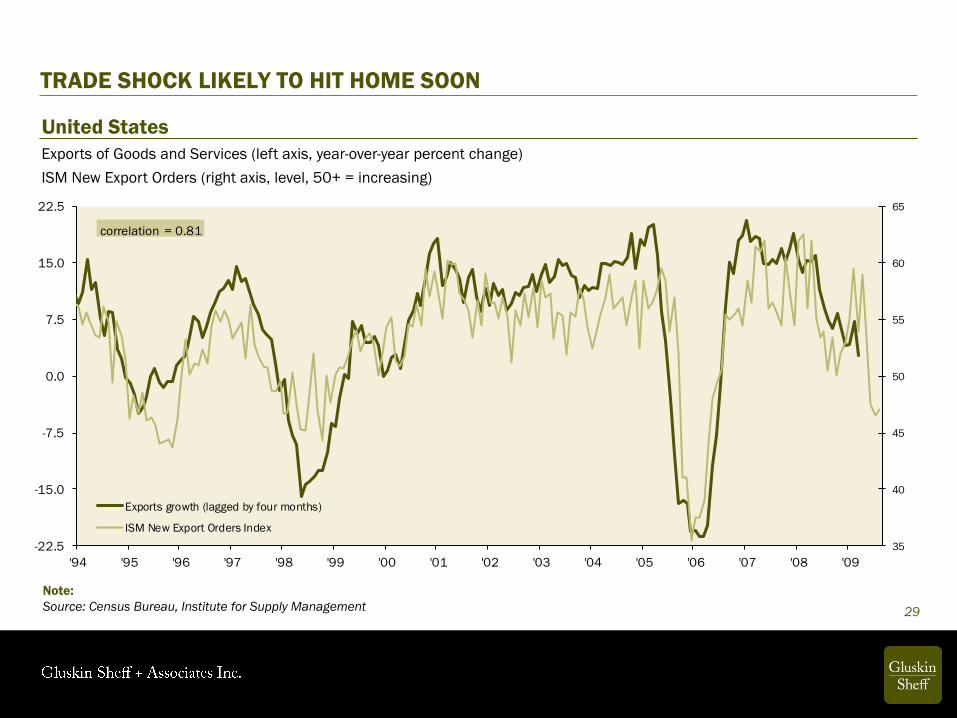
TRADE SHOCK LIKELY TO HIT HOME SOON
Exports of Goods and Services (left axis, year-over-year percent change)
United States
Note:
Source: Census Bureau, Institute for Supply Management
ISM New Export Orders (right axis, level, 50+ = increasing)
29
35
40
45
50
55
60
65
-22.5
-15.0
-7.5
0.0
7.5
15.0
22.5
'94 '95 '96 '97 '98 '99 '00 '01 '02 '03 '04 '05 '06 '07 '08 '09
Exports growth (lagged by four months)
ISM New Export Orders Index
correlation = 0.81
30
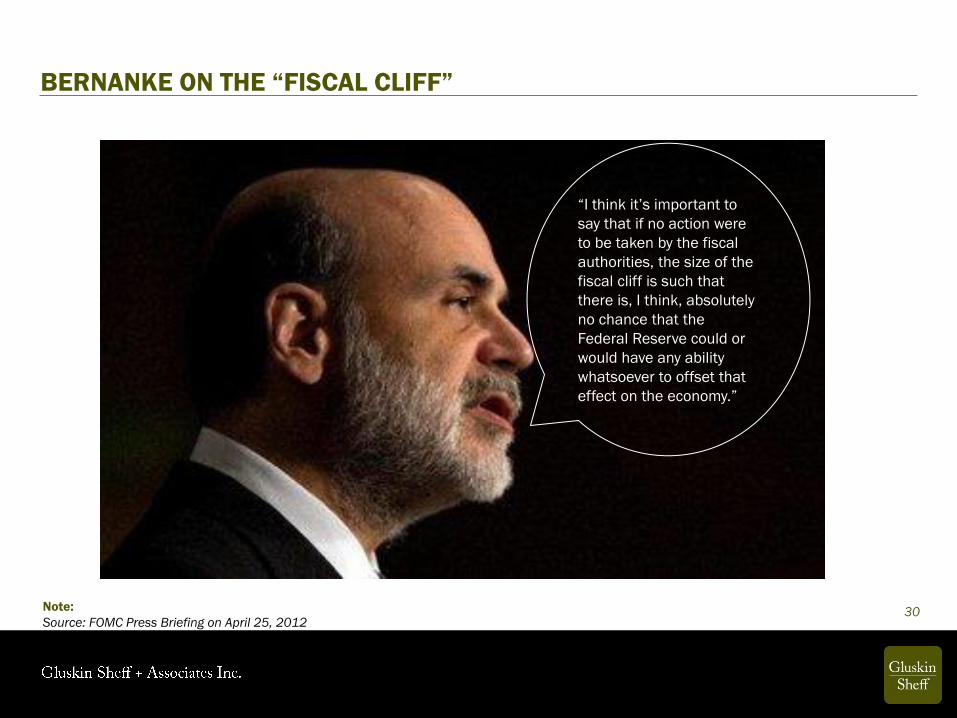
“I think it’s important to
say that if no action were
to be taken by the fiscal
authorities, the size of the
fiscal cliff is such that
there is, I think, absolutely
no chance that the
Federal Reserve could or
would have any ability
whatsoever to offset that
effect on the economy.”
BERNANKE ON THE “FISCAL CLIFF”
Note:
Source: FOMC Press Briefing on April 25, 2012

-7%
-5%
-3%
-1%
2%
4%
57 59 61 63 65 67 69 71 73 75 77 79 81 83 85 87 89 91 93 95 97 99 01 03 05 07 09 11 13
Record Drag!Net Fiscal
Drag
Net Fiscal
Stimulus
THE FISCAL CLIFF
Notes:
2013 is based on CBO estimates of the fiscal balance
Source: CBO, Haver Analytics
Change in Primary Fiscal Balance to GDP Ratio
31
(percentage points)
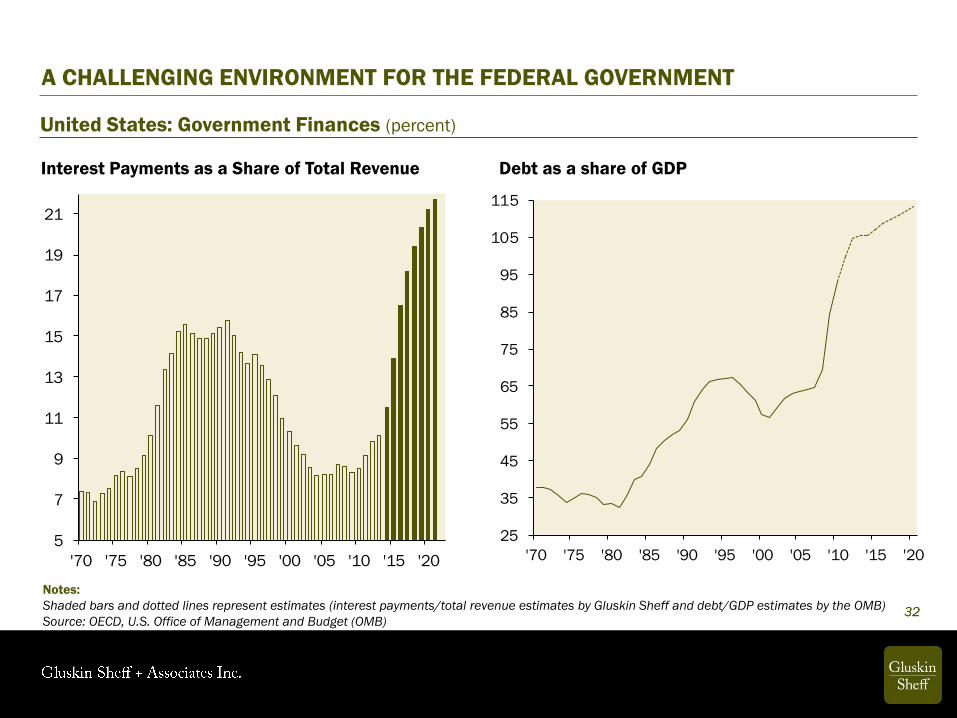
5
7
9
11
13
15
17
19
21
'70 '75 '80 '85 '90 '95 '00 '05 '10 '15 '20
25
35
45
55
65
75
85
95
105
115
'70 '75 '80 '85 '90 '95 '00 '05 '10 '15 '20
A CHALLENGING ENVIRONMENT FOR THE FEDERAL GOVERNMENT
Notes:
Shaded bars and dotted lines represent estimates (interest payments/total revenue estimates by Gluskin Sheff and debt/GDP estimates by the OMB)
Source: OECD, U.S. Office of Management and Budget (OMB)
United States: Government Finances (percent)
Interest Payments as a Share of Total Revenue Debt as a share of GDP
32 32
-6
-4
-2
0
2
4
6
8
10
'06 '07 '08 '09 '10 '11 '12
-40
-30
-20
-10
0
10
20
30
'93 '95 '97 '99 '01 '03 '05 '07 '09 '11
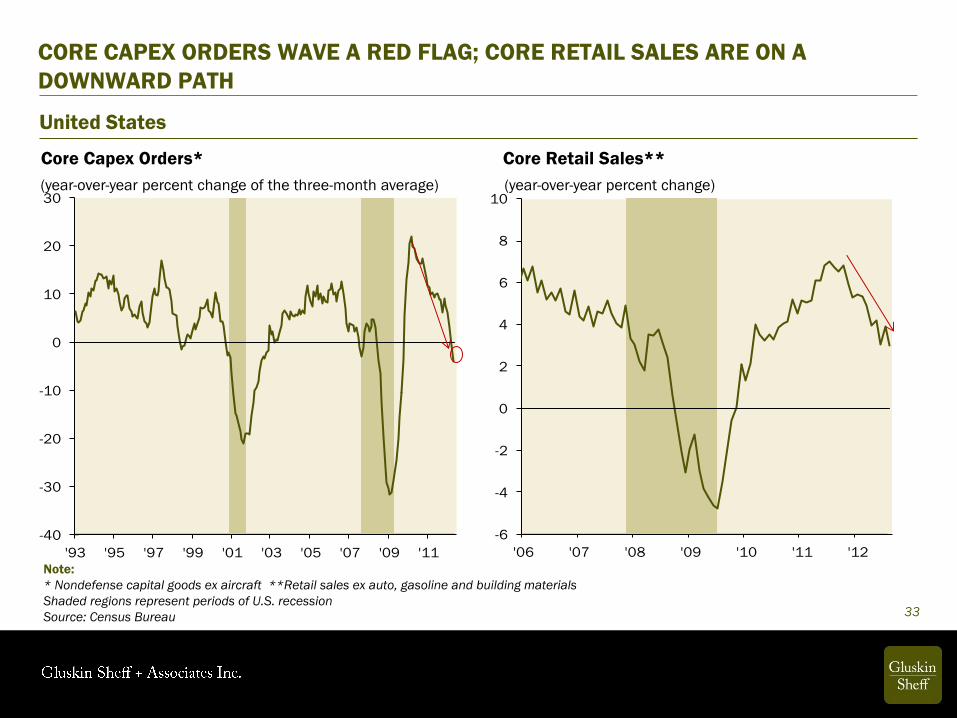
CORE CAPEX ORDERS WAVE A RED FLAG; CORE RETAIL SALES ARE ON A
DOWNWARD PATH
Note:
* Nondefense capital goods ex aircraft **Retail sales ex auto, gasoline and building materials
Shaded regions represent periods of U.S. recession
Source: Census Bureau
United States
Core Capex Orders*
33
(year-over-year percent change of the three-month average)
Core Retail Sales**
(year-over-year percent change)

Note:
Source: Time Magazine (June 13, 2005) 34

400
800
1,200
1,600
2,000
2,400
2,800
'59 '69 '79 '89 '99 '09
500
550
600
650
700
750
800
Jan/10 Jul/10 Jan/11 Jul/11 Jan/12 Jul/12
Short-term View
HOUSING RECOVERY IN PERSPECTIVE
Note:
Source: Census Bureau, Haver Analytics
United States: Housing Starts
Long-term View
35
(thousands)

260
280
300
320
340
360
380
Aug/10 Feb/11 Aug/11 Feb/12
200
400
600
800
1,000
1,200
1,400
'62 '72 '82 '92 '02 '12
Short-term View
DITTO …
Note:
Source: Census Bureau, Haver Analytics
United States: New Home Sales
Long-term View
36
(thousands)

2
3
4
5
6
7
8
'47 '52 '57 '62 '67 '72 '77 '82 '87 '92 '97 '02 '07 '12
HOUSING DOWN TO A 2% SHARE OF GDP
Note:
Shaded regions represent periods of U.S. recession
Source: Bureau of Economic Analysis
United States: Housing Share of GDP
(year-over-year percent change)
37

4.2
3.93.9
3.3
3.02.9
2.5
2.75
2.0
2.5
3.0
3.5
4.0
4.5
4.14.0
3.9
3.5
2.7
2.5
2.7
2.2
1.85
1.8
2.3
2.8
3.3
3.8
4.3
THE (SLIDING) EVOLUTION OF THE FED'S GDP FORECAST
Note:
Source: Bloomberg
United States: Federal Reserve GDP Forecast
2012 2013
38
(percent)
HELICOPTER BEN BERNANKE ….
39
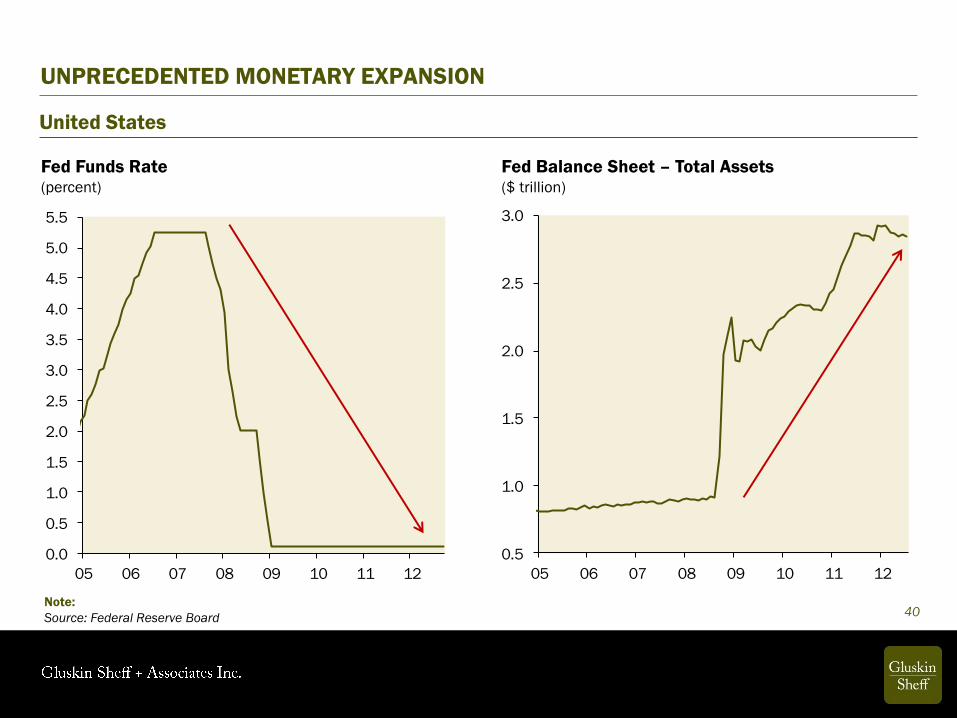
0.5
1.0
1.5
2.0
2.5
3.0
05 06 07 08 09 10 11 12
0.0
0.5
1.0
1.5
2.0
2.5
3.0
3.5
4.0
4.5
5.0
5.5
05 06 07 08 09 10 11 12
Fed Funds Rate (percent)
UNPRECEDENTED MONETARY EXPANSION
Note:
Source: Federal Reserve Board
United States
Fed Balance Sheet – Total Assets ($ trillion)
40

RATES ON HOLD FOR ANOTHER THREE YEARS
FOMC meeting – June 22, 2011
The Committee continues to anticipate that economic conditions--including low rates of resource utilization and a subdued outlook for inflation over the medium run -- are likely to warrant exceptionally low levels for the federal funds rate for an extended period.
FOMC meeting – August 9, 2011
The Committee currently anticipates that economic conditions--including low rates of resource utilization and a subdued outlook for inflation over the medium run -- are likely to warrant exceptionally low levels for the federal funds rate at least through mid-2013.
FOMC meeting – January 25, 2012
In particular, the Committee decided today to keep the target range for the federal funds rate at 0 to 1/4 percent and currently anticipates that economic conditions -- including low rates of resource utilization and a subdued outlook for inflation over the medium run--are likely to warrant exceptionally low levels for the federal funds rate at least through late 2014.
FOMC meeting – September 13, 2012
In particular, the Committee also decided today to keep the target range for the federal funds rate at 0 to 1/4 percent and currently anticipates that exceptionally low levels for the federal funds rate are likely to be warranted at least through mid-2015.
41
Note:
Source: Minutes from FOMC meetings

88%
75%
64% 64%
58%
40% 39%
25%
Fed Policy Core CPI
Inflation
CPI Inflation Core PPI
Inflation
PPI Inflation Budget Deficits CRB Index Oil Prices
WHAT CORRELATES WITH BOND YIELDS
Note:
Source: Haver Analytics
United States
(correlation: percent)
42
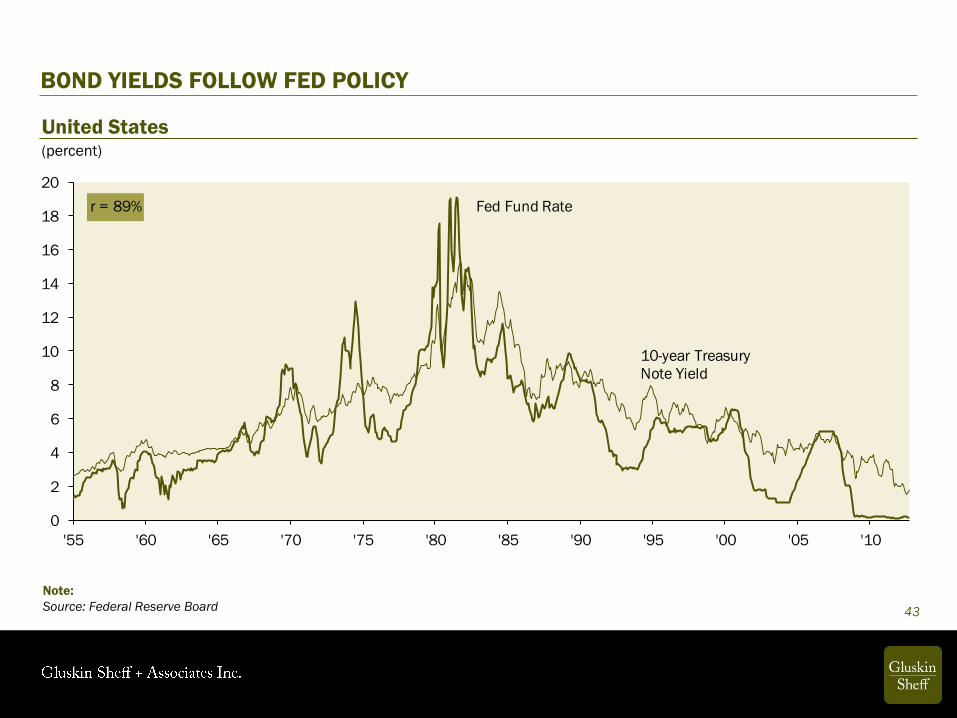
0
2
4
6
8
10
12
14
16
18
20
'55 '60 '65 '70 '75 '80 '85 '90 '95 '00 '05 '10
Fed Fund Rater = 89%
10-year Treasury
Note Yield
BOND YIELDS FOLLOW FED POLICY
United States
Note:
Source: Federal Reserve Board 43
(percent)

0.0
0.5
1.0
1.5
2.0
2.5
3.0
3.5
Fed Funds
Rate
2Y 5Y 10Y 20Y 30Y
+270bps
A Year Ago
?
Today
Historical Avg
A SUPER STEEP U.S. YIELD CURVE: HOW WILL IT FLATTEN?
Note:
Source: Federal Reserve Board
United States: Treasury Yield Curve
Average for Past 30 Years Today (October 2012)
44
(percent)
5.0
5.5
6.0
6.5
7.0
7.5
8.0
Fed Funds
Rate
2Y 5Y 10Y 20Y 30Y
+160bps

Note:
Source: Wall Street Journal, January 3, 2011 45

WHAT THE FED HAS DONE BEYOND INTEREST RATES ─ MULTIPLE QEs
QE1 (December 2008 to March 2010):
• $1.25 trillion of mortgage-backed securities
• $300 billion of long-term Treasuries
• $200 billion of Agency debt
QE2 (November 2010 to June 2011):
• $600 billion of longer-term Treasury securities
Operation Twist (September 2011 to present):
• The Fed bought over $500 billion of long-term Treasury securities and sold an equal amount of short-term Treasury securities
QE3 (September 2012 to ??):
• The Fed will purchase additional Agency mortgage-backed securities at a pace of $40 billion per month, until it is satisfied with the economy’s progress.
46 Note:
Source: Federal Reserve Board

HE SAID WHAT??
“We do think that these policies can bring interest rates down, not just treasury rates but a whole range of rates including mortgage rates and rates for corporate bonds and other types of important interest rates. It also affects stock prices. It affects other prices, home prices, for example.
So looking at all the different channels of effect, we think it does have an impact on the economy. It will have impact on the labor market but again, the way I would describe it is a meaningful effect, a significant effect, but not a panacea, not a solution for the whole issue.”
Ben Bernanke, at the Post-FOMC Meeting Press Conference, September 13, 2012.
47
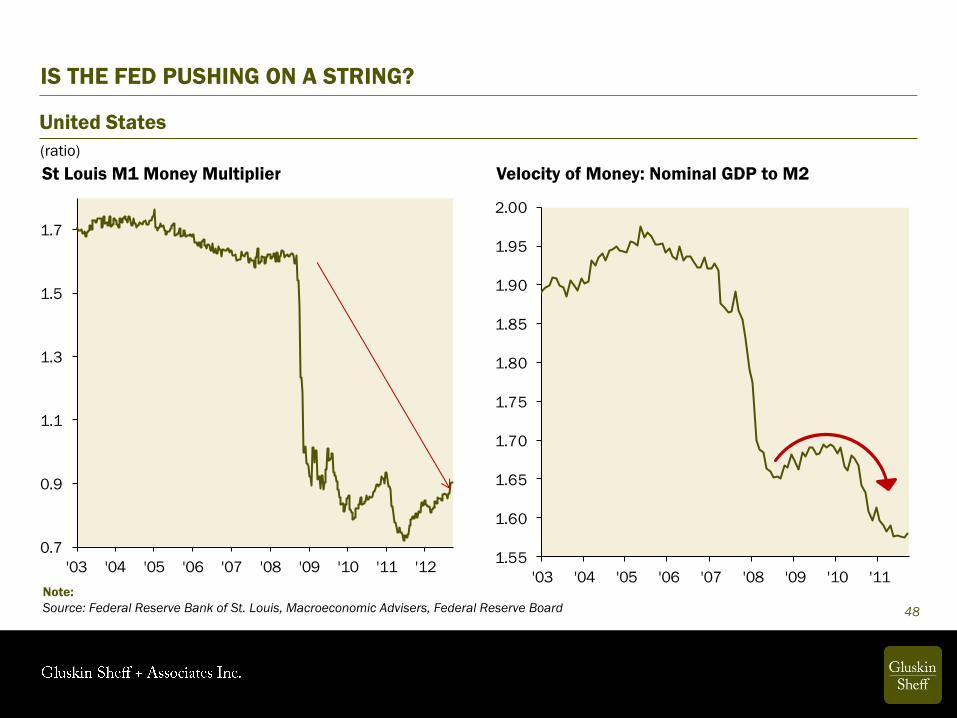
0.7
0.9
1.1
1.3
1.5
1.7
'03 '04 '05 '06 '07 '08 '09 '10 '11 '121.55
1.60
1.65
1.70
1.75
1.80
1.85
1.90
1.95
2.00
'03 '04 '05 '06 '07 '08 '09 '10 '11
IS THE FED PUSHING ON A STRING?
Note:
Source: Federal Reserve Bank of St. Louis, Macroeconomic Advisers, Federal Reserve Board
United States
Velocity of Money: Nominal GDP to M2
48
St Louis M1 Money Multiplier
(ratio)

250
500
750
1000
1250
1500
1750
'99 '00 '01 '02 '03 '04 '05 '06 '07 '08 '09 '10 '11
600
700
800
900
1000
1100
1200
1300
1400
1500
'00 '01 '02 '03 '04 '05 '06 '07 '08 '09 '10 '11 '12
FED LIQUIDITY BOTTLED UP ON BALANCE SHEETS
Note:
Source: Federal Reserve Board
United States
All Commercial Banks’ Cash Assets Nonfinancial Corps’ Cash and Cash Equivalents
49
($ billions)
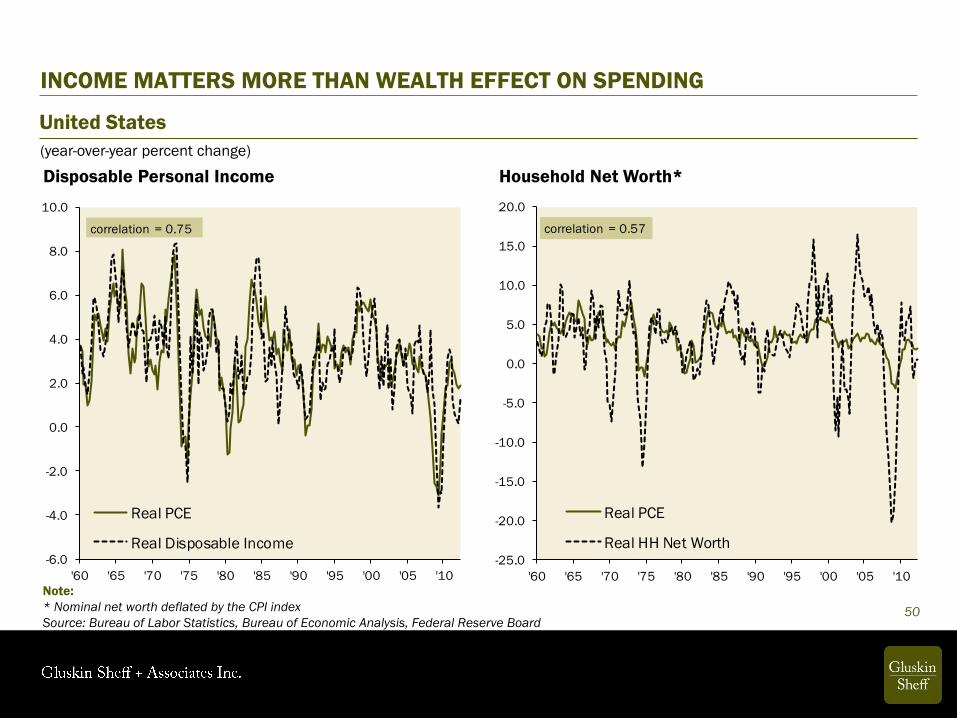
INCOME MATTERS MORE THAN WEALTH EFFECT ON SPENDING
Note:
* Nominal net worth deflated by the CPI index
Source: Bureau of Labor Statistics, Bureau of Economic Analysis, Federal Reserve Board
United States
Household Net Worth* Disposable Personal Income
50
(year-over-year percent change)
-25.0
-20.0
-15.0
-10.0
-5.0
0.0
5.0
10.0
15.0
20.0
'60 '65 '70 '75 '80 '85 '90 '95 '00 '05 '10
Real PCE
Real HH Net Worth
correlation = 0.57
-6.0
-4.0
-2.0
0.0
2.0
4.0
6.0
8.0
10.0
'60 '65 '70 '75 '80 '85 '90 '95 '00 '05 '10
Real PCE
Real Disposable Income
correlation = 0.75
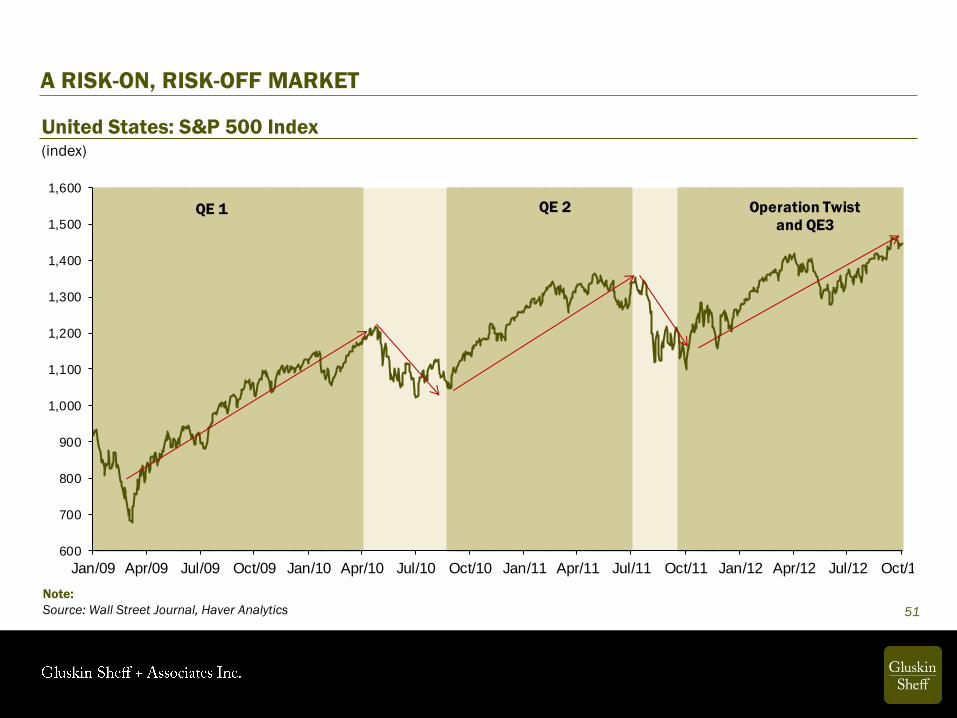
A RISK-ON, RISK-OFF MARKET
United States: S&P 500 Index
Note:
Source: Wall Street Journal, Haver Analytics 51
(index)
600
700
800
900
1,000
1,100
1,200
1,300
1,400
1,500
1,600
Jan/09 Apr/09 Jul/09 Oct/09 Jan/10 Apr/10 Jul/10 Oct/10 Jan/11 Apr/11 Jul/11 Oct/11 Jan/12 Apr/12 Jul/12 Oct/12
QE 1 QE 2 Operation Twist
and QE3
-7.6%
15.2%
-8.7%
5.5%
-8.9%
3.3%
-2.9%
3.0%
-4.7%
6.4%
-8.5%
10.3%
-7.0%
16.9%
-3.9%
14.0%
-6.4%
8.5%
-7.2%
6.9%
-18.8%
16.9%
-9.6%
22.1%
-9.9%
13.1%
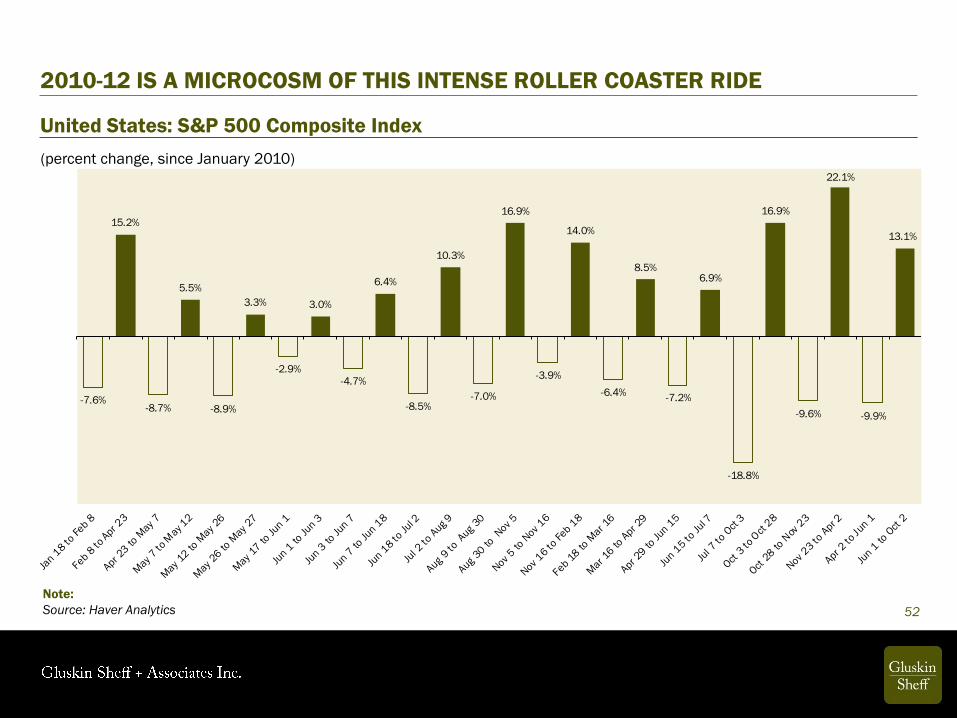
(percent change, since January 2010)
2010-12 IS A MICROCOSM OF THIS INTENSE ROLLER COASTER RIDE
Note:
Source: Haver Analytics
United States: S&P 500 Composite Index
52

BEARISH FUNDAMENTALS BUT BULLISH MARKETS
Note:
Source: Barron’s (September 3, 2012) 53

-30
-20
-10
0
10
20
30
40
50
60
70
-25
-20
-15
-10
-5
0
5
10
15
20
S&P 500 Sales Per Share
REVENUE AND PROFIT GROWTH ALMOST VANISHED
Note:
* Corporate profits after tax with inventory valuation adjustment and capital consumption adjustment
Source: Standard & Poor’s, Bureau of Economic Analysis, Gluskin Sheff
United States
Corporate Profits*
54
(year-over-year percent change)

0.0
0.5
1.0
1.5
2.0
2.5
3.0
Oct/08 Apr/09 Oct/09 Apr/10 Oct/10 Apr/11 Oct/11 Apr/12
QE1
announced
QE2
announced
OT
announced
QE3
announced
(percent)
THE FED’S INFLATION REACTION FUNCTION HAS CHANGED
Note:
Source: Bloomberg, Gluskin Sheff
United States: 10-Year TIPS Breakeven Rate
55

FED POLICY GEARED TOWARDS DOLLAR WEAKNESS AND HIGHER GOLD PRICE
Note:
Source: Bloomberg
United States
The DXY Dollar Index
56
(index)
Gold Price
($/troy oz)
78.5
79.5
80.5
81.5
82.5
83.5
84.5
Apr/12 May/12 Jun/12 Jul/12 Aug/12 Sep/12
1,540
1,580
1,620
1,660
1,700
1,740
1,780
Apr/12 May/12 Jun/12 Jul/12 Aug/12 Sep/12
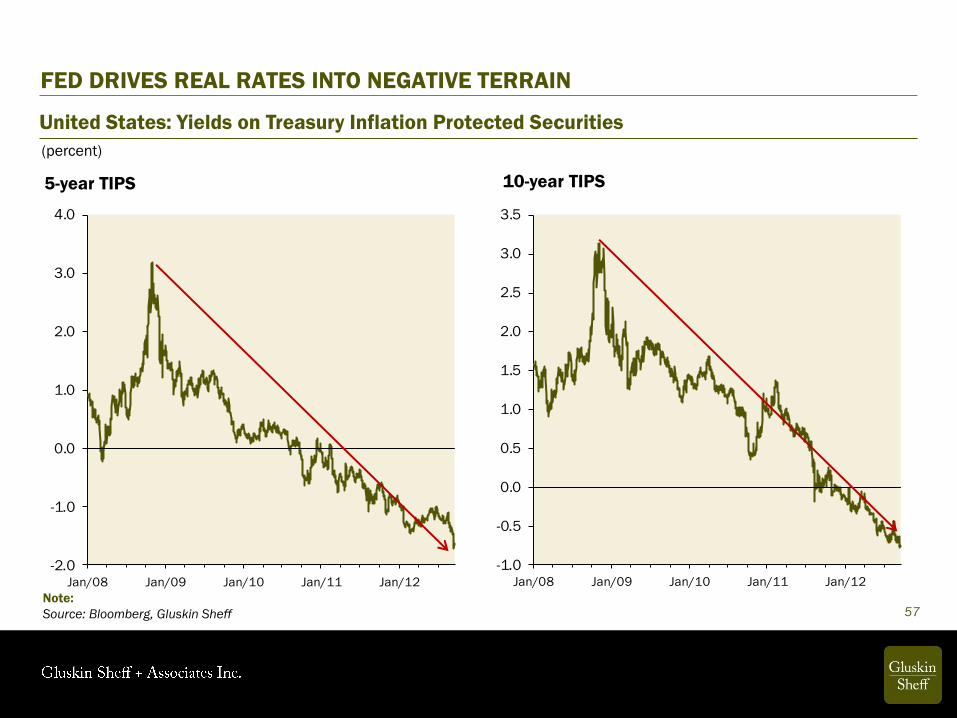
FED DRIVES REAL RATES INTO NEGATIVE TERRAIN
Note:
Source: Bloomberg, Gluskin Sheff
United States: Yields on Treasury Inflation Protected Securities
5-year TIPS
57
10-year TIPS
-2.0
-1.0
0.0
1.0
2.0
3.0
4.0
Jan/08 Jan/09 Jan/10 Jan/11 Jan/12
-1.0
-0.5
0.0
0.5
1.0
1.5
2.0
2.5
3.0
3.5
Jan/08 Jan/09 Jan/10 Jan/11 Jan/12
(percent)

ARGUABLY THE MOST COMPELLING ARGUMENT FOR EQUITIES
Note:
Source: Standard & Poor’s, Federal Reserve Board, Haver Analytics
United States: S&P 500 Dividend Yield and Five-year T-note Yield
Yield Levels
58
(percent)
Spread
(basis points)
0
1
2
3
4
5
6
Jan/02 Jan/04 Jan/06 Jan/08 Jan/10 Jan/12
Five-year T-note Yield
S&P 500 Dividend Yield
-1,200
-1,000
-800
-600
-400
-200
0
200
400
'53 '58 '63 '68 '73 '78 '83 '88 '93 '98 '03 '08
Widest since
1958!
S&P 500 Dividend Yield -
Five-year Treasury Yield
Spread
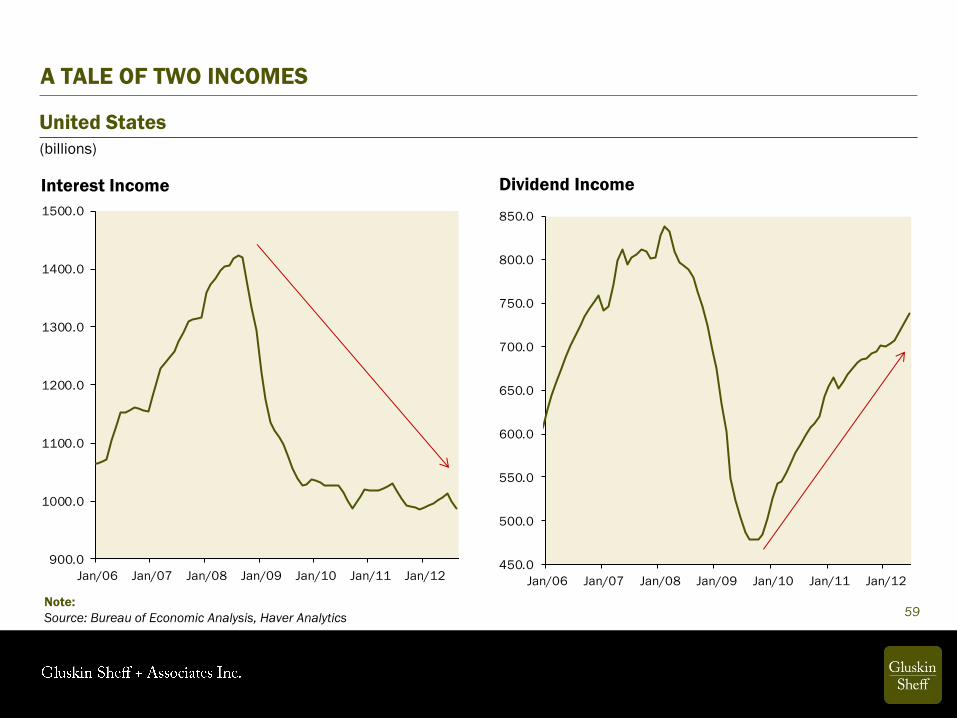
900.0
1000.0
1100.0
1200.0
1300.0
1400.0
1500.0
Jan/06 Jan/07 Jan/08 Jan/09 Jan/10 Jan/11 Jan/12
Interest Income
A TALE OF TWO INCOMES
Note:
Source: Bureau of Economic Analysis, Haver Analytics
United States
Dividend Income
59
(billions)
450.0
500.0
550.0
600.0
650.0
700.0
750.0
800.0
850.0
Jan/06 Jan/07 Jan/08 Jan/09 Jan/10 Jan/11 Jan/12
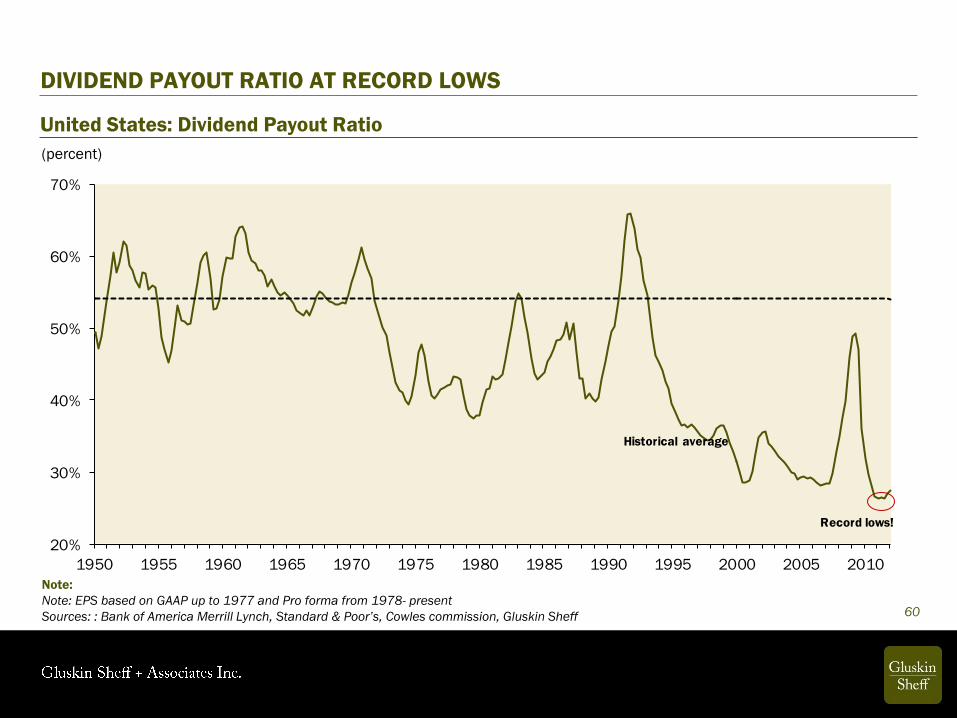
20%
30%
40%
50%
60%
70%
1950 1955 1960 1965 1970 1975 1980 1985 1990 1995 2000 2005 2010
Historical average
Record lows!
Note:
Note: EPS based on GAAP up to 1977 and Pro forma from 1978- present
Sources: : Bank of America Merrill Lynch, Standard & Poor’s, Cowles commission, Gluskin Sheff
United States: Dividend Payout Ratio
(percent)
DIVIDEND PAYOUT RATIO AT RECORD LOWS
60

0
100
200
300
400
500
600
700
800
900
'97 '98 '99 '00 '01 '02 '03 '04 '05 '06 '07 '08 '09 '10 '11 '12
Pre-Bubble Average
3
4
5
6
7
8
9
10
11
'97 '98 '99 '00 '01 '02 '03 '04 '05 '06 '07 '08 '09 '10 '11 '12
CORPORATE BOND YIELDS LOW IN ABSOLUTE TERMS BUT HIGH IN RELATIVE
TERMS
Note:
Source: Bank of America Merrill Lynch
United States: BBB-rated Corporate Bond Yield and Spread off Treasury
Yield
61
(percent)
Spread
(basis points)
(percent)
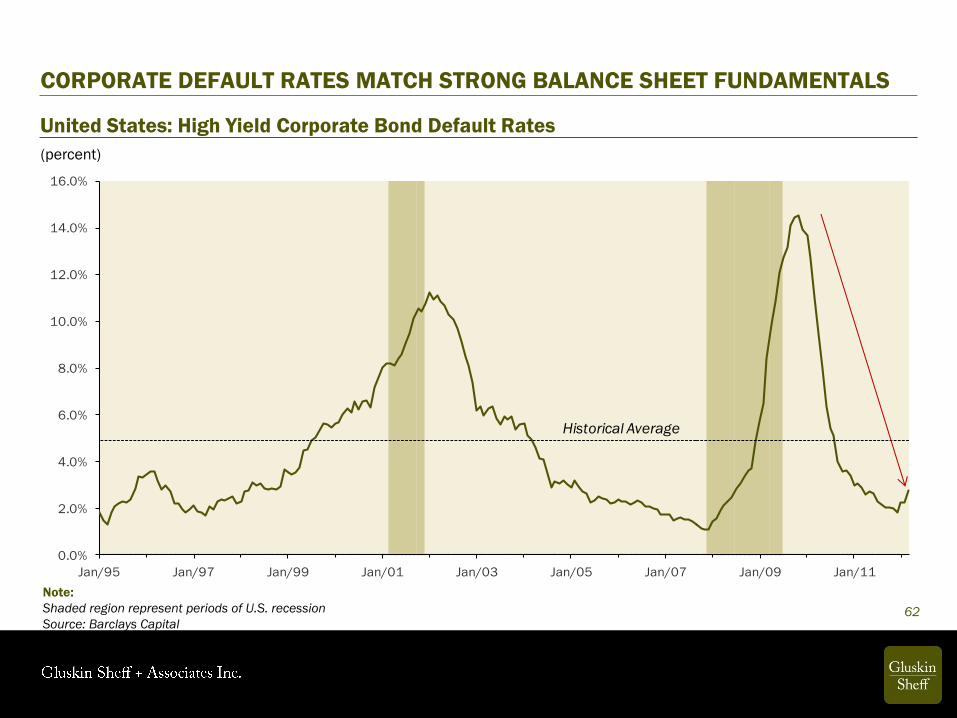
CORPORATE DEFAULT RATES MATCH STRONG BALANCE SHEET FUNDAMENTALS
Note:
Shaded region represent periods of U.S. recession
Source: Barclays Capital
United States: High Yield Corporate Bond Default Rates
62
0.0%
2.0%
4.0%
6.0%
8.0%
10.0%
12.0%
14.0%
16.0%
Jan/95 Jan/97 Jan/99 Jan/01 Jan/03 Jan/05 Jan/07 Jan/09 Jan/11
Historical Average
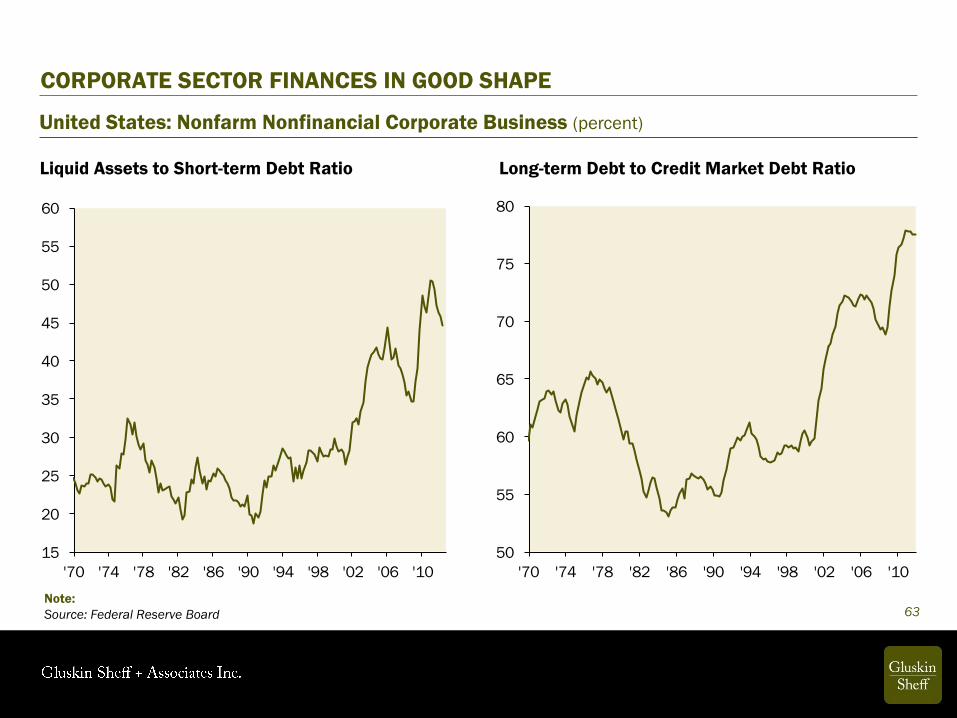
50
55
60
65
70
75
80
'70 '74 '78 '82 '86 '90 '94 '98 '02 '06 '10
15
20
25
30
35
40
45
50
55
60
'70 '74 '78 '82 '86 '90 '94 '98 '02 '06 '10
CORPORATE SECTOR FINANCES IN GOOD SHAPE
Note:
Source: Federal Reserve Board
United States: Nonfarm Nonfinancial Corporate Business (percent)
Liquid Assets to Short-term Debt Ratio Long-term Debt to Credit Market Debt Ratio
63
64
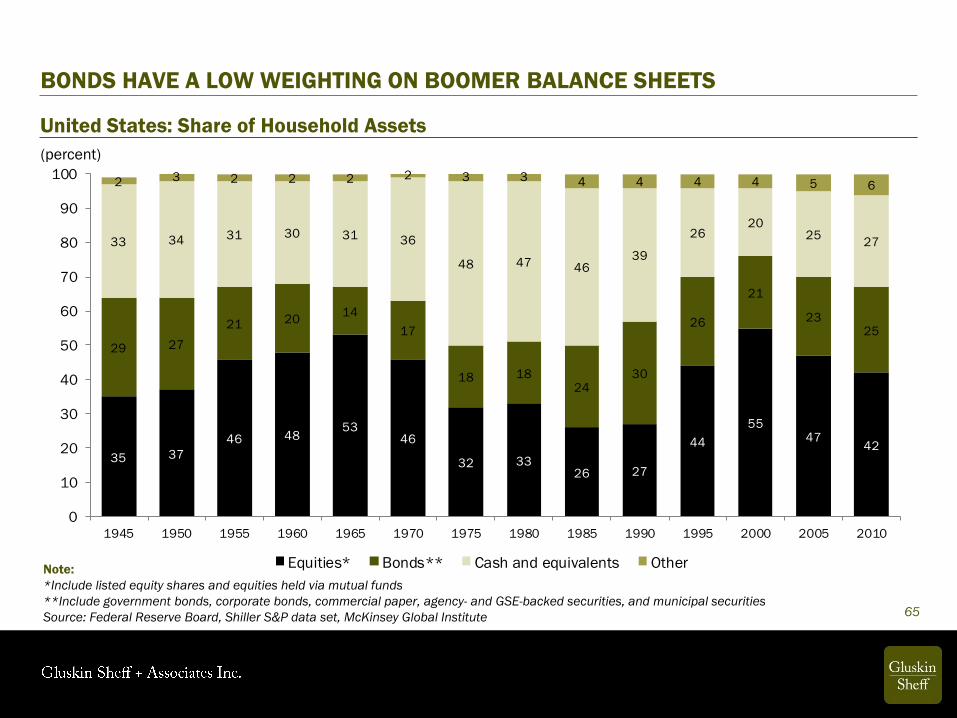
35 37
46 4853
46
32 3326 27
44
5547
42
29 27
21 2014
17
18 1824
30
26
21
2325
33 34 31 30 31 36
48 47 4639
2620
2527
2 3 2 2 2 2 3 3 4 4 4 4 5 6
0
10
20
30
40
50
60
70
80
90
100
1945 1950 1955 1960 1965 1970 1975 1980 1985 1990 1995 2000 2005 2010
Equities* Bonds** Cash and equivalents Other
(percent)
BONDS HAVE A LOW WEIGHTING ON BOOMER BALANCE SHEETS
Note:
*Include listed equity shares and equities held via mutual funds
**Include government bonds, corporate bonds, commercial paper, agency- and GSE-backed securities, and municipal securities
Source: Federal Reserve Board, Shiller S&P data set, McKinsey Global Institute
United States: Share of Household Assets
65
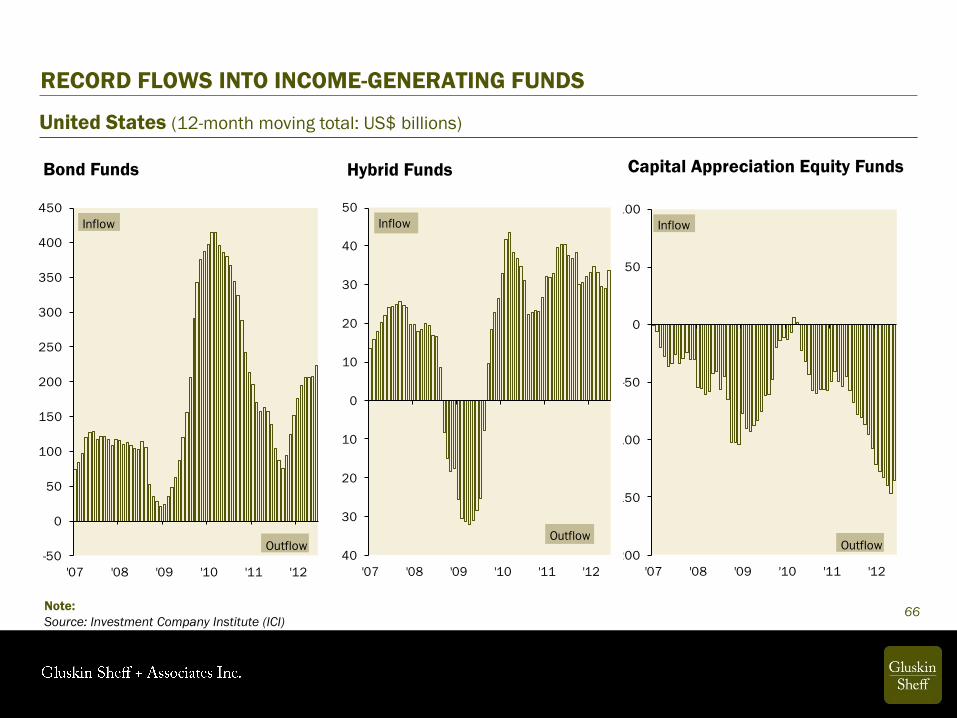
-200
-150
-100
-50
0
50
100
'07 '08 '09 '10 '11 '12
Inflow
Outflow
RECORD FLOWS INTO INCOME-GENERATING FUNDS
Note:
Source: Investment Company Institute (ICI)
United States (12-month moving total: US$ billions)
66
Capital Appreciation Equity Funds Hybrid Funds
-40
-30
-20
-10
0
10
20
30
40
50
'07 '08 '09 '10 '11 '12
Inflow
Outflow
-50
0
50
100
150
200
250
300
350
400
450
'07 '08 '09 '10 '11 '12
Inflow
Outflow
Bond Funds

67
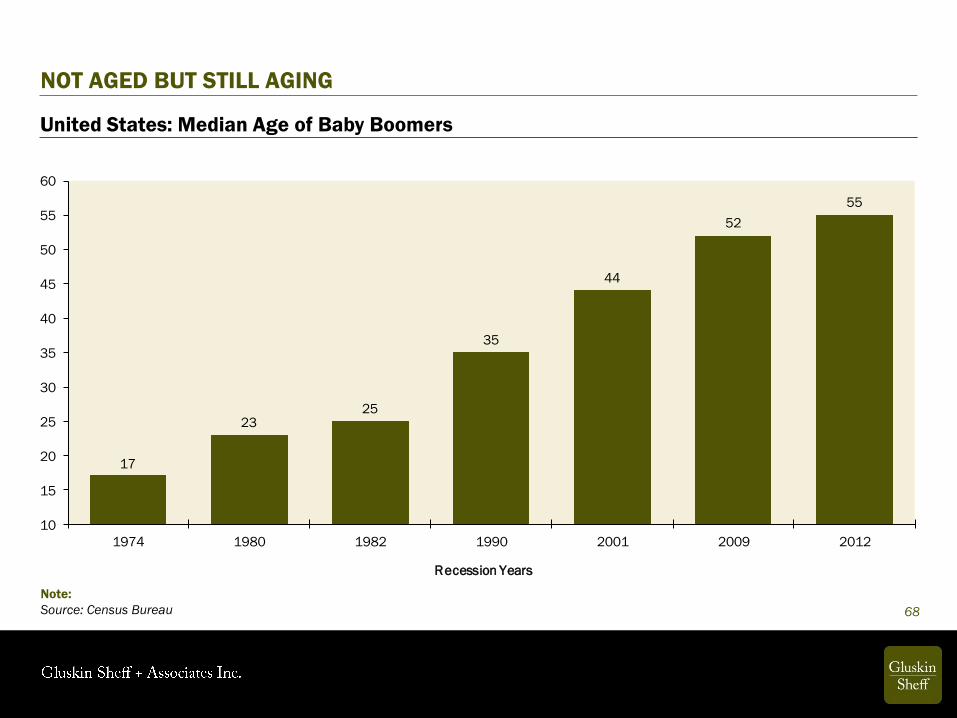
17
2325
35
44
52
55
10
15
20
25
30
35
40
45
50
55
60
1974 1980 1982 1990 2001 2009 2012
Recession Years
NOT AGED BUT STILL AGING
Note:
Source: Census Bureau
United States: Median Age of Baby Boomers
68

32%
33%
34%
35%
36%
37%
38%
39%
40%
'80 '90 '00 '10
Capital appreciation crowd
DEALING WITH DEMOGRAPHICS
Notes:
Dashed lines represent forecast
Source: Census Bureau
United States: Share of Total Population
Age 25-49 (percent)
Age 50-74 (percent)
69
20%
21%
22%
23%
24%
25%
26%
27%
28%
29%
30%
'80 '90 '00 '10
Capital preservation crowd

0%
5%
10%
15%
20%
25%
30%
35%
40%
REITs "Dogs" of the
dow
U.S.
preferreds
High yield
bonds
Dow utilities High dividend
paying TSXstocks
Invest. grade
corp bonds
Muni bonds 10-year strip 30-year strip Canadian
provincialbonds
10-year T-
note
Note:
Source: Bloomberg, Haver Analytics
Total Returns of Different Asset Classes
HAPPY RETURNS IN INCOME STRATEGIES
70
(year-over-year percent change, as of September)

INVESTMENT STRATEGY: SAFETY AND INCOME AT A REASONABLE PRICE (S.I.R.P)
1. Focus on safe yield: High-quality corporates (non- cyclical, high cash reserves, minimal
refinancing needs). Corporate balance sheets are in very good shape.
2. Equities: focus on reliable dividend growth/yield; preferred shares (“income” orientation).
3. Whether it be credit or equities, focus on companies with low debt/equity ratios and high
liquid asset ratios – balance sheet quality is even more important than usual. Avoid highly
leveraged companies.
4. Even hard assets that provide an income stream work well in a deflationary environment
(ie, oil and gas royalties, REITs, etc…).
5. Focus on sectors or companies with these micro characteristics: low fixed costs, high
variable cost, high barriers to entry/some sort of oligopolistic features, a relatively high
level of demand inelasticity (utilities, staples, health care — these sectors are also unloved and under
owned by institutional portfolio managers).
6. Alternative assets: allocate significant portion of asset mix to strategies that are not reliant on rising equity
markets and where volatility can be used to advantage.
7. Precious metals: A hedge against the reflationary policies aimed at defusing deflationary risks — money
printing, rolling currency depreciations, heightened trade frictions, and government procurement policies
71
DISCLAIMER
The information, opinions, and other materials contained in this presentation is the
property of Gluskin Sheff + Associates Inc. and may not be reproduced in any way, in
whole or in part, without express authorization of the copyright holder in writing. The
statements and statistics contained herein have been prepared by Gluskin Sheff +
Associates Inc. based on information from sources considered to be reliable. We make
no representation or warranty, express or implied, as to its accuracy or completeness.
This publication is for the information of investors and business persons and does not
constitute an offer to sell or a solicitation to buy securities.
72


