Page 1
CAM-MPAS MPAS TC Forecasting CAM TC bias CAM-MPAS with POP2 CAM5.5-MPAS Summary
TC forecasting with variable resolution inCAM-MPAS
Sang-Hun Park
Bill Skamarock, Chris Davis, Jimy Dudhiaand Michael Duda
collaborators (CGD) :: Peter Lauritzen, Andrew Gettelmanand Stephen Yeager
National Center for Atmospheric Research
06/22/2016
Page 2
CAM-MPAS MPAS TC Forecasting CAM TC bias CAM-MPAS with POP2 CAM5.5-MPAS Summary
TC forecasting using CAM-MPAS
– Why test CAM-MPAS for TCforecasting?
4 ∼ 10km is overlapping area betweenglobal NWP and climate experiments
(GFS is running ∼ 15km vs. climatesimulations are running ∼ 1/4◦ or 1/8◦ )
We want to (or should) test our physicssuite (or a scheme) at high resolution.
Sometimes NWP tests are better optionfor evaluative testing than long-termsimulations
(Our goals should be similar!! [e.g.,mesoscale convective system, terraineffect] )
Maybe (or hopefully), a good steptoward seamless predictions
Page 3
CAM-MPAS MPAS TC Forecasting CAM TC bias CAM-MPAS with POP2 CAM5.5-MPAS Summary
MMM efforts for TC forecasting– http://www2.mmm.ucar.edu/projects/mpas/Projects/MPAS TC 2015
WP region EP region AL region
Using variable meshes with MPAS, 10-day simulations are beingtested in summer for three different regions
Page 4
CAM-MPAS MPAS TC Forecasting CAM TC bias CAM-MPAS with POP2 CAM5.5-MPAS Summary
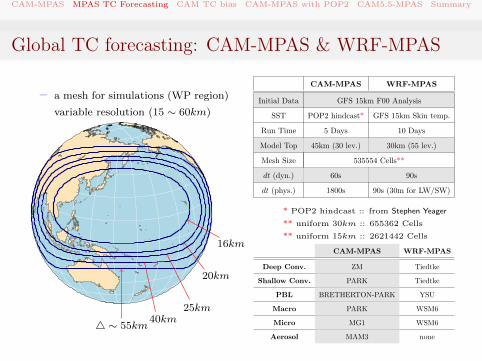
Global TC forecasting: CAM-MPAS & WRF-MPAS
– a mesh for simulations (WP region)
variable resolution (15 ∼ 60km)
4 ∼ 55km40km
25km
20km
16km
CAM-MPAS WRF-MPAS
Initial Data GFS 15km F00 Analysis
SST POP2 hindcast* GFS 15km Skin temp.
Run Time 5 Days 10 Days
Model Top 45km (30 lev.) 30km (55 lev.)
Mesh Size 535554 Cells**
dt (dyn.) 60s 90s
dt (phys.) 1800s 90s (30m for LW/SW)
* POP2 hindcast :: from Stephen Yeager
** uniform 30km :: 655362 Cells
** uniform 15km :: 2621442 Cells
CAM-MPAS WRF-MPAS
Deep Conv. ZM Tiedtke
Shallow Conv. PARK Tiedtke
PBL BRETHERTON-PARK YSU
Macro PARK WSM6
Micro MG1 WSM6
Aerosol MAM3 none
Page 5
CAM-MPAS MPAS TC Forecasting CAM TC bias CAM-MPAS with POP2 CAM5.5-MPAS Summary
Global TC forecasting - CASE
courtesy :: digital-typhoon
1509 CHANHOM
15091510
1511
www.jma.go.kr
1511 NANGKA
nmsc.kma.go.kr
Page 6
CAM-MPAS MPAS TC Forecasting CAM TC bias CAM-MPAS with POP2 CAM5.5-MPAS Summary
MPAS Track forecasing
– CHANHOM (07.06 ∼ 07.10)
best track
WRF-MPAS
CAM-MPAS
– NANGKA (07.09 ∼ 07.13)
1st 5-day forecasting
2nd 5-day forecasting
3rd 5-day forecasting
4th 5-day forecasting
5th 5-day forecasting
Page 7
CAM-MPAS MPAS TC Forecasting CAM TC bias CAM-MPAS with POP2 CAM5.5-MPAS Summary
MPAS TC intensity
– CHANHOM (07.06 ∼ 07.10)
best track
WRF-MPAS
CAM-MPAS
– NANGKA (07.09 ∼ 07.13)
1st 5-day forecasting
2nd 5-day forecasting
3rd 5-day forecasting
4th 5-day forecasting
5th 5-day forecasting
Page 8
CAM-MPAS MPAS TC Forecasting CAM TC bias CAM-MPAS with POP2 CAM5.5-MPAS Summary
MPAS TC intensity
– CHANHOM (07.06 ∼ 07.10)
best track
WRF-MPAS
CAM-MPAS
– What can cause theseintensity biases?
strong surface flux
(coupled system will behelpful?)
wrong mixing in the PBL
not enough stabilization ofCPS
interaction between physics
Page 9
CAM-MPAS MPAS TC Forecasting CAM TC bias CAM-MPAS with POP2 CAM5.5-MPAS Summary
Coupled System in TC
sst cooling from coupledsystem has important role forTC intensity
Bender & Ginis (2000)
many operational center areusing coupled system:HWRF, GFDL,COAMPS-TC
Kim et al. (2014)
HWRF only HWRF + HYCOM
Page 10
CAM-MPAS MPAS TC Forecasting CAM TC bias CAM-MPAS with POP2 CAM5.5-MPAS Summary
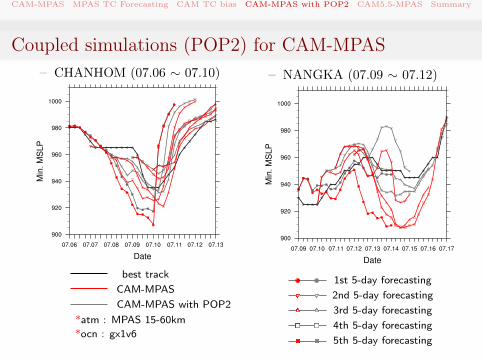
Coupled simulations (POP2) for CAM-MPAS
– CHANHOM (07.06 ∼ 07.10)
best track
CAM-MPAS
CAM-MPAS with POP2
*atm : MPAS 15-60km
*ocn : gx1v6
– NANGKA (07.09 ∼ 07.12)
1st 5-day forecasting
2nd 5-day forecasting
3rd 5-day forecasting
4th 5-day forecasting
5th 5-day forecasting
Page 11
CAM-MPAS MPAS TC Forecasting CAM TC bias CAM-MPAS with POP2 CAM5.5-MPAS Summary
Surface flux in TC
strong sensitivity to Ck/Cd inmaximum hurricane (see -Emanuel, 1995 & 2004)
Emanuel (1995)
– Cd: exchange coefficient formomentum
Ck: for entalphy
Bryan (2012)
Page 12
CAM-MPAS MPAS TC Forecasting CAM TC bias CAM-MPAS with POP2 CAM5.5-MPAS Summary
Surface Flux in CAM MPAS
U10 vs. Ck/Cd
2015.07.08 +24h∼+36h 2015.07.08 +24h∼+36h
Differences are mainly from low winds casesBut, the ratios between Cd and Ck are comparable specially inhigh-winds.These are very consistent during other simulations
Page 13
CAM-MPAS MPAS TC Forecasting CAM TC bias CAM-MPAS with POP2 CAM5.5-MPAS Summary
CAM-MPAS with CLUBB– CHANHOM (07.06 ∼ 07.10)
best track
CAM-MPAS
CAM-MPAS with CAM5.5
– NANGKA (07.09 ∼ 07.12)
1st 5-day forecasting
2nd 5-day forecasting
3rd 5-day forecasting
4th 5-day forecasting
5th 5-day forecasting
Page 14
CAM-MPAS MPAS TC Forecasting CAM TC bias CAM-MPAS with POP2 CAM5.5-MPAS Summary
CAM-MPAS with CLUBB
composite analysis from OBS.
Zhang et al. (2011)
CAM5.3 RMW ∼ 55km
CAM5.5 RMW ∼ 100km
tangential, 4 ∼ 5/ms radial, 4 ∼ 4/ms
Note that real TC size issmaller in UW-PBL.
Page 15
CAM-MPAS MPAS TC Forecasting CAM TC bias CAM-MPAS with POP2 CAM5.5-MPAS Summary
CAM-MPAS with CLUBB
CAM5.3 Km, w
CAM5.5 Km, w
PBL height
For r/RMW ∼≥ 3.5, verysmall amount of verticaldiffusion in UW-PBL
(inflow can be strong withshallow depth)
Both results show larger Km
than observation(CBLASAT), but inUW-PBL, maximum value istoo high.
Overall, all of these cansupport strong inflow withshallow depth in UW-PBL,which create strong and smallTC.
Page 16
CAM-MPAS MPAS TC Forecasting CAM TC bias CAM-MPAS with POP2 CAM5.5-MPAS Summary
Conclusions and Future Study
Current CAM (CAM5.3) has bias toward stronger TC inCAM-MPAS simulations.
The ratio between Cd and Ck are comparable in CAM andWRF physics even with strong TC bias in CAM.
Coupling with POP2 can mitigate these strong TC.
Role of UW-PBL in global TC forecasting is unclear
(not enough mixing? or too much mixing?)
CAM5.5 (mainly for CLUBB) is very helpful in this studyto have reasonable BL structure of TC.
We will try to run using CAM6 and coupled with POP2.
It will be a good option to perform these in non-hydrostaticscales (4 ≤ 10km in MPAS) to get more scientific issues.
Page 17
CAM-MPAS MPAS TC Forecasting CAM TC bias CAM-MPAS with POP2 CAM5.5-MPAS Summary
Conclusions and Future Study
We are also very interested in long-term climate simulationusing CAM-MPAS
We will investigate energy balance issues (mainly fromdifferent vertical coordinate with other dycores) (workingwith Peter Lauritzen)