62
TCS Steel and Fe-alloys Database (TCFE) Examples Collection Document created 11/29/2021

TCS Steel and Fe-alloys Database (TCFE)Examples Collection
Document created 11/29/2021

Contents
About the Database Examples 4
TCS Steel and Fe-alloys Database (TCFE) Resources 5
TCFE Validation Examples 6
Liquidus and Solidus 7
Tool Steels and High-speed Steels (HSS) 8
Advanced High-strength (AHS) Steels Containing Al, Mn, Si, and C 10
Low-density Steels 12
High-strength Low-alloy Steels (HSLA) 15
Nitrogen Alloyed Duplex Stainless Steels (DSS) 17
Molar Volumes 20
Dynamic and Kinematic Viscosity of Various Alloys 22
Martensite Formation 26
Laves Phase 28
Oxidation 30
Cemented Carbides 34
Residual Element Tin (Sn) 35
Electrical Resistivity of Ferrous Alloys and Steels 37
Thermal Conductivity of Ferrous Alloys and Steels 39
TCFE Calculation Examples 41
Sulphurous Systems 42
Phosphorus Systems 43
Boron-containing Systems 45
Copper-containing Systems 47
Nb and V-Containing Systems 49
Ordered Phases 51
Galvanization Processes 53
ǀ 2 of 62
www.thermocalc.com

Oxide Dispersion Strengthened (ODS) Steels 55
Blowhole Formation 56
Surface Tension: Cu-Fe, Fe-Ni, Cu-Ni, and Cu-Fe-Ni 58
Viscosity: B-Fe, Fe-Ni, and Fe-Ni-B 61
ǀ 3 of 62
www.thermocalc.com
About the Database ExamplesThere are examples available to demonstrate both the validityof the database itself as well as to demonstrate some of its calculation capabilities when combined with Thermo-Calc software and its Add-on Modules and features.
For each database, the type and number of available examples varies. In some cases an example can belong to both a validation and calculation type.
l Validation examples generally include experimental data in the plot or diagram to show how close to the predicted data sets the Thermo-Calc calculations are. It uses the most recent version of the software and relevant database(s) unless otherwise specified.
l Calculation examples are intended to demonstrate a use case of the database. This might be showing a binary or ternary system calculated in a phase diagram, or demonstrate how the database and relevant software features would be applied to a heat treatment application, process metallurgy, soldering process, and so forth. In the case of heat treatment, it might include the result of calculating solidification segregation, determining homogenization temperature and then predicting the time needed to homogenize. There are many other examples specifically related to each database.
Where relevant, most references related to each example set are included at the end of the individual section. You can also find additional references specific to the database itself when using the database within Thermo-Calc. You can also contact us directly should you have any questions.
If you are interested in sharing your own examples using Thermo-Calc products in unique or surprising ways, or if you want to share your results from a peer reviewed paper, send an email to [email protected].
About the Database Examples ǀ 4 of 62
www.thermocalc.com

TCS Steel and Fe-alloys Database (TCFE) ResourcesInformation about the database is available on our website and in the Thermo-Calc software online Help.
l Website: On our website the information is both searchable and the database specific PDFs are available to download.
l Online Help: Technical database information is included with the Thermo-Calc software online Help. When in Thermo-Calc, press F1 to search for the same information as is contained in the PDF documents described. Depending on the database, there are additional examples available on the website.
Database Specific Documentation l The TCS Steel and Fe-alloys Database (TCFE) Technical Information PDF document contains version
specific information such as the binary, ternary, and higher-order assessed systems, phases and models. It also includes details about the properties data (e.g. viscosity, surface tension, etc.), a list of the included elements, and summaries of the database revision history by version.
l The TCS Steel and Fe-alloys Database (TCFE) Examples Collection PDF document contains a series of validation examples using experimental data, and a set of calculation examples showing some of the ways the database can be used.
Go to the Steels and Fe-Alloys Databases page on our website where you can access an examples collection and the technical information plus learn more about the compatible kinetic database. Also explore further applications of Thermo-Calc to iron and steels including links to resources such as publications, webinars, videos, and more.
Learn more on our website about the CALPHAD Method and how it is applied to the Thermo-Calc databases.
TCS Steel and Fe-alloys Database (TCFE) Resources ǀ 5 of 62
www.thermocalc.com

TCFE Validation ExamplesValidation of the current version of the database against experimental data shows accurate predictions for various applications.
Some diagrams are calculated with earlier versions of the database. Negligible differences might be observed if these are recalculated with the most recent version. The diagrams are updated when there are considerable or significant improvements.
In this section:
Liquidus and Solidus 7
Tool Steels and High-speed Steels (HSS) 8
Advanced High-strength (AHS) Steels Containing Al, Mn, Si, and C 10
Low-density Steels 12
High-strength Low-alloy Steels (HSLA) 15
Nitrogen Alloyed Duplex Stainless Steels (DSS) 17
Molar Volumes 20
Dynamic and Kinematic Viscosity of Various Alloys 22
Martensite Formation 26
Laves Phase 28
Oxidation 30
Cemented Carbides 34
Residual Element Tin (Sn) 35
Electrical Resistivity of Ferrous Alloys and Steels 37
Thermal Conductivity of Ferrous Alloys and Steels 39
TCFE Validation Examples ǀ 6 of 62
www.thermocalc.com

Liquidus and SolidusThe TCS Steel and Fe-alloys Database (TCFE) can satisfactorily predict the liquidus and solidus temperatures in various commercial steels and model alloys. In addition, the accuracy to predict the correct primary phase to form from the liquid is very high.
In this example, measured liquidus temperatures are compared with the calculated ones for various steels (stainless steels, carbon and low alloy steels, high-speed steels with high Nb content and chromium steels).
Figure 1: Experimental liquidus temperatures [1977Jer; 1997All; 2003Coe] for various steels (stainless steels, carbon and low alloy steels, high-speed steels with high Nb content and chromium steels) compared with calculations with the TCFE database.
References[1977Jer] Jernkontoret, Guide to Solidification of Steels, Ljungberg Tryckeri AB, Stockholm, Sweden (1977).
[1997All] G. Allan, Castability, solidification mode and residual ferrite distribution in highly alloyed stainless steels, Technical Steel Research, European Commission, 96 pp. (1997).
[2003Coe] G. C. Coelho, J. A. Golczewski, H. F. Fischmeister, Thermodynamic calculations for Nb-containing high-speed steels and white-cast-iron alloys, Metall. Mater. Trans. A. 34, 1749–1758 (2003).
TCFE Validation Examples ǀ 7 of 62
www.thermocalc.com

Tool Steels and High-speed Steels (HSS)The TCS Steel and Fe-alloys Database (TCFE) can be used for tool steels and high-speed steels (HSS), especially to predict correct phases and phase compositions. For example, the MC, M7C3, and M6C carbides compositions for a number of different tool steels and high-speed steels is shown, where all experimental data is taken from [2004a&bBra; 2005Bra].
Figure 2: Calculated vs. experimental equilibrium composition for MC carbide in different tool steels and high-speed steels.
Figure 3: Calculated vs. experimental equilibrium composition for M7C3 carbide in different tool steels and high-speed steels.
TCFE Validation Examples ǀ 8 of 62
www.thermocalc.com

Figure 4: Calculated vs. experimental equilibrium composition for M6C carbide in different tool steels and high-speed steels.
References[2004aBra] J. Bratberg, K. Frisk, An Experimental Investigation of Carbide/Austenite Equilibria, in Proceeding
of the Powder Metallurgy World Congress and EURO-PM2004 - Volume 5 (European Powder Metallurgy Association (EPMA), Vienna, Austria), p. 6 (2004).
[2004bBra] J. Bratberg, K. Frisk, An experimental and theoretical analysis of the phase equilibria in the Fe-Cr-V-C system, Metall. Mater. Trans. A. 35, 3649–3663 (2004).
[2005Bra] J. Bratberg, Investigation and modification of carbide sub-systems in the multicomponent Fe–C–Co–Cr–Mo–Si–V–W system, Zeitschrift fur Met. 96, 335–344 (2005).
TCFE Validation Examples ǀ 9 of 62
www.thermocalc.com

Advanced High-strength (AHS) Steels Containing Al, Mn, Si, and CHigh temperature equilibria, and specifically the peritectic reaction, is of significant importance in continuous casting practice. The TCS Steel and Fe-alloys Database (TCFE) uses data from the latest thermodynamic assessments [2017Zhe] and systematic DSC measurements in C-Fe-Mn-Si and Al-C-Fe-Mn-Si systems [2016Pre; 2015Moo].
Figure 5: Calculated isoplethal section of Fe-2.12Mn-0.77Al-0.54Si-xC.
TCFE Validation Examples ǀ 10 of 62
www.thermocalc.com

Figure 6: Calculated isoplethal section of Fe-2.75Mn-1.11Si-0.097Al-0.014Ti-0.02Nb-xC.
References[2015Moo] S. C. Moon, The peritectic phase transition and continuous casting practice, PhD thesis,
University of Wollongong, Australia (2015).
[2016Pre] P. Presoly, J. Six, and C. Bernhard, Thermodynamic optimization of individual steel database by means of systematic DSC measurements according the CALPHAD approach, IOP Conf. Ser. Mater. Sci. Eng., 119 (1), 12013 (2016).
[2017Zhe] W. Zheng, X. Lu, Y. He, L. Li, Thermodynamic modeling of Fe-C-Mn-Si alloys, J. Iron Steel Res. Int. 24, 190–197 (2017).
TCFE Validation Examples ǀ 11 of 62
www.thermocalc.com

Low-density SteelsAl-C-Cr-Fe-Mn-Ni
Reducing the weight of engineering structures saves both material and energy, and also leads to greater fuel efficiency and reduces emissions in automobiles. The Al-C-Cr-Fe-Mn-Ni system is the core of low density steels and allows studies to replace costly Ni and Cr in stainless steels by cheaper Mn and Al. The TCS Steel and Fe-alloys Database (TCFE) has the latest assessments and experimental information for the Al-C-Cr-Fe-Mn-Ni system and subsystems.
Figure 7: The mole fraction change of each phase with the temperature for Fe-10Mn-10Al-0.7C low-density steel [2016Zha].
TCFE Validation Examples ǀ 12 of 62
www.thermocalc.com

Figure 8: The calculated vertical section of C-Fe-Mn involving the liquid phase at 20 wt.% Mn compare to the experimental data as cited by [2011Dju].
Comparing FCC_A1 to BCC_B2 CompositionIt has been shown [2015Kim] that a B2-type brittle but hard intermetallic compound can be effectively used as a strengthening second phase in high-aluminum low-density steel. The table shows a comparison of the calculated partitioning of alloying elements between B2 precipitate and austenite matrix during annealing of cold rolled Fe-10Al-15Mn-0.8C-5Ni (at.%), with the experimental observations.
Element
FCC_A1 composition (at.%) BCC_B2 composition (at.%)
Calculated Experiment [2015Kim] Calculated Experiment [2015Kim]
Fe 65.6 68 53.7 54.4
Al 15.1 13 25.5 25.0
Mn 16.8 16.6 10.2 10.0
Ni 1.9 2.4 10.1 9.95
References[2011Dju] D. Djurovic, B. Hallstedt, J. von Appen, R. Dronskowski, Thermodynamic assessment of the Fe–
Mn–C system, Calphad. 35, 479–491 (2011).
TCFE Validation Examples ǀ 13 of 62
www.thermocalc.com
[2015Kim] S.-H. Kim, H. Kim, N. J. Kim, Brittle intermetallic compound makes ultrastrong low-density steel with large ductility, Nature. 518, 77–79 (2015).
[2016Zha] C. Zhao, R. Song, L. Zhang, F. Yang, T. Kang, Effect of annealing temperature on the microstructure and tensile properties of Fe–10Mn–10Al–0.7C low-density steel, Mater. Des. 91, 348–360 (2016).
TCFE Validation Examples ǀ 14 of 62
www.thermocalc.com

High-strength Low-alloy Steels (HSLA)A useful application of the TCS Steel and Fe-alloys Database (TCFE) is for high-strength low alloy (HSLA) steels, especially to predict correct phases and phase compositions in all possible precipitates.
Figure 9: Predicted mass fraction of Nb, Ti, V and Al in precipitates compared with experimental information [1998Zaj] for a microalloyed steel with 0.09C-1.51Mn-0.035Al-0.010Ti-0.030Nb-0.08V-0.0105N (wt.%).
The table below shows the predicted compositions for (TixNb1-x)NyC1-y and (NbtTi1-t)CuN1-u carbonitrides (site fractions) in two microalloyed steels compared with measurements from [2000Cra]. All calculations were made at 1000 °C. Both steels contain the following alloy contents: 0.036Al- 1.4Mn-0.50Ni-0.015P-0.002S-0.4Si (wt.%) in addition to the composition provided.
Steel 1 0.07C wt.% 0.0079N wt.% 0.025Nb wt.% 0.009Ti wt.%
x y t u
Experiment 0.86 ± 0.04 ≈ 1 1 ≈ 0.7
Calculation 0.94 0.94 0.98 0.71
Steel 2 0.097%C 0.0049%N 0.017%Nb 0.010%Ti
x y t u
Experiment 0.91 ± 0.03 0.84 ± 0.05 1 or ≈ 0.8 ≈ 1
Calculation 0.97 0.92 0.97 0.78
TCFE Validation Examples ǀ 15 of 62
www.thermocalc.com

References[1998Zaj] S. Zajac, R. Lagneborg, Thermodynamic model for the precipitation of carbonitrides in
microalloyed steels - Internal report IM-3566, Swedish Institute for Metals Research, Stockholm, Sweden, 112 pp. (1998).
[2000Cra] A. Craven, K. He, L. A. J. Garvie, and T. N. Baker, Complex heterogeneous precipitation in titanium–niobium microalloyed Al-killed HSLA steels—I. (Ti,Nb)(C,N) particles, Acta Mater., 48 (15), pp. 3857–3868 (2000).
TCFE Validation Examples ǀ 16 of 62
www.thermocalc.com

Nitrogen Alloyed Duplex Stainless Steels (DSS)HT Phase Equilibria
The duplex steels are designed to solidify in the single-phase ferritic mode with formation of austenite by precipitation in the solid state [1992Nil; 2017Pet].
The high-temperature phase equilibria calculations with TCS Steel and Fe-alloys Database (TCFE) show the interval below solidus where the material is fully ferritic.
Figure 10: Calculated isopleth sections for LDX2101 grade (left) and 2205 grade (right) with nitrogen contents up to 1 wt. %. The nitrogen content of the alloy is indicated by the dashed lines. Experimental data is from the FROST project – Internal report.
Limits of Nitrogen SolubilityThe TCS Steel and Fe-alloys Database (TCFE) can also be used to calculate the limits of nitrogen solubility in austenite and ferrite at various nitrogen activities as shown below. Experimental data is from the FROST project – Internal report.
TCFE Validation Examples ǀ 17 of 62
www.thermocalc.com

Figure 11: Isopleth for the Fe-25Cr (left) and Fe-20Cr-5Mn-3Ni-1.5Cu-N (right) system showing the phase regions of main interest and the isoactivity line aN = 1 and the iso-activity line for aN=0.5.
η-silicide PrecipitationThe η-silicide (η-nitride) has a diamond cubic structure with typical composition Cr3Ni2SiN and is indicated to be the equilibrium nitrogen bearing phase in austenitic stainless steels alloyed with nitrogen according to research made by Jargelius-Pettersson [1998Jar]. Experimental information found in the literature together with new experimental information within internal projects were used to assess the thermodynamic description of the η- silicide (ETA_M5SIN) in TCS Steel and Fe-alloys Database (TCFE). In Table 1 the composition of some studied alloys are shown and in Table 2 a comparison is made between observed and calculated composition of η-silicide.
Table 1. Composition (wt. %) of two of the alloys studied by Jargelius-Pettersson [1998Jar].
Alloy C Si Mn P S Cr Ni Mo N
L3 0.014 0.54 1.44 0.009 0.003 19.8 25.0 4.59 0.21
B3 0.014 0.56 5.24 0.012 0.004 20.2 18.5 4.28 0.44
TCFE Validation Examples ǀ 18 of 62
www.thermocalc.com

Table 2. Comparison between measured and calculated composition of η-silicide in alloys B3 and L3 at 800 °C [1998Jar].
Alloy at. % Cr Ni Mo Fe Si N
B3
Exp. 30 25.5 12 5 13 14.5
Calc. 27.7 25.8 15.2 2.8 14.3 14.3
L3
Exp24
25.1
25.0
24.7
15.0
15.2
4.5
8.0
13
(14.3)
18.5
(14.3)
Calc. 28.6 26.3 14.3 2.3 14.3 14.3
References[1992Nil] J.-O. Nilsson, Super duplex stainless steels, Mater. Sci. Technol., 8 (8), 685–700 (1992).
[1998Jar] R.F.A. Jargelius-Pettersson, Precipitation trends in highly alloyed austenitic stainless steels, Zeitschrift Für Met., 89, 177–183 (1998).
[2017Pet] N. Pettersson, S. Wessman, S. Hertzman, and A. Studer, High-temperature phase equilibria of duplex stainless steels assessed with a novel in-situ neutron scattering approach, Metall. Mater. Trans. A, 48 (4), 1562–1571 (2017).
TCFE Validation Examples ǀ 19 of 62
www.thermocalc.com

Molar VolumesThe TCS Steel and Fe-alloys Database (TCFE) contains molar volume data for all phases in the database, allowing for the calculation of volume fraction of phases, as well as density and coefficient of thermal expansion using Thermo-Calc. Molar volumes are also needed when using the Precipitation Module (TC-PRISMA) for precipitation simulations. The figures below show the validation of predicted densities in different alloys and the relative length change of a commercial steel.
For more information about the various thermophysical models, and when in Thermo-Calc, press F1 to search the online help. The details are found under a General Reference section.
You can find information on our website about the properties that can be calculated with Thermo-Calc and the Add-on Modules. Additional resources are added on a regular basis so keep checking back or subscribe to our newsletter.
Figure 12: Calculated density of several steels at room temperature compared to experimental data provided by Sandvik [2017San] and Uddeholm Tooling [2017Udd].
TCFE Validation Examples ǀ 20 of 62
www.thermocalc.com

Figure 13: Relative length change [2002Gar] of steel Fe-0.11C-0.5Mn-0.03Si-0.01Cr-0.02Ni (wt.%) compared with predictions using the TCFE database.
References[2002Gar] C. García de Andrés, F. G. Caballero, C. Capdevila, L. F. Álvarez, Application of dilatometric
analysis to the study of solid–solid phase transformations in steels, Mater. Charact. 48, 101–111 (2002).
[2017San] Personal Communication with Sandvik.
[2017Udd] Personal Communication with Uddeholm Tooling.
TCFE Validation Examples ǀ 21 of 62
www.thermocalc.com

Dynamic and Kinematic Viscosity of Various AlloysThe TCS Steel and Fe-alloys Database (TCFE) can be used to calculate the viscosity of the metallic liquid. Below are a few examples of the calculated viscosity curves compared with experimental data. The viscosity thermophysical property data is included starting with version 10 (TCFE10).
For more information about the various thermophysical models, and when in Thermo-Calc, press F1 to search the online help. The details are found under a General Reference section.
You can find information on our website about the properties that can be calculated with Thermo-Calc and the Add-on Modules. Additional resources are added on a regular basis so keep checking back or subscribe to our newsletter.
Fe-C-B-Si-P AlloyCalculated dynamic viscosity of an Fe-C-B-Si-P alloy is compared with experimental data.
Figure 14: Dynamic viscosity of an Fe-C-B-Si-P alloy with experimental data.
Stainless Steel The viscosity of molten stainless steel (SUS316L) was measured by oscillating cup method. The figure shows the calculated viscosity of stainless steel. The experimental data from two measurement runs are imposed on the plot. Also, the measured viscosity of the ternary Fe-18Cr-8Ni wt% which is close in composition to SUS316L is shown.
These data are digitized from [2018Kok] due to inaccessibility to the original paper by Sato et al. [2005Sat].
TCFE Validation Examples ǀ 22 of 62
www.thermocalc.com
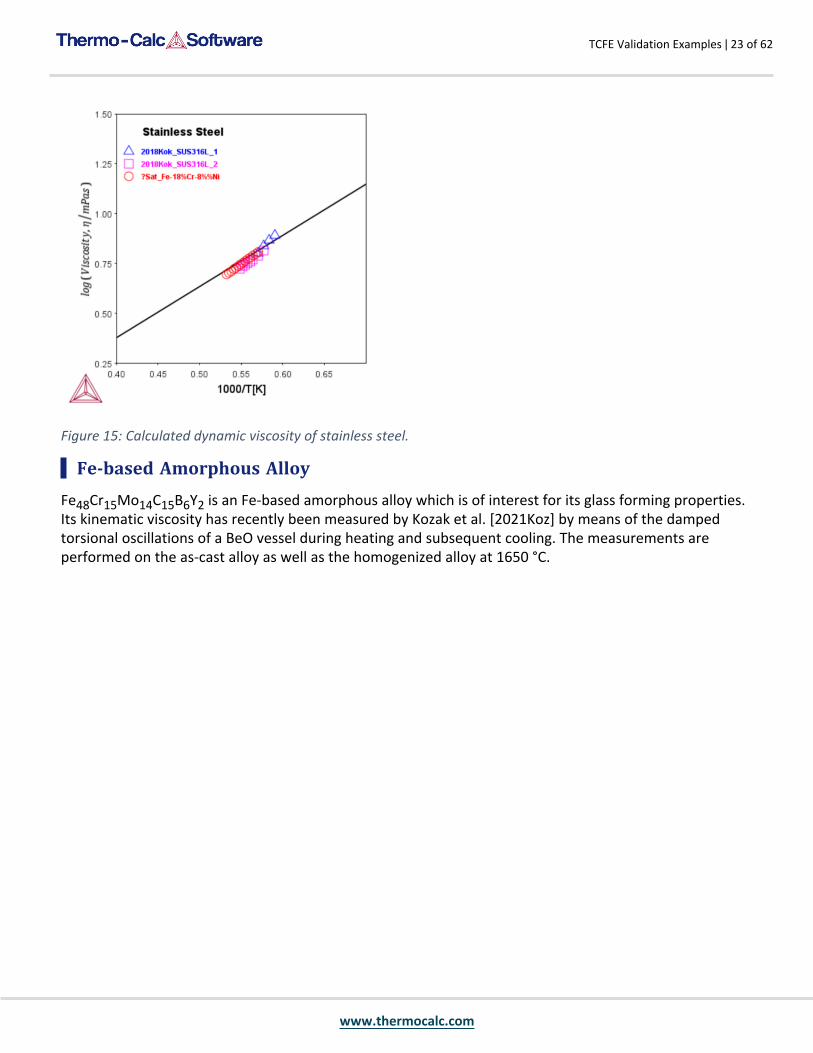
Figure 15: Calculated dynamic viscosity of stainless steel.
Fe-based Amorphous AlloyFe48Cr15Mo14C15B6Y2 is an Fe-based amorphous alloy which is of interest for its glass forming properties. Its kinematic viscosity has recently been measured by Kozak et al. [2021Koz] by means of the damped torsional oscillations of a BeO vessel during heating and subsequent cooling. The measurements are performed on the as-cast alloy as well as the homogenized alloy at 1650 °C.
TCFE Validation Examples ǀ 23 of 62
www.thermocalc.com

Figure 16: Calculated kinematic viscosity of Fe48Cr15Mo14C15B6Y2 alloy along with experimental data from [2021Koz].
Pipe SteelTsepelev et al. [2021Tse] measured the kinematic viscosity of pipe steel. They used two samples; the first one was used in the measurements after melting without degassing (sample 1) but the second sample was degassed after melting (sample 2). The compositions of sample 1 and 2 as reported in the paper are (in w%):
Fe C Si Mn Al Cr Ni Cu P N S O
Sample 1 Balance 0.21 0.28 1.05 0.022 0.100 0.100 0.22 0.010 0.009 0.0030 0.079
Sample 2 Balance 0.22 0.26 0.83 0.028 0.050 0.060 0.17 0.012 0.007 0.0006 0.034
TCFE Validation Examples ǀ 24 of 62
www.thermocalc.com

Figure 17: Kinematic viscosity of pipe steel along with experimental data from [2021Tse]. The composition of sample 1 and sample 2 are very close but sample 2 has been degassed after melting while sample 1 has not.
References[2005Sat] Y. Sato, K. Sugisawa, D. Aoki, T. Yamamura, Viscosities of Fe–Ni, Fe–Co and Ni–Co binary melts.
Meas. Sci. Technol. 16, 363–371 (2005).
[2018Kok] H. Kokubo, T. Nishi, H. Ohta, H. Yamano, Viscosity Measurement of Nickel and Stainless Steel Aiming at Systematic Viscosity Measurement for Molten Mixture of Stainless Steel and Boron-Carbide. J. Japan Inst. Met. Mater. 82, 400–402 (2018).
[2018Li] Y. Li, W. Chen, B. Dong, S. Zhou, Effects of metalloid content on viscosity of Fe-Si-B-P-C alloy melt. J. Non. Cryst. Solids. 490, 31–34 (2018).
[2021Koz] D. S. Kozak, V. S. Tsepelev, V. V Konaskov, V. V Vyukhin, V. Y. Zadorozhnyy, A. I. Bazlov, A. R. Kvaratskheliya, A. A. Tsarkov, J. F. M. Van Impe, Thermophysical Properties of the Fe48Cr15Mo14C15B6Y2 Alloy in Liquid State. Metals (Basel). 11, 823 (2021).
[2021Tse] V. S. Tsepelev, Y. N. Starodubtsev, N. P. Tsepeleva, Thermophysical Properties of Pipe Steel in the Liquid State. Metals (Basel). 11, 1099 (2021).
TCFE Validation Examples ǀ 25 of 62
www.thermocalc.com

Martensite FormationThe TCS Steel and Fe-alloys Database (TCFE) has been successfully used for thermodynamically-based predictions of the lath and plate martensite start (Ms) temperature [2012Sto]. The Ms temperature prediction depends on the available driving force which should be equal to the barrier for martensite formation.
Starting with the TCFE9 version of this database, particular attention is paid to the epsilon (ε) martensite transformation, and the thermodynamic descriptions of Fe-Mn-C system is modified to give a reasonable driving force for the γ→ε diffusionless transformation. As a result, the database can be used to predict the Ms temperature using the Property Model Calculator.
Read more on our website about Property Models, including information about the Steel and Nickel Model Libraries, as well as how to create your own custom models in TC-Python. If you are in Thermo-Calc, press F1 to search the help.
Figure 18: Epsilon martensite start temperature for Fe-Mn compared to various experimental data.
TCFE Validation Examples ǀ 26 of 62
www.thermocalc.com

Figure 19: Calculated Epsilon martensite start temperature for Fe-17at.% Mn-xC alloys compared with the experimental data by [2004Kim].
References[2004Kim] J.-C. Kim, D.-W. Han, S.-H. Baik, and Y.-K. Lee, Effects of alloying elements on martensitic
transformation behavior and damping capacity in Fe–17Mn alloy, Mater. Sci. Eng. A, vol. 378, no. 1–2, pp. 323–327 (2004).
[2012Sto] A. Stormvinter, A. Borgenstam, J. Ågren, Thermodynamically Based Prediction of the Martensite Start Temperature for Commercial Steels, Metall. Mater. Trans. A. 43, 3870–3879 (2012).
TCFE Validation Examples ǀ 27 of 62
www.thermocalc.com

Laves PhaseThe TCS Steel and Fe-alloys Database (TCFE) contains an extensive description of the Laves phase. This description shows satisfying accuracy of the predictions compared to experimental information [2004Sah; 2010Pan]. Below compares the amount of different phases as a function of temperature two commercial steels.
Figure 20: Amount of different phases as a function of temperature in 316L alloy [2004Sah].
Figure 21: Amount of different phases as a function of temperature in P91 alloy [2010Pan].
TCFE Validation Examples ǀ 28 of 62
www.thermocalc.com

References[2004Sah] H. Sahlaoui, K. Makhlouf, H. Sidhom, J. Philibert, Effects of ageing conditions on the precipitates
evolution, chromium depletion and intergranular corrosion susceptibility of AISI 316L: experimental and modeling results, Mater. Sci. Eng. A. 372, 98–108 (2004).
[2010Pan] C. G. Panait, W. Bendick, A. Fuchsmann, A.-F. Gourgues-Lorenzon, J. Besson, Study of the microstructure of the Grade 91 steel after more than 100,000 h of creep exposure at 600 °C, Int. J. Press. Vessel. Pip. 87, 326–335 (2010).
TCFE Validation Examples ǀ 29 of 62
www.thermocalc.com
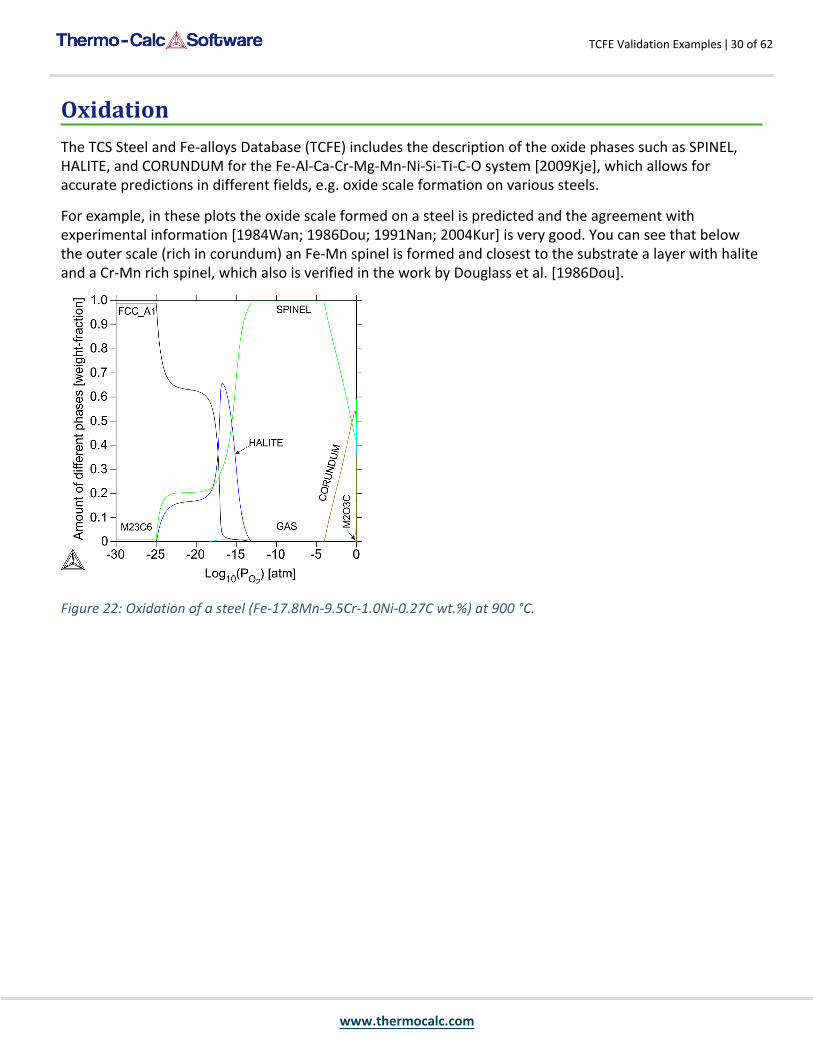
OxidationThe TCS Steel and Fe-alloys Database (TCFE) includes the description of the oxide phases such as SPINEL, HALITE, and CORUNDUM for the Fe-Al-Ca-Cr-Mg-Mn-Ni-Si-Ti-C-O system [2009Kje], which allows for accurate predictions in different fields, e.g. oxide scale formation on various steels.
For example, in these plots the oxide scale formed on a steel is predicted and the agreement with experimental information [1984Wan; 1986Dou; 1991Nan; 2004Kur] is very good. You can see that below the outer scale (rich in corundum) an Fe-Mn spinel is formed and closest to the substrate a layer with halite and a Cr-Mn rich spinel, which also is verified in the work by Douglass et al. [1986Dou].
Figure 22: Oxidation of a steel (Fe-17.8Mn-9.5Cr-1.0Ni-0.27C wt.%) at 900 °C.
TCFE Validation Examples ǀ 30 of 62
www.thermocalc.com

Figure 23: Calculated composition of the spinel phase in the oxide scale at 900 °C.
Figure 24: Calculated oxide scale formed on a low-Cr boiler steel (Fe-1.44Cr-0.06C wt.%) at 550 °C.
TCFE Validation Examples ǀ 31 of 62
www.thermocalc.com

Figure 25: Calculated composition in different oxides versus oxygen partial pressure for the low-Cr boiler steel (Fe-1.44Cr-0.06C wt.%). These results agree very well compared with experimental information [2005Tri]. A small amount of graphite is present for the whole oxygen partial pressure interval.
The model used for the spinel and corundum phases makes it possible to simulate diffusion inside these phases using the Diffusion Module (DICTRA) (also possible for other oxides such as halite) provided that a suitable mobility database is available.
Read more about the Diffusion Module (DICTRA) on our website. If you are in Thermo-Calc, press F1 to search the help to learn about the available settings included with the Add-on Module.
References[1984Wan] R. Wang, M. J. Straszheim, R. A. Rapp, A high-temperature oxidation-resistant Fe-Mn-Al-Si alloy,
Oxid. Met. 21, 71–79 (1984).
[1986Dou] D. L. Douglass, F. Gesmundo, C. de Asmundis, The air oxidation of an austenitic Fe-Mn-Cr stainless steel for fusion-reactor applications, Oxid. Met. 25, 235–268 (1986).
[1991Nan] P. Nanni, V. Buscaglia, G. Battilana, E. Ruedl, Air oxidation of a Mn-Cr austenitic steel of potential use for fusion reactor structural applications between 1073 and 1473 K at 105 Pa, J. Nucl. Mater. 182, 118–127 (1991).
[2004Kur] H. Kurokawa, K. Kawamura, T. Maruyama, Oxidation behavior of Fe–16Cr alloy interconnect for SOFC under hydrogen potential gradient, Solid State Ionics. 168, 13–21 (2004).
TCFE Validation Examples ǀ 32 of 62
www.thermocalc.com

[2005Tri] V. B. Trindade, U. Krupp, H.-J. Christ, M. J. Monteiro, F. C. Rizzo, Experimental Characterization and Computer-Based Simulation of Thermodynamics and Kinetics of Corrosion of Steels at High Temperatures, Materwiss. Werksttech. 36, 471–476 (2005).
[2009Kje] L. Kjellqvist, Thermodynamic description of the Fe-C-Cr-Mn-Ni-O system, PhD thesis, KTH Royal Institute of Technology, Stockholm, Sweden (2009).
TCFE Validation Examples ǀ 33 of 62
www.thermocalc.com
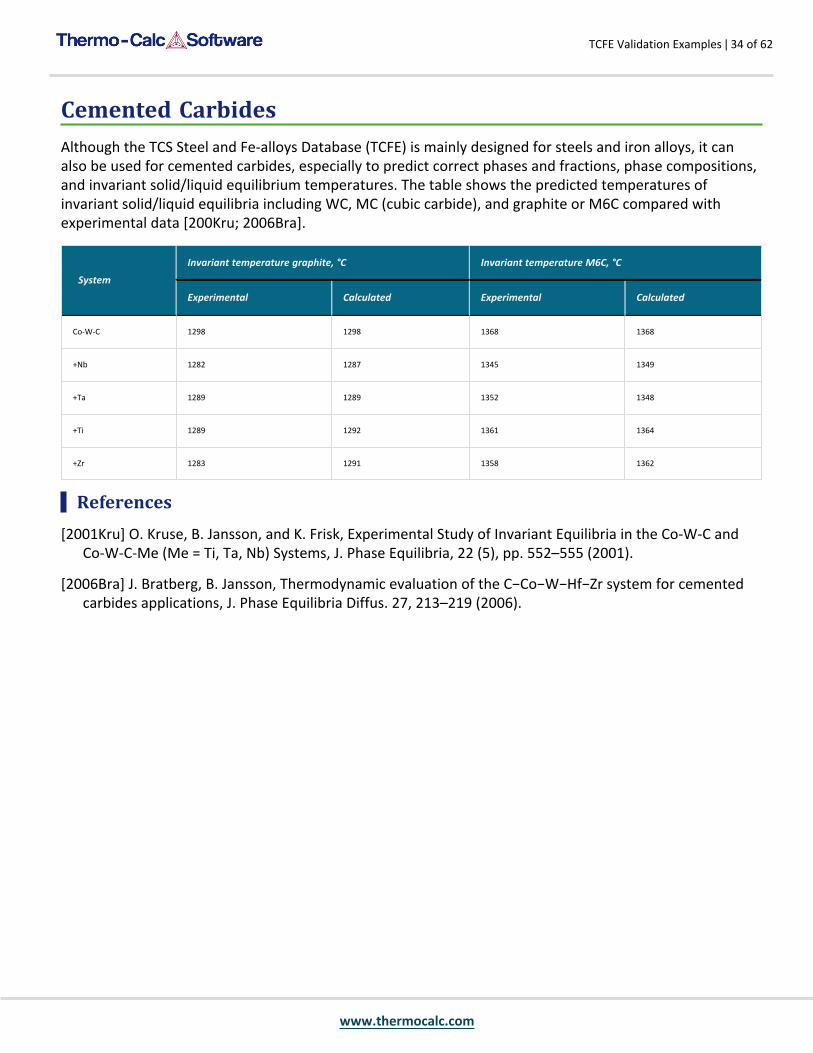
Cemented CarbidesAlthough the TCS Steel and Fe-alloys Database (TCFE) is mainly designed for steels and iron alloys, it can also be used for cemented carbides, especially to predict correct phases and fractions, phase compositions, and invariant solid/liquid equilibrium temperatures. The table shows the predicted temperatures of invariant solid/liquid equilibria including WC, MC (cubic carbide), and graphite or M6C compared with experimental data [200Kru; 2006Bra].
System
Invariant temperature graphite, °C Invariant temperature M6C, °C
Experimental Calculated Experimental Calculated
Co-W-C 1298 1298 1368 1368
+Nb 1282 1287 1345 1349
+Ta 1289 1289 1352 1348
+Ti 1289 1292 1361 1364
+Zr 1283 1291 1358 1362
References[2001Kru] O. Kruse, B. Jansson, and K. Frisk, Experimental Study of Invariant Equilibria in the Co-W-C and
Co-W-C-Me (Me = Ti, Ta, Nb) Systems, J. Phase Equilibria, 22 (5), pp. 552–555 (2001).
[2006Bra] J. Bratberg, B. Jansson, Thermodynamic evaluation of the C−Co−W−Hf−Zr system for cemented carbides applications, J. Phase Equilibria Diffus. 27, 213–219 (2006).
TCFE Validation Examples ǀ 34 of 62
www.thermocalc.com

Residual Element Tin (Sn)As one of the most common impurity elements in steel, tin (Sn), is brought into the steel through the furnace burden and ferroalloys used during the smelting process. As it is difficult to oxidize during the steelmaking process, it remains an impurity in the steel. For most steel grades, high tin content can seriously deteriorate the physical properties and performance.
The TCS Steel and Fe-alloys Database (TCFE) includes thermodynamic descriptions of many tin (Sn) related systems such as Fe-Sn-X (X=C, Cr, Cu, Mn, Nb, Ni, O, S, Si, W, Zn, Zr), and Al-C-Sn, allowing accurate calculations required to evaluate the effect of Sn content in ferrous alloys. For example, the calculated tin partition coefficient for equilibrium between austenite and liquid for various Fe-C-Sn and Fe-C-Si-Sn alloys is compared with the experimental data in the table below.
For the calculated results, the temperature or the carbon content was slightly changed to ensure an austenite/liquid equilibrium.
Alloy Holding T (K) Experimental Calculated
Fe-1.71C-0.76Sn (a) 1676 0.28 [1991Ima] 0.33
Fe-2.42C-1.64Sn (a) 1613 0.37 [1991Ima] 0.39
Fe-2.91C-1.03Sn (a) 1586 0.42 [1991Ima] 0.43
Fe-2.72C-0.52Sn 1573 0.41 [1991Ima] 0.45
Fe-3.26C-0.46Sn 1523 0.49 [1991Ima] 0.52
Fe-3.58C-1.1Sn 1485 0.63 [1991Ima] 0.59
Fe-3.77C-0.43Sn 1443 0.73 [1991Ima] 0.69
Fe-4.02C-1.66Sn (a) 1418 0.84 [1991Ima] 0.72
Fe-3.92C-1.01Sn-1.45Si (a) 1426 0.58 [1984Tan] 0.52
Fe-3.54C-1.53Sn-1.49Si (a) 1484 0.46 [1984Tan] 0.44
Fe-2.53C-1.37Sn-1.26Si 1558 0.32 [1984Tan] 0.38
Fe-2.07C-1.50Sn-1.41Si (a) 1623 0.28 [1984Tan] 0.31
Another example is given below by comparing the measured and calculated carbon solubility limits in Fe-C-Sn liquid at various temperatures for tin content up to 3.5 mass percent.
TCFE Validation Examples ǀ 35 of 62
www.thermocalc.com

Figure 26: Comparing the measured [1987Wan] and calculated carbon solubility limits in Fe-C-Sn liquid at various temperatures for tin content up to 3.5 mass percent.
References[1984Tan] T. Tanaka, Ph.D. thesis, Thermodynamics of the Equilibrium Distribution of Solute Elements
Between Solid and Liquid Phases in Iron Alloys, Osaka University Knowledge Archive, 1984.
[1987Wan] Z. Wang, L. Wang, T. Du, Study of the Thermodynamic Properties of Fe-C-Sn, Fe-C-Pb, Fe-C-Pb-Ce Liquid Solutions. J. Iron Steel Res. 7, 99–106 (1987), (in Chinese) (abstract in English).
[1991Ima] N. Imai, T. Tanaka, T. Yuki, T. Iida, Z. Morita, Equilibrium Distribution of Sn between Solid and Liquid Phases in Fe-Sn and Fe-C-Sn Alloys. Tetsu-to-Hagane. 77, 224–230 (1991).
TCFE Validation Examples ǀ 36 of 62
www.thermocalc.com

Electrical Resistivity of Ferrous Alloys and SteelsThe TCS Steel and Fe-alloys Database (TCFE) has thermophysical properties included. Below are examples about applications to electrical resistivity. The electrical resistivity thermophysical property data is included starting with version 12 (TCFE12).
For more information about the various thermophysical models, and when in Thermo-Calc, press F1 to search the online help. The details are found under a General Reference section.
You can find information on our website about the properties that can be calculated with Thermo-Calc and the Add-on Modules. Additional resources are added on a regular basis so keep checking back or subscribe to our newsletter.
The effect of various elements on the electrical resistivity of iron can be calculated.
Figure 27: The effect of alloying elements on the electrical resistivity of BCC Fe at 4.2 K [1969Ara].
With the electrical resistivity described for most binary and several ternary systems, predictions can also be made for multicomponent alloys such as austenitic stainless steels.
TCFE Validation Examples ǀ 37 of 62
www.thermocalc.com

Figure 28: Electrical resistivity of austenitic stainless steels predicted using the frozen-in conditions and compared with experimental data.
Reference[1969Ara] S. Arajs, F. C. Schwerer, R. M. Fisher, Residual Resistivities of Binary Iron Alloys. Phys. status
solidi. 33, 731–740 (1969).
TCFE Validation Examples ǀ 38 of 62
www.thermocalc.com

Thermal Conductivity of Ferrous Alloys and SteelsThe TCS Steel and Fe-alloys Database (TCFE) has thermophysical properties included. Below are examples about applications to thermal conductivity. The thermal conductivity thermophysical property data is included starting with version 12 (TCFE12).
For more information about the various thermophysical models, and when in Thermo-Calc, press F1 to search the online help. The details are found under a General Reference section.
You can find information on our website about the properties that can be calculated with Thermo-Calc and the Add-on Modules. Additional resources are added on a regular basis so keep checking back or subscribe to our newsletter.
With the thermal conductivity described for most binary and several ternary systems, predictions can be made for multicomponent alloys with different microstructures.
Figure 29: Thermal conductivity of Cr-Ni austenitic stainless steel alloys. The values are calculated by freezing-in the state at the typical annealing temperature of manufacture for each alloy.
TCFE Validation Examples ǀ 39 of 62
www.thermocalc.com
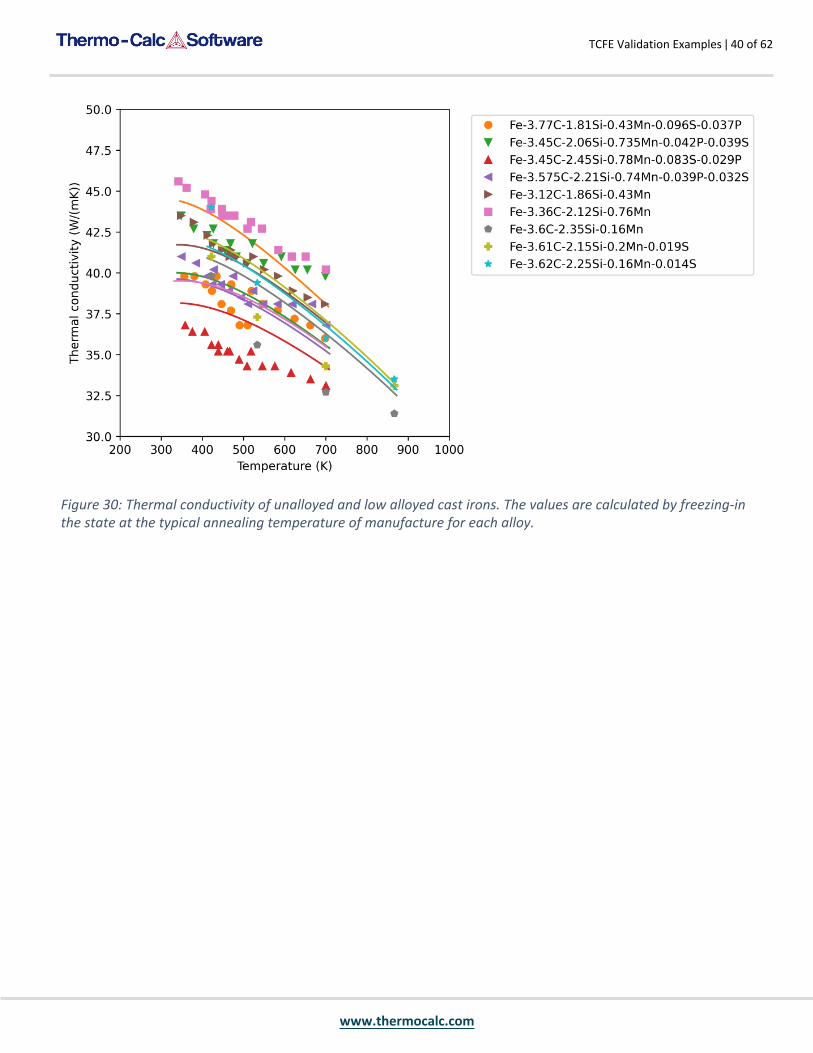
Figure 30: Thermal conductivity of unalloyed and low alloyed cast irons. The values are calculated by freezing-in the state at the typical annealing temperature of manufacture for each alloy.
TCFE Validation Examples ǀ 40 of 62
www.thermocalc.com

TCFE Calculation ExamplesValidation of the current version of the database against experimental data shows accurate predictions for various applications.
Some diagrams are calculated with earlier versions of the database. Negligible differences might be observed if these are recalculated with the most recent version. The diagrams are updated when there are considerable or significant improvements.
In this section:
Sulphurous Systems 42
Phosphorus Systems 43
Boron-containing Systems 45
Copper-containing Systems 47
Nb and V-Containing Systems 49
Ordered Phases 51
Galvanization Processes 53
Oxide Dispersion Strengthened (ODS) Steels 55
Blowhole Formation 56
Surface Tension: Cu-Fe, Fe-Ni, Cu-Ni, and Cu-Fe-Ni 58
Viscosity: B-Fe, Fe-Ni, and Fe-Ni-B 61
TCFE Calculation Examples ǀ 41 of 62
www.thermocalc.com

Sulphurous SystemsThe formation of sulfides in steels can be detrimental or beneficial. In either case it is important to understand and control the formation of sulfides. The TCS Steel and Fe-alloys Database (TCFE) includes the thermodynamics of Ca-Fe-Mn-Mg-S and its lower order systems. The Cr solubility in MnS is estimated based on the experimental data. Cu-sulfides are also added for some applications such as electrical steels.
Figure 31: The solubility lines in the FeS-MnS-MgS system in the temperature interval 873-1273 K.
Figure 32: The CaS-MgS-MnS isothermal sections plotted at 1073-1273 K together with experimental information as cited in [2016Dil].
Reference[2016Dil] D. Dilner, Thermodynamic description of the Fe–Mn–Ca–Mg–S system, Calphad. 53, 55–61 (2016).
TCFE Calculation Examples ǀ 42 of 62
www.thermocalc.com

Phosphorus SystemsSeveral phosphorus containing ternary iron-based systems such as Fe-X-P (X=Al, C, Co, Cr, Cu, Mn, Mo, Nb, Ni, Si, Ti, V, W) are included in the TCS Steel and Fe-alloys Database (TCFE), allowing accurate calculation of various types of phase equilibria for low to medium phosphorus contents in Fe-alloys.
Figure 33: The vertical section of the Fe-Ni-P system at 5 wt.% Ni, together with experimental data as cited in [2015Mie].
Figure 34: Calculated vertical section of the Fe-Mn-P system at mass ratio W(Fe):W(Mn)=9:1, together with experimental data as cited in [2014Mie].
TCFE Calculation Examples ǀ 43 of 62
www.thermocalc.com

References[2014Mie] J. Miettinen, G. Vassilev, Thermodynamic Description of Ternary Fe-X-P Systems. Part 3: Fe-Mn-
P, J. Phase Equilibria Diffus. 35, 587–594 (2014).
[2015Mie] J. Miettinen, G. Vassilev, Thermodynamic Description of Ternary Fe-X-P Systems. Part 6: Fe-Ni-P, J. Phase Equilibria Diffus. 36, 78–87 (2015).
TCFE Calculation Examples ǀ 44 of 62
www.thermocalc.com

Boron-containing SystemsThe TCS Steel and Fe-alloys Database (TCFE) includes thermodynamic descriptions of many boron containing systems such as Fe-X-B (X=C, Cr, Co, Mo, Mn, Nb, Ni, Si, Ti, V, W, Zr), and also some other ternary systems such as B-Cr-Mo, B-Cr-Ni, B-Ni-Si, and the quaternary B-Cr-Fe-Mo system.
Figure 35: A calculated isothermal section diagram of the Fe–Nb–B system at 1073 K, compared with the experimental phase fields [2008Yos].
Figure 36: A calculated Fe-Si-B isopleth at X(B)=0.10 with DSC data [2013Pol].
TCFE Calculation Examples ǀ 45 of 62
www.thermocalc.com
References[2008Yos] K. Yoshitomi, Y. Nakama, H. Ohtani, M. Hasebe, Thermodynamic Analysis of the Fe–Nb–B Ternary
System, ISIJ Int. 48, 835–844 (2008).
[2013Pol] M. G. Poletti, L. Battezzati, Assessment of the ternary Fe–Si–B phase diagram, Calphad. 43, 40–47 (2013).
TCFE Calculation Examples ǀ 46 of 62
www.thermocalc.com

Copper-containing SystemsThe TCS Steel and Fe-alloys Database (TCFE) includes descriptions of several copper-containing systems such as Cu-Fe-X (X=Al, C, Co, Cr, Mn, Mo, N, Ni, P, S, Si, Sn, W, Zr).
Examples of Cu-Fe-Mn and Cu-Fe-Mo are shown below.
Figure 37: Calculated vertical sections of the Cu-Fe-Mn system at 20 wt.% Cu [200Zha].
Figure 38: Calculated vertical sections of the Cu-Fe-Mo system at 5 wt.% Mo along with the experimental data [2000Wan].
TCFE Calculation Examples ǀ 47 of 62
www.thermocalc.com

References[2000Wan] C.-P. Wang, X.-J. Liu, I. Ohnuma, R. Kainuma, K. Ishida, and S.-M. Hao, Phase equilibria in the Cu-
Fe-Mo and Cu-Fe-Nb systems, J. Phase Equilibria, 21, pp. 54–62 (2000).
[2008Zha] L. Zhang, Y. Du, Q. Chen, H. Xu, F. Zheng, C. Tang, H. Chen, Thermodynamic description of the C-Fe-Mn system with key experiments and its practical applications. Int. J. Mater. Res. 99, 1306–1318 (2008).
TCFE Calculation Examples ǀ 48 of 62
www.thermocalc.com

Nb and V-Containing SystemsNiobium (Nb) and vanadium (V) are common alloying elements in different types of steels with high affinity to form carbides and nitrides. The TCS Steel and Fe-alloys Database (TCFE) includes several Nb and V systems such as Fe-Nb-X (X=Al, B, C, Co, Cr, Mn, N, Ni, O, P, Si, V, Zn, Zr) and Fe-V-X (X= B, C, Cr, Mn, Mo, Nb, N, P). Two of these systems are shown below.
Figure 39: Isothermal section of Fe-Mn-Nb system at 1573 K [2013aKhv].
Figure 40: Isothermal section of Fe-Nb-V system at 1573 K [2013bKhv].
References[2013aKhv] A. V. Khvan, B. Hallstedt, Thermodynamic assessment of Fe-Mn-Nb-N and Nb-C-N systems,
Calphad. 40, 10–15 (2013).
TCFE Calculation Examples ǀ 49 of 62
www.thermocalc.com

[2013bKhv] A. V. Khvan, K. Chang, B. Hallstedt, Thermodynamic assessment of the Fe–Nb–V system, Calphad. 43, 143–148 (2013).
TCFE Calculation Examples ǀ 50 of 62
www.thermocalc.com

Ordered PhasesThe ordered phases BCC_B2 and FCC_L12 are described with a two sub-lattice model using a single Gibbs energy curve which enables order/disorder transformations to be modeled as described by [2001Dup].
In TCS Steel and Fe-alloys Database (TCFE) (version TCFE10 and newer), the disordered part of BCC_B2 and FCC_L12 (A2_BCC and A1_FCC, respectively) are identical to the ordinary BCC_A2 and FCC_A1, but only 1 J/mole of formula unit less stable. This way the ordered phases BCC_B2 and FCC_L12 are split from the disordered BCC_A2 and FCC_A1, and the second order phase transitions are automatically displayed by a narrow first order transition.
Figure 41: Fe-Si phase diagram.
TCFE Calculation Examples ǀ 51 of 62
www.thermocalc.com

Figure 42: Isothermal section of Al-Fe-Ni phase diagram at 1173 K. Experimental data from [1984Hao; 1994Jia; 2005Hum; 2008Chu].
References[1984Hao] S. M. Hao, T. Takayama, K. Ishida, and T. Nishizawa, Miscibility gap in Fe-Ni-Al and Fe-Ni-Al-Co
systems, Metall. Trans. A, vol. 15, no. 10, pp. 1819–1828 (1984).
[1994Jia] C. C. Jia, K. Ishida, and T. Nishizawa, Partition of alloying elements between γ (A1), γ′ (L12), and β (B2) phases in Ni-Al base systems, Metall. Mater. Trans. A, vol. 25, no. 3, pp. 473–485 (1994).
[2001Dup] N. Dupin and B. Sundman, A thermodynamic database for Ni-base superalloys, Scand. J. Metall., vol. 30, no. 3, pp. 184–192 (2001).
[2005Him] Y. Himuro, Y. Tanaka, I. Ohnuma, R. Kainuma, and K. Ishida, Phase equilibria and γ′-L12 phase stability in the Ni-rich portion of Ni–Fe–Si and Ni–Fe–Al systems, Intermetallics, vol. 13, no. 6, pp. 620–630 (2005).
[2008Chu] I. Chumak, K. W. Richter, and H. Ipser, Isothermal Sections in the (Fe, Ni)-Rich Part of the Fe-Ni-Al Phase Diagram, J. Phase Equilibria Diffus., vol. 29, no. 4, pp. 300–304 (2008).
TCFE Calculation Examples ǀ 52 of 62
www.thermocalc.com

Galvanization ProcessesDue to its importance for hot-dip galvanization processes, Zinc (Zn) is included in the TCS Steel and Fe-alloys Database (TCFE) with the focus on the Zn corner of several systems such as Fe-X-Zn (X=Al, Cr, Cu, Mn, Nb, Ni, Si, Sn).
The following compares the Zn corners for the Al-Cr-Zn and Al-Fe-Zn systems.
Figure 43: Zn corner of Al-Cr-Zn system at 460 °C compared with experimental information [2007Fou].
Figure 44: Zn corner of Al-Fe-Zn system at 460 °C compared with experimental information cited by [2007Nak].
TCFE Calculation Examples ǀ 53 of 62
www.thermocalc.com

References[2007Fou] R. Fourmentin, M.-N. Avettand-Fènoël, G. Reumont, P. Perrot, Optimization of the Al–Cr–Zn
system at 460 °C, J. Mater. Sci. 42, 7934–7938 (2007).
[2007Nak] J. Nakano, D. V Malakhov, S. Yamaguchi, G. R. Purdy, A full thermodynamic optimization of the Zn–Fe–Al system within the 420–500 °C temperature range, Calphad. 31, 125–140 (2007).
TCFE Calculation Examples ǀ 54 of 62
www.thermocalc.com

Oxide Dispersion Strengthened (ODS) SteelsThe TCS Steel and Fe-alloys Database (TCFE) includes the element Y, mainly for the purpose of the development of oxide dispersion strengthened (ODS) steels. This example shows the oxides in the isothermal section of Fe-Y-O calculated at 1000 °C.
Figure 45: Isothermal section of Fe-Y-O calculated at 1000 °C.
TCFE Calculation Examples ǀ 55 of 62
www.thermocalc.com
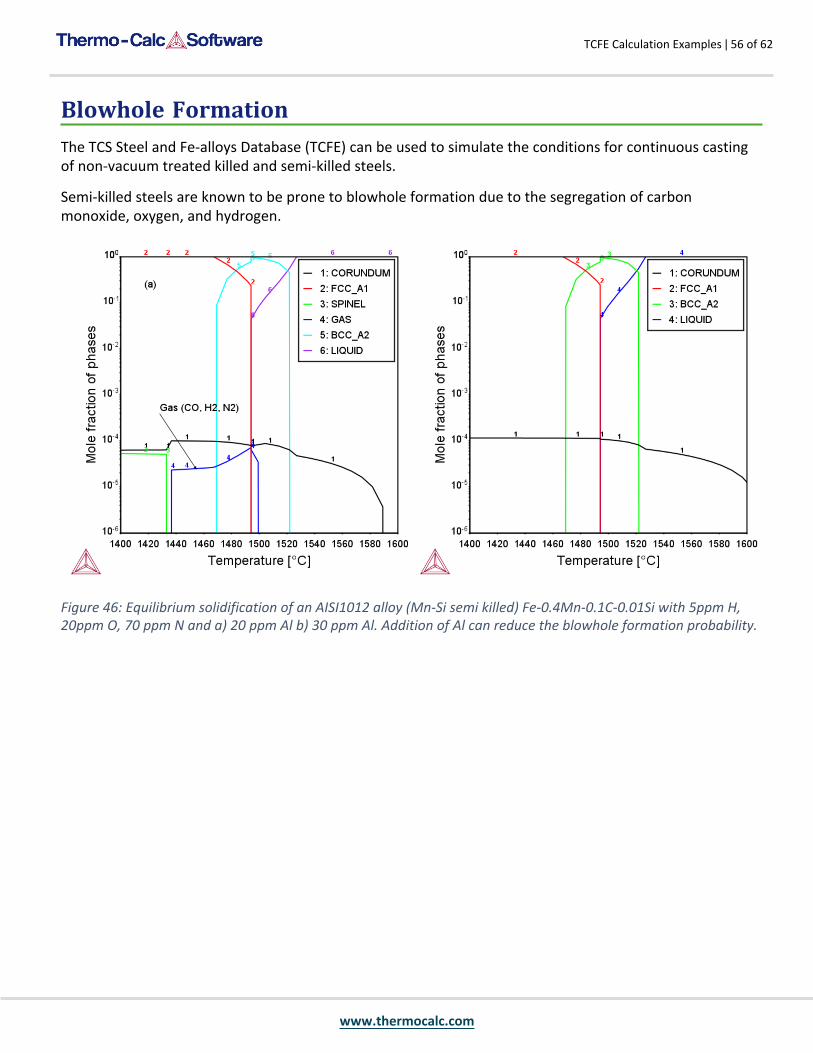
Blowhole FormationThe TCS Steel and Fe-alloys Database (TCFE) can be used to simulate the conditions for continuous casting of non-vacuum treated killed and semi-killed steels.
Semi-killed steels are known to be prone to blowhole formation due to the segregation of carbon monoxide, oxygen, and hydrogen.
Figure 46: Equilibrium solidification of an AISI1012 alloy (Mn-Si semi killed) Fe-0.4Mn-0.1C-0.01Si with 5ppm H, 20ppm O, 70 ppm N and a) 20 ppm Al b) 30 ppm Al. Addition of Al can reduce the blowhole formation probability.
TCFE Calculation Examples ǀ 56 of 62
www.thermocalc.com

Figure 47: Scheil solidification of an AISI1012 alloy (Mn-Si semi killed) Fe-0.4Mn-0.1C-0.01Si with 5ppm H, 20ppm O, 70 ppm N and 30 ppm Al. In Scheil solidification conditions addition of 30ppm Al is not enough to prevent the blowholes when nitrogen and hydrogen are present in the steel.
Read more about Scheil Solidification Simulations on our website. If you are in Thermo-Calc, press F1 to search the help to learn about using Scheil.
TCFE Calculation Examples ǀ 57 of 62
www.thermocalc.com

Surface Tension: Cu-Fe, Fe-Ni, Cu-Ni, and Cu-Fe-NiThe TCS Steel and Fe-alloys Database (TCFE) can be used to calculate the surface tension of the metallic liquid. Below are a few examples of the calculated surface tension curves compared with the experimental data. The surface tension thermophysical property data is included with the database as of version 11 (TCFE11).
For more information about the various thermophysical models, and when in Thermo-Calc, press F1 to search the online help. The details are found under a General Reference section.
You can find information on our website about the properties that can be calculated with Thermo-Calc and the Add-on Modules. Additional resources are added on a regular basis so keep checking back or subscribe to our newsletter.
Cu-Fe, Fe-Ni, and Cu-Ni
Figure 48: Calculated surface tension of Cu-Fe liquid binary alloy. The experimental data are taken from [1993Lee; 2005Bri; 2005Egr].
TCFE Calculation Examples ǀ 58 of 62
www.thermocalc.com
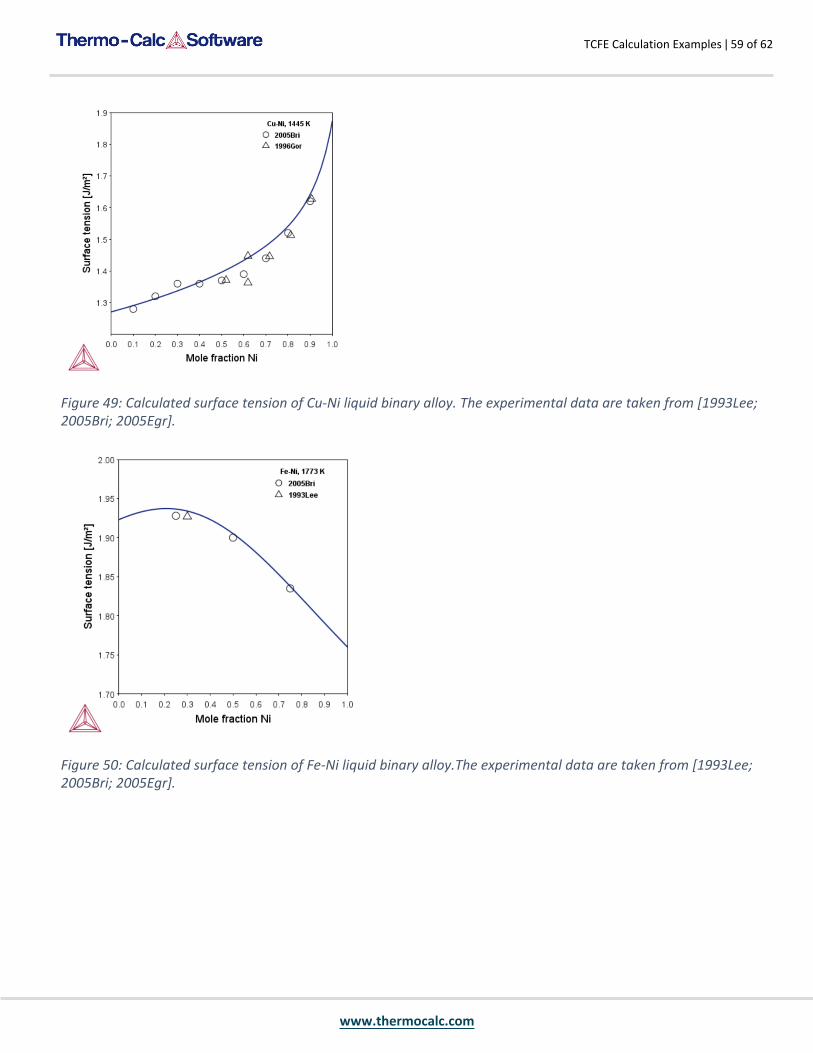
Figure 49: Calculated surface tension of Cu-Ni liquid binary alloy. The experimental data are taken from [1993Lee; 2005Bri; 2005Egr].
Figure 50: Calculated surface tension of Fe-Ni liquid binary alloy.The experimental data are taken from [1993Lee; 2005Bri; 2005Egr].
TCFE Calculation Examples ǀ 59 of 62
www.thermocalc.com

Cu-Fe-Ni
Figure 51: Calculated surface tension of Cu-Fe-Ni liquid ternary alloys. The experimental data are taken from [2006Bri].
References[1993Lee] H.-K. Lee, M. G. Frohberg, J. P. Hajra, The determination of the surface tensions of liquid iron,
nickel and iron-nickel alloys using the electromagnetic oscillating droplet technique. Steel Res. 64, 191–196 (1993).
[2005Bri] J. Brillo, I. Egry, Surface tension of nickel, copper, iron and their binary alloys. J. Mater. Sci. 40, 2213–2216 (2005).
[2005Egr] I. Egry, J. Brillo, T. Matsushita, Thermophysical properties of liquid Cu–Fe–Ni alloys. Mater. Sci. Eng. A. 413–414, 460–464 (2005).
[2006Bri] J. Brillo, I. Egry, T. Matsushita, Density and Surface Tension of Liquid Ternary Ni–Cu–Fe Alloys. Int. J. Thermophys. 27, 1778–1791 (2006).
TCFE Calculation Examples ǀ 60 of 62
www.thermocalc.com

Viscosity: B-Fe, Fe-Ni, and Fe-Ni-BThe TCS Steel and Fe-alloys Database (TCFE)can be used to calculate the viscosity of the metallic liquid. Below are a few examples of the calculated viscosity curves compared with the experimental data. The viscosity thermophysical property data is included with the database as of version 10 (TCFE10).
For more information about the various thermophysical models, and when in Thermo-Calc, press F1 to search the online help. The details are found under a General Reference section.
You can find information on our website about the properties that can be calculated with Thermo-Calc and the Add-on Modules. Additional resources are added on a regular basis so keep checking back or subscribe to our newsletter.
B-Fe and Fe-NiThe calculated viscosity of the B-Fe and Fe-Ni binary systems are compared with the experimental data.
Figure 52: Dynamic viscosity of B-Fe at 1773 K (left) and Fe-Ni at 1873 K (right). Experimental data are from [1999Tom; 2005Lad; 2005Sat; 2015Tak].
Fe-Ni-BThe following shows the dynamic viscosity of two liquid B-Fe-Ni alloys as a function of temperature along with the experimental data from [2004Yam]. They have used oscillating crucible method for measuring the viscosity of these alloys from melting point to about 1673 K under a purified helium atmosphere.
TCFE Calculation Examples ǀ 61 of 62
www.thermocalc.com

Figure 53: Calculated dynamic viscosity of Fe-Ni-B ternary alloys as a function of temperature. Melting temperature of the alloys are marked on the plot. The experimental data are taken from [2004Yam].
References[1999Tom] M. Tomut, H. Chiriac, M. Marinescu, F. Necula, Viscosity and surface tension measurements on
Fe-rich FeB liquid alloys. J. Non. Cryst. Solids. 250–252, 655–659 (1999).
[2004Yam] T. Yamasaki, N. Yufune, H. Ushio, D. Okai, T. Fukami, H. M. Kimura, A. Inoue, Viscosity measurements for Fe–Ni–B and Fe–Ni–Al–B liquid alloys by an oscillating crucible method. Mater. Sci. Eng. A. 375–377, 705–708 (2004).
[2005Lad] V. I. Lad’yanov, A. L. Bel’tyukov, A. I. Shishmarin, The temperature and concentration dependences of viscosity of the Fe-B system melts. Rasplavy, 34–40 (2005).
[2005Sat] Y. Sato, K. Sugisawa, D. Aoki, T. Yamamura, Viscosities of Fe–Ni, Fe–Co and Ni–Co binary melts. Meas. Sci. Technol. 16, 363–371 (2005).
[2015Tak] O. Takeda, N. Ouchi, Y. Sato, Viscosity of Molten Fe–B Alloy. ISIJ Int. 55, 500–503 (2015).
TCFE Calculation Examples ǀ 62 of 62
www.thermocalc.com


![TCS High Entropy Alloys Database (TCHEA4)€¦ · TCS High Entropy Alloys Database (TCHEA) is a thermodynamic database for high entropy alloys (HEA) [2004, Yeh; 2006, Yeh]. HEAs are](https://static.documents.pub/doc/80x56/60628f270c7c55437c6a10ae/tcs-high-entropy-alloys-database-tchea4-tcs-high-entropy-alloys-database-tchea.jpg)
