This document contains forward-looking statements within the meaning of the federal securities laws, including the Private Securities Litigation Reform
Act of 1995, including statements giving expectations or predictions of future financial or business performance or conditions. We intend these forward-
looking statements to be covered by the safe harbor provisions of the federal securities laws. Forward-looking statements are typically identified by
words such as “believe,” “expect,” “anticipate,” “intend,” “target,” “estimate,” “continue,” “positions,” “prospects” or “potential,” by future conditional verbs
such as “will,” “would,” “should,” “could” or “may”, or by variations of such words or by similar expressions.
In particular, any projections or expectations regarding the proposed business combination transaction between TD Ameritrade Holding Corporation
(“TD Ameritrade”) and Scottrade Financial Services, Inc. (“Scottrade”) described herein, our future revenues, expenses, earnings, capital expenditures,
effective tax rates, client trading activity, accounts or stock price, as well as the assumptions on which such expectations are based, are forward-looking
statements. These statements reflect only our current expectations and are not guarantees of future performance or results. These statements involve
risks, uncertainties and assumptions that change over time and could cause actual results or performance to differ materially from those contained in
the forward- looking statements and historical performance. In addition to the risks, uncertainties and assumptions previously disclosed in TD
Ameritrade’s reports and documents filed with the Securities and Exchange Commission (“SEC”) and those identified elsewhere in this communication,
these risks, uncertainties and assumptions include, but are not limited to: the ability to obtain regulatory approvals and meet other closing conditions to
the proposed transaction, including the completion of the merger between Scottrade Bank and TD Bank, N.A., on the expected terms and schedule;
delay in closing the transaction; difficulties and delays in integrating the TD Ameritrade and Scottrade businesses or fully realizing cost savings and
other benefits; business disruption following the proposed transaction; changes in asset quality and credit risk; the inability to sustain revenue and
earnings growth; changes in interest rates and capital markets; inflation; customer borrowing, repayment, investment and deposit practices; customer
disintermediation; the introduction, withdrawal, success and timing of business initiatives; competitive conditions; TD Ameritrade’s and Scottrade’s
businesses experiencing disruptions due to transaction-related uncertainty or other factors making it more difficult to maintain relationships with
employees, customers, other business partners or governmental entities; the inability to realize synergies or to implement integration plans and other
consequences associated with mergers, acquisitions and divestitures; economic conditions; and the impact, extent and timing of technological changes,
capital management activities, and other actions of regulatory bodies and legislative and regulatory actions and reforms, general economic and political
conditions and other securities industry risks, fluctuations in interest rates, stock market fluctuations and changes in client trading activity, credit risk with
clients and counterparties, increased competition, systems failures, delays and capacity constraints, network security risks, liquidity risks, new laws and
regulations affecting our businesses, regulatory and legal matters and uncertainties and other risk factors described in our latest Annual Report on Form
10-K, filed with the SEC on Nov. 20, 2015 and our subsequent Quarterly Reports on Form 10-Q filed thereafter and other reports and documents we file
with the SEC. Annualized, pro forma, projected and estimated numbers are used for illustrative purpose only, are not forecasts and may not reflect
actual results.
These forward-looking statements are subject to numerous assumptions, risks and uncertainties which change over time and speak only as of the date
on which the statements were made. We undertake no obligation to update or revise publicly any forward- looking statements, whether as a result of
new information, future events or otherwise, except to the extent required by the federal securities laws.
Forward-looking Statements Important Information
2
TD Ameritrade & Scottrade
Transaction Details
3
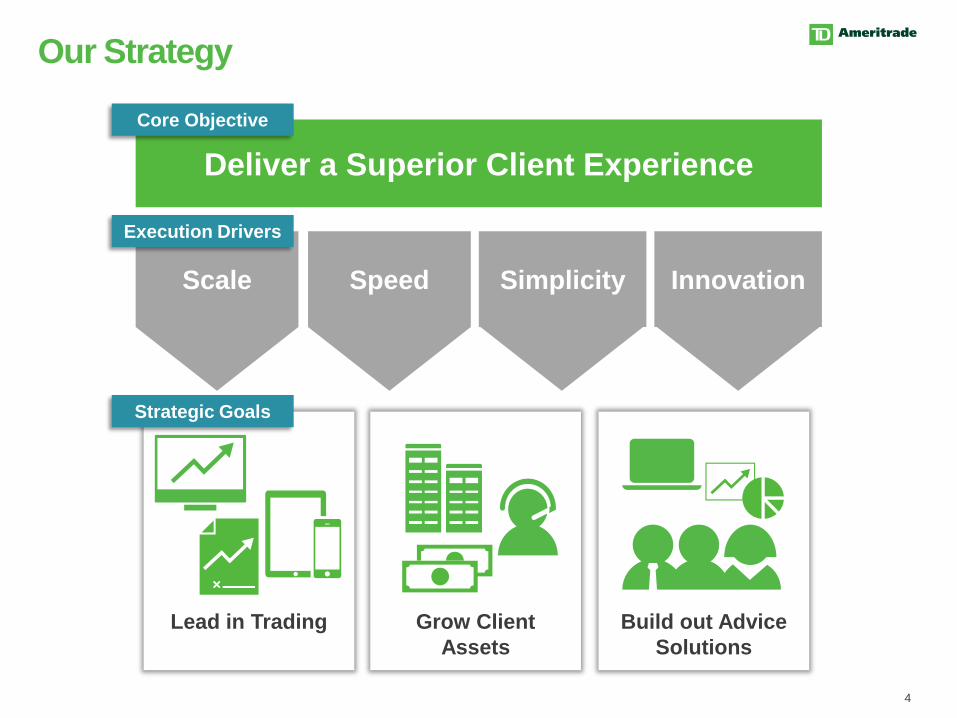
Our Strategy
4
Deliver a Superior Client Experience
Scale Speed Simplicity Innovation
Lead in Trading Grow Client
Assets
Build out Advice
Solutions
Core Objective
Execution Drivers
Strategic Goals
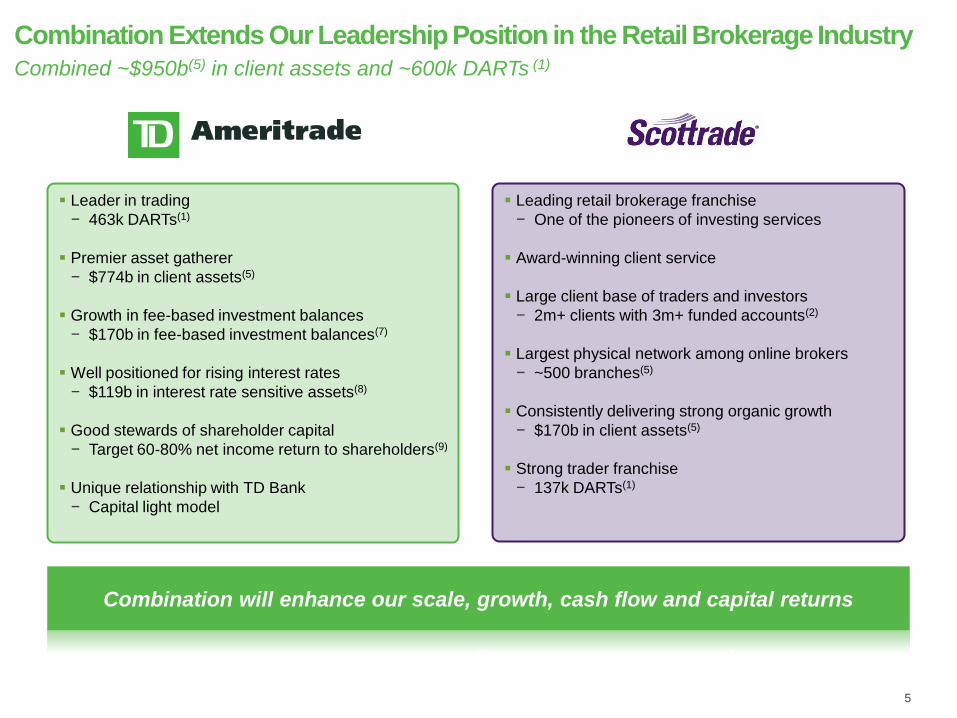
Combination Extends Our Leadership Position in the Retail Brokerage Industry
5
Combined ~$950b(5) in client assets and ~600k DARTs (1)
Leader in trading
− 463k DARTs(1)
Premier asset gatherer
− $774b in client assets(5)
Growth in fee-based investment balances
− $170b in fee-based investment balances(7)
Well positioned for rising interest rates
− $119b in interest rate sensitive assets(8)
Good stewards of shareholder capital
− Target 60-80% net income return to shareholders(9)
Unique relationship with TD Bank
− Capital light model
Leading retail brokerage franchise
− One of the pioneers of investing services
Award-winning client service
Large client base of traders and investors
− 2m+ clients with 3m+ funded accounts(2)
Largest physical network among online brokers
− ~500 branches(5)
Consistently delivering strong organic growth
− $170b in client assets(5)
Strong trader franchise
− 137k DARTs(1)
Combination will enhance our scale, growth, cash flow and capital returns
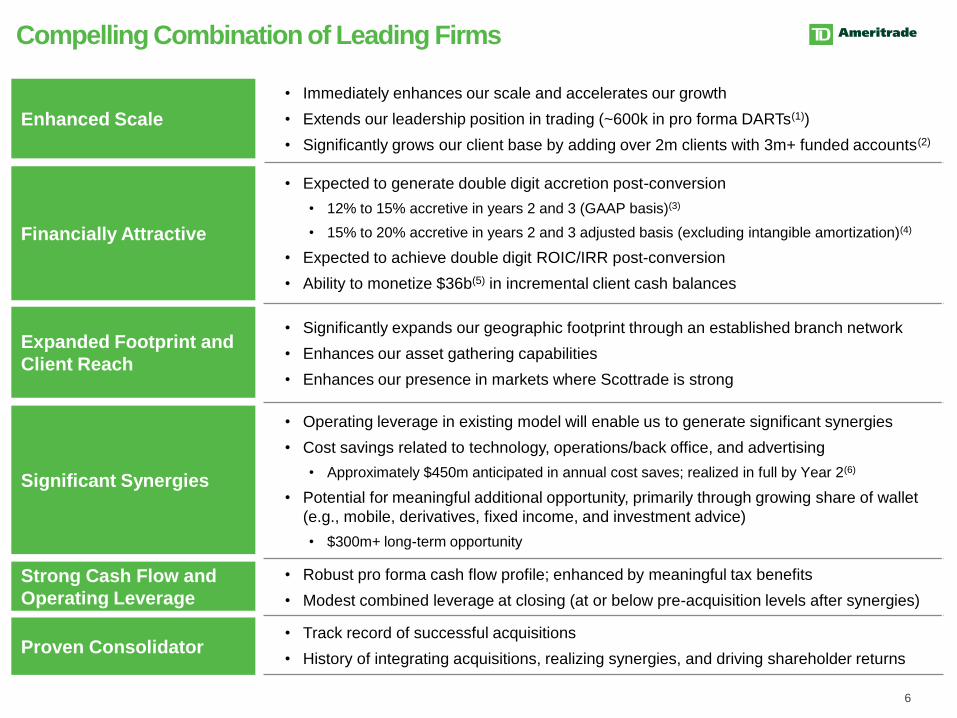
• Immediately enhances our scale and accelerates our growth
• Extends our leadership position in trading (~600k in pro forma DARTs(1))
• Significantly grows our client base by adding over 2m clients with 3m+ funded accounts(2)
• Expected to generate double digit accretion post-conversion
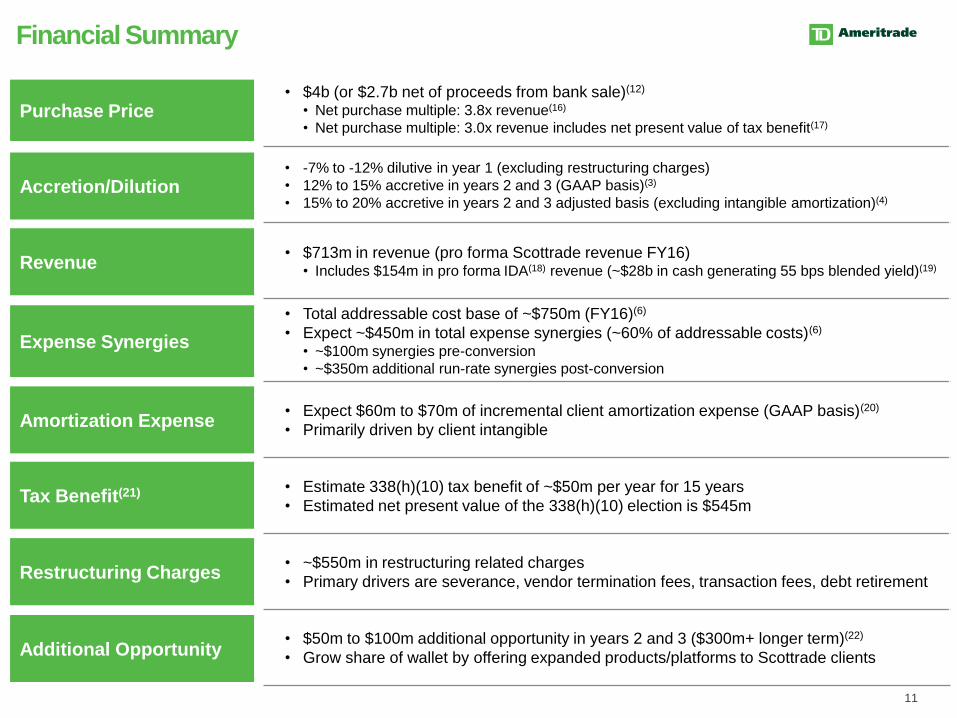
• 12% to 15% accretive in years 2 and 3 (GAAP basis)(3)
• 15% to 20% accretive in years 2 and 3 adjusted basis (excluding intangible amortization)(4)
• Expected to achieve double digit ROIC/IRR post-conversion
• Ability to monetize $36b(5) in incremental client cash balances
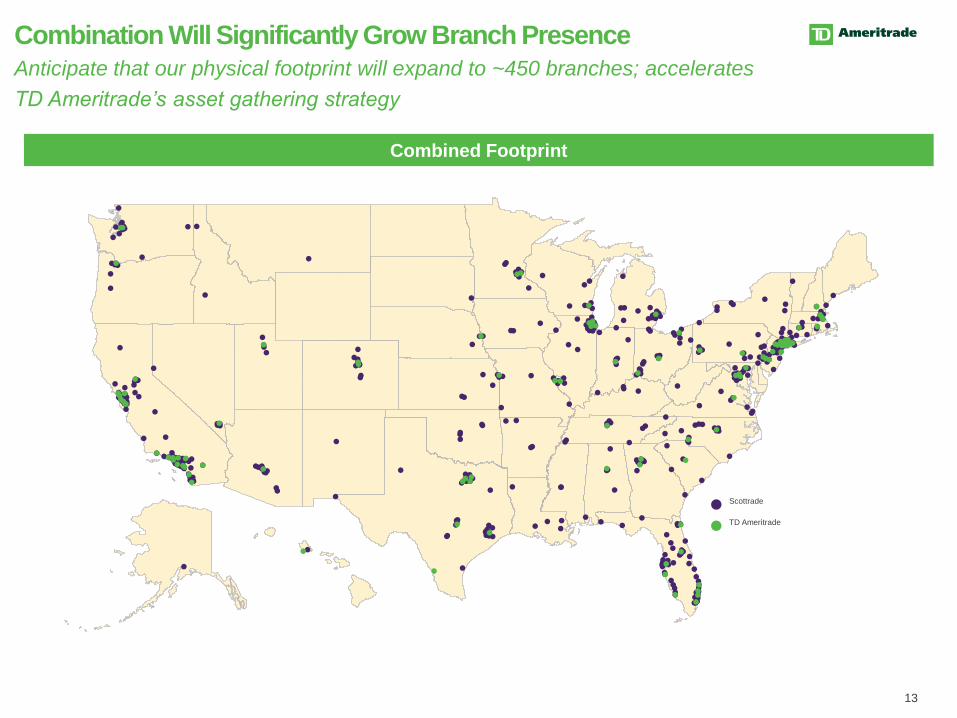
• Significantly expands our geographic footprint through an established branch network
• Enhances our asset gathering capabilities
• Enhances our presence in markets where Scottrade is strong
• Operating leverage in existing model will enable us to generate significant synergies
• Cost savings related to technology, operations/back office, and advertising
• Approximately $450m anticipated in annual cost saves; realized in full by Year 2(6)
• Potential for meaningful additional opportunity, primarily through growing share of wallet
(e.g., mobile, derivatives, fixed income, and investment advice)
• $300m+ long-term opportunity
• Robust pro forma cash flow profile; enhanced by meaningful tax benefits
• Modest combined leverage at closing (at or below pre-acquisition levels after synergies)
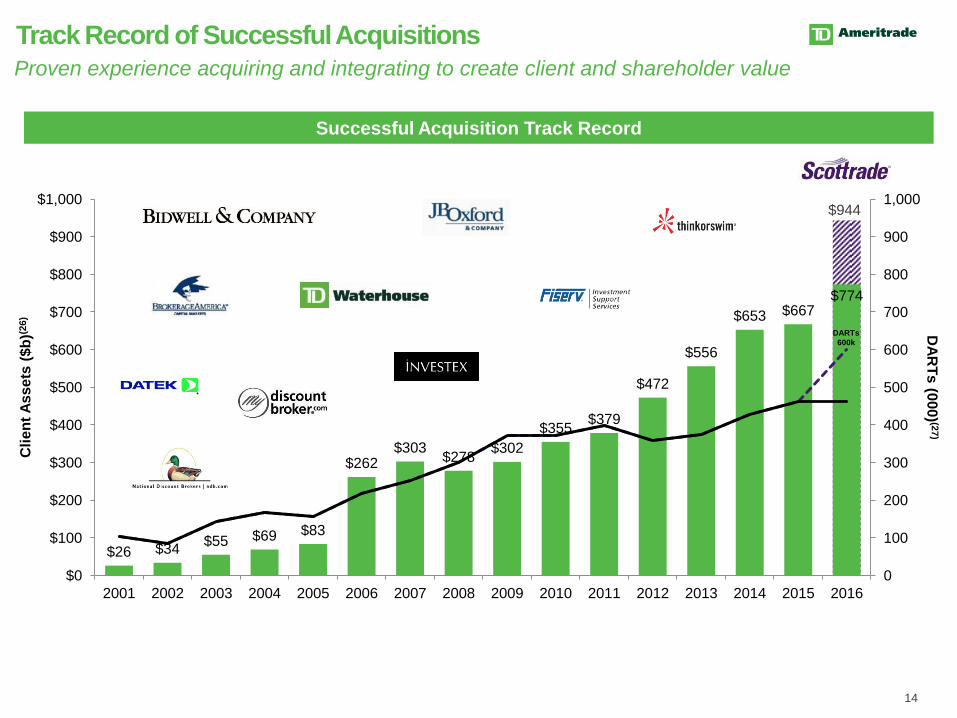
• Track record of successful acquisitions
• History of integrating acquisitions, realizing synergies, and driving shareholder returns
Compelling Combination of Leading Firms
6
Enhanced Scale
Financially Attractive
Expanded Footprint and
Client Reach
Significant Synergies
Strong Cash Flow and
Operating Leverage
Proven Consolidator
7
Combination Benefits Both Scottrade and TD Ameritrade Clients
Client Benefits Client Benefits
A transaction which drives benefits for both client bases
Comprehensive investor education tools
Sophisticated trading platforms and advanced mobile trading technology
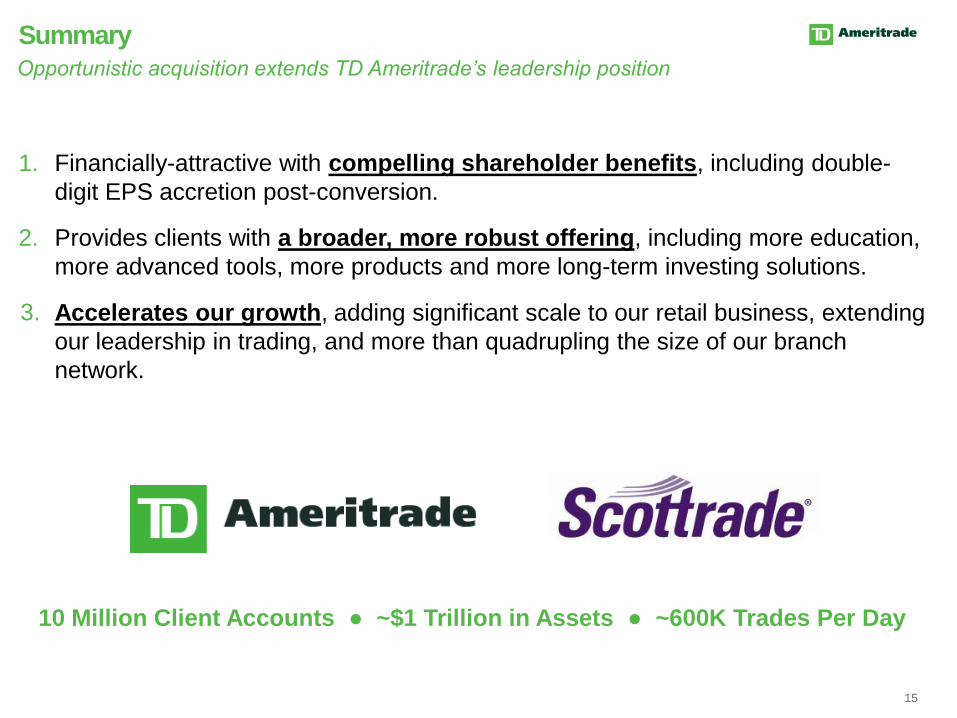
our leadership in trading, and more than quadrupling the size of our branch
network.
15
Summary
Opportunistic acquisition extends TD Ameritrade’s leadership position
10 Million Client Accounts ● ~$1 Trillion in Assets ● ~600K Trades Per Day
3.
Q4 FY 2016
Financial Results Summary
16
September Quarter 2016 Summary of Notable Items in the Quarter
17
Notable operating expense items of approximately $46M, impacting earnings
per share by $0.05 unfavorably
Terminated various projects and contracts
Better positioned to implement strategic plans
Notable tax items of approximately $17M, impacting earnings per share by
$0.03 favorably
Incentives on software development
Impacts go-forward tax rate assumptions
Balance growth is key
$59
$68 $73 $76
$84 1.37%
1.17% 1.11%
1.09% 1.09%
0.95%
0.80%
1.00%
1.20%
1.40%
$40
$50
$60
$70
$80
$90
FY12 FY13 FY14 FY15 FY16 FY17
IDA(12) Net Revenue
18
Outlook Range ($M)(6) IDA Net Revenue ($M)
Outlook Range ($B) Avg. IDA Balance ($B)
Net Yield Outlook Range
$870
$828 $804 $820 $839
$926
$500
$600
$700
$800
$900
$1,000
FY12 FY13 FY14 FY15 FY16 FY17
$955
$90
$94
Fiscal 2016
Record average balances
Stable net yields
Record client net buying
activity
8 bps decline from Jun Q to
Sep Q including 4 bps due
to higher balances and 3
bps due to increased FDIC
insurance
Fiscal 2017
Balance growth expected to
compress yields
1.00%
Fiscal 2017 Outlook Range(6)
Financial Macro Assumptions Key Metrics
High
$1.80 EPS 10% Market Growth NNA(1) $85B / 11%(2)
42% Pre-Tax
Margin
Increasing Fed Funds
Increasing Yield Curve TPD 505K
Operating expense growth
of 3% NIM(16) 1.38% / IDA(12) 1.00%
Low
$1.50 EPS 0% Market Growth NNA $55B / 7%
38% Pre-Tax
Margin
No change in Fed Funds,
flattening Yield Curve TPD 475K
Operating expense growth
of (1%)
NIM 1.27% / IDA 0.95%
19
Conclusion
20
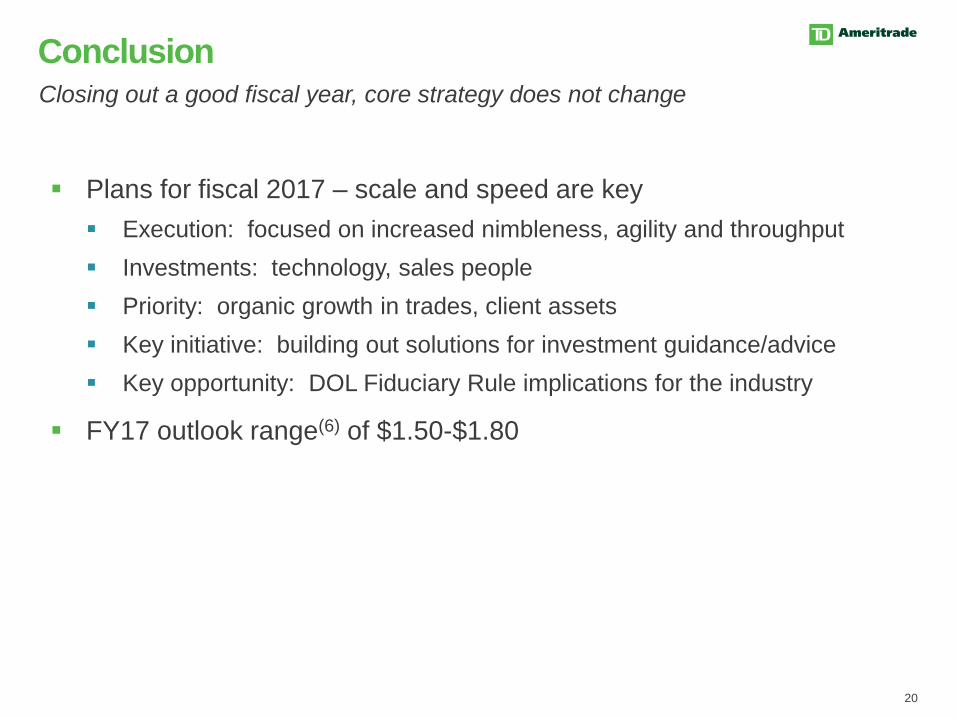
Plans for fiscal 2017 – scale and speed are key
Execution: focused on increased nimbleness, agility and throughput
Investments: technology, sales people
Priority: organic growth in trades, client assets
Key initiative: building out solutions for investment guidance/advice
Key opportunity: DOL Fiduciary Rule implications for the industry
FY17 outlook range(6) of $1.50-$1.80
Closing out a good fiscal year, core strategy does not change
Q&A
21
22
1. Total revenue-generating client trades divided by the number of trading days in the period as of FY16 (October 2015 to September 2016)
2. Funded accounts as of September 30, 2016
3. Accretion/(dilution) includes moving Scottrade sweep deposits into the IDA, client attrition, expense synergies, additional opportunities, incremental client intangible amortization expense,
and incremental corporate debt expense
4. Accretion/(dilution) on an adjusted basis excludes current deal client intangible amortization expense
5. Data as of September 30, 2016
6. $450m in annual cost saves is based on addressable operating expense base of $750m (excluding depreciation & amortization and corporate debt interest expense) for 12 month period
ending September 30, 2016
7. Market fee-based investment balances plus money market mutual funds as of September 30, 2016
8. Interest rate sensitive assets consist of spread-based assets and money market mutual funds as of September 30, 2016
9. FY16 target of 60-80%, actual return was 80%
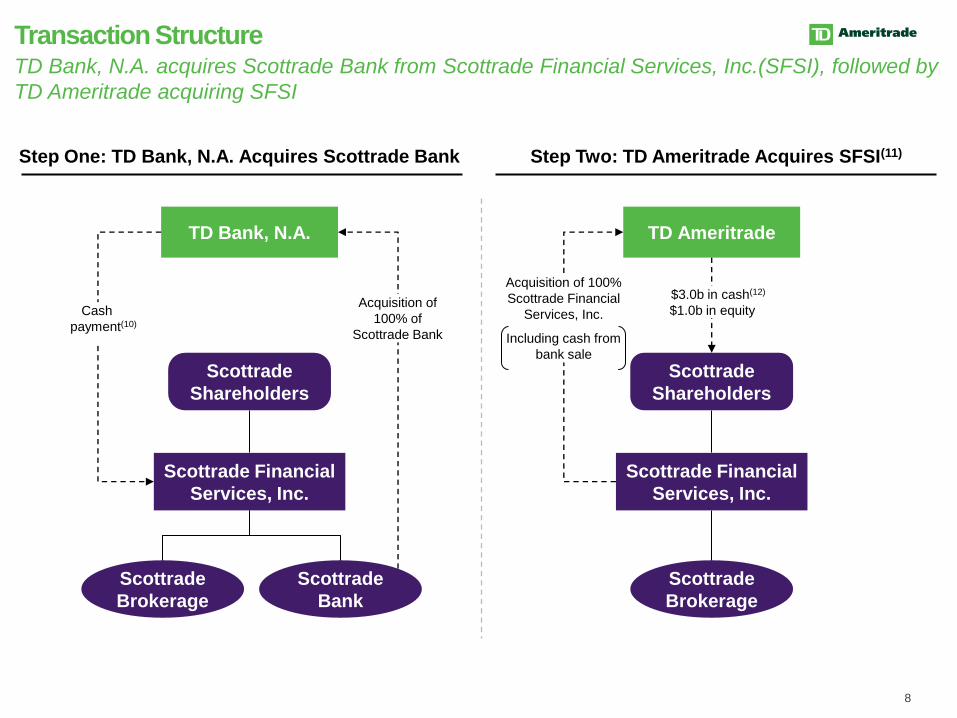
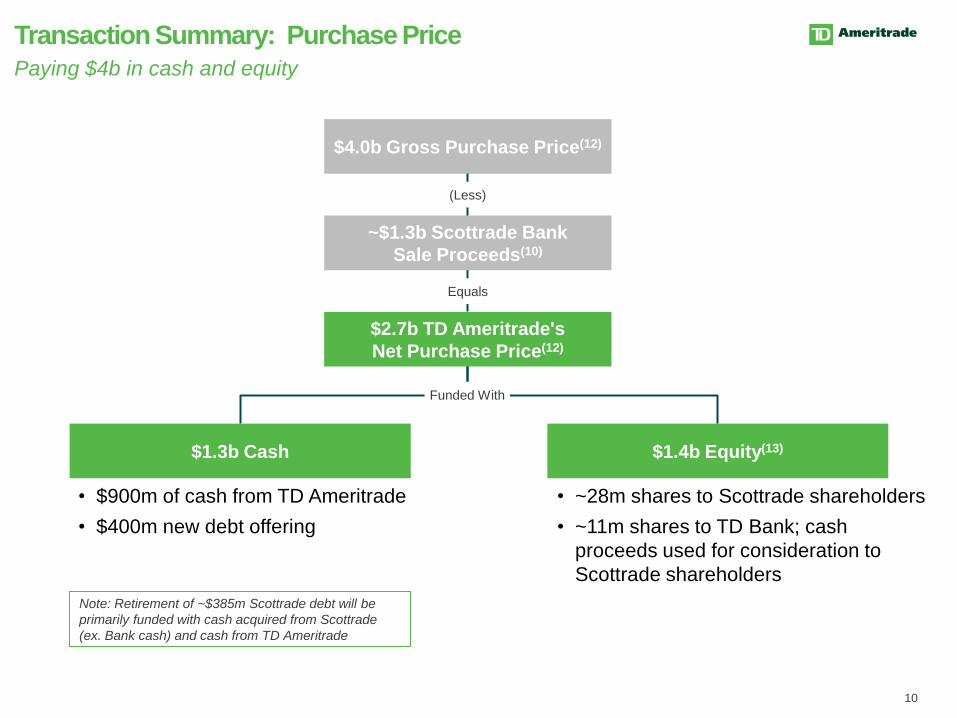
10. Purchase price for Scottrade Bank is based on Scottrade Bank tangible book value at closing; Scottrade Bank tangible book value was ~$1.3b as of September 30, 2016
11. Excludes debt retirement and transaction fees and expenses
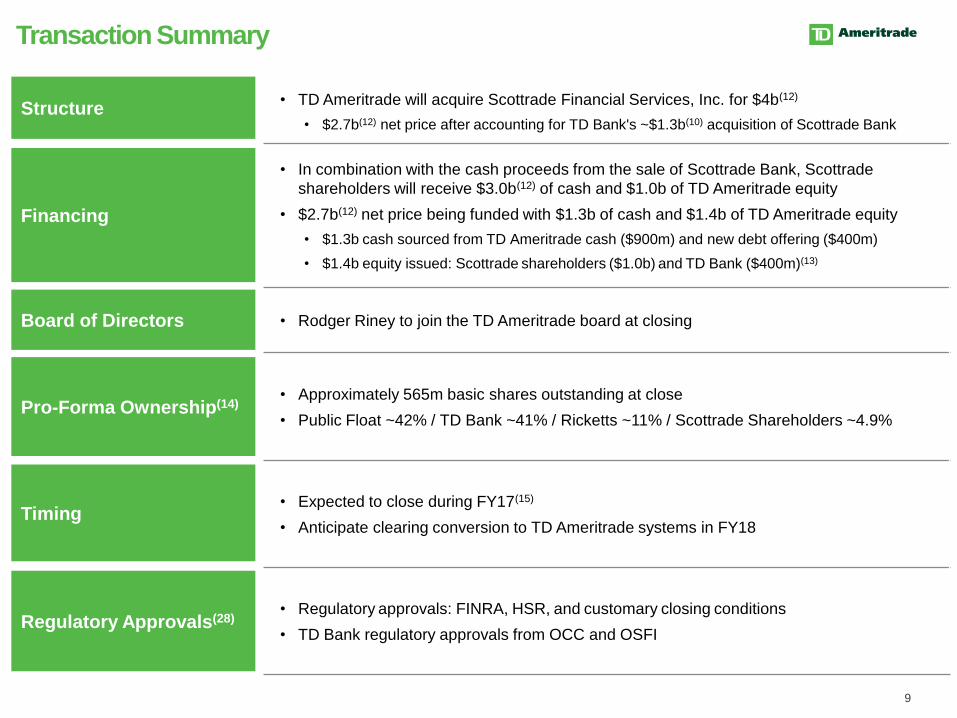
12. Purchase price for Scottrade Financial Services, Inc. is subject to closing adjustments
13. Equity issuance is calculated based on closing share price of $36.12 as of October 7, 2016
14. Pro forma ownership breakdown assumes current ownership plus new shares issued under the Scottrade transaction
15. Subject to regulatory approvals and satisfaction of other closing conditions
16. Net purchase multiple is calculated based on $2.7b net purchase price over pro forma Scottrade revenue for FY16
17. Net purchase multiple is calculated based on $2.2b net purchase price (includes net present value of 338(h)(10) tax benefit of $545m) over pro forma Scottrade revenue for FY16
18. Client cash is held in FDIC-insured deposit accounts (IDA)
19. $28b excludes $5b in deposits at the broker/dealer
20. Incremental client intangible amortization expense is an estimate and subject to final assessment
21. Tax benefit is on a cash basis (non-GAAP); net present value of 338(h)(10) is estimated based on final purchase price and the projected book value at close
22. ~$50m and ~$100m in additional opportunity are assumptions for year 1 and year 2 after clearing conversion
23. May be some overlap due to common clients
24. Revenue per trade includes commissions and order routing revenue
25. % of derivatives trades (options, futures, and foreign exchange) over total revenue trades
26. Client assets represent ending assets in reported period
27. Total revenue-generating client trades divided by the number of trading days in the entire fiscal year
28. Additional regulatory approvals may be required (e.g., Federal Reserve)
Appendix: Scottrade Footnotes
Appendix: Earnings Footnotes
23
1. Net new assets (NNA) consist of total client asset inflows, less total client asset outflows, excluding activity from business combinations. Client asset inflows
include interest and dividend payments and exclude changes in client assets due to market fluctuations. Net new assets are measured based on the market
value of the assets as of the date of the inflows and outflows.
2. NNA growth rate is annualized net new assets as a % of client assets as of the beginning of the period.
3. Market fee-based investment balances plus money market mutual funds. Ending balances as of Sep. 30, 2016.
4. Interest rate sensitive assets consist of spread-based assets and money market mutual funds. Ending balances as of Sep. 30, 2016.
5. See attached reconciliation of non-GAAP financial measures.
6. FY17 forecast per 10/24/16 outlook statement.
7. Derivatives include options, futures and foreign exchange (Forex) trades per day.
8. Total revenue-generating client trades divided by the number of trading days in the period. This metric is also known as average client trades per day.
9. Average commissions and transaction fees per trade.
10. Market fee-based plus money market mutual fund revenue.
11. Return on average stockholders’ equity (annualized).
12. Client cash is held in FDIC-insured deposit accounts (IDA) at TD Bank, N.A. and TD Bank USA, N.A. TD Ameritrade, TD Bank, N.A., and TD Bank USA, N.A.
are affiliated through The Toronto-Dominion Bank.
13. Ending balances as of Sep. 30, 2016 consisted of $11.8B in client margin balances, $8.7B in segregated cash, and $4.1B in other balances.
14. Impact on spread-based and money market mutual fund revenues in the next twelve months following an interest rate increase. Assumes fed funds increase
results in a parallel shift to the LIBOR/SWAP yield curve. Range impacted by client sharing assumptions. Over 90% of the benefit in year one is attributable to
short-term rates. EPS range corresponds to $65-$80M of revenue. Model updated as of 10/19/16.
Appendix: Earnings Footnotes
24
15. Cash used for share repurchases and dividends divided by net income excluding amortization of intangible assets. Excludes shares repurchased for payroll
taxes on equity award distributions.
16. NIM (net interest margin) is a measure of the net yield on our average spread-based assets.
17. Client assets invested in money market mutual funds, other mutual funds and Company programs such as AdvisorDirect and Amerivest, on which we earn fee
revenues.
18. Client and brokerage-related asset balances, including client margin balances, segregated cash, insured deposit account balances, deposits paid on securities
borrowing and other cash and interest-earning investment balances
Net Income Excluding Amortization of Intangible Assets (1)
Quarter Ended
September 30,
September 30, September 30,
September 30,
Quarter Ended Fiscal Year Ended
Fiscal Year Ended
EPS Excluding Amortization of Intangible Assets (1)
Note: The term "GAAP" in the following explanations refers to generally accepted accounting principles in the United States.
(1)
(2)
(3)
Net income and earnings per share (EPS) excluding amortization of intangible assets are non-GAAP financial measures as defined by SEC Regulation G. We define net income excluding amortization of intangible assets as net income adjusted to remove
the after-tax effect of amortization of acquired intangible assets. We consider net income and EPS excluding amortization of intangible assets important measures of our financial performance. Amortization of acquired intangible assets is excluded
because management does not believe it is indicative of underlying business performance. Net income and EPS excluding amortization of intangible assets should be considered in addition to, rather than as a substitute for, GAAP net income and EPS.
EBITDA (earnings before interest, taxes, depreciation and amortization) is considered a non-GAAP financial measure as defined by SEC Regulation G. We consider EBITDA an important measure of our financial performance and of our ability to
generate cash flows to service debt, fund capital expenditures and fund other corporate investing and financing activities. EBITDA is used as the denominator in the consolidated leverage ratio calculation for covenant purposes under our senior revolving
credit facility. EBITDA eliminates the non-cash effect of tangible asset depreciation and amortization and intangible asset amortization. EBITDA should be considered in addition to, rather than as a substitute for, pre-tax income, net income and cash
flows from operating activities.
Operating expenses excluding advertising is considered a non-GAAP financial measure as defined by SEC Regulation G. Operating expenses excluding advertising consists of total operating expenses, adjusted to remove advertising expense. We
consider operating expenses excluding advertising an important measure of the financial performance of our ongoing business. Advertising spending is excluded because it is largely at the discretion of the Company, varies significantly from period to
period based on market conditions and generally relates to the acquisition of future revenues through new accounts rather than current revenues from existing accounts. Operating expenses excluding advertising should be considered in addition to, rather
than as a substitute for, total operating expenses.