36
TD Bank Group Investor Presentation Q3 2016

TD Bank Group Investor Presentation Q3 2016
Caution regarding forward-looking statements From time to time, the Bank (as defined in this document) makes written and/or oral forward-looking statements, including in this document, in other filings with Canadian regulators or the United States (U.S.) Securities and Exchange Commission (SEC), and in other communications. In addition, representatives of the Bank may make forward-looking statements orally to analysts, investors, the media and others. All such statements are made pursuant to the “safe harbour” provisions of, and are intended to be forward-looking statements under, applicable Canadian and U.S. securities legislation, including the U.S. Private Securities Litigation Reform Act of 1995. Forward-looking statements include, but are not limited to, statements made in this document, the Management’s Discussion and Analysis (“2015 MD&A”) in the Bank’s 2015 Annual Report under the heading “Economic Summary and Outlook”, for each business segment under headings “Business Outlook and Focus for 2016”, and in other statements regarding the Bank’s objectives and priorities for 2016 and beyond and strategies to achieve them, the regulatory environment in which the Bank operates, and the Bank’s anticipated financial performance. Forward-looking statements are typically identified by words such as “will”, “should”, “believe”, “expect”, “anticipate”, “intend”, “estimate”, “plan”, “may”, and “could”.
By their very nature, these forward-looking statements require the Bank to make assumptions and are subject to inherent risks and uncertainties, general and specific. Especially in light of the uncertainty related to the physical, financial, economic, political, and regulatory environments, such risks and uncertainties – many of which are beyond the Bank’s control and the effects of which can be difficult to predict – may cause actual results to differ materially from the expectations expressed in the forward-looking statements. Risk factors that could cause, individually or in the aggregate, such differences include: credit, market (including equity, commodity, foreign exchange, and interest rate), liquidity, operational (including technology and infrastructure), reputational, insurance, strategic, regulatory, legal, environmental, capital adequacy, and other risks. Examples of such risk factors include the general business and economic conditions in the regions in which the Bank operates; the ability of the Bank to execute on key priorities, including the successful completion of acquisitions, business retention, and strategic plans and to attract, develop and retain key executives; disruptions in or attacks (including cyber-attacks) on the Bank’s information technology, internet, network access or other voice or data communications systems or services; the evolution of various types of fraud or other criminal behaviour to which the Bank is exposed; the failure of third parties to comply with their obligations to the Bank or its affiliates, including relating to the care and control of information; the impact of new and changes to, or application of, current laws and regulations, including without limitation tax laws, risk-based capital guidelines and liquidity regulatory guidance; the overall difficult litigation environment, including in the U.S.; increased competition, including through internet and mobile banking and non-traditional competitors; changes to the Bank’s credit ratings; changes in currency and interest rates (including the possibility of negative interest rates); increased funding costs and market volatility due to market illiquidity and competition for funding; critical accounting estimates and changes to accounting standards, policies, and methods used by the Bank; existing and potential international debt crises; and the occurrence of natural and unnatural catastrophic events and claims resulting from such events. The Bank cautions that the preceding list is not exhaustive of all possible risk factors and other factors could also adversely affect the Bank’s results. For more detailed information, please refer to the “Risk Factors and Management” section of the 2015 MD&A, as may be updated in subsequently filed quarterly reports to shareholders and news releases (as applicable) related to any transactions or events discussed under the heading “Significant Events” in the relevant MD&A, which applicable releases may be found on www.td.com. All such factors should be considered carefully, as well as other uncertainties and potential events, and the inherent uncertainty of forward-looking statements, when making decisions with respect to the Bank and the Bank cautions readers not to place undue reliance on the Bank’s forward-looking statements.
Material economic assumptions underlying the forward-looking statements contained in this document are set out in the 2015 MD&A under the headings “Economic Summary and Outlook”, and for each business segment, “Business Outlook and Focus for 2016”, each as may be updated in subsequently filed quarterly reports to shareholders.
Any forward-looking statements contained in this document represent the views of management only as of the date hereof and are presented for the purpose of assisting the Bank’s shareholders and analysts in understanding the Bank’s financial position, objectives and priorities and anticipated financial performance as at and for the periods ended on the dates presented, and may not be appropriate for other purposes. The Bank does not undertake to update any forward-looking statements, whether written or oral, that may be made from time to time by or on its behalf, except as required under applicable securities legislation.
1
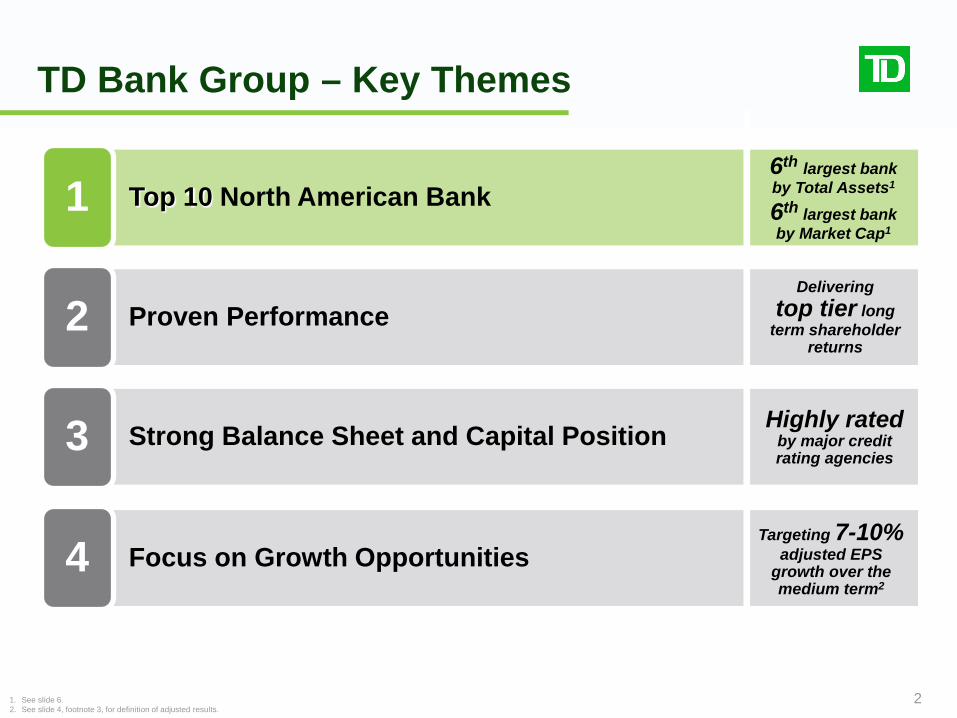
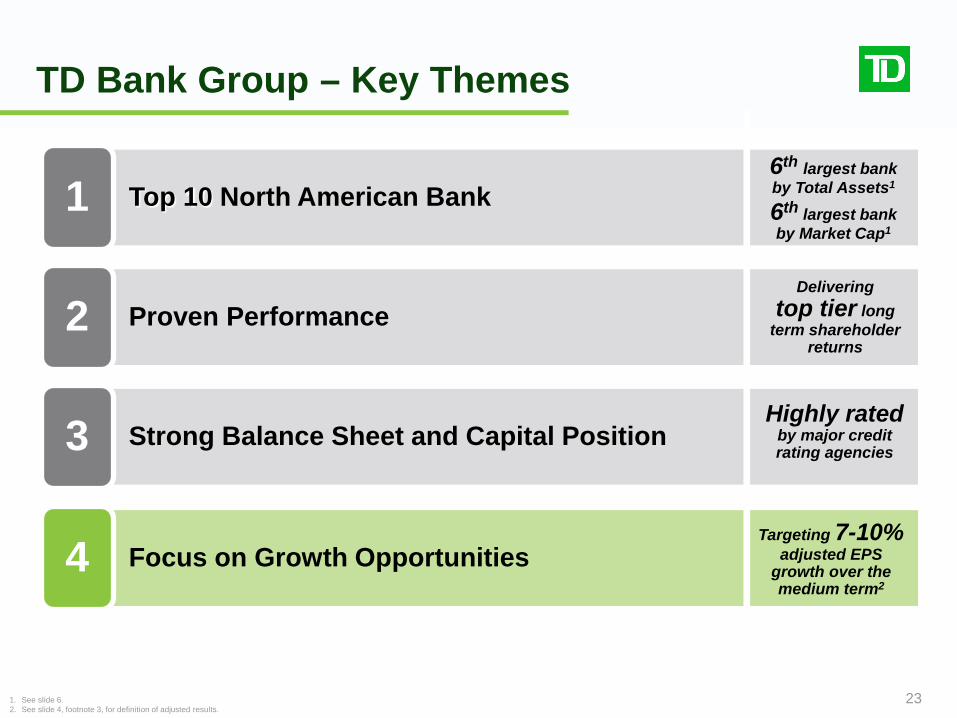
TD Bank Group – Key Themes
2
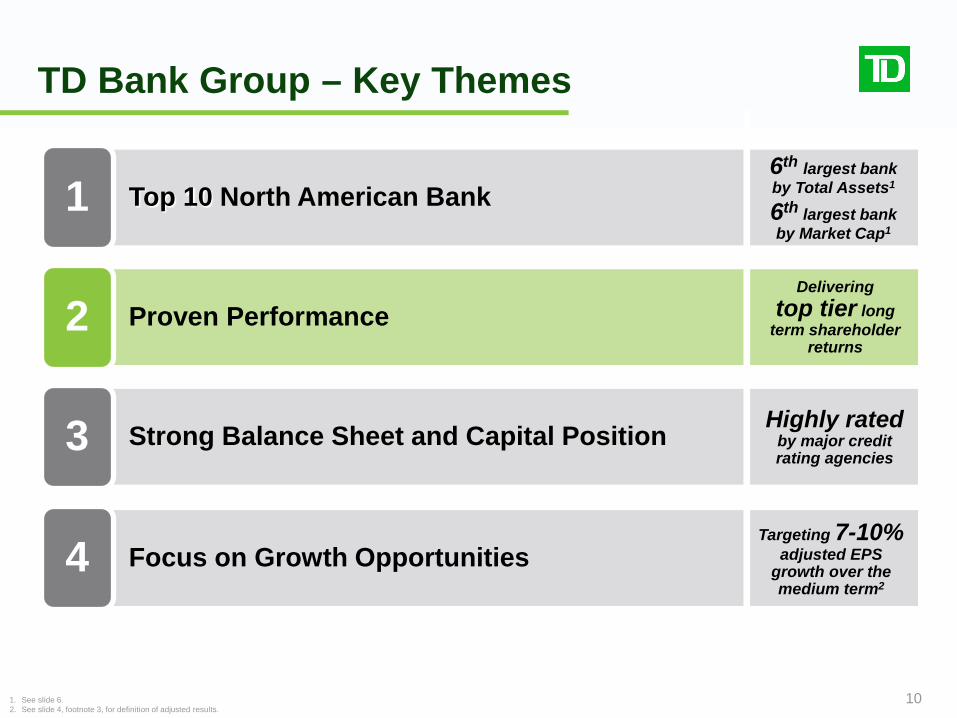
Top 10 North American Bank 1
Proven Performance
Strong Balance Sheet and Capital Position
Focus on Growth Opportunities 4
2
3
6th largest bank by Total Assets1
6th largest bank by Market Cap1
Targeting 7-10% adjusted EPS
growth over the medium term2
Highly rated by major credit rating agencies
Delivering top tier long
term shareholder returns
1. See slide 6. 2. See slide 4, footnote 3, for definition of adjusted results.
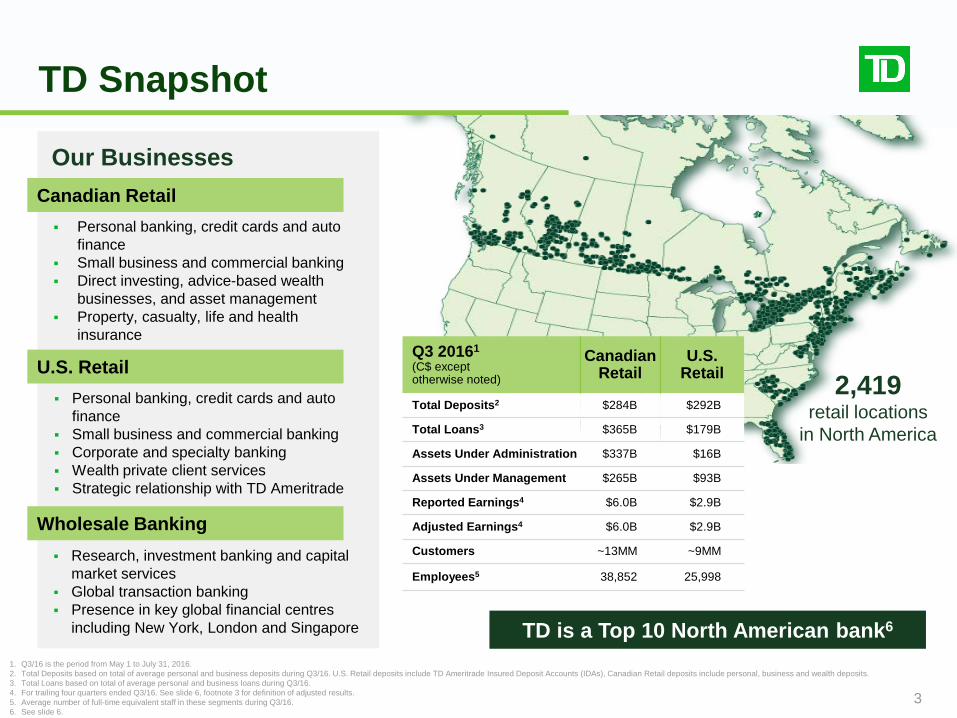
TD Snapshot
3
Our Businesses
Personal banking, credit cards and auto finance
Small business and commercial banking Corporate and specialty banking Wealth private client services Strategic relationship with TD Ameritrade
1. Q3/16 is the period from May 1 to July 31, 2016. 2. Total Deposits based on total of average personal and business deposits during Q3/16. U.S. Retail deposits include TD Ameritrade Insured Deposit Accounts (IDAs), Canadian Retail deposits include personal, business and wealth deposits. 3. Total Loans based on total of average personal and business loans during Q3/16. 4. For trailing four quarters ended Q3/16. See slide 6, footnote 3 for definition of adjusted results. 5. Average number of full-time equivalent staff in these segments during Q3/16. 6. See slide 6.
Personal banking, credit cards and auto finance
Small business and commercial banking Direct investing, advice-based wealth
businesses, and asset management Property, casualty, life and health
insurance
Research, investment banking and capital market services
Global transaction banking Presence in key global financial centres
including New York, London and Singapore
2,419 retail locations
in North America
Q3 20161 (C$ except otherwise noted)
Canadian Retail
U.S. Retail
Total Deposits2 $284B $292B
Total Loans3 $365B $179B
Assets Under Administration $337B $16B
Assets Under Management $265B $93B
Reported Earnings4 $6.0B $2.9B
Adjusted Earnings4 $6.0B $2.9B
Customers ~13MM ~9MM
Employees5 38,852 25,998
TD is a Top 10 North American bank6
Canadian Retail
U.S. Retail
Wholesale Banking
1. See slide 6. 2. For long term debt (deposits) of The Toronto-Dominion Bank, as at July 31, 2016. Credit ratings are not recommendations
to purchase, sell, or hold a financial obligation inasmuch as they do not comment on market price or suitability for a particular investor. Ratings are subject to revision or withdrawal at any time by the rating organization. 3. The Bank prepares its consolidated financial statements in accordance with International Financial Reporting Standards (IFRS), the current generally accepted accounting principles (GAAP), and refers to results prepared in accordance with IFRS as
the ”reported” results. The Bank also utilizes non-GAAP financial measures to arrive at "adjusted" results (i.e. reported results excluding “items of note”, net of income taxes) to assess each of its businesses and measure overall Bank performance. Please see "How the Bank Reports" in the Q3 2016 Report to Shareholders for further explanation and a reconciliation of the Bank’s non-GAAP measures to reported basis results.
4. Retail includes Canadian Retail and U.S. Retail segments. See slide 7 for more detail. 5. Return on risk-weighted assets (RWA) is calculated as adjusted net income available to common shareholders divided by average RWA. As compared to North American Peers (RY, BNS, CM, BMO, C, BAC, JPM, WFC, PNC and USB). Adjusted on a
comparable basis to exclude identified non-underlying items. For Canadian peers, based on Q3/16 results ended July 31, 2016. For U.S. Peers, based on Q2/16 results ended June 30, 2016.
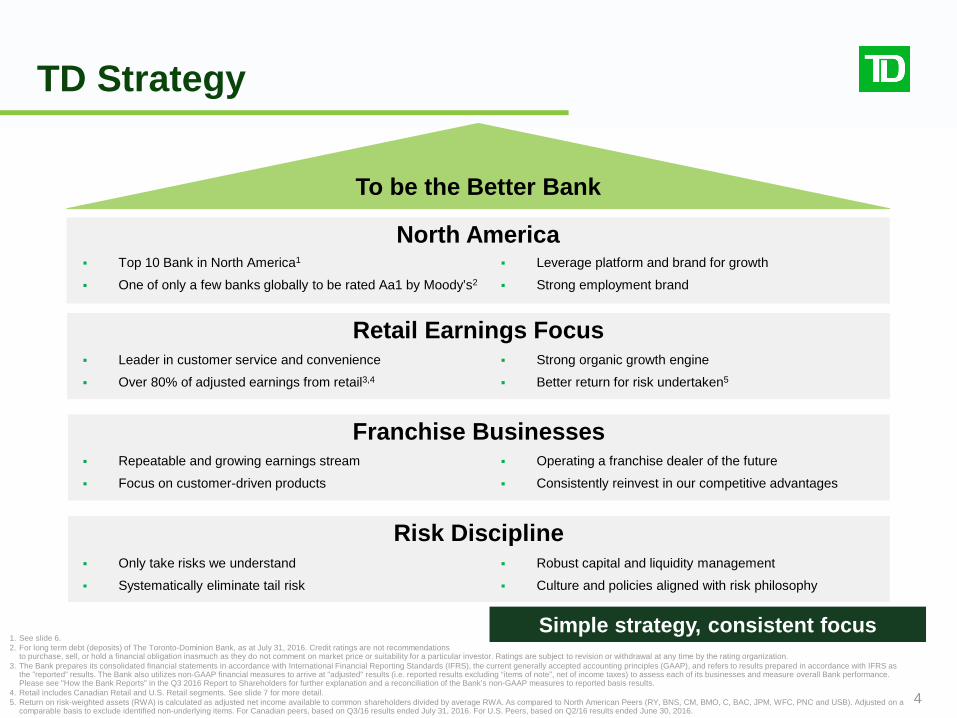
TD Strategy
4
To be the Better Bank
Franchise Businesses
Retail Earnings Focus
Risk Discipline
North America Top 10 Bank in North America1
One of only a few banks globally to be rated Aa1 by Moody’s2
Leverage platform and brand for growth
Strong employment brand
Leader in customer service and convenience
Over 80% of adjusted earnings from retail3,4
Repeatable and growing earnings stream
Focus on customer-driven products
Only take risks we understand
Systematically eliminate tail risk
Strong organic growth engine
Better return for risk undertaken5
Operating a franchise dealer of the future
Consistently reinvest in our competitive advantages
Robust capital and liquidity management
Culture and policies aligned with risk philosophy
Simple strategy, consistent focus
Competing in Attractive Markets
5
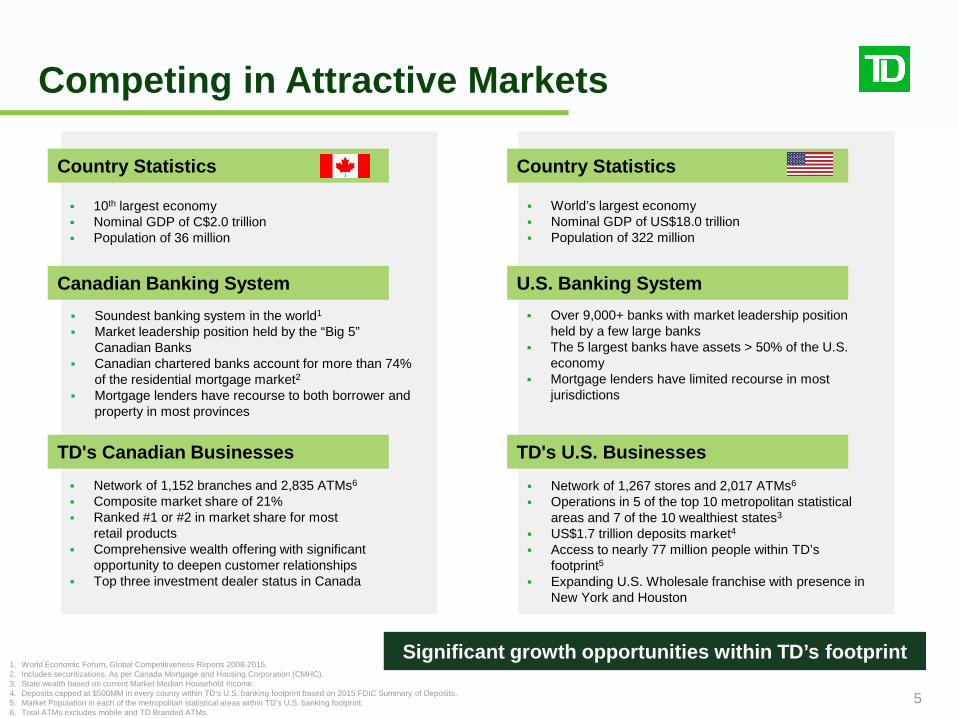
10th largest economy Nominal GDP of C$2.0 trillion Population of 36 million
World’s largest economy Nominal GDP of US$18.0 trillion Population of 322 million
Country Statistics
1. World Economic Forum, Global Competitiveness Reports 2008-2015. 2. Includes securitizations. As per Canada Mortgage and Housing Corporation (CMHC). 3. State wealth based on current Market Median Household Income. 4. Deposits capped at $500MM in every county within TD’s U.S. banking footprint based on 2015 FDIC Summary of Deposits. 5. Market Population in each of the metropolitan statistical areas within TD’s U.S. banking footprint. 6. Total ATMs excludes mobile and TD Branded ATMs.
Soundest banking system in the world1
Market leadership position held by the “Big 5” Canadian Banks
Canadian chartered banks account for more than 74% of the residential mortgage market2
Mortgage lenders have recourse to both borrower and property in most provinces
Network of 1,152 branches and 2,835 ATMs6
Composite market share of 21% Ranked #1 or #2 in market share for most
retail products Comprehensive wealth offering with significant
opportunity to deepen customer relationships Top three investment dealer status in Canada
Over 9,000+ banks with market leadership position held by a few large banks
The 5 largest banks have assets > 50% of the U.S. economy
Mortgage lenders have limited recourse in most jurisdictions
Network of 1,267 stores and 2,017 ATMs6
Operations in 5 of the top 10 metropolitan statistical areas and 7 of the 10 wealthiest states3
US$1.7 trillion deposits market4
Access to nearly 77 million people within TD’s footprint5
Expanding U.S. Wholesale franchise with presence in New York and Houston
Significant growth opportunities within TD’s footprint
Country Statistics
Canadian Banking System U.S. Banking System
TD's Canadian Businesses TD's U.S. Businesses
TD in North America
6
1. See slide 4, footnote 3, for definition of adjusted results. 2. See slide 21, footnote 1. 3. See slide 3, footnote 5 for more information. 4. Canadian Peers – defined as other 4 big banks (RY, BMO, BNS and CM) adjusted on a comparable basis to exclude identified non-underlying items. Based on Q3/16 results ended July 31, 2016. 5. North American Peers – defined as Canadian Peers and U.S. Peers. U.S. Peers – defined as Money Center Banks (C, BAC, JPM) and Top 3 Super-Regional Banks (WFC, PNC, USB). Adjusted on a comparable basis to exclude identified non-
underlying items. For U.S. Peers, based on Q2/16 results ended June 30, 2016.
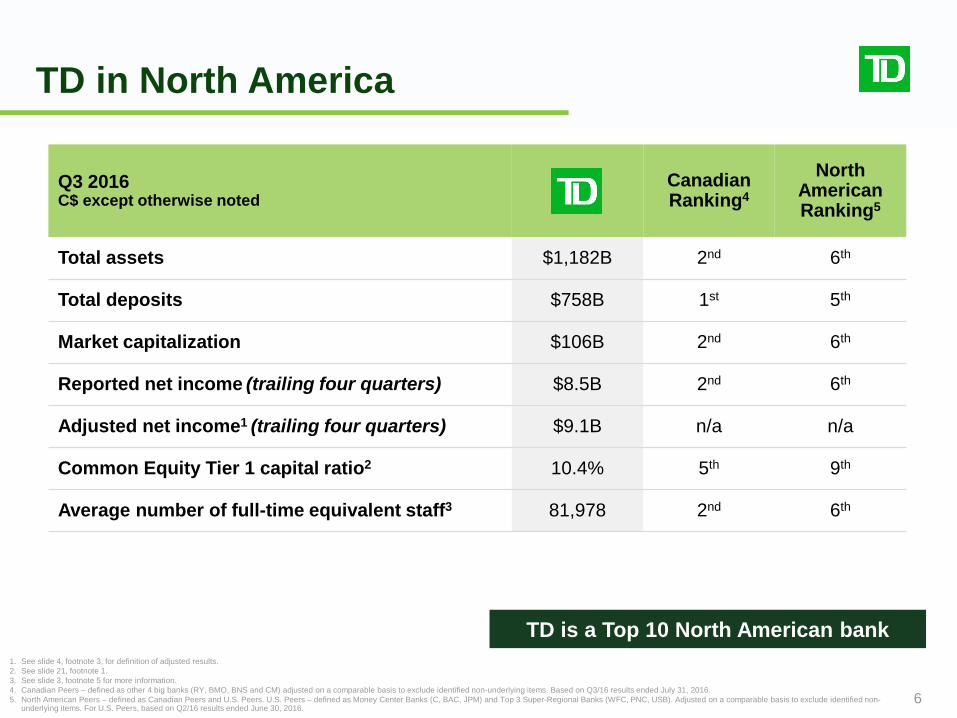
Q3 2016 C$ except otherwise noted
Canadian Ranking4
North American Ranking5
Total assets $1,182B 2nd 6th
Total deposits $758B 1st 5th
Market capitalization $106B 2nd 6th
Reported net income (trailing four quarters) $8.5B 2nd 6th
Adjusted net income1 (trailing four quarters) $9.1B n/a n/a
Common Equity Tier 1 capital ratio2 10.4% 5th 9th
Average number of full-time equivalent staff3 81,978 2nd 6th
TD is a Top 10 North American bank
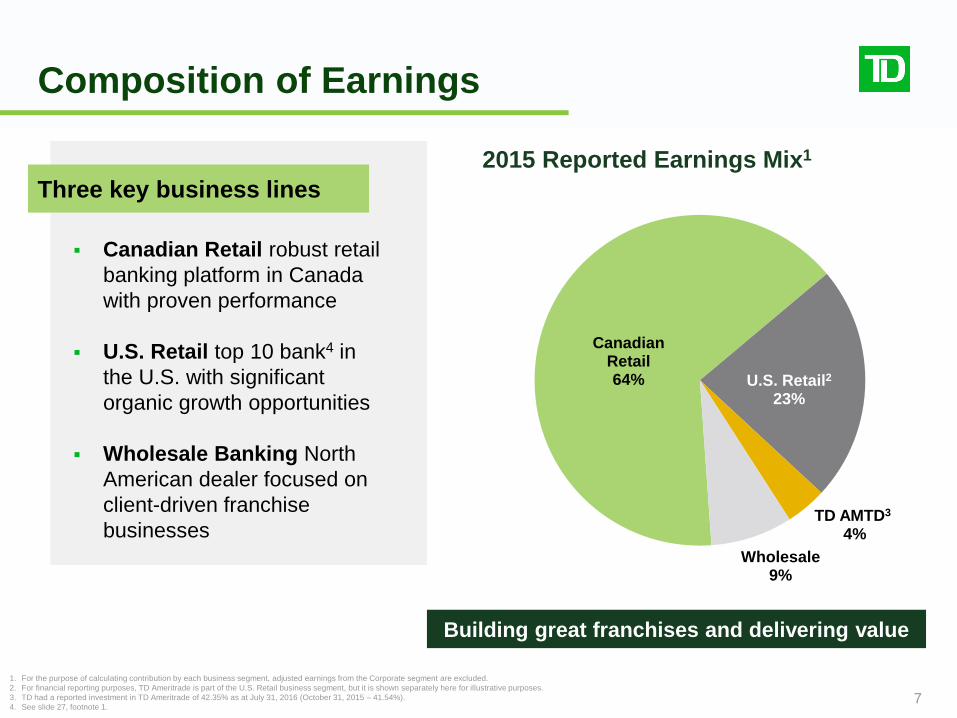
Canadian Retail 64% U.S. Retail2
23%
TD AMTD3
4% Wholesale
9%
Three key business lines
7
2015 Reported Earnings Mix1
1. For the purpose of calculating contribution by each business segment, adjusted earnings from the Corporate segment are excluded. 2. For financial reporting purposes, TD Ameritrade is part of the U.S. Retail business segment, but it is shown separately here for illustrative purposes. 3. TD had a reported investment in TD Ameritrade of 42.35% as at July 31, 2016 (October 31, 2015 – 41.54%). 4. See slide 27, footnote 1.
Building great franchises and delivering value
Canadian Retail robust retail banking platform in Canada with proven performance
U.S. Retail top 10 bank4 in the U.S. with significant organic growth opportunities
Wholesale Banking North American dealer focused on client-driven franchise businesses
Composition of Earnings
Strategic Evolution of TD
8
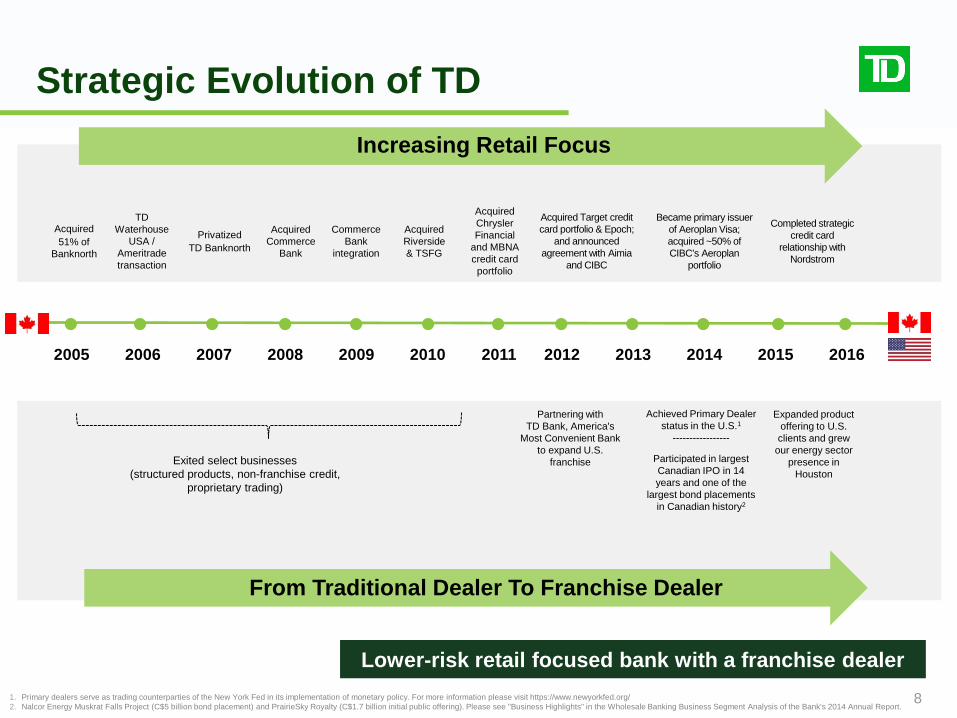
Exited select businesses (structured products, non-franchise credit,
proprietary trading)
• • • • • • • • • • • 2005 2006 2007 2008 2009 2010 2011 2012 2013 2014 2015 2016
Acquired 51% of
Banknorth
Privatized TD Banknorth
Acquired Commerce
Bank
TD Waterhouse
USA / Ameritrade transaction
Commerce Bank
integration
Acquired Riverside & TSFG
Acquired Chrysler Financial
and MBNA credit card portfolio
Acquired Target credit card portfolio & Epoch;
and announced agreement with Aimia
and CIBC
Increasing Retail Focus
From Traditional Dealer To Franchise Dealer
•
Became primary issuer of Aeroplan Visa; acquired ~50% of CIBC’s Aeroplan
portfolio
Completed strategic credit card
relationship with Nordstrom
Expanded product offering to U.S. clients and grew
our energy sector presence in
Houston
Participated in largest Canadian IPO in 14 years and one of the
largest bond placements in Canadian history2
Achieved Primary Dealer status in the U.S.1
-----------------
Partnering with TD Bank, America's
Most Convenient Bank to expand U.S.
franchise
1. Primary dealers serve as trading counterparties of the New York Fed in its implementation of monetary policy. For more information please visit https://www.newyorkfed.org/ 2. Nalcor Energy Muskrat Falls Project (C$5 billion bond placement) and PrairieSky Royalty (C$1.7 billion initial public offering). Please see "Business Highlights" in the Wholesale Banking Business Segment Analysis of the Bank's 2014 Annual Report.
Lower-risk retail focused bank with a franchise dealer
Risk Management Framework
9
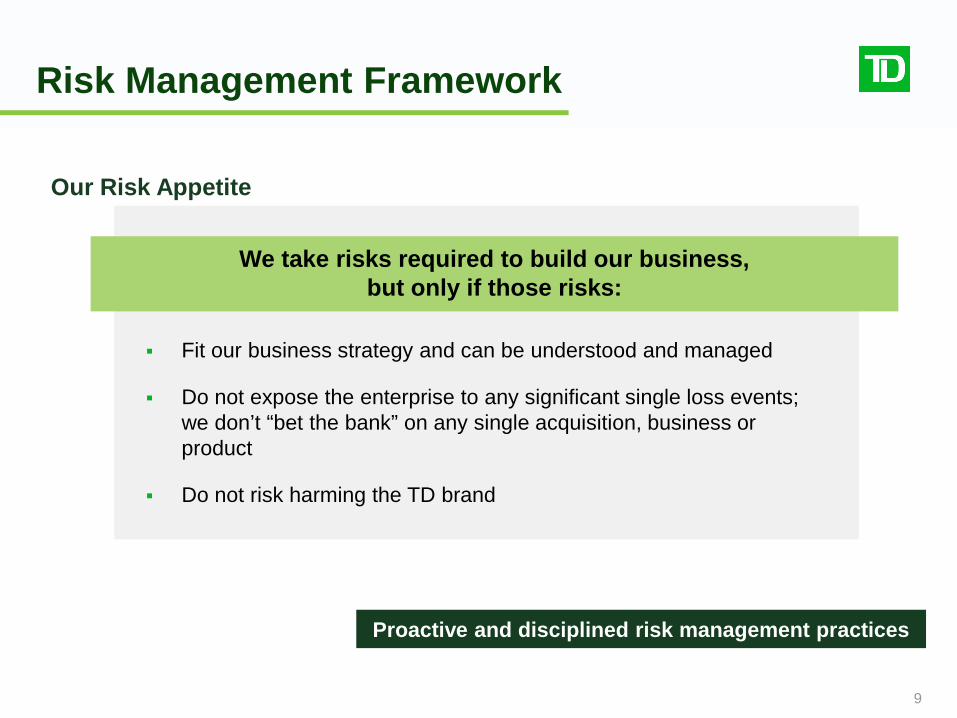
Fit our business strategy and can be understood and managed
Do not expose the enterprise to any significant single loss events; we don’t “bet the bank” on any single acquisition, business or product
Do not risk harming the TD brand
Our Risk Appetite
Proactive and disciplined risk management practices
We take risks required to build our business, but only if those risks:
TD Bank Group – Key Themes
10
Top 10 North American Bank 1
Proven Performance
Strong Balance Sheet and Capital Position
Focus on Growth Opportunities 4
2
3
Targeting 7-10% adjusted EPS
growth over the medium term2
Highly rated by major credit rating agencies
Delivering top tier long
term shareholder returns
1. See slide 6. 2. See slide 4, footnote 3, for definition of adjusted results.
6th largest bank by Total Assets1
6th largest bank by Market Cap1
Stable Earnings Growth
11
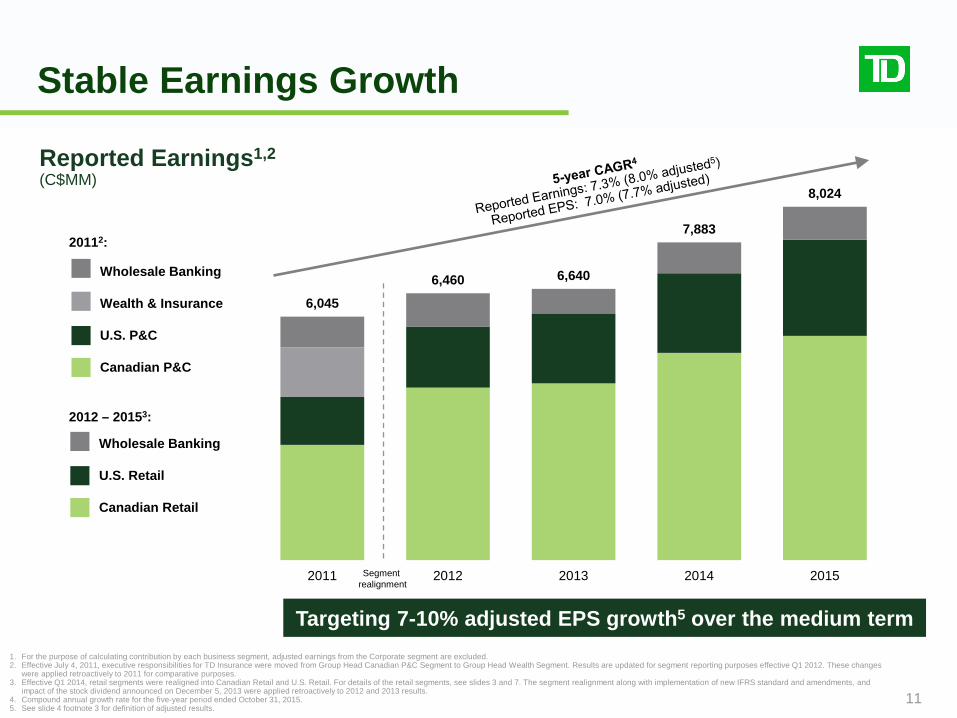
6,045
6,460 6,640
7,883
8,024
2011 2012 2013 2014 2015
Wholesale Banking Wealth & Insurance U.S. P&C
Canadian P&C
1. For the purpose of calculating contribution by each business segment, adjusted earnings from the Corporate segment are excluded. 2. Effective July 4, 2011, executive responsibilities for TD Insurance were moved from Group Head Canadian P&C Segment to Group Head Wealth Segment. Results are updated for segment reporting purposes effective Q1 2012. These changes
were applied retroactively to 2011 for comparative purposes. 3. Effective Q1 2014, retail segments were realigned into Canadian Retail and U.S. Retail. For details of the retail segments, see slides 3 and 7. The segment realignment along with implementation of new IFRS standard and amendments, and
impact of the stock dividend announced on December 5, 2013 were applied retroactively to 2012 and 2013 results. 4. Compound annual growth rate for the five-year period ended October 31, 2015. 5. See slide 4 footnote 3 for definition of adjusted results.
Reported Earnings1,2 (C$MM)
Segment realignment
20112:
2012 – 20153:
Wholesale Banking U.S. Retail Canadian Retail
Targeting 7-10% adjusted EPS growth5 over the medium term
Solid Total Shareholder Returns
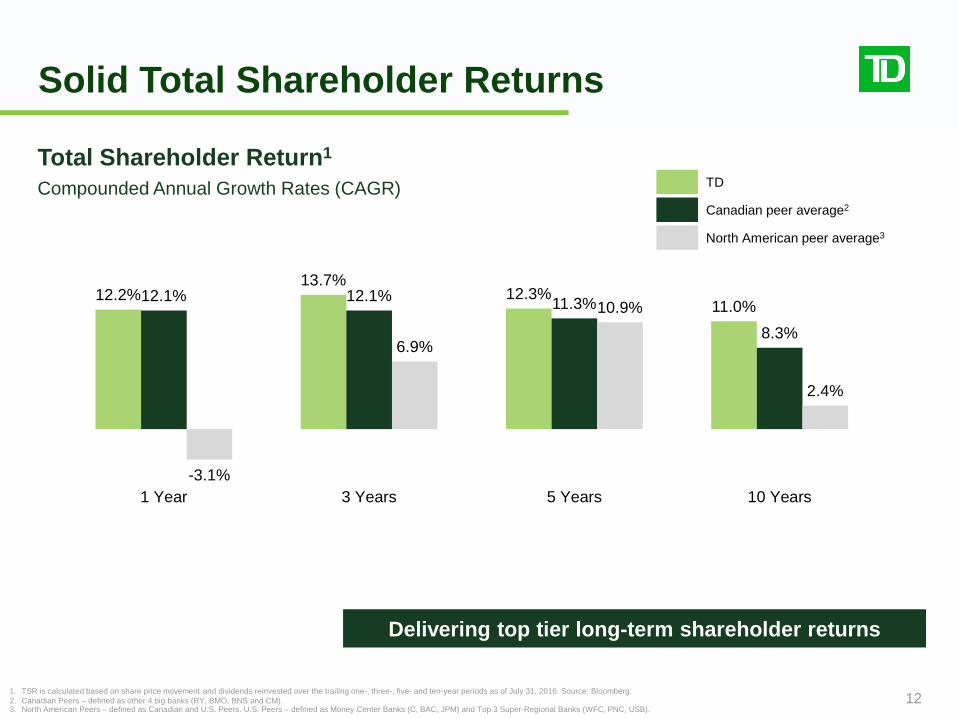
12 1. TSR is calculated based on share price movement and dividends reinvested over the trailing one-, three-, five- and ten-year periods as of July 31, 2016. Source: Bloomberg. 2. Canadian Peers – defined as other 4 big banks (RY, BMO, BNS and CM). 3. North American Peers – defined as Canadian and U.S. Peers. U.S. Peers – defined as Money Center Banks (C, BAC, JPM) and Top 3 Super-Regional Banks (WFC, PNC, USB).
Total Shareholder Return1
Compounded Annual Growth Rates (CAGR) Canadian peer average2
North American peer average3
TD
12.2% 13.7%
12.3% 11.0%
12.1% 12.1% 11.3%
8.3%
-3.1%
6.9%
10.9%
2.4%
1 Year 3 Years 5 Years 10 Years
Delivering top tier long-term shareholder returns
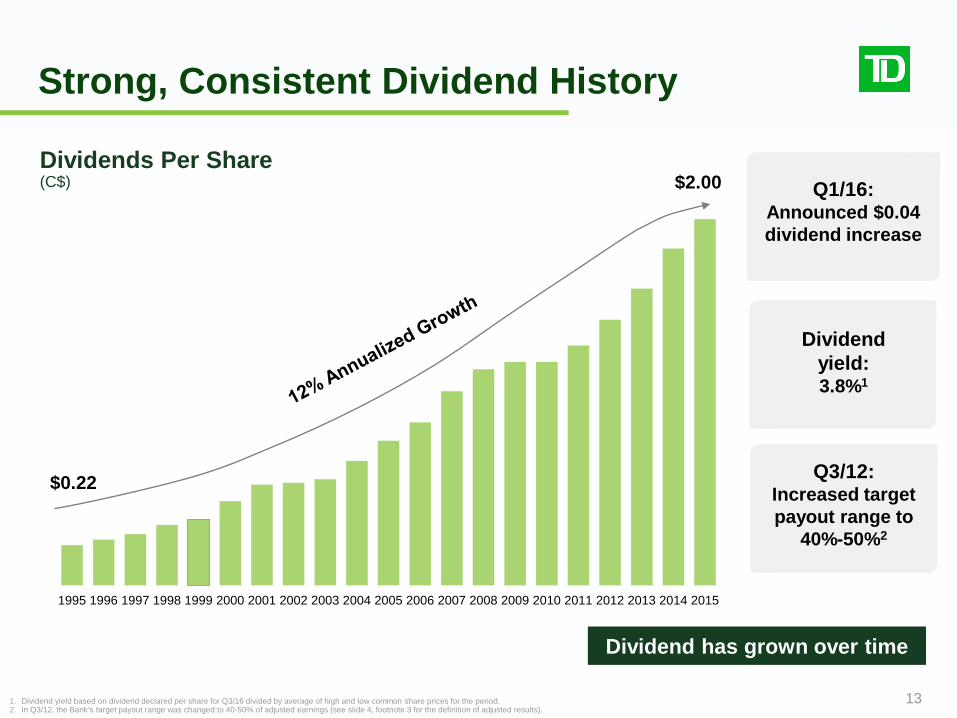
1995 1996 1997 1998 1999 2000 2001 2002 2003 2004 2005 2006 2007 2008 2009 2010 2011 2012 2013 2014 2015
Strong, Consistent Dividend History
13
$2.00
$0.22 Q3/12: Increased target payout range to
40%-50%2
Q1/16: Announced $0.04 dividend increase
Dividend yield: 3.8%1
1. Dividend yield based on dividend declared per share for Q3/16 divided by average of high and low common share prices for the period. 2. In Q3/12, the Bank’s target payout range was changed to 40-50% of adjusted earnings (see slide 4, footnote 3 for the definition of adjusted results).
Dividends Per Share (C$)
Dividend has grown over time
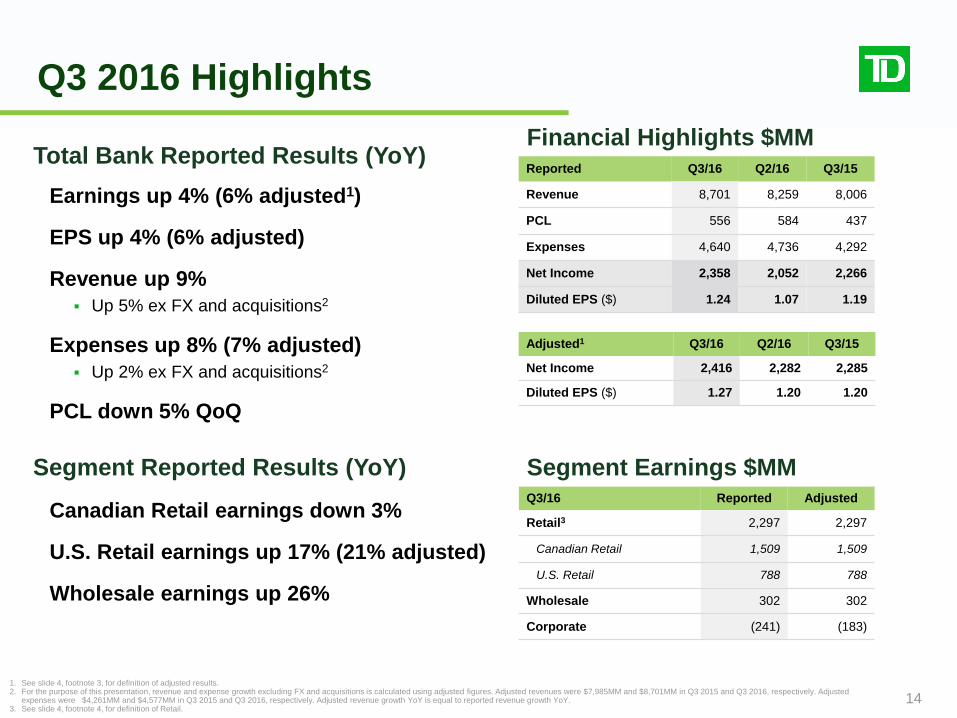
Q3 2016 Highlights Financial Highlights $MM
Q3/16 Reported Adjusted
Retail3 2,297 2,297
Canadian Retail 1,509 1,509
U.S. Retail 788 788
Wholesale 302 302
Corporate (241) (183)
Segment Earnings $MM
Adjusted1 Q3/16 Q2/16 Q3/15
Net Income 2,416 2,282 2,285
Diluted EPS ($) 1.27 1.20 1.20
Reported Q3/16 Q2/16 Q3/15
Revenue 8,701 8,259 8,006
PCL 556 584 437
Expenses 4,640 4,736 4,292
Net Income 2,358 2,052 2,266
Diluted EPS ($) 1.24 1.07 1.19
1. See slide 4, footnote 3, for definition of adjusted results. 2. For the purpose of this presentation, revenue and expense growth excluding FX and acquisitions is calculated using adjusted figures. Adjusted revenues were $7,985MM and $8,701MM in Q3 2015 and Q3 2016, respectively. Adjusted
expenses were $4,261MM and $4,577MM in Q3 2015 and Q3 2016, respectively. Adjusted revenue growth YoY is equal to reported revenue growth YoY. 3. See slide 4, footnote 4, for definition of Retail.
Total Bank Reported Results (YoY)
Segment Reported Results (YoY)
Earnings up 4% (6% adjusted1)
EPS up 4% (6% adjusted)
Revenue up 9% Up 5% ex FX and acquisitions2
Expenses up 8% (7% adjusted) Up 2% ex FX and acquisitions2
PCL down 5% QoQ
Canadian Retail earnings down 3%
U.S. Retail earnings up 17% (21% adjusted)
Wholesale earnings up 26%
14
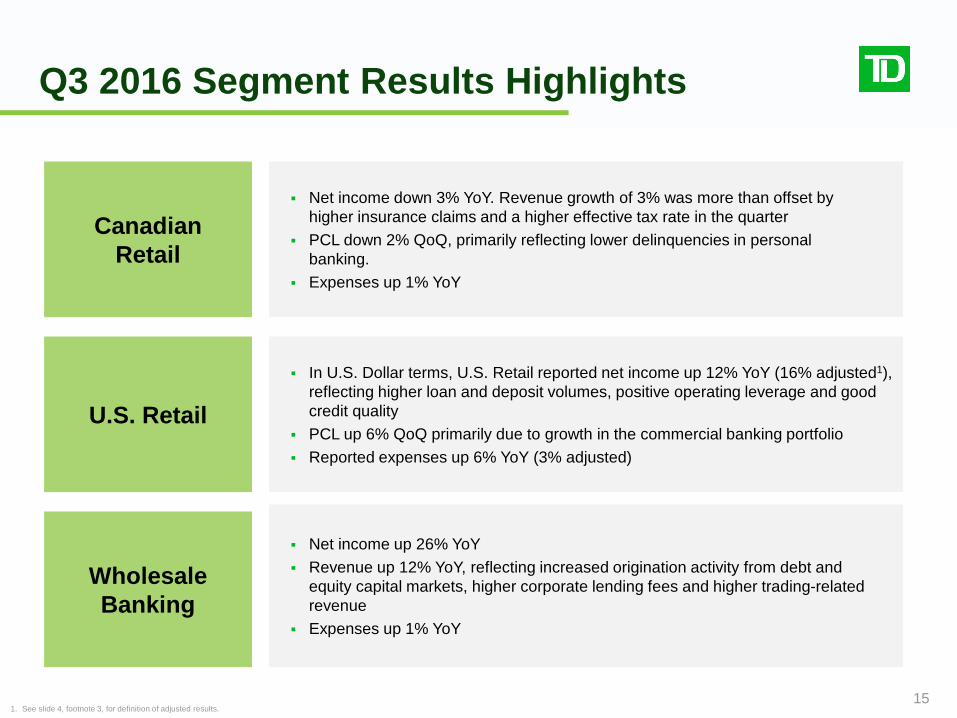
Q3 2016 Segment Results Highlights
15
Net income down 3% YoY. Revenue growth of 3% was more than offset by higher insurance claims and a higher effective tax rate in the quarter
PCL down 2% QoQ, primarily reflecting lower delinquencies in personal banking.
Expenses up 1% YoY
In U.S. Dollar terms, U.S. Retail reported net income up 12% YoY (16% adjusted1), reflecting higher loan and deposit volumes, positive operating leverage and good credit quality
PCL up 6% QoQ primarily due to growth in the commercial banking portfolio Reported expenses up 6% YoY (3% adjusted)
Net income up 26% YoY Revenue up 12% YoY, reflecting increased origination activity from debt and
equity capital markets, higher corporate lending fees and higher trading-related revenue
Expenses up 1% YoY
Canadian Retail
U.S. Retail
Wholesale Banking
1. See slide 4, footnote 3, for definition of adjusted results.
26 31
50
78
83
66 61 60
56 58
65 63 59
25
37
50
81
63
39 43
38 34 34
45 42
39
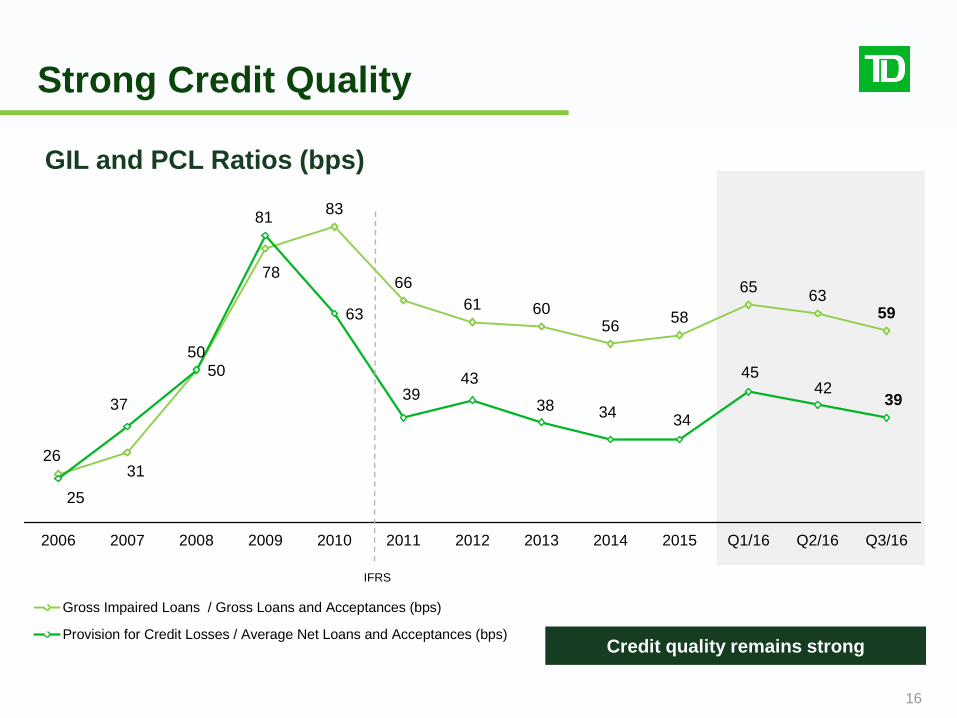
2006 2007 2008 2009 2010 2011 2012 2013 2014 2015 Q1/16 Q2/16 Q3/16
Gross Impaired Loans / Gross Loans and Acceptances (bps)
Provision for Credit Losses / Average Net Loans and Acceptances (bps)
Strong Credit Quality
GIL and PCL Ratios (bps)
Credit quality remains strong
IFRS
16
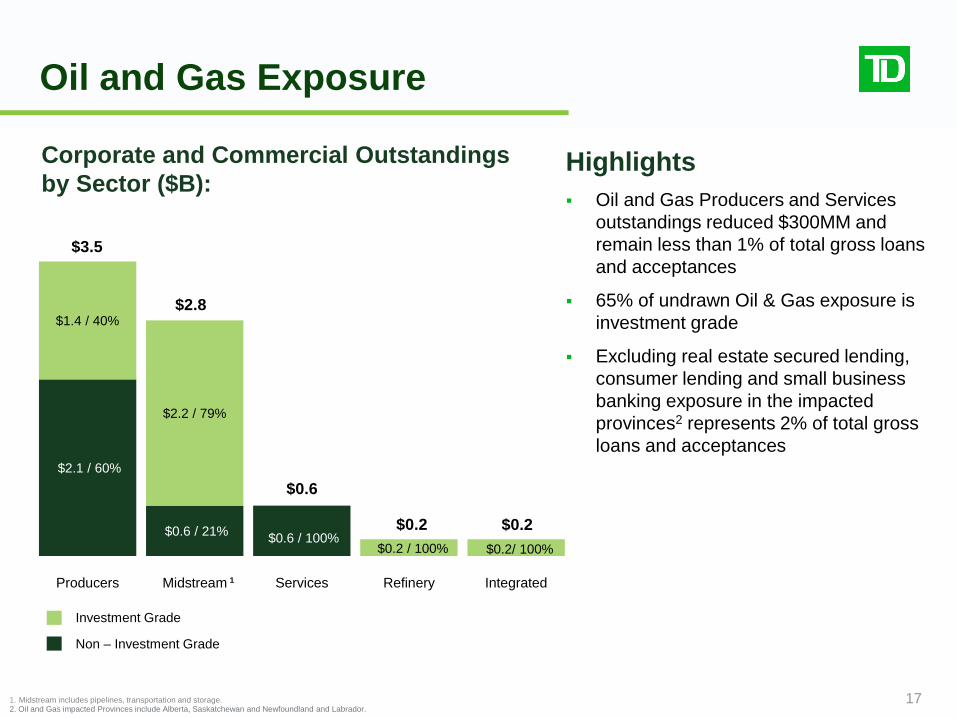
$2.1 / 60%
$0.6 / 21% $0.6 / 100% $0.2/ 100% $0.2 / 100%
$1.4 / 40%
$2.2 / 79%
Producers Midstream Services Refinery Integrated
Corporate and Commercial Outstandings by Sector ($B):
Non – Investment Grade
Investment Grade
$3.5
$2.8
$0.6
$0.2
Highlights Oil and Gas Producers and Services
outstandings reduced $300MM and remain less than 1% of total gross loans and acceptances
65% of undrawn Oil & Gas exposure is investment grade
Excluding real estate secured lending, consumer lending and small business banking exposure in the impacted provinces2 represents 2% of total gross loans and acceptances
Oil and Gas Exposure
$0.2
1. Midstream includes pipelines, transportation and storage. 2. Oil and Gas impacted Provinces include Alberta, Saskatchewan and Newfoundland and Labrador.
1
17
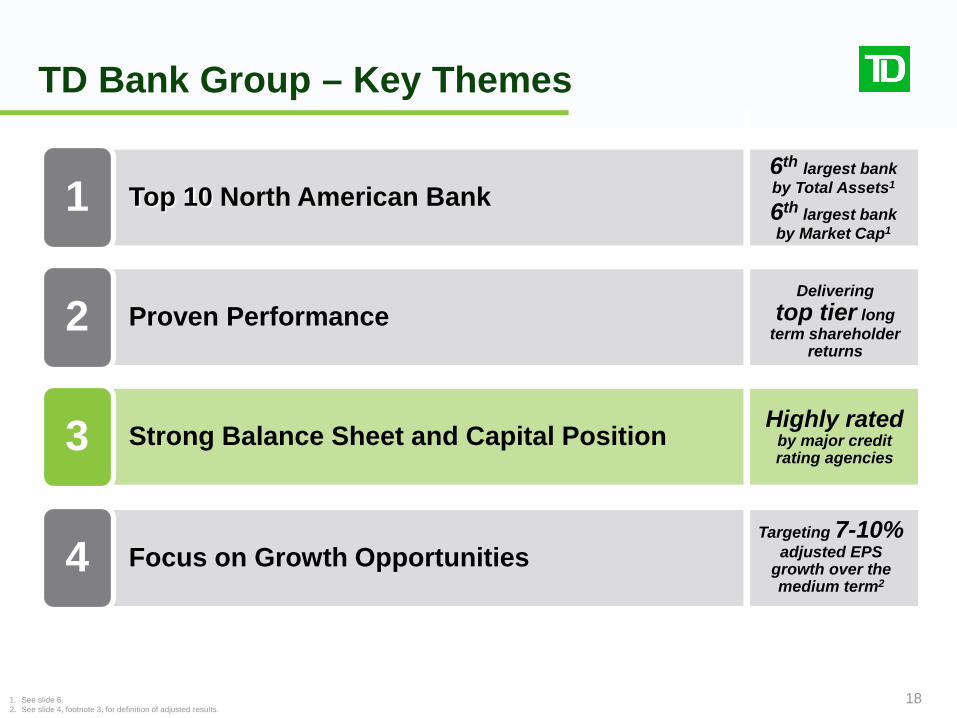
TD Bank Group – Key Themes
18
Top 10 North American Bank 1
Proven Performance
Strong Balance Sheet and Capital Position
Focus on Growth Opportunities 4
2
3
Targeting 7-10% adjusted EPS
growth over the medium term2
Highly rated by major credit rating agencies
Delivering top tier long
term shareholder returns
1. See slide 6. 2. See slide 4, footnote 3, for definition of adjusted results.
6th largest bank by Total Assets1
6th largest bank by Market Cap1
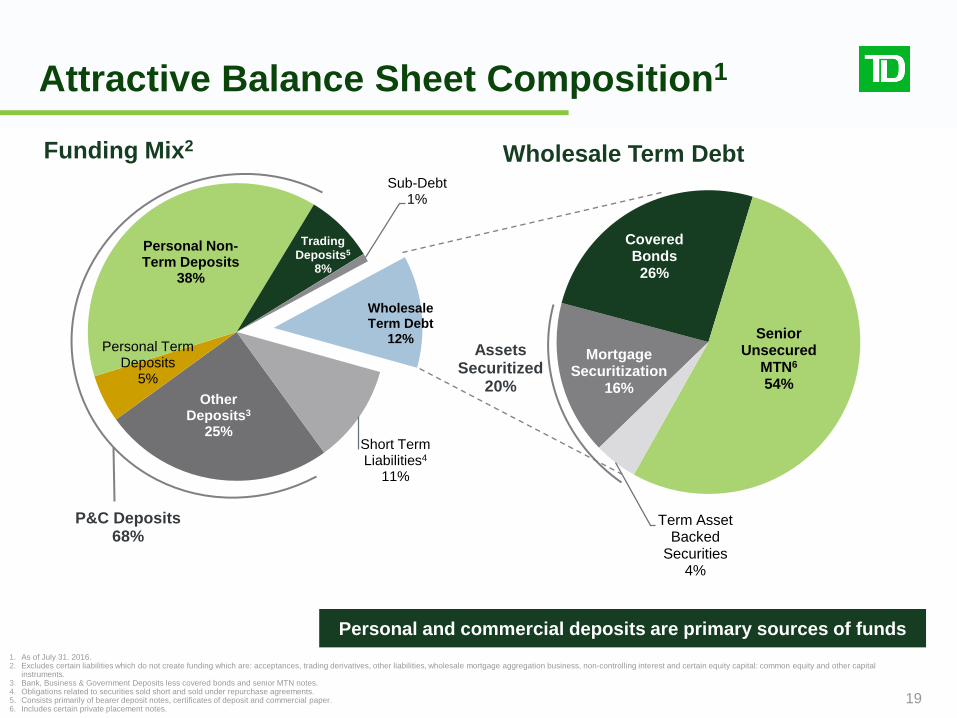
Mortgage Securitization
16%
Covered Bonds 26%
Senior Unsecured
MTN6 54%
Term Asset Backed
Securities 4%
Other Deposits3
25%
Personal Term Deposits
5%
Personal Non-Term Deposits
38%
Trading Deposits5
8%
Sub-Debt 1%
Wholesale Term Debt
12%
Short Term Liabilities4
11%
Attractive Balance Sheet Composition1
19
Funding Mix2 Wholesale Term Debt
1. As of July 31. 2016. 2. Excludes certain liabilities which do not create funding which are: acceptances, trading derivatives, other liabilities, wholesale mortgage aggregation business, non-controlling interest and certain equity capital: common equity and other capital
instruments. 3. Bank, Business & Government Deposits less covered bonds and senior MTN notes. 4. Obligations related to securities sold short and sold under repurchase agreements. 5. Consists primarily of bearer deposit notes, certificates of deposit and commercial paper. 6. Includes certain private placement notes.
Assets Securitized
20%
P&C Deposits 68%
Personal and commercial deposits are primary sources of funds
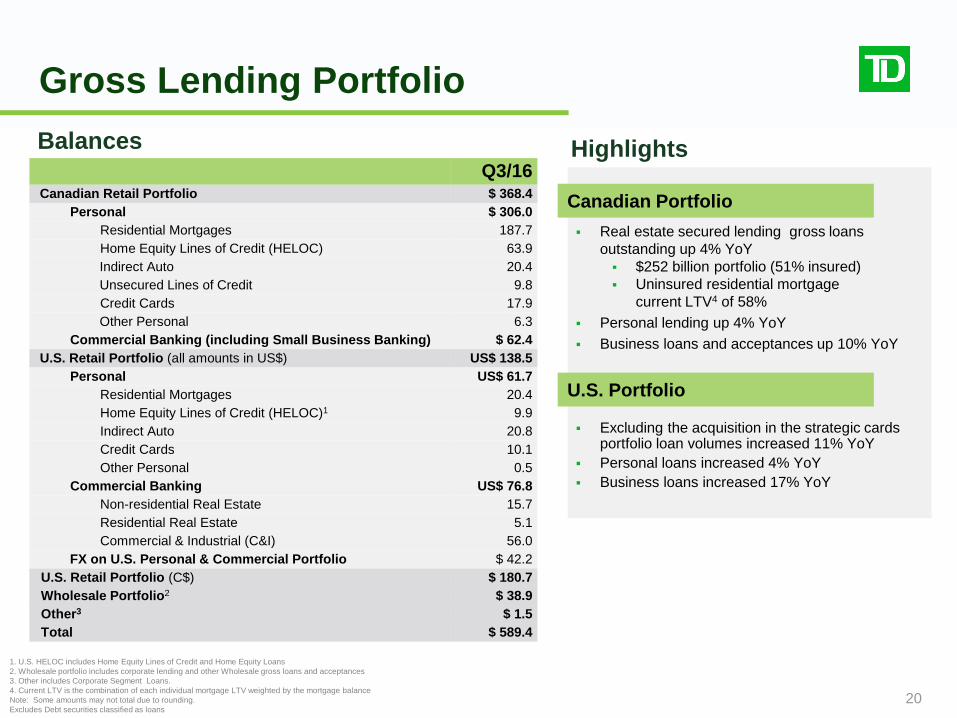
Gross Lending Portfolio
20
U.S. portfolio
Highlights
Real estate secured lending gross loans outstanding up 4% YoY $252 billion portfolio (51% insured) Uninsured residential mortgage
current LTV4 of 58% Personal lending up 4% YoY Business loans and acceptances up 10% YoY
Excluding the acquisition in the strategic cards portfolio loan volumes increased 11% YoY
Personal loans increased 4% YoY Business loans increased 17% YoY
Balances
1. U.S. HELOC includes Home Equity Lines of Credit and Home Equity Loans 2. Wholesale portfolio includes corporate lending and other Wholesale gross loans and acceptances 3. Other includes Corporate Segment Loans. 4. Current LTV is the combination of each individual mortgage LTV weighted by the mortgage balance Note: Some amounts may not total due to rounding. Excludes Debt securities classified as loans
Canadian Portfolio
U.S. Portfolio
Q3/16 Canadian Retail Portfolio $ 368.4
Personal $ 306.0 Residential Mortgages 187.7 Home Equity Lines of Credit (HELOC) 63.9 Indirect Auto 20.4 Unsecured Lines of Credit 9.8 Credit Cards 17.9 Other Personal 6.3
Commercial Banking (including Small Business Banking) $ 62.4 U.S. Retail Portfolio (all amounts in US$) US$ 138.5
Personal US$ 61.7 Residential Mortgages 20.4 Home Equity Lines of Credit (HELOC)1 9.9 Indirect Auto 20.8 Credit Cards 10.1 Other Personal 0.5
Commercial Banking US$ 76.8 Non-residential Real Estate 15.7 Residential Real Estate 5.1 Commercial & Industrial (C&I) 56.0
FX on U.S. Personal & Commercial Portfolio $ 42.2 U.S. Retail Portfolio (C$) $ 180.7 Wholesale Portfolio2 $ 38.9 Other3 $ 1.5 Total $ 589.4

Capital & Liquidity
1. Amounts are calculated in accordance with the Basel III regulatory framework, excluding Credit Valuation Adjustment (CVA) capital in accordance with OSFI guidance and are presented based on the “all-in” methodology. The CVA capital charge is phased in over a five year period based on an approach whereby a CVA capital charge of 64% applies in 2015 and 2016, 72% in 2017, 80% in 2018 and 100% in 2019.
Common Equity Tier 11 Highlights
Common Equity Tier 1 ratio of 10.4%
Leverage ratio of 3.8%
Liquidity coverage ratio of 132%
Q2 2016 CET1 Ratio 10.1%
Internal capital generation 33 bps
Actuarial loss on employee pension plans (9) bps
RWA increase and other 1 bps
Q3 2016 CET1 Ratio 10.4%
21
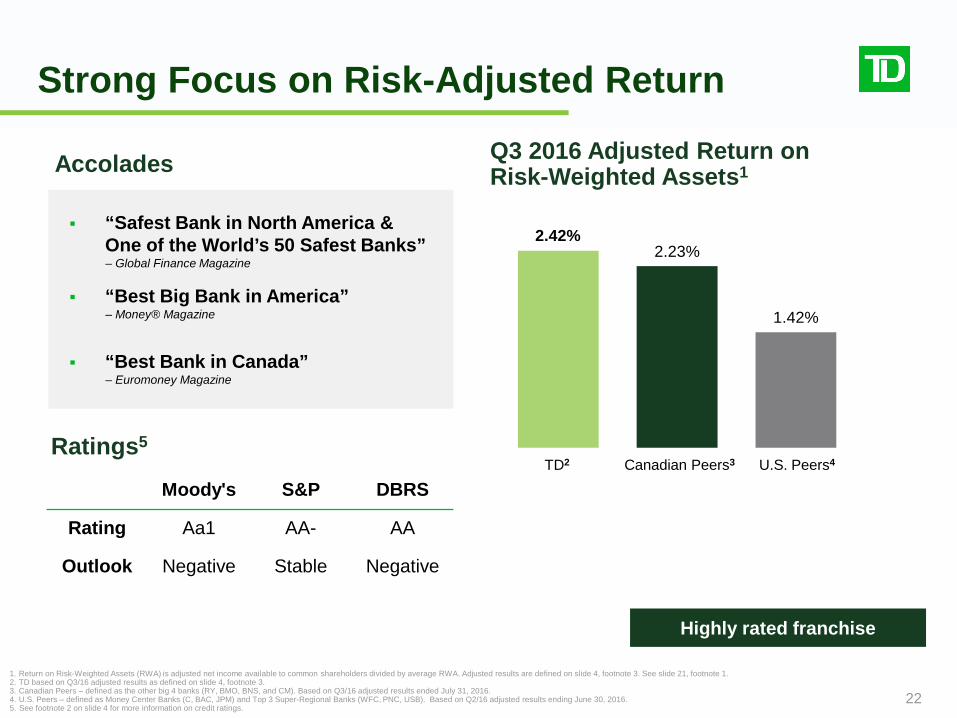
Strong Focus on Risk-Adjusted Return
22
Q3 2016 Adjusted Return on Risk-Weighted Assets1
Ratings5
“Safest Bank in North America & One of the World’s 50 Safest Banks”
– Global Finance Magazine
“Best Big Bank in America” – Money® Magazine
“Best Bank in Canada” – Euromoney Magazine
Accolades
1. Return on Risk-Weighted Assets (RWA) is adjusted net income available to common shareholders divided by average RWA. Adjusted results are defined on slide 4, footnote 3. See slide 21, footnote 1. 2. TD based on Q3/16 adjusted results as defined on slide 4, footnote 3. 3. Canadian Peers – defined as the other big 4 banks (RY, BMO, BNS, and CM). Based on Q3/16 adjusted results ended July 31, 2016. 4. U.S. Peers – defined as Money Center Banks (C, BAC, JPM) and Top 3 Super-Regional Banks (WFC, PNC, USB). Based on Q2/16 adjusted results ending June 30, 2016. 5. See footnote 2 on slide 4 for more information on credit ratings.
2 3 4
Moody's S&P DBRS
Rating Aa1 AA- AA
Outlook Negative Stable Negative
Highly rated franchise
2.42% 2.23%
1.42%
TD2 Canadian Peers3 U.S. Peers4
TD Bank Group – Key Themes
23
Top 10 North American Bank 1
Proven Performance
Strong Balance Sheet and Capital Position
Focus on Growth Opportunities 4
2
3
Targeting 7-10% adjusted EPS
growth over the medium term2
Highly rated by major credit rating agencies
Delivering top tier long
term shareholder returns
1. See slide 6. 2. See slide 4, footnote 3, for definition of adjusted results.
6th largest bank by Total Assets1
6th largest bank by Market Cap1
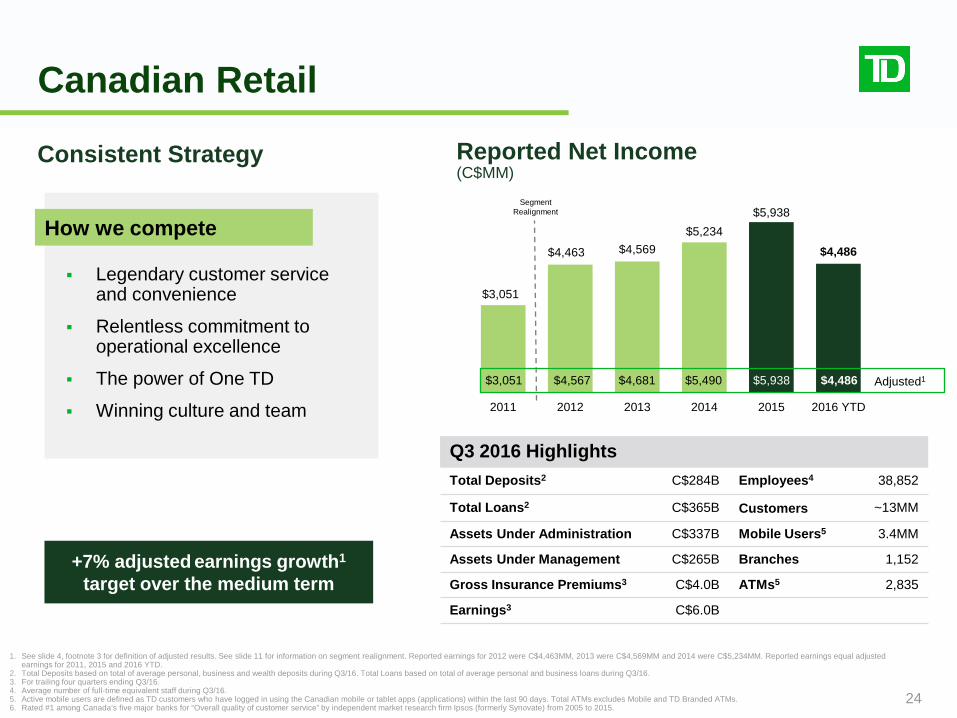
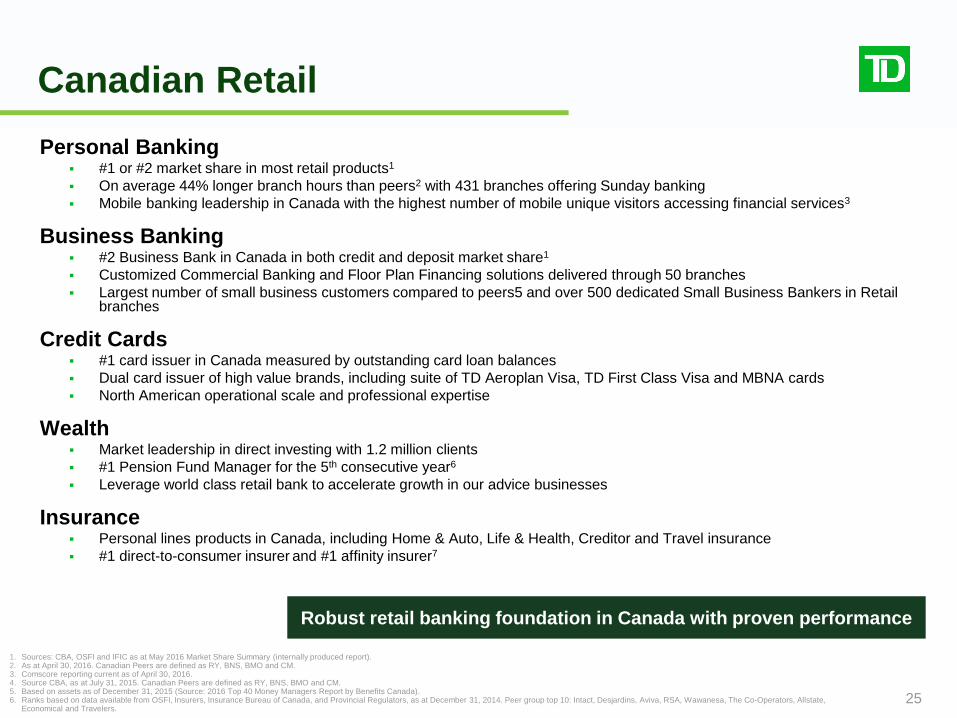
Canadian Retail
24
Legendary customer service and convenience
Relentless commitment to operational excellence
The power of One TD
Winning culture and team
Consistent Strategy
Q3 2016 Highlights Total Deposits2 C$284B Employees4 38,852
Total Loans2 C$365B Customers ~13MM
Assets Under Administration C$337B Mobile Users5 3.4MM
Assets Under Management C$265B Branches 1,152
Gross Insurance Premiums3 C$4.0B ATMs5 2,835
Earnings3 C$6.0B
Reported Net Income (C$MM)
$3,051
$4,463 $4,569 $5,234
$5,938
$4,486
2011 2012 2013 2014 2015 2016 YTD
Segment Realignment
1. See slide 4, footnote 3 for definition of adjusted results. See slide 11 for information on segment realignment. Reported earnings for 2012 were C$4,463MM, 2013 were C$4,569MM and 2014 were C$5,234MM. Reported earnings equal adjusted earnings for 2011, 2015 and 2016 YTD.
2. Total Deposits based on total of average personal, business and wealth deposits during Q3/16. Total Loans based on total of average personal and business loans during Q3/16. 3. For trailing four quarters ending Q3/16. 4. Average number of full-time equivalent staff during Q3/16. 5. Active mobile users are defined as TD customers who have logged in using the Canadian mobile or tablet apps (applications) within the last 90 days. Total ATMs excludes Mobile and TD Branded ATMs. 6. Rated #1 among Canada’s five major banks for “Overall quality of customer service” by independent market research firm Ipsos (formerly Synovate) from 2005 to 2015.
+7% adjusted earnings growth1 target over the medium term
How we compete
$3,051 Adjusted1 $4,567 $4,681 $5,490 $5,938 $4,486
Canadian Retail
25
Personal Banking #1 or #2 market share in most retail products1
On average 44% longer branch hours than peers2 with 431 branches offering Sunday banking Mobile banking leadership in Canada with the highest number of mobile unique visitors accessing financial services3
Business Banking #2 Business Bank in Canada in both credit and deposit market share1
Customized Commercial Banking and Floor Plan Financing solutions delivered through 50 branches Largest number of small business customers compared to peers5 and over 500 dedicated Small Business Bankers in Retail
branches
Credit Cards #1 card issuer in Canada measured by outstanding card loan balances Dual card issuer of high value brands, including suite of TD Aeroplan Visa, TD First Class Visa and MBNA cards North American operational scale and professional expertise
Wealth Market leadership in direct investing with 1.2 million clients #1 Pension Fund Manager for the 5th consecutive year6
Leverage world class retail bank to accelerate growth in our advice businesses
Insurance Personal lines products in Canada, including Home & Auto, Life & Health, Creditor and Travel insurance #1 direct-to-consumer insurer and #1 affinity insurer7
1. Sources: CBA, OSFI and IFIC as at May 2016 Market Share Summary (internally produced report). 2. As at April 30, 2016. Canadian Peers are defined as RY, BNS, BMO and CM. 3. Comscore reporting current as of April 30, 2016. 4. Source CBA, as at July 31, 2015. Canadian Peers are defined as RY, BNS, BMO and CM. 5. Based on assets as of December 31, 2015 (Source: 2016 Top 40 Money Managers Report by Benefits Canada). 6. Ranks based on data available from OSFI, Insurers, Insurance Bureau of Canada, and Provincial Regulators, as at December 31, 2014. Peer group top 10: Intact, Desjardins, Aviva, RSA, Wawanesa, The Co-Operators, Allstate,
Economical and Travelers.
Robust retail banking foundation in Canada with proven performance
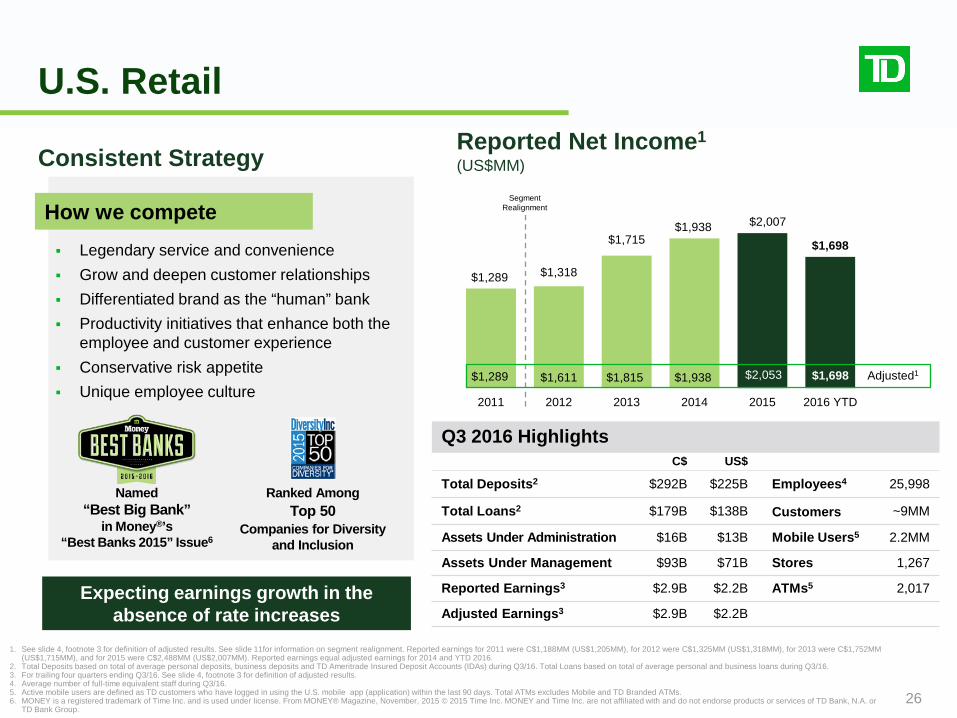
1. See slide 4, footnote 3 for definition of adjusted results. See slide 11for information on segment realignment. Reported earnings for 2011 were C$1,188MM (US$1,205MM), for 2012 were C$1,325MM (US$1,318MM), for 2013 were C$1,752MM (US$1,715MM), and for 2015 were C$2,488MM (US$2,007MM). Reported earnings equal adjusted earnings for 2014 and YTD 2016.
2. Total Deposits based on total of average personal deposits, business deposits and TD Ameritrade Insured Deposit Accounts (IDAs) during Q3/16. Total Loans based on total of average personal and business loans during Q3/16. 3. For trailing four quarters ending Q3/16. See slide 4, footnote 3 for definition of adjusted results. 4. Average number of full-time equivalent staff during Q3/16. 5. Active mobile users are defined as TD customers who have logged in using the U.S. mobile app (application) within the last 90 days. Total ATMs excludes Mobile and TD Branded ATMs. 6. MONEY is a registered trademark of Time Inc. and is used under license. From MONEY® Magazine, November, 2015 © 2015 Time Inc. MONEY and Time Inc. are not affiliated with and do not endorse products or services of TD Bank, N.A. or
TD Bank Group.
U.S. Retail
$1,289 $1,318
$1,715 $1,938 $2,007
$1,698
2011 2012 2013 2014 2015 2016 YTD
Consistent Strategy Reported Net Income1
(US$MM)
$1,289 $1,611 $1,815
Legendary service and convenience Grow and deepen customer relationships Differentiated brand as the “human” bank Productivity initiatives that enhance both the
employee and customer experience Conservative risk appetite Unique employee culture
Named “Best Big Bank”
in Money®’s “Best Banks 2015” Issue6
Ranked Among Top 50
Companies for Diversity and Inclusion
Q3 2016 Highlights C$ US$
Total Deposits2 $292B $225B Employees4 25,998
Total Loans2 $179B $138B Customers ~9MM
Assets Under Administration $16B $13B Mobile Users5 2.2MM
Assets Under Management $93B $71B Stores 1,267
Reported Earnings3 $2.9B $2.2B ATMs5 2,017
Adjusted Earnings3 $2.9B $2.2B
Segment Realignment
$2,053 $1,938 $1,698
26
Expecting earnings growth in the absence of rate increases
How we compete
Adjusted1
U.S. Retail
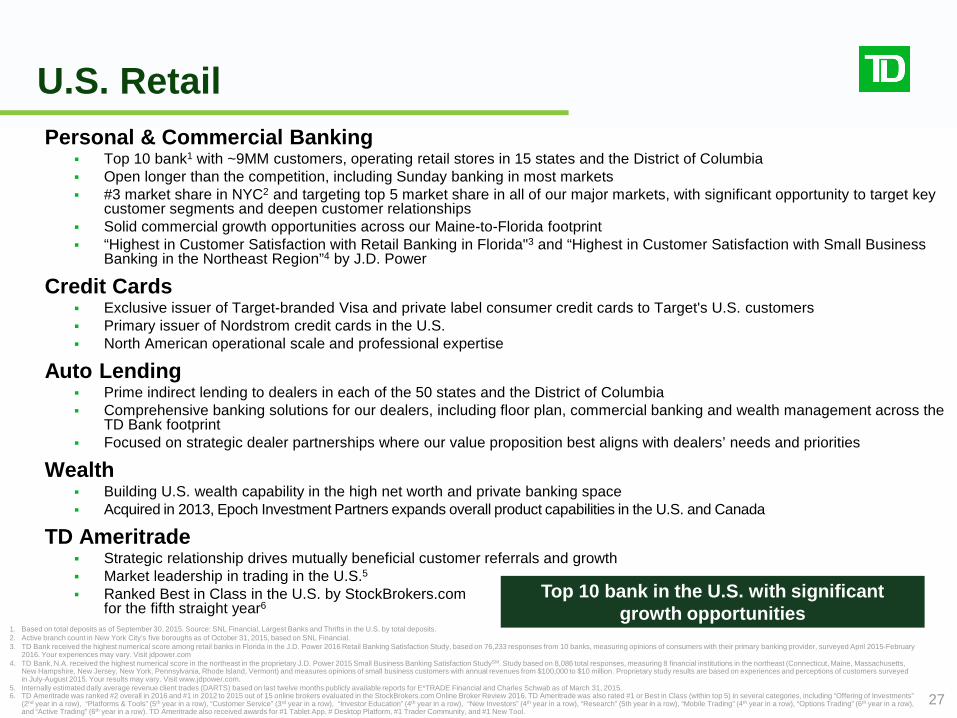
27
Personal & Commercial Banking Top 10 bank1 with ~9MM customers, operating retail stores in 15 states and the District of Columbia Open longer than the competition, including Sunday banking in most markets #3 market share in NYC2 and targeting top 5 market share in all of our major markets, with significant opportunity to target key
customer segments and deepen customer relationships Solid commercial growth opportunities across our Maine-to-Florida footprint “Highest in Customer Satisfaction with Retail Banking in Florida"3 and “Highest in Customer Satisfaction with Small Business
Banking in the Northeast Region”4 by J.D. Power
Credit Cards Exclusive issuer of Target-branded Visa and private label consumer credit cards to Target's U.S. customers Primary issuer of Nordstrom credit cards in the U.S.
North American operational scale and professional expertise
Auto Lending Prime indirect lending to dealers in each of the 50 states and the District of Columbia Comprehensive banking solutions for our dealers, including floor plan, commercial banking and wealth management across the
TD Bank footprint Focused on strategic dealer partnerships where our value proposition best aligns with dealers’ needs and priorities
Wealth Building U.S. wealth capability in the high net worth and private banking space Acquired in 2013, Epoch Investment Partners expands overall product capabilities in the U.S. and Canada
TD Ameritrade Strategic relationship drives mutually beneficial customer referrals and growth Market leadership in trading in the U.S.5
Ranked Best in Class in the U.S. by StockBrokers.com for the fifth straight year6
1. Based on total deposits as of September 30, 2015. Source: SNL Financial, Largest Banks and Thrifts in the U.S. by total deposits. 2. Active branch count in New York City’s five boroughs as of October 31, 2015, based on SNL Financial. 3. TD Bank received the highest numerical score among retail banks in Florida in the J.D. Power 2016 Retail Banking Satisfaction Study, based on 76,233 responses from 10 banks, measuring opinions of consumers with their primary banking provider, surveyed April 2015-February
2016. Your experiences may vary. Visit jdpower.com 4. TD Bank, N.A. received the highest numerical score in the northeast in the proprietary J.D. Power 2015 Small Business Banking Satisfaction StudySM. Study based on 8,086 total responses, measuring 8 financial institutions in the northeast (Connecticut, Maine, Massachusetts,
New Hampshire, New Jersey, New York, Pennsylvania, Rhode Island, Vermont) and measures opinions of small business customers with annual revenues from $100,000 to $10 million. Proprietary study results are based on experiences and perceptions of customers surveyed in July-August 2015. Your results may vary. Visit www.jdpower.com.
5. Internally estimated daily average revenue client trades (DARTS) based on last twelve months publicly available reports for E*TRADE Financial and Charles Schwab as of March 31, 2015. 6. TD Ameritrade was ranked #2 overall in 2016 and #1 in 2012 to 2015 out of 15 online brokers evaluated in the StockBrokers.com Online Broker Review 2016. TD Ameritrade was also rated #1 or Best in Class (within top 5) in several categories, including “Offering of Investments”
(2nd year in a row), “Platforms & Tools” (5th year in a row), “Customer Service” (3rd year in a row), “Investor Education” (4th year in a row), “New Investors” (4th year in a row), “Research” (5th year in a row), “Mobile Trading” (4th year in a row), “Options Trading” (6th year in a row), and “Active Trading” (6th year in a row). TD Ameritrade also received awards for #1 Tablet App, # Desktop Platform, #1 Trader Community, and #1 New Tool.
Top 10 bank in the U.S. with significant growth opportunities
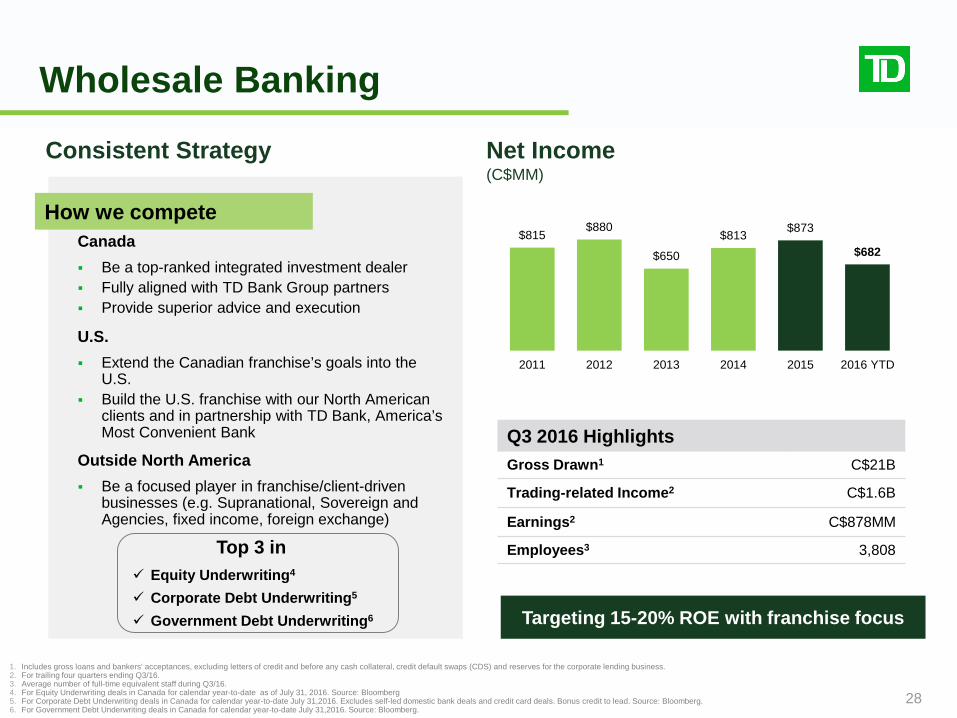
Wholesale Banking
28
$815 $880
$650
$813 $873
$682
2011 2012 2013 2014 2015 2016 YTD
Consistent Strategy
How we compete
Q3 2016 Highlights Gross Drawn1 C$21B
Trading-related Income2 C$1.6B
Earnings2 C$878MM
Employees3 3,808
Net Income
(C$MM)
Canada Be a top-ranked integrated investment dealer Fully aligned with TD Bank Group partners Provide superior advice and execution
U.S. Extend the Canadian franchise’s goals into the
U.S. Build the U.S. franchise with our North American
clients and in partnership with TD Bank, America’s Most Convenient Bank
Outside North America Be a focused player in franchise/client-driven
businesses (e.g. Supranational, Sovereign and Agencies, fixed income, foreign exchange)
Top 3 in
Equity Underwriting4
Corporate Debt Underwriting5
Government Debt Underwriting6
1. Includes gross loans and bankers' acceptances, excluding letters of credit and before any cash collateral, credit default swaps (CDS) and reserves for the corporate lending business. 2. For trailing four quarters ending Q3/16. 3. Average number of full-time equivalent staff during Q3/16. 4. For Equity Underwriting deals in Canada for calendar year-to-date as of July 31, 2016. Source: Bloomberg 5. For Corporate Debt Underwriting deals in Canada for calendar year-to-date July 31,2016. Excludes self-led domestic bank deals and credit card deals. Bonus credit to lead. Source: Bloomberg. 6. For Government Debt Underwriting deals in Canada for calendar year-to-date July 31,2016. Source: Bloomberg.
Targeting 15-20% ROE with franchise focus
How we compete
Wholesale Banking
29
Focus on client-driven franchise businesses Diversified business mix with a North American focus Presence in key global financial centres Extend our client-centric franchise model through superior advice and execution
A North American dealer aligned with our TD partners Focus on integrating the strength of the TD brand and alignment with our enterprise partners
Solid returns without going out the risk curve Disciplined and proactive risk management by focusing on franchise clients, counterparties, and
products Delivered strong business results while exiting proprietary-type businesses
Well positioned for growth Grow organically by broadening and deepening client relationships Be a top ranked integrated investment dealer in Canada by increasing our origination footprint
and competitive advantage with Canadian clients1
Expand the U.S. franchise by growing our service offerings to North American clients and partnering with U.S. retail
Grow foreign exchange, commodities and metals businesses globally
1. Ranked #2 Equity Block Trading and #1 Equity Options Block Trading (Block trades by value on all Canadian exchanges. Source: IRESS); #3 Government Debt Underwriting (Source: Bloomberg); # 2 Corporate Debt Underwriting (Excludes self-led domestic bank deals and credit card deals. Bonus credit to lead. Source: Bloomberg); #2 in Equity Underwriting (excludes self-led offerings, preferred share deals and retail structured products. Source: Bloomberg); #3 in M&A announced (Based on rolling 12 month period. Source : Bloomberg); and #2 in Canadian Syndicated Loans (Deal volume awarded proportionately to the Lead Arrangers. Based on rolling 4-quarter calendar period. Source: Bloomberg). All rankings are calendar year-to-date as of July 31, 2016 unless otherwise stated.
A client-centric wholesale franchise
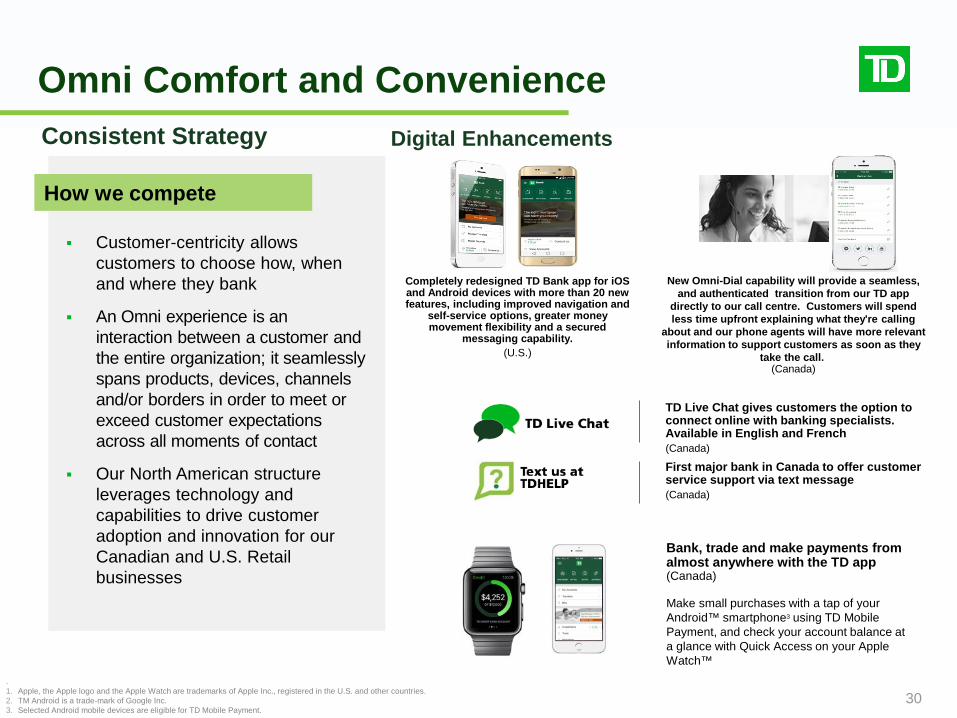
Omni Comfort and Convenience Consistent Strategy
Customer-centricity allows customers to choose how, when and where they bank
An Omni experience is an interaction between a customer and the entire organization; it seamlessly spans products, devices, channels and/or borders in order to meet or exceed customer expectations across all moments of contact
Our North American structure leverages technology and capabilities to drive customer adoption and innovation for our Canadian and U.S. Retail businesses
Bank, trade and make payments from almost anywhere with the TD app (Canada)
Make small purchases with a tap of your Android™ smartphone3 using TD Mobile Payment, and check your account balance at a glance with Quick Access on your Apple Watch™
First major bank in Canada to offer customer service support via text message (Canada)
TD Live Chat gives customers the option to connect online with banking specialists. Available in English and French (Canada)
How we compete
Completely redesigned TD Bank app for iOS and Android devices with more than 20 new features, including improved navigation and
self-service options, greater money movement flexibility and a secured
messaging capability. (U.S.)
New Omni-Dial capability will provide a seamless, and authenticated transition from our TD app
directly to our call centre. Customers will spend less time upfront explaining what they're calling
about and our phone agents will have more relevant information to support customers as soon as they
take the call. (Canada)
Digital Enhancements
. 1. Apple, the Apple logo and the Apple Watch are trademarks of Apple Inc., registered in the U.S. and other countries. 2. TM Android is a trade-mark of Google Inc. 3. Selected Android mobile devices are eligible for TD Mobile Payment.
30
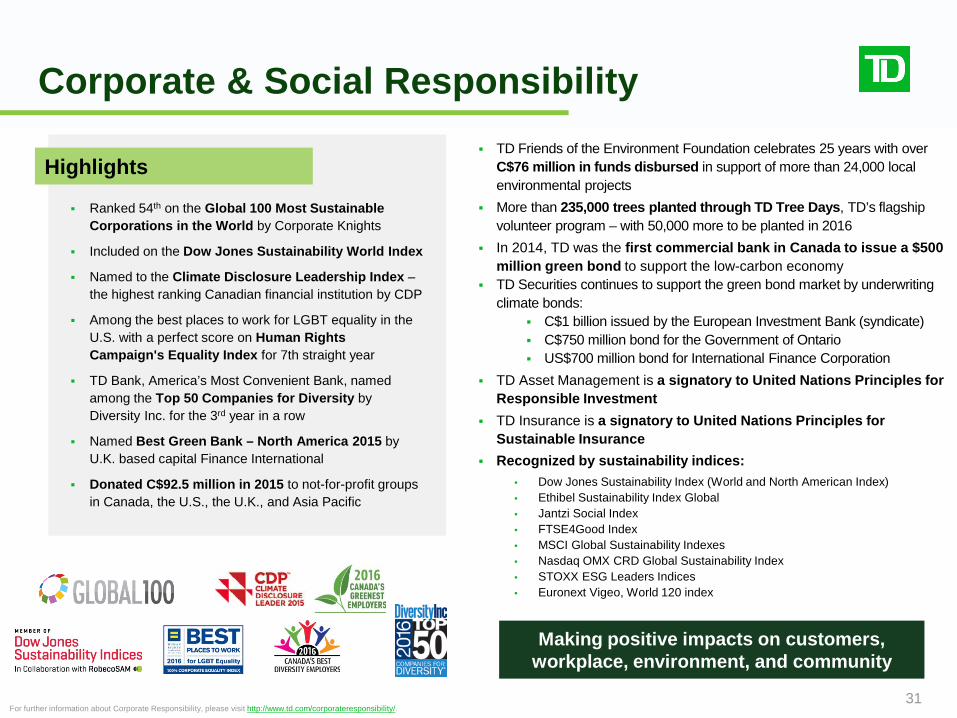
Corporate & Social Responsibility
31 For further information about Corporate Responsibility, please visit http://www.td.com/corporateresponsibility/.
Ranked 54th on the Global 100 Most Sustainable Corporations in the World by Corporate Knights
Included on the Dow Jones Sustainability World Index
Named to the Climate Disclosure Leadership Index – the highest ranking Canadian financial institution by CDP
Among the best places to work for LGBT equality in the U.S. with a perfect score on Human Rights Campaign's Equality Index for 7th straight year
TD Bank, America’s Most Convenient Bank, named among the Top 50 Companies for Diversity by Diversity Inc. for the 3rd year in a row
Named Best Green Bank – North America 2015 by U.K. based capital Finance International
Donated C$92.5 million in 2015 to not-for-profit groups in Canada, the U.S., the U.K., and Asia Pacific
TD Friends of the Environment Foundation celebrates 25 years with over C$76 million in funds disbursed in support of more than 24,000 local environmental projects
More than 235,000 trees planted through TD Tree Days, TD’s flagship volunteer program – with 50,000 more to be planted in 2016
In 2014, TD was the first commercial bank in Canada to issue a $500 million green bond to support the low-carbon economy
TD Securities continues to support the green bond market by underwriting climate bonds:
C$1 billion issued by the European Investment Bank (syndicate) C$750 million bond for the Government of Ontario US$700 million bond for International Finance Corporation
TD Asset Management is a signatory to United Nations Principles for Responsible Investment
TD Insurance is a signatory to United Nations Principles for Sustainable Insurance
Recognized by sustainability indices: • Dow Jones Sustainability Index (World and North American Index) • Ethibel Sustainability Index Global • Jantzi Social Index • FTSE4Good Index • MSCI Global Sustainability Indexes • Nasdaq OMX CRD Global Sustainability Index • STOXX ESG Leaders Indices • Euronext Vigeo, World 120 index
Making positive impacts on customers, workplace, environment, and community
Highlights
A Principled Approach
32
Guiding Principles
Make an Impact and Value Speed
Build for the Future
Inspire the Will to Win
Act Decisively while Working Effectively in Teams
Live Transparency and Respect Different Views
Show Excellent Judgment
Demonstrate Unwavering Integrity
Deliver Legendary Customer Experiences
Be an Extraordinary Place to Work
Operate with Excellence
Understand Our Business
Take Only Risks We Understand and Can Manage
Enhance Our Brand
Increase Shareholder Value
Living TD principles to be The Better Bank
Leadership Profile
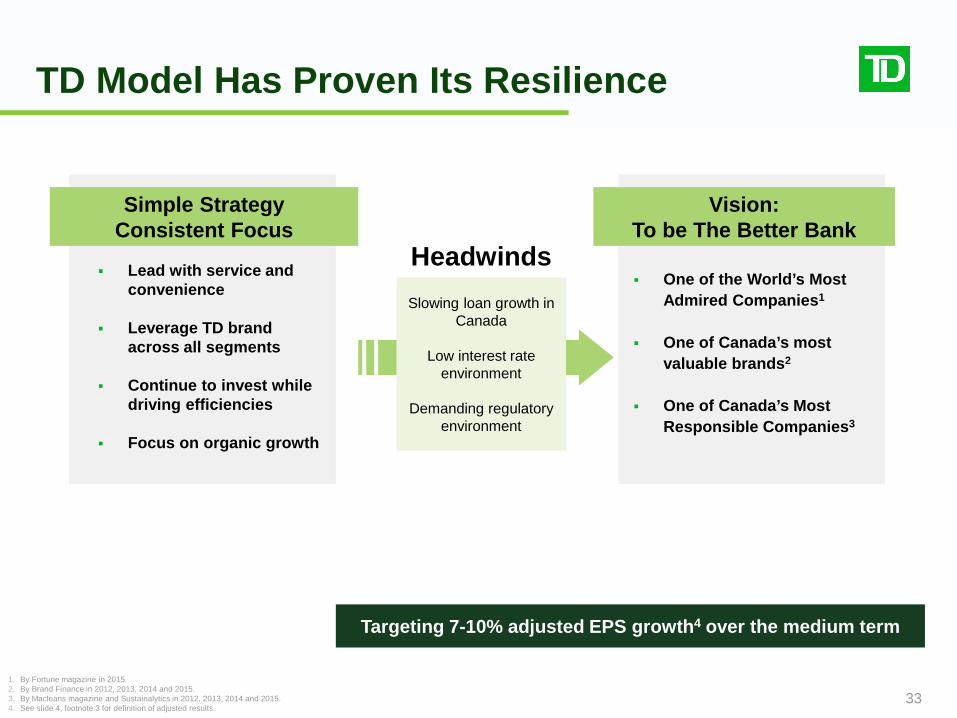
TD Model Has Proven Its Resilience
33
Headwinds Slowing loan growth in
Canada
Low interest rate environment
Demanding regulatory
environment
One of the World’s Most Admired Companies1
One of Canada’s most
valuable brands2
One of Canada’s Most
Responsible Companies3
Lead with service and convenience
Leverage TD brand across all segments
Continue to invest while driving efficiencies
Focus on organic growth
1. By Fortune magazine in 2015. 2. By Brand Finance in 2012, 2013, 2014 and 2015. 3. By Macleans magazine and Sustainalytics in 2012, 2013, 2014 and 2015. 4. See slide 4, footnote 3 for definition of adjusted results.
Targeting 7-10% adjusted EPS growth4 over the medium term
Simple Strategy Consistent Focus
Vision: To be The Better Bank
Investor Relations Contacts
34
Phone: 416-308-9030
or 1-866-486-4826
Email: [email protected]
Website:
www.td.com/investor
Best Investor Relations by
Sector: Financial Services
Best Corporate Governance
TD Bank Group Investor Presentation Q3 2016


