45
TD Bank Group Investor Presentation – Fixed Income Q3 2013

TD Bank GroupInvestor Presentation – Fixed Income
Q3 2013

2
Caution regarding forward-looking statements
From time to time, the Bank makes written and/or oral forward-looking statements, including in this document, in other filings with Canadianregulators or the U.S. Securities and Exchange Commission, and in other communications. In addition, representatives of the Bank maymake forward-looking statements orally to analysts, investors, the media and others. All such statements are made pursuant to the “safeharbour” provisions of, and are intended to be forward-looking statements under, applicable Canadian and U.S. securities legislation,including the U.S. Private Securities Litigation Reform Act of 1995. Forward-looking statements include, but are not limited to, statementsmade in this document, the Management’s Discussion and Analysis in the Bank’s 2012 Annual Report (“2012 MD&A”) under the headings“Economic Summary and Outlook”, for each business segment “Business Outlook and Focus for 2013” and in other statements regardingthe Bank’s objectives and priorities for 2013 and beyond and strategies to achieve them, and the Bank’s anticipated financial performance.Forward-looking statements are typically identified by words such as “will”, “should”, “believe”, “expect”, “anticipate”, “intend”, “estimate”,“plan”, “may”, and “could”.By their very nature, these forward-looking statements require the Bank to make assumptions and are subject to inherent risks anduncertainties, general and specific. Especially in light of the uncertainty related to the physical, financial, economic, political, and regulatoryenvironments, such risks and uncertainties – many of which are beyond the Bank’s control and the effects of which can be difficult topredict – may cause actual results to differ materially from the expectations expressed in the forward-looking statements. Risk factors thatcould cause such differences include: credit, market (including equity, commodity, foreign exchange, and interest rate), liquidity,operational (including technology), reputational, insurance, strategic, regulatory, legal, environmental, capital adequacy, and other risks.Examples of such risk factors include the impact of recent U.S. legislative developments, as discussed under “Significant Events in 2012”in the “Financial Results Overview” section of the 2012 MD&A; changes to and new interpretations of capital and liquidity guidelines andreporting instructions; changes to the Bank’s credit ratings; changes in interest rates; increased funding costs for credit due to marketilliquidity and competition for funding; the occurrence of natural and unnatural catastrophic events and claims resulting from such events;the failure of third parties to comply with their obligations to the Bank or its affiliates relating to the care and control of information;disruptions in or attacks (including cyber attacks) on the Bank’s information technology, internet, network access or other voice or datacommunications systems or services; and the overall difficult litigation environment, including in the United States. We caution that thepreceding list is not exhaustive of all possible risk factors and other factors could also adversely affect the Bank’s results. For more detailedinformation, please see the “Risk Factors and Management” section of the 2012 MD&A, as may be updated in subsequently filed quarterlyreports to shareholders and news releases (as applicable) related the transactions discussed under the heading “Significant Events” in therelevant MD&A, which applicable releases may be found on td.com. All such factors should be considered carefully, as well as otheruncertainties and potential events, and the inherent uncertainty of forward-looking statements, when making decisions with respect to theBank and we caution readers not to place undue reliance on the Bank’s forward-looking statements.Material economic assumptions underlying the forward-looking statements contained in this document are set out in the 2012 MD&A underthe headings “Economic Summary and Outlook”, and for each business segment, “Business Outlook and Focus for 2013”, each asupdated in subsequently filed quarterly reports to shareholders.Any forward-looking statements contained in this document represent the views of management only as of the date hereof and arepresented for the purpose of assisting the Bank’s shareholders and analysts in understanding the Bank’s financial position, objectives andpriorities and anticipated financial performance as at and for the periods ended on the dates presented, and may not be appropriate forother purposes. The Bank does not undertake to update any forward-looking statements, whether written or oral, that may be made fromtime to time by or on its behalf, except as required under applicable securities legislation.

3
Contents
1. TD Bank Group2. Canadian Economy
3. Treasury & Balance Sheet Management
4. Appendix

4
TD Bank Group
Our BusinessesCanadian Personal & Commercial
Wholesale
U.S. Personal & Commercial
Wealth & Insurance
Direct investing Advice-based wealth business Asset management Insurance
2,481Business Locations1
Q3 20132 (C$) CAD P&C
U.S. P&C
Total Deposits3 $224B $193B
Total Loans4 $308B $106B
Rpt. Earnings5 $3.5B $1.5B
Adj. Earnings5 $3.6B $1.6B
Customers 13MM 8MM
Employees6 28,345 24,811
Lower-risk retail focused North American bank1. Number of North American retail outlets at the end of Q3/13.2. Q3/13 is the period from May 1, 2013 to July 31, 2013.3. Total Deposits based on total of average personal and business deposits during Q3/13. U.S. deposits include TD Ameritrade Insured Deposit Accounts (IDAs).4. Total Loans based on total of average personal and business loans during Q3/13.5. For trailing four quarters ended Q3/13. See slide 5, footnote 3 for definition of adjusted results.6. Average number of full-time equivalent staff during Q3/13.
Personal banking, credit cards and auto finance Small business and commercial banking
Personal banking, credit cards and auto finance Small business and commercial banking Corporate and specialty banking
Research Investment banking Capital markets Global transaction banking
5
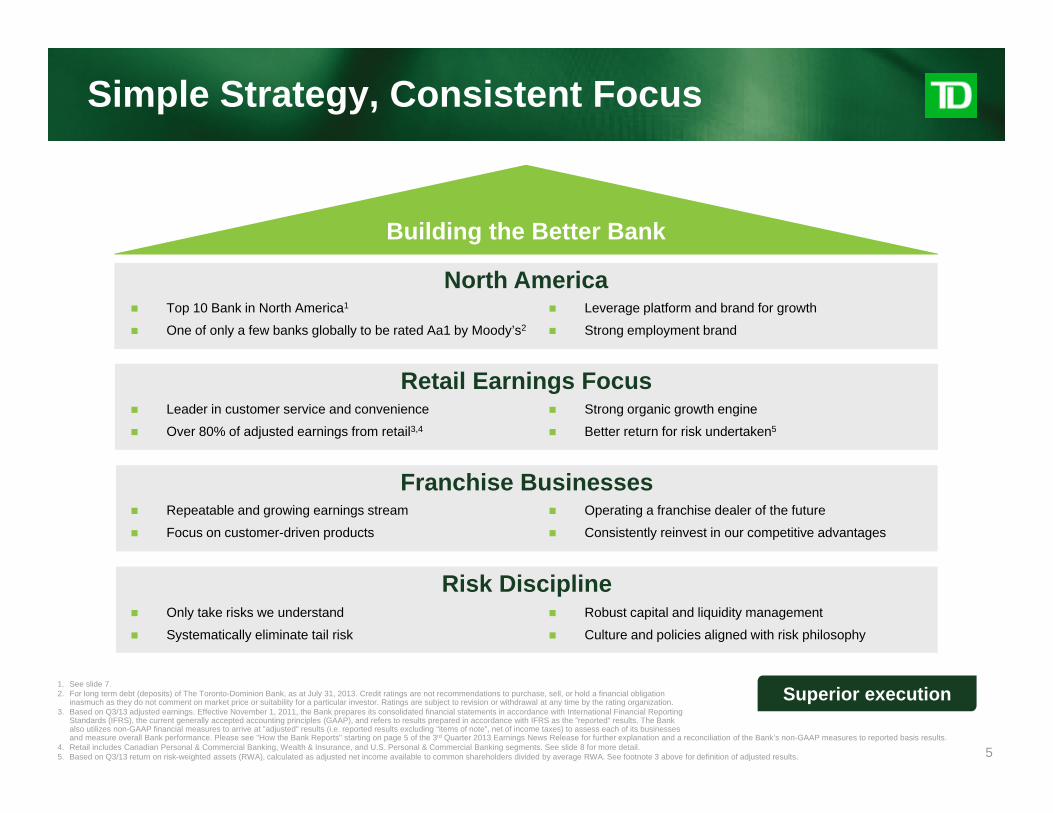
Simple Strategy, Consistent Focus
Building the Better Bank
Franchise Businesses
Retail Earnings Focus
Risk Discipline
North America Top 10 Bank in North America1
One of only a few banks globally to be rated Aa1 by Moody’s2
Leverage platform and brand for growth
Strong employment brand
Leader in customer service and convenience
Over 80% of adjusted earnings from retail3,4
Repeatable and growing earnings stream
Focus on customer-driven products
Only take risks we understand
Systematically eliminate tail risk
Strong organic growth engine
Better return for risk undertaken5
Operating a franchise dealer of the future
Consistently reinvest in our competitive advantages
Robust capital and liquidity management
Culture and policies aligned with risk philosophy
Superior execution1. See slide 7.2. For long term debt (deposits) of The Toronto-Dominion Bank, as at July 31, 2013. Credit ratings are not recommendations to purchase, sell, or hold a financial obligation
inasmuch as they do not comment on market price or suitability for a particular investor. Ratings are subject to revision or withdrawal at any time by the rating organization.3. Based on Q3/13 adjusted earnings. Effective November 1, 2011, the Bank prepares its consolidated financial statements in accordance with International Financial Reporting
Standards (IFRS), the current generally accepted accounting principles (GAAP), and refers to results prepared in accordance with IFRS as the ”reported” results. The Bank also utilizes non-GAAP financial measures to arrive at "adjusted" results (i.e. reported results excluding “items of note”, net of income taxes) to assess each of its businesses and measure overall Bank performance. Please see "How the Bank Reports" starting on page 5 of the 3rd Quarter 2013 Earnings News Release for further explanation and a reconciliation of the Bank’s non-GAAP measures to reported basis results.
4. Retail includes Canadian Personal & Commercial Banking, Wealth & Insurance, and U.S. Personal & Commercial Banking segments. See slide 8 for more detail.5. Based on Q3/13 return on risk-weighted assets (RWA), calculated as adjusted net income available to common shareholders divided by average RWA. See footnote 3 above for definition of adjusted results.

6
Competing in Attractive Markets
10th largest economy Nominal GDP of C$1.7 trillion Population of 35 million
TD’s Canadian P&C3 Business
Canadian Banking System
Country Statistics
World’s largest economy Nominal GDP of US$15.1 trillion Population of 314 million
TD’s U.S. P&C3 Business
U.S. Banking System
Country Statistics
Significant growth opportunities within TD’s footprint1. World Economic Forum, Global Competitiveness Reports 2008-2013.2. Includes securitizations. As per Canada Mortgage and Housing Corporation (CMHC).3. “P&C” refers to Personal & Commercial Banking.4. Based on SNL Bank and Thrifts as of 06/30/2011.5. New mortgage origination volume in 2011 from Moody’s.
Soundest banking system in the world1
Market leadership position held by the “Big 5” Canadian Banks
Canadian chartered banks account for more than 70% of the residential mortgage market2
Mortgage lenders have recourse to both borrower and property in most provinces
Network of 1,169 branches and 2,827 ATMs Composite market share of 21% Ranked #1 or #2 in market share for most
retail products Top tier dual credit card issuer
Over 9,000+ banks with market leadership position held by a few large banks
The 5 largest banks have assets > 50% of the U.S. economy
Mortgage lenders have limited recourse in most jurisdictions
Network of 1,312 stores and 1,884 ATMs Operations in 5 of the top 10 metropolitan
statistical areas and 7 of the 10 wealthiest states > US$1.6T deposits market4 US$200B in mortgage originations5
Access to nearly 55 million customers within five miles of TD stores

7
TD Bank Group in North America
TD is a Top 10 Bank in North America1. See slide 5, footnote 3, for definition of adjusted results. 2. Effective Q1/13, amounts are calculated in accordance with the Basel III regulatory framework, and are presented based on the “all-in”
methodology. Prior to Q1/13, amounts were calculated in accordance with the Basel II regulatory framework.3. Average number of full-time equivalent staff for Q3/13. 4. See slide 5, footnote 2.5. Canadian Peers – includes other 4 big banks (RY, BMO, BNS and CM) adjusted on a comparable basis to exclude identified non-underlying items. Based on Q3/13 results ended July 31, 2013.6. North American Peers – includes Canadian Peers and U.S. Peers. U.S. Peers – includes Money Center Banks (C, BAC, JPM) and Top 2 Super-Regional Banks (WFC, USB). Adjusted on a comparable basis to exclude identified non-underlying
items. For U.S. Peers, based on Q2/13 results ended June 30, 2013.
Q3 2013
(C$ billions)
Compared to:
CanadianPeers5
North American
Peers6
Total Assets $835B 2nd 6th
Total Deposits $508B 2nd 6th
Market Cap (as of August 30, 2013) $82B 2nd 6th
Adj. Net Income1 (Trailing 4 Quarters) $7.1B 2nd 6th
Rpt. Net Income (Trailing 4 Quarters) $6.6B n/a n/a
Tier 1 Capital Ratio2 11.0% 4th 9th
Avg. # of Full-Time Equivalent Staff3 78,917 2nd 6th
Moody’s Rating4 Aa1 n/a n/a
8
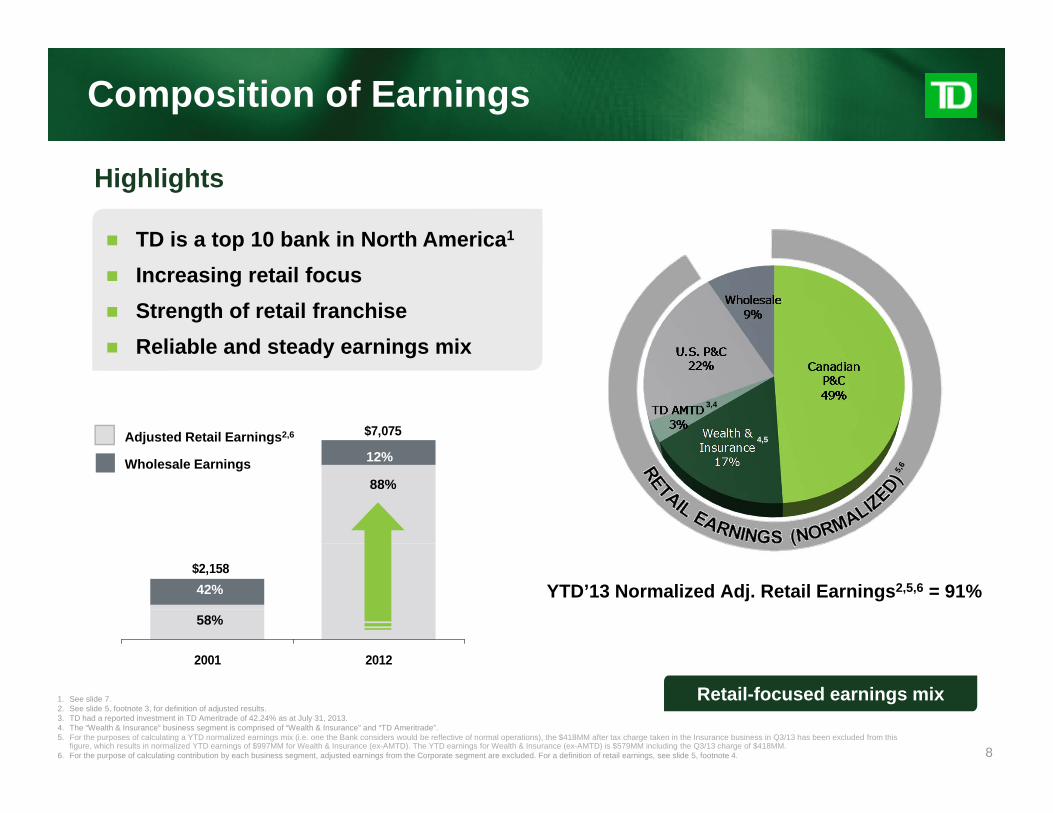
Composition of Earnings
Retail-focused earnings mix
YTD’13 Normalized Adj. Retail Earnings2,5,6 = 91%$2,158
$7,075
2001 2012
58%
42%
88%
13%
TD is a top 10 bank in North America1
Increasing retail focus Strength of retail franchise Reliable and steady earnings mix
Adjusted Retail Earnings2,6
Wholesale Earnings
Highlights
12%
1. See slide 7.2. See slide 5, footnote 3, for definition of adjusted results. 3. TD had a reported investment in TD Ameritrade of 42.24% as at July 31, 2013.4. The “Wealth & Insurance” business segment is comprised of “Wealth & Insurance” and “TD Ameritrade”.5. For the purposes of calculating a YTD normalized earnings mix (i.e. one the Bank considers would be reflective of normal operations), the $418MM after tax charge taken in the Insurance business in Q3/13 has been excluded from this
figure, which results in normalized YTD earnings of $997MM for Wealth & Insurance (ex-AMTD). The YTD earnings for Wealth & Insurance (ex-AMTD) is $579MM including the Q3/13 charge of $418MM.6. For the purpose of calculating contribution by each business segment, adjusted earnings from the Corporate segment are excluded. For a definition of retail earnings, see slide 5, footnote 4.
4
3,4
4,5

9
Evolution of TD Building Franchise Businesses
Wound down structuredproductsbusiness
Exited non-franchise
proprietary trading
Recorded media/ telecom/energy
loan losses
Did not acquire large-scale investment
dealer
Exited non-franchise
creditproducts
>>> Increasing Retail focus >>>
Traditional Dealer >>> >>> Franchise Dealer
Strategic evolution to a lower-risk retail focused bank with a franchise dealer
• • • • •• •• •• • • •Late ‘90s
2000 2001 2002-2004
2005 2006 2007 2008 2009 2010 2011 2012 2013
TD Bank and Canada Trust merge
Acquired 51% of
Banknorth
Privatized TD
Banknorth
Acquired Commerce
Bank
AcquiredNewcrestCapital
TD Waterhouse
USA/ Ameritrade transaction
Commerce Bank
integration
Acquired Riverside & TSFG
Acquired Chrysler Financial
and MBNA credit card portfolio
Acquired Target credit card portfolio & Epoch andannounced agreement with Aimia

10
Our Risk Appetite
Integrated risk monitoring and reporting To senior management and Board of Directors
Regular review, evaluation and approval of risk framework Structured Risk Appetite governance, from the Business to the Board Executive Committees and Risk Committee of the Board
Risk Management Framework
Fit our business strategy and can be understood and managed
Do not expose the enterprise to any significant single loss events; we don’t “bet the bank” on any single acquisition, business or product
Do not risk harming the TD brand
We take risks required to build our business, but only if those risks:
Proactive and disciplined risk management practices

11
Q3 2013 Highlights
Dividend per Common Share
= Announced dividend increase
Key Themes
1. See slide 5, footnote 3 for definition of adjusted results. 2. See slide 5, footnote 4 for definition of retail earnings. Reported retail results were $1,425 million, down 11% and 6% versus Q2/13 and Q3/12 respectively.
Net Income $MM(Adjusted, where applicable)1
Adjusted1 EPS decline of 14% YoY driven by Insurance loss
Record quarter for Canadian P&C, Wealth Management and U.S. P&C
Credit quality continues to improve in Canada and the U.S.
Strong capital ratio of 8.9%
Very strong results impacted by insurance charges
Q3/13 QoQ YoY
Retail2 $ 1,449 -12% -10%
Wholesale 147 -33% -18%
Corporate (8) -69% n/a
Adjusted Net Income $ 1,588 -13% -13%
Reported Net Income 1,527 -11% -10%
Adjusted EPS (diluted) $ 1.65 -13% -14%
Reported EPS (diluted) 1.58 -11% -11%
Basel III CET1 Ratio 8.9%
12
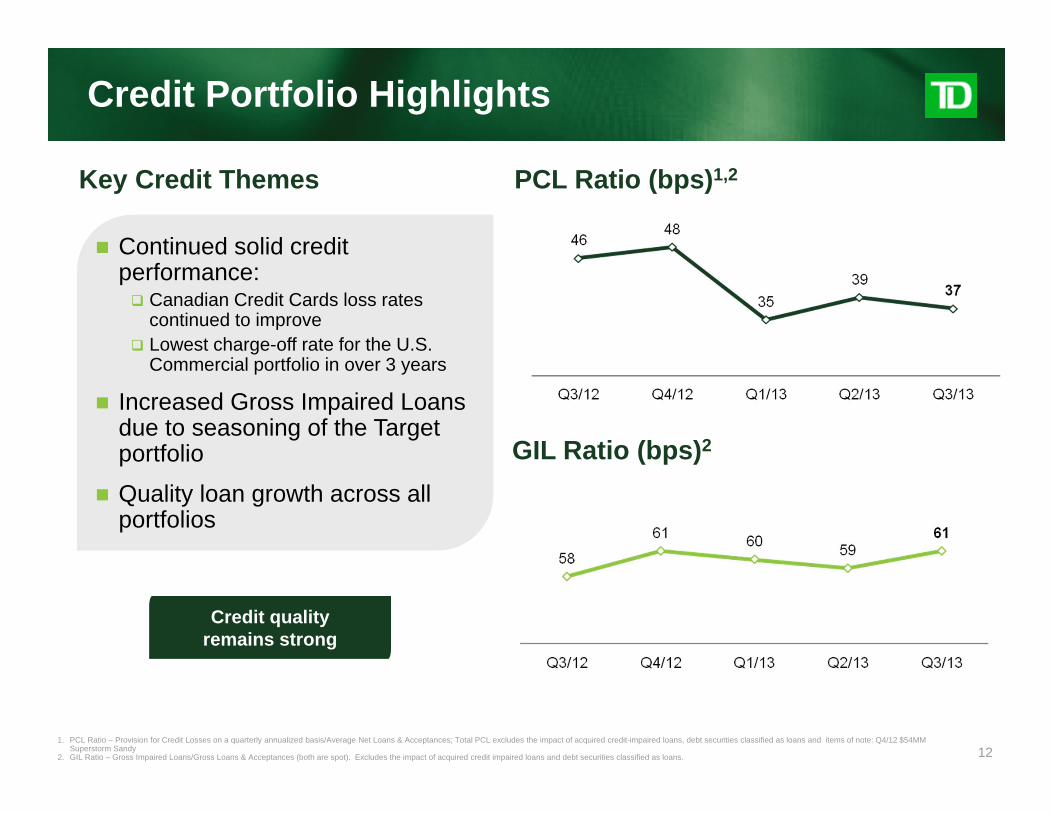
Credit Portfolio Highlights
PCL Ratio (bps)1,2
GIL Ratio (bps)2
Key Credit Themes
Credit qualityremains strong
1. PCL Ratio – Provision for Credit Losses on a quarterly annualized basis/Average Net Loans & Acceptances; Total PCL excludes the impact of acquired credit-impaired loans, debt securities classified as loans and items of note: Q4/12 $54MM Superstorm Sandy
2. GIL Ratio – Gross Impaired Loans/Gross Loans & Acceptances (both are spot). Excludes the impact of acquired credit impaired loans and debt securities classified as loans.
Continued solid credit performance: Canadian Credit Cards loss rates
continued to improve Lowest charge-off rate for the U.S.
Commercial portfolio in over 3 years
Increased Gross Impaired Loans due to seasoning of the Target portfolio
Quality loan growth across all portfolios
13
Contents
1. TD Bank Group
2. Canadian Economy3. Treasury & Balance Sheet Management
4. Appendix

14
Canada’s Relative Strengths
One of the world’s most competitive economies1
Soundest banking system in the world1
Unemployment rate remains below prior recessionary peaks
One of the strongest fiscal positions among G-7 industrialized countries Relatively low projected deficits and debt
Source: TD Economics1. The World Economic Forum, Global Competitiveness Report 2008-2013

15
Solid Financial System in Canada
Strong retail and commercial banks Conservative lending standards All major wholesale dealers owned by Canadian banks, with stable retail
earnings base to absorb any wholesale write-offs
Responsive government and central bank Proactive policies and programs to ensure adequate liquidity in the system Updated mortgage rules moderate the market and protect consumers
Judicious regulatory system Principles-based regime, rather than rules-based One single regulator for all major banks Conservative capital rules, requirements above world standards Capital requirements based on risk-weighted assets
The world’s soundest banking system1
1. According to the World Economic Forum Global Competitiveness Report for 2008-2013.

16
Well Developed Residential Mortgage Market in Canada
Canadian chartered banks account for around 75% of the total mortgage market, including securitizations1
Conservative lending practices
Strong competition among lenders
Favorable legal environment supporting foreclosure and other types of legal recourse to recoup losses
Total Residential Mortgages
Outstanding2 ($B)
$0
$200
$400
$600
$800
$1,000
$1,200
1999 2000 2001 2002 2003 2004 2005 2006 2007 2008 2009 2010 2011 2012
1. Canada Mortgage and Housing Corporation (CMHC)2. Statistics Canada

17
Canada U.S.
Product
Conservative product offerings: fixed or variable interest rate option
Outstanding mortgages include earlier exotic products (interest only, options ARMs)
Default insured mortgages use a 5-year fixed qualifying rate for loans with variable rates or terms less than 5 years
Borrowers often qualified using discounted teaser rates payment shock on expiry (underwriting standards have since been tightened)
Underwriting
Terms usually 5 years or less, renewable at maturity 30 year term most common
Maximum amortization is 25 years and maximum loan to value (LTV) to 80% for a refinance
Amortization usually 30 years, can be up to 50 years
Mortgage insurance mandatory if LTV over 80%, covers full loan amount
Mortgage insurance often used to cover portion of LTV over 80%
Regulation and Taxation
Mortgage interest not tax deductible Mortgage interest is tax deductible, creating an incentive to borrow
Lenders have recourse to both borrower and property in most provinces
Lenders have limited recourse in most jurisdictions
Sales Channel External broker channel originated up to 30% External broker channel originated up to 70% at peak, now less than 30%
Canadian Mortgage Market is Different from the U.S.
Source: DBRS, Federal Trade Commission, TD Economics

18
Canadian Housing Market
Topic TD Positioning
Canadian RESL Portfolio
$223 billion portfolio (65% insured) Average Current LTV of 47%
Condo Borrower Exposure
$33 billion portfolio (69% insured) LTV, credit score and delinquency rate consistent with broader
portfolio
Hi-Rise Condo Developer Exposure
Stable portfolio volumes of < 1.5% of the Canadian Commercial portfolio
Exposure limited to experienced borrowers with demonstrated liquidity and long-standing relationship with TD
Housing sales continue to be supported by attractive affordability, demographics and employment stability
Canadian RESL credit quality remains strong General Allowance of $65 million taken for the Alberta flood
Highlights

19
Mortgage Rule Developments in Canada
Maximum amortization period lowered from 30 years to 25 years Maximum amount that Canadians can borrow when refinancing lowered to 80% from 85% Maximum GDS and TDS ratios of 39% and 44% respectively Insured mortgages only available on homes with a purchase price of less than $1 million Rules only apply to high ratio mortgages (mortgages requiring government insurance) Took effect on July 9, 2012 avoiding a rush to beat the new rule (as seen in 2011)
2012 Measures Announced by Minister Flaherty (Government of Canada)
2012 Highlights of Guideline B-20 (OSFI) Maximum loan-to-value of 65% for a HELOC (from 80%) HELOCs will not amortize, but lenders must expect an ability to fully repay over time Qualifying rate for conventional mortgages with variable rates or fixed rate terms less than
5 years will be “the greater of the contractual mortgage rate or the five-year benchmark rate published by the Bank of Canada”
LTV to be re-calculated upon refinancing and whenever the lender deems prudent Federally regulated lenders have until “no later than fiscal year-end 2012” to comply
Sources: OSFI, Veritas, TD Economics

20
North American EconomyOutlook
2013 will be another year of moderate growth for Canada and the U.S. Uncertainty over government policies has somewhat dissipated, but
unresolved issues remain in both the U.S. and Europe
U.S. economy remains a mix of good news and bad news Residential real estate will make a positive contribution to growth in 2013 Fiscal consolidation is here, and will likely weigh on growth over the next few
years
Canadian economy closely linked to U.S. fortunes – firming in U.S. private demand helps Canada’s prospects Domestic demand will be restrained by high household debt burdens, and
cooling housing market
Source: TD Economics
Expect modest growth

21
Contents
1. TD Bank Group
2. Canadian Economy
3. Treasury & Balance Sheet Management 4. Appendix

22
Capital
Basel III Common Equity Tier 11Highlights
Remain well-positioned for evolving regulatory and capital environment
Risk-Weighted Assets1(C$B)
Basel III Common Equity Tier 1 ratio of 8.9% as of July 31, 2013 Includes 30 bps of relief from OSFI
on treatment of CVA
Managing capital volatility – AOCI
Dividend increase of $0.04 per share payable in Q4 2013
Share buyback program on track with over 7 million shares repurchased (as at August 23)
1. Effective Q1/13, amounts are calculated in accordance with the Basel III regulatory framework, excluding Credit Valuation Adjustment Capital (CVAc) in accordance with OSFI guidance and are presented based on the “all-in” methodology. Basel III Common Equity Tier 1 ratios reported in 2012 are pro-forma estimates reported in the Q4/12, Q3/12, Q2/12 and Q1/12 MD&A (available at td.com).

23
TD Credit Ratings
TD Canadian Peers U.S. Peers
Baa2
1. See footnote 2 on slide 5.2. Canadian peers include RY, BNS, BMO and CM.3. US peers include BAC, BBT, C, CITZ, JPM, MTB, PNC, SOV, STI, USB and WFC.
Moody's S&P Fitch DBRS
Ratings Aa1 AA- AA- AA
Outlook Stable Stable Stable Stable
Issuer Ratings1
AAAA-
BBBBBB-
S&P Long-Term Debt Rating
Ratings vs. Peer Group
Strong credit ratings
A+AA-BBB+
TD Canadian Peers U.S. Peers
Aa1Aa2
Baa1
Moody’s Long-Term Debt Rating
Aa3A1A2A3

24
Robust Liquidity Management
Treasury paradigm Contribute to stable and growing earnings “Treasury does not have the authority not to hedge,” within limits No black boxes
Match terms of assets and liabilities Do not engage in liquidity carry trade Match underlying funding maturities to term of assets
Disciplined transfer pricing process Credit deposit products for liquidity provided and charge lending products for liquidity
consumed
Global liquidity risk management framework Hold sufficient liquid assets to meet a “Severe Combined Stress” scenario for a
minimum 90-day period Each liquidity management unit has its own policy and contingent funding plan Monitor global funding market conditions and potential impacts to funding access
Conservative liquidity policies
25
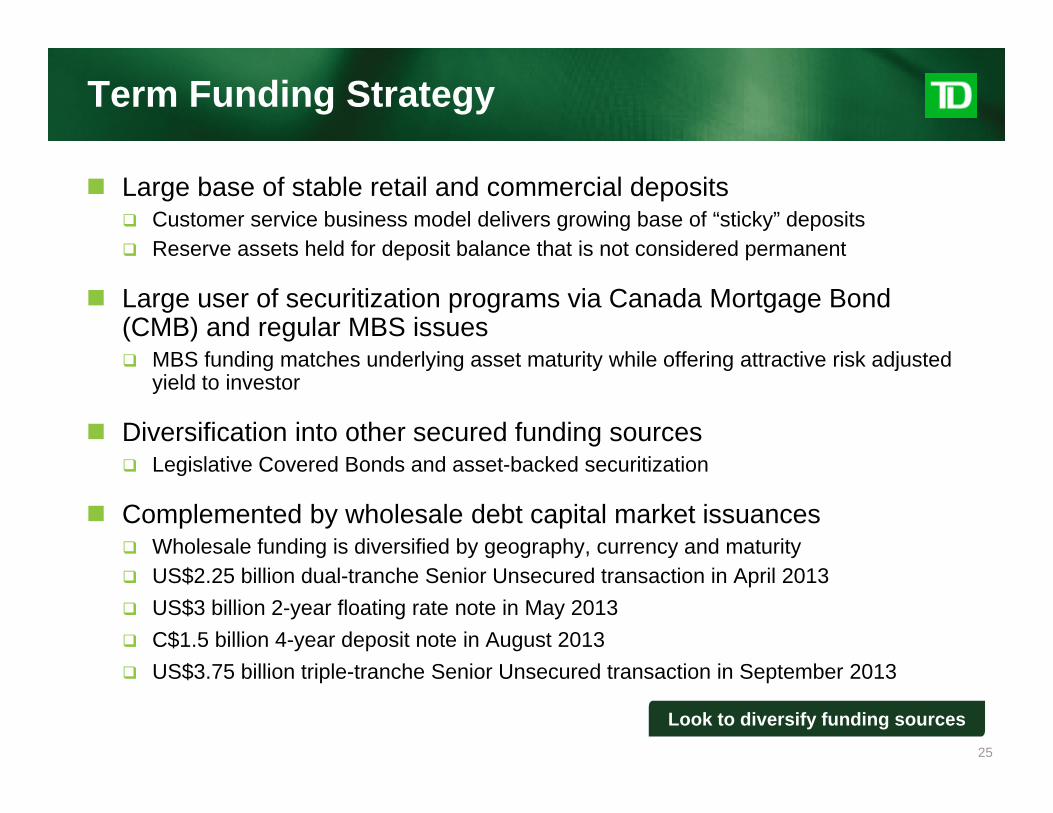
Term Funding Strategy
Large base of stable retail and commercial deposits Customer service business model delivers growing base of “sticky” deposits Reserve assets held for deposit balance that is not considered permanent
Large user of securitization programs via Canada Mortgage Bond (CMB) and regular MBS issues MBS funding matches underlying asset maturity while offering attractive risk adjusted
yield to investor
Diversification into other secured funding sources Legislative Covered Bonds and asset-backed securitization
Complemented by wholesale debt capital market issuances Wholesale funding is diversified by geography, currency and maturity US$2.25 billion dual-tranche Senior Unsecured transaction in April 2013 US$3 billion 2-year floating rate note in May 2013 C$1.5 billion 4-year deposit note in August 2013 US$3.75 billion triple-tranche Senior Unsecured transaction in September 2013
Look to diversify funding sources

26
Attractive Balance Sheet Composition
Funding Mix1 Wholesale Term Debt2
1. As of July 31, 2013. Excludes certain liabilities which do not create funding which are: acceptances, trading derivatives, other liabilities, non-controlling interest and certain equity capital: common equity and other capital instruments2. As of July 31, 20133. Bank, Business & Government Deposits less covered bonds and senior MTN notes4. Obligations related to securities sold short and sold under repurchase agreements5. Based on first par redemption date. Any assumption on the timing of a redemption is subject to management’s view at the time of redemption as well as applicable regulatory and corporate governance approvals
P&C Deposits71%
Personal Term Deposits
9%
Personal Non‐Term Deposits
36%
Other Deposits326%
Short Term Liabilities4
11%
Senior Unsecured MTN26%
Covered Bonds 15%
Residential Mortgages58%
Personal Term Deposits
9%
Personal Non‐Term Deposits 37%
Other Deposits325%
Short Term Liabilities 410%
Wholesale Term Debt 10%
TradingDeposits
8%
Sub‐Debt 51% Credit Card
Receivables & Consumer
Installment Loans1%
Assets Securitized 59%
Personal and commercial deposits are primary sources of funds

27
Debt Maturity Profile1 F2013 – F2018
1. For wholesale term debt that has bullet maturities2. As of July 31, 2013
Bullet Debt Maturities (C$ billions)2
Manageable debt maturities
$9$8
$13$13
$18 $18
$0
$5
$10
$15
$20
2013 2014 2015 2016 2017 2018
MBS Covered Bond Senior Debt ABS Subordinated Debt
28
Canada Covered Bond Legislation
The Covered Bond legal framework was announced in the 2012 Budget and passed into law in June 2012
Canada Mortgage and Housing Corporation (“CMHC”) was given responsibility to administer the covered bond legal framework
In December 2012, the CMHC issued the “Canadian Registered Covered Bond Programs Guide”, which was subsequently revised in June 2013 Eligible asset requirements and restrictions Shared Security, Cross Defaults and Set-offs conditions provided Indexation required in July 2014 ACT, Amortization and Valuation tests
29
Key Takeaways
Strong capital base – well positioned for Basel III
Industry leading credit ratings
Proactive & disciplined risk management
Attractive balance sheet composition
Diverse funding strategy to support growth plans

30
Contents
1. TD Bank Group
2. Canadian Economy
3. Treasury & Balance Sheet Management
4. Appendix

Global Economic Outlook
-2
0
2
4
6
2004 2006 2008 2010 2012 2014
Global economic growth will moderately increase next year
Fiscal consolidation in the U.S. and weak global growth means North American economy to expand at a modest pace
U.S. growth to outpace Canada on average over the next few years
World Real GDP Growth1
North American Real GDP Growth2
1. Forecast by TD Economics as of June 2013. Source: IMF, TD Economics.2. Forecast by TD Economics as of June 2013. Source: Bureau of Economic Analysis, Statistics Canada.
Forecast1
Y/Y % Change
-4
-2
0
2
4
2005 2006 2007 2008 2009 2010 2011 2012 2013 2014
(%)
Forecast2
CANADA U.S.
Modest growth in store for North American economy
For an economic update please refer to www.td.com/economics 31

-25
-20
-15
-10
-5
0
5
10
15
20
25
1982 1988 1994 2000 2006 2012
Canadian Real Exports
U.S. Activity Index
Forecast
Canadian Economic Outlook
Canadian economy still tightly linked to U.S. fortunes, and better U.S. growth in medium term to help Canada’s prospects
Only modest support from domestic demand, as the housing market slows and high household debt restrains spending
Canadian Export and U.S. Activity Index1
Change in Domestic Demand2
1. Forecast by TD Economics as of June 2013. Source: Bureau of Economic Analysis, Statistics Canada, Federal Reserve, Bank of Canada. 2. Source: Haver, TD Economics. Forecast by TD Economics as of June 2013.
Y/Y % Change
Forecast1
U.S. Activity IndexCanadian Exports
-2
0
2
4
6
2007 2008 2009 2010 2011 2012 2013 2014
Forecast2
Y/Y % Change
Canadian Economy to be supported by U.S. growth and domestic demand
For an economic update please refer to www.td.com/economics 32

U.S. Economic Outlook
-2.0-1.5-1.0-0.50.00.51.01.5
2004 2005 2006 2007 2008 2009 2010 2011 2012 2013 2.14
Housing, the culprit of the Great Recession, has begun to recover in earnest. Residential investment contributed positively to growth last year for the first time since 2005.
Fiscal restraint will weigh heavily on growth this year, but the impact should taper off in the coming years.
Residential Real Estate
Expected Federal Fiscal Stimulus/Drag2
1. Estimates by TD Economics as of June 2013. Residential construction & housing wealth. Source: BEA. 2. Forecast by TD Economics as of June 2013.
Forecast1
Contribution to real GDP growth1 (Y/Y % Change)
-1.5
-1.0
-0.5
0.0
0.5
1.0
1.5
2012 2013 2014 2015
Impact on Real GDP Growth
U.S. Economy – Good News & Bad News
For an economic update please refer to www.td.com/economics 33

Interest Rate Outlook
Modest outlook and risks to the global economy mean North American central banks are set to leave monetary policy at exceptionally accommodative levels for a while
1. Forecast by TD Economics as at June 2013. Source: Bank of Canada, Federal Reserve, TD Economics.
Interest Rates, Canada and U.S.1
0
1
2
3
4
5
6
7
2000 2002 2004 2006 2008 2010 2012 2014
%
Forecast
Bank of Canada Target
Rate
US Federal Funds Rate
Interest rates to remain lower for longer
For an economic update please refer to www.td.com/economics 34

35
Solid Growth and Returns Across Businesses
$4,189 $3,813
$4,716
$5,228
$6,432
$7,075
$5,337
2007 2008 2009 2010 2011 2012 YTD 2013
Adjusted Retail Earnings as % of Adjusted Earnings
80% 98% 78% 83% 87% 88%
Wholesale Banking
U.S. P&C
Wealth & Insurance2
Canadian P&C2
1. The Bank transitioned from Canadian Generally Accepted Accounting Principles (GAAP) to International Reporting Standards (IFRS) effective November 1, 2011. As a result of this transition, balances presented in the graph above are based on Canadian GAAP for 2008 to 2010 and based on IFRS for 2011 to 2012. For details on the Bank’s transition from Canadian GAAP to IFRS please see Note 40 of the 2012 Financial Statements and Notes. See slide 5. footnote 3 for definition of adjusted results. See also pages 186-191 of the 2012 Annual Report for a reconciliation for 10 years ending FY12. For the purpose of calculating contribution by each business segment, adjusted earnings from the Corporate segment are excluded. For additional information, also see the Canadian P&C, Wealth & Insurance, U.S. P&C and Wholesale segment discussions in the Business Segment Analysis section of the 2007-2012 Annual Reports.
2. Effective July 4, 2011, executive responsibilities for TD Insurance were moved from Group Head Canadian P&C Segment to Group Head Wealth Segment. Results are updated to the future reporting format for segment reporting purposes effective Q1 2012. These changes were applied retroactively to 2011 for comparative purposes.
3. As a result of the Bank’s transition to IFRS as described above, the calculation of the Compounded Annual Growth Rate (CAGR) includes balances based on Canadian GAAP from 2008 to 2010 and balances based on IFRS from 2011 to 2012.
Targeting 7-10% adjusted EPS growth over the medium term
Adjusted Earnings1,2(C$MM)
90%

36
Gross Lending PortfolioIncludes B/As
1. U.S. HELOC includes Home Equity Lines of Credit and Home Equity Loans2. Acquired Credit-Impaired Loans include the acquired credit-impaired loans from South Financial, Chrysler Financial, MBNA, and acquired loans from the FDIC-assisted acquisition3. Wholesale portfolio includes corporate lending and other Wholesale gross loans and acceptances4. Other includes Wealth Management and Corporate SegmentNote: Some amounts may not total due to roundingExcludes Debt securities classified as loans
Balances (C$B unless otherwise noted)Q2/13 Q3/13
Canadian Personal & Commercial Portfolio $ 304.5 $ 310.3Personal $ 259.6 $ 264.1
Residential Mortgages 156.7 161.0Home Equity Lines of Credit (HELOC) 62.7 62.1Indirect Auto 14.0 14.5Unsecured Lines of Credit 8.4 8.3Credit Cards 14.4 14.8Other Personal 3.4 3.4
Commercial Banking (including Small Business Banking) $ 44.9 $ 46.2U.S. Personal & Commercial Portfolio (all amounts in US$) US$ 98.1 US$ 101.2
Personal US$ 50.9 US$ 52.6Residential Mortgages 19.1 19.8Home Equity Lines of Credit (HELOC)1 10.2 10.2Indirect Auto 14.8 15.6Credit Cards 6.4 6.5Other Personal 0.4 0.5
Commercial Banking US$ 47.2 US$ 48.6Non-residential Real Estate 11.2 11.4Residential Real Estate 3.1 3.2Commercial & Industrial (C&I) 32.9 34.0
FX on U.S. Personal & Commercial Portfolio $ 0.7 $ 2.7U.S. Personal & Commercial Portfolio (C$) $ 98.8 $ 103.9Acquired Credit-Impaired Loans2 $ 3.2 $ 2.8Wholesale Portfolio3 $ 24.6 $ 20.3Other4 $ 4.0 $ 3.2Total $ 435.1 $ 440.5

37
Gross Impaired Loan Formations By Portfolio
GIL Formations1: $MM and Ratios2
1. Gross Impaired Loan formations represent additions to Impaired Loans & Acceptances during the quarter; excludes the impact of acquired credit-impaired loans and debt securities classified as loans2. GIL Formations Ratio – Gross Impaired Loan Formations/Average Gross Loans & Acceptances3. Other includes Wealth Management and Corporate Segment4. Average of Canadian Peers – BMO, BNS, CIBC, RBC; peer data includes debt securities classified as loans5. Average of US Peers – BAC, C, JPM, USB, WFC (Non-Accrual Asset addition/Average Gross Loans)NA: Not available
Canadian P&C PortfolioU.S. P&C PortfolioWholesale PortfolioOther326 30 25 26 27 bps
Cdn Peers4 20 21 18 18 NA bps
U.S. Peers5 70 46 38 36 NA bps
$1,218
$1,061$1,041
$1,115$1,172
Highlights Canadian P&C formations
remained stable
Excluding Target, U.S. P&C formation ratio improved to the lowest level in over 5 years

38
Gross Impaired Loans (GIL) By Portfolio
1. Gross Impaired Loans (GIL) excludes the impact of acquired credit-impaired loans and debt securities classified as loans 2. GIL Ratio – Gross Impaired Loans/Gross Loans & Acceptances (both are spot) by portfolio3. Other includes Wealth Management and Corporate Segment4. Average of Canadian Peers – BMO, BNS, CIBC, RBC; peer data includes debt securities classified as loans5. Average of U.S. Peers – BAC, C, JPM, USB, WFC (Non-performing loans/Total gross loans)NM: Not meaningfulNA: Not available
GIL1: $MM and Ratios2
58 61 60 59 61 bps
Cdn Peers4 86 86 81 79 NA bps
U.S. Peers5 224 212 204 191 NA bps Canadian P&C PortfolioU.S. P&C PortfolioWholesale PortfolioOther3
$2,518$2,367
$2,494 $2,554$2,664
Highlights Gross Impaired Loans
increased $110MM (2 bps) over Q2/13 largely due to seasoning in the Target portfolio
Canadian P&C Gross Impaired Loans decreased $43MM (2 bps) due to resolutions in the Residential Mortgage portfolio

39
Provision for Credit Losses (PCL) By Portfolio
PCL1: $MM and Ratios2
1. PCL excludes the impact of acquired credit-impaired loans, debt securities classified as loans.2. PCL Ratio – Provision for Credit Losses on a quarterly annualized basis/Average Net Loans & Acceptances3. Other includes Wealth Management and Corporate Segment4. Wholesale PCL excludes premiums on credit default swaps (CDS): Q3/13 $4MM / Q2/13 $4MM.5. Average of Canadian Peers – BMO, BNS, CIBC, RBC; peer PCLs exclude increases in incurred but not identified allowance; peer data includes debt securities classified as loans6. Average of U.S. Peers – BAC, C, JPM, USB, WFCNM: Not meaningful; NA: Not available
1 46 48 35 39 37 bps
Cdn Peers5 34 33 31 30 NA bps
U.S. Peers6 114 99 78 53 NA bps Canadian P&C PortfolioU.S. P&C PortfolioWholesale Portfolio4 Other3
$489$454
$360$402 $407
Highlights PCL ratio decreased 2 bps
over Q2/13
Canadian P&C loss rates at the lowest levels in over 5 years
U.S. P&C PCL continued favourable trend when adjusted for Target and the normal build up in general allowances for the Indirect Auto portfolio

40
Canadian Personal Banking
1. Excludes acquired credit impaired loans2. Individually insignificant PCL excludes any change in Incurred But Not Identified Allowance3. The territories are included as follows: Yukon is included in British Columbia; Nunavut is included in Ontario; and Northwest Territories is included in the Prairies region.4. Loan To Value based on Seasonally Adjusted Average Price by Major City (Canadian Real Estate Association): Q3/13 – June 2013 Index; Q2/13 – March 2013 Index
Real Estate Secured Lending Portfolio ($B) Geographic and Insured/Uninsured Distribution3
LTV4 Q3/13 52 45 46 52 55LTV4 Q2/13 52 46 46 51 53
$7
$42
$109
$45
$20
PCL2
($MM)GIL
($MM)
30400.28%15Indirect Auto
Q3/13Canadian Personal Banking1 Gross Loans
($B)GIL/
Loans
Residential Mortgages 161 0.27% 437 5
Home Equity Lines of Credit (HELOC) 62 0.51% 317 4
Unsecured Lines of Credit 8 0.59% 49 33
Credit Cards 15 1.03% 152 117
Other Personal 3 0.56% 19 18
Total Canadian Personal Banking $264 0.38% $1,014 $207
Change vs. Q2/13 $4 (0.02%) ($36) ($1)
Highlights Continued strong credit
performance
General allowance of $65MM taken for the Alberta floods

41
Canadian Commercial and Wholesale Banking
1. Individually Insignificant and Counterparty Specific PCL and Allowance excludes any change in Incurred But Not Identified Allowance2. Includes Small Business Banking3. Resources includes: Forestry, Metals and Mining; Pipelines, Oil and Gas4. Consumer includes: Food, Beverage and Tobacco; Retail Sector5. Industrial/Manufacturing includes: Industrial Construction and Trade Contractors; Sundry Manufacturing and Wholesale6. Other includes: Power and Utilities; Telecommunications, Cable and Media; Transportation; Professional and Other Services; Other
$26
Q3/13Canadian Commercial and Wholesale Banking
Gross Loans/BAs
($B)
GIL($MM)
PCL1
($MM)
Commercial Banking2 46 158 7
Wholesale 20 47 19
Total Canadian Commercial and Wholesale $66 $205
Change vs. Q2/13 $(4) $9 $(12)
Industry BreakdownGross
Loans/BAs($B)
Gross Impaired Loans
($MM)Allowance1
($MM)Real Estate – Residential 13.6 22 12
Real Estate – Non-residential 8.4 6 2
Financial 10.5 2 1
Govt-PSE-Health & Social Services 7.8 10 4
Resources3 4.1 33 23
Consumer4 3.5 58 31
Industrial/Manufacturing5 3.5 26 13
Agriculture 3.7 6 2
Automotive 2.4 1 1
Other6 8.9 41 23
Total $66 $205 $112
Highlights Credit quality remains strong
Commercial (including Small Business Banking) loss rate for the trailing 4-quarter period was 18 bps
Wholesale loss rate for the trailing 4-quarter period was 7 bps
Wholesale GIL and PCL increased over Q2/13 as a result of a single borrower

42
U.S. Personal Banking
1. Excludes acquired credit-impaired loans2. Individually insignificant PCL excludes any change in Incurred But Not Identified Allowance3. HELOC includes Home Equity Lines of Credit and Home Equity Loans4. Loan To Value based on authorized credit limit and Loan Performance Home Price Index as of May 2013. FICO Scores updated June 2013
U.S. Real Estate Secured Lending Portfolio1
Indexed Loan to Value (LTV) Distribution and Refreshed FICO Scores4
Current Estimated LTV
Residential Mortgages
1st LienHELOC
2nd LienHELOC Total
>80% 8% 18% 41% 16%
61-80% 51% 30% 35% 45%
<=60% 40% 52% 24% 39%
Current FICO Score >700 88% 87% 82% 86%
Q3/13
U.S. Personal Banking1 Gross Loans($B)
GIL/Loans
GIL($MM) PCL2
($MM)Residential Mortgages 20 1.22% 247 (2)
Home Equity Lines of Credit (HELOC)3 10 2.07% 216 6
Indirect Auto 16 0.37% 59 35
Credit Cards 7 1.82% 122 10
Other Personal 0.5 0.41% 2 11
Total U.S. Personal Banking $54 1.20% $646 $60
Change vs. Q2/13 $3 0.12% $95 ($27)
Highlights Loan to Values have improved
due to housing price appreciation over last year
The proportion of the portfolio with an LTV over 80% has decreased to 16% from 23% since Q3/12
Gross Impaired Loans increased $95MM over Q2/13 due primarily to seasoning of the Target portfolio

43
U.S. Commercial Banking
1. Excludes acquired credit-impaired loans and debt securities classified as loans2. Individually Insignificant and Counterparty Specific PCL excludes any change in Incurred But Not Identified Allowance3. Consumer includes: Food, beverage and tobacco; Retail sector4. Industrial/Manufacturing includes: Industrial construction and trade contractors; Sundry manufacturing and wholesale5. Other includes: Agriculture; Power and utilities; Telecommunications, cable and media; Transportation; Resources; Other
$33
($6)
2343435Commercial & Industrial (C&I)
Q3/13
U.S. Commercial Banking1Gross
Loans/BAs ($B)
GIL($MM)
PCL2
($MM)
Commercial Real Estate (CRE) 15 362 10
Non-residential Real Estate 12 239 16
Residential Real Estate 3 123 (6)
Total U.S. Commercial Banking $50 $796
Change vs. Q2/13 $2 $42
Total CRE $15 $362
Commercial Real Estate Gross
Loans/BAs($B)
GIL($MM)
Office 4.2 71
Retail 3.3 69
Apartments 2.3 34
Residential for Sale 0.3 70
Industrial 1.3 36
Hotel 0.8 21
Commercial Land 0.1 26
Other 2.7 35
Total C&I $35 $434
Commercial & Industrial Gross
Loans/BAs($B)
GIL($MM)
Health & Social Services 5.5 15
Professional &Other Services 5.1 73
Consumer3 3.9 134
Industrial/Mfg4 4.5 88
Government/PSE 3.9 18
Financial 1.5 6
Automotive 1.6 14
Other5 8.9 86
Highlights Positive momentum continues
in U.S. Commercial portfolio Lowest charge-off rate in over
3 years
Number of loans moving into “Work Out” continues to decline
Classified loan levels continue to reduce

44
Investor Relations Contacts
Phone:416-308-9030
or 1-866-486-4826
Email:[email protected]
Website:www.td.com/investor
Grand Prix for Best Overall Investor Relations: Large Cap
Best Investor Relations by Sector: Financial Services
Best Investor Relations by a CEO: Large Cap
Best Investor Relations by a CFO: Large Cap
Best Investment Community Meetings
Best Financial Reporting
Best Corporate Governance
Best Use of Technology
TD Bank GroupInvestor Presentation – Fixed Income
Q3 2013


