26
TD U.S. Index Fund (08/19) 532202 for the period ended June 30, 2019 TD Mutual Funds Semi-Annual Financial Report

TD U.S. Index Fund
(08/19)532202
for the period ended June 30, 2019
TD Mutual Funds
Semi-Annual Financial Report

June 30, 2019 Semi-Annual Financial Report
nManagement’s Responsibility for Financial Reporting
The accompanying unaudited interim financial report has been prepared by TD Asset Management Inc. (“TDAM”), as manager of the TD Mutual Fund Trusts, TD Managed Assets Program Portfolios and TD Managed ETF Portfolios (collectively the “Funds” and individually the “Fund”) and approved by TDAM’s board of directors. The manager is responsible for the integrity, objectivity and reliability of the data presented. This responsibility includes selecting appropriate accounting principles and making judgments and estimates consistent with International Financial Reporting Standards as issued by the International Accounting Standards Board (“IFRS”), including International Accounting Standard (“IAS”) 34, “Interim Financial Reporting”. The manager is also responsible for the development of internal controls over the financial reporting process, which are designed to provide reasonable assurance that relevant and reliable financial informa tion is produced, and the safeguarding of all assets of the Funds.
The board of directors of TDAM, is responsible for reviewing and approv-ing the financial statements and overseeing management’s performance of its financial reporting responsibilities.
On behalf of TDAM, manager of the Funds.
Bruce Cooper Salma Salman Director and Director and Chief Executive Officer Chief Financial Officer August 14, 2019 August 14, 2019
nNotice to Unitholders
The Auditor of the Funds has not reviewed the TD Mutual Fund Trusts in this Financial Report
TDAM, as manager of the Funds, appoints an independent auditor to audit the Funds’ annual financial statements. Applicable securities laws require that if an auditor has not reviewed the Funds’ interim financial report, this must be disclosed in an accompanying notice.
1

June 30, 2019 Semi-Annual Financial Report
nTD U.S. Index Fund (expressed in United States dollars)
Statements of Financial Position (in 000s except per unit amounts)
as at June 30, 2019 and December 31, 2018 (Unaudited)
June 30, December 31, 2019 2018
Assets Current Assets Investments $ 1,350,294 $ 1,129,362 Derivative Assets (Note 3) 2 0 Cash 1,947 685 Interest and Dividends Receivables 1,007 1,139 Subscriptions Receivable 6,378 2,742 Receivable for Investments Sold 0 1,582 Other Receivables 1 1
1,359,629 1,135,511
Liabilities Current Liabilities Redemptions Payable 1,205 2,707 Distributions Payable 2 2 Payable for Investments Purchased 437 765
1,644 3,474
Net Assets Attributable to Holders of Redeemable Units $ 1,357,985 $ 1,132,037
Net Assets Attributable to Holders of Redeemable Units – Per Series (Note 5) Investor Series $ 279,986 $ 324,373 e-Series $ 812,535 $ 589,229 Institutional Series $ 73 $ 62 F-Series $ 34,799 $ 25,220 O-Series $ 230,592 $ 193,153
$ 1,357,985 $ 1,132,037
Net Assets Attributable to Holders of Redeemable Units – Per Series Unit
Investor Series $ 23.25 $ 19.70
e-Series $ 51.47 $ 43.56
Institutional Series $ 14.35 $ 12.15
Institutional Series $ 18.79§ $ 16.59§
F-Series $ 13.56 $ 11.49
F-Series $ 17.76§ $ 15.69§
O-Series $ 22.20 $ 18.76
O-Series $ 29.07§ $ 25.61§
§ Units valued in Canadian dollars
Statements of Comprehensive Income (in 000s except per unit amounts)
for the periods ended June 30, 2019 and 2018 (Unaudited)
2019 2018
Income Net Gain (Loss) on Investments and Derivatives
Dividend Income $ 16,817 $ 11,951 Interest for Distribution Purposes 62 19 Net Realized Gain (Loss) 3,904 13,742 Net Change in Unrealized Appreciation/
Depreciation 189,661 4,816
Net Gain (Loss) on Investments and Derivatives 210,444 30,528 Foreign Exchange Gain (Loss) on Cash (20) (52) Securities Lending Income 52 39
Total Income (Net) 210,476 30,515
Expenses (Note 6) Management Fees 2,329 2,203 Independent Review Committee Fees 1 1 Transaction Costs 6 12
Total Expenses before Waivers 2,336 2,216 Less: Waived Expenses (145) (135)
Total Expenses (Net) 2,191 2,081
Increase (Decrease) in Net Assets Attributable to Holders of Redeemable Units before Tax 208,285 28,434
Tax Reclaims (Withholding Taxes) (1,626) (1,922)
Increase (Decrease) in Net Assets Attributable to Holders of Redeemable Units $ 206,659 $ 26,512
Increase (Decrease) in Net Assets Attributable to Holders of Redeemable Units – Per Series Investor Series $ 56,454 $ 7,434 e-Series $ 109,880 $ 13,442 Institutional Series $ 11 $ 84 F-Series $ 4,776 $ 372 O-Series $ 35,538 $ 5,180
$ 206,659 $ 26,512
Weighted Average Units Outstanding for the Period – Per Series
Investor Series 16,187 16,523
e-Series 13,812 12,816
Institutional Series 5 177
F-Series 2,370 1,351
O-Series 10,304 10,605
Increase (Decrease) in Net Assets Attributable to Holders of Redeemable Units – Per Series Unit
Investor Series $ 3.49 $ 0.45
e-Series $ 7.96 $ 1.05
Institutional Series $ 2.20 $ 0.47
Institutional Series $ 2.94* $ 0.61*
F-Series $ 2.02 $ 0.28
F-Series $ 2.69* $ 0.35*
O-Series $ 3.45 $ 0.49
O-Series $ 4.60* $ 0.62*
* Earnings per unit stated in Canadian dollars
The accompanying notes are an integral part of the interim financial report.
2

June 30, 2019 Semi-Annual Financial Report
Statements of Changes in Net Assets Attributable to Holders of Redeemable Units (in 000s) for the periods ended June 30, 2019 and 2018 (Unaudited)
Investor Series e-Series Institutional Series
2019 2018 2019 2018 2019 2018
Net Assets Attributable to Holders of Redeemable Units at Beginning of the Period $ 324,373 $ 344,622 $ 589,229 $ 577,989 $ 62 $ 8,580
Increase (Decrease) in Net Assets Attributable to Holders of Redeemable Units 56,454 7,434 109,880 13,442 11 84
Distributions to Holders of Redeemable Units 0 0 0 0 0 0
Redeemable Unit Transactions Proceeds from Redeemable Units Issued 38,756 38,831 170,614 83,941 0 283 Reinvestments of Distributions 0 0 0 0 0 0 Redemption of Redeemable Units (139,597) (37,580) (57,188) (55,803) 0 (8,881)
Net Increase (Decrease) from Redeemable Unit Transactions (100,841) 1,251 113,426 28,138 0 (8,598)
Net Increase (Decrease) in Net Assets Attributable to Holders of Redeemable Units (44,387) 8,685 223,306 41,580 11 (8,514)
Net Assets Attributable to Holders of Redeemable Units at End of the Period $ 279,986 $ 353,307 $ 812,535 $ 619,569 $ 73 $ 66
Redeemable Unit Transactions Redeemable Units Outstanding,
Beginning of the Period 16,469 16,386 13,527 12,431 5 661 Redeemable Units Issued 1,750 1,806 3,431 1,771 0 21 Redeemable Units Issued on Reinvestments 0 0 0 0 0 0 Redeemable Units Redeemed (6,176) (1,754) (1,171) (1,175) 0 (677)
Redeemable Units Outstanding, End of the Period 12,043 16,438 15,787 13,027 5 5
F-Series O-Series TOTAL
2019 2018 2019 2018 2019 2018
Net Assets Attributable to Holders of Redeemable Units at Beginning of the Period $ 25,220 $ 11,882 $ 193,153 $ 216,376 $ 1,132,037 $ 1,159,449
Increase (Decrease) in Net Assets Attributable to Holders of Redeemable Units 4,776 372 35,538 5,180 206,659 26,512
Distributions to Holders of Redeemable Units 0 0 0 0 0 0
Redeemable Unit Transactions Proceeds from Redeemable Units Issued 8,947 10,048 22,868 29,632 241,185 162,735 Reinvestments of Distributions 0 0 0 0 0 0 Redemption of Redeemable Units (4,144) (1,097) (20,967) (38,004) (221,896) (141,365)
Net Increase (Decrease) from Redeemable Unit Transactions 4,803 8,951 1,901 (8,372) 19,289 21,370
Net Increase (Decrease) in Net Assets Attributable to Holders of Redeemable Units 9,579 9,323 37,439 (3,192) 225,948 47,882
Net Assets Attributable to Holders of Redeemable Units at End of the Period $ 34,799 $ 21,205 $ 230,592 $ 213,184 $ 1,357,985 $ 1,207,331
Redeemable Unit Transactions Redeemable Units Outstanding,
Beginning of the Period 2,195 971 10,297 10,795 Redeemable Units Issued 692 812 1,086 1,441 Redeemable Units Issued on Reinvestments 0 0 0 0 Redeemable Units Redeemed (321) (87) (997) (1,857)
Redeemable Units Outstanding, End of the Period 2,566 1,696 10,386 10,379
nTD U.S. Index Fund (expressed in United States dollars)
The accompanying notes are an integral part of the interim financial report.
3

June 30, 2019 Semi-Annual Financial Report
nTD U.S. Index Fund (expressed in United States dollars)
Statements of Cash Flows (in 000s) for the periods ended June 30, 2019 and 2018 (Unaudited)
2019 2018
Cash Flows from (used in) Operating Activities Increase (Decrease) in Net Assets Attributable
to Holders of Redeemable Units $ 206,659 $ 26,512 Adjustment For:
Unrealized Foreign Exchange (Gain) Loss on Cash 11 25
Net Realized (Gain) Loss (3,904) (13,742) Net Change in Unrealized Appreciation/
Depreciation (189,661) (4,816) Purchase of Investments and Derivatives (63,172) (94,625) Proceeds from Sale, Paydown and Maturity
of Investments and Derivatives 37,057 60,310 (Increase) Decrease in Interest and
Dividends Receivables 132 145
Net Cash from (used in) Operating Activities (12,878) (26,191)
Cash Flows from (used in) Financing Activities Proceeds from Issuance of Redeemable Units 128,170 160,597 Amounts Paid on Redemption of Redeemable Units (114,019) (135,615)
Net Cash from (used in) Financing Activities 14,151 24,982
Unrealized Foreign Exchange Gain (Loss) on Cash (11) (25) Net Increase (Decrease) in Cash 1,273 (1,209) Cash (Bank Overdraft) at Beginning of the Period 685 2,874
Cash (Bank Overdraft) at End of the Period $ 1,947 $ 1,640
Interest for Distribution Purposes Received*, Net of Withholding Taxes $ 62 $ 19
Dividends Received*, Net of Withholding Taxes $ 15,324 $ 10,175
* Included as part of Cash Flows from (used in) Operating Activities.
The accompanying notes are an integral part of the interim financial report.
4

June 30, 2019 Semi-Annual Financial Report
U.S. Equities – 96.7%
ENERGY – 5.0%
27,641 Anadarko Petroleum Corporation $ 1,601 $ 1,950
20,707 Apache Corporation 1,431 600
28,345 Baker Hughes, a GE Company 1,382 698
23,400 Cabot Oil & Gas Corporation 470 537
105,067 Chevron Corporation 9,282 13,075
5,500 Cimarex Energy Company 693 326
11,068 Concho Resources Inc. 1,269 1,142
62,342 ConocoPhillips 3,229 3,803
22,919 Devon Energy Corporation 1,162 654
8,530 Diamondback Energy Inc. 939 929
32,006 EOG Resources Inc. 1,985 2,982
233,358 Exxon Mobil Corporation 17,367 17,882
48,117 Halliburton Company 1,701 1,094
6,000 Helmerich & Payne Inc. 319 304
13,978 Hess Corporation 766 889
8,600 HollyFrontier Corporation 622 398
107,465 Kinder Morgan Inc. 3,577 2,244
45,090 Marathon Oil Corporation 970 641
36,463 Marathon Petroleum Corporation 1,563 2,038
21,250 National Oilwell Varco Inc. 951 472
26,300 Noble Energy Inc. 1,004 589
41,236 Occidental Petroleum Corporation 2,526 2,073
22,700 ONEOK Inc. 996 1,562
23,021 Phillips 66 1,003 2,153
9,280 Pioneer Natural Resources Company 1,087 1,428
76,332 Schlumberger Ltd. 5,159 3,033
22,952 Valero Energy Corporation 1,012 1,965
66,905 The Williams Companies Inc. 2,020 1,876
66,086 67,337
MATERIALS – 2.3%
12,147 Air Products and Chemicals Inc. 1,278 2,750
5,800 Albemarle Corporation 482 408
4,665 Avery Dennison Corporation 293 540
18,396 Ball Corporation 398 1,287
6,980 Celanese Corporation, Series A 607 752
12,100 CF Industries Holdings Inc. 347 565
41,390 Corteva Inc. 1,099 1,224
41,390 Dow Inc. 2,279 2,041
41,390 DowDuPont Inc. 5,234 3,107
7,502 Eastman Chemical Company 363 584
13,982 Ecolab Inc. 1,030 2,761
7,260 FMC Corporation 311 602
80,000 Freeport-McMoRan Inc. 1,820 929
5,595 International Flavors & Fragrances Inc. 478 812
21,856 International Paper Company 848 947
16,900 LyondellBasell Industries NV, Class A 1,023 1,456
3,440 Martin Marietta Materials Inc. 508 792
19,500 The Mosaic Company 908 488
45,213 Newmont Goldcorp Corp. 1,656 1,739
16,982 Nucor Corporation 852 936
5,200 Packaging Corporation of America 565 496
13,018 PPG Industries Inc. 678 1,519
8,534 Sealed Air Corporation 248 365
4,500 The Sherwin-Williams Company 684 2,062
7,289 Vulcan Materials Company 572 1,001
14,191 WestRock Company 674 517
25,235 30,680
INDUSTRIALS – 9.1%
31,790 3M Company 3,375 5,510
6,700 Alaska Air Group Inc. 448 428
21,800 American Airlines Group Inc. 1,208 711
12,500 AMETEK Inc. 624 1,135
7,800 AO Smith Corporation 430 368
21,993 Arconic Inc. 1,036 568
28,868 The Boeing Company 3,137 10,508
31,542 Caterpillar Inc. 2,433 4,299
7,500 CH Robinson Worldwide Inc. 444 633
4,720 Cintas Corporation 276 1,120
11,200 Copart Inc. 629 837
42,365 CSX Corporation 802 3,278
7,958 Cummins Inc. 552 1,363
17,474 Deere & Company 1,268 2,896
32,800 Delta Air Lines Inc. 863 1,861
8,090 Dover Corporation 319 811
23,374 Eaton Corporation PLC 1,193 1,947
33,891 Emerson Electric Company 1,602 2,261
6,669 Equifax Inc. 427 902
9,400 Expeditors International of Washington Inc. 464 713
31,600 Fastenal Company 583 1,030
13,213 FedEx Corporation 1,589 2,169
7,200 Flowserve Corporation 265 379
16,324 Fortive Corporation 544 1,331
7,800 Fortune Brands Home & Security Inc. 450 446
14,996 General Dynamics Corporation 1,368 2,727
480,961 General Electric Company 13,045 5,050
6,520 Harris Corporation 448 1,233
40,132 Honeywell International Inc. 2,738 7,007
2,270 Huntington Ingalls Industries Inc. 521 510
16,513 Illinois Tool Works Inc. 1,002 2,490
13,270 Ingersoll-Rand PLC 670 1,681
6,400 Jacobs Engineering Group Inc. 435 540
4,740 JB Hunt Transport Services Inc. 406 433
43,912 Johnson Controls International PLC 1,933 1,814
5,500 Kansas City Southern 610 670
4,382 L3 Technologies Inc. 467 1,074
13,558 Lockheed Martin Corporation 1,856 4,929
16,145 Masco Corporation 368 634
19,700 Nielsen Holdings PLC 763 445
14,722 Norfolk Southern Corporation 966 2,935
9,361 Northrop Grumman Corporation 925 3,025
19,085 PACCAR Inc. 898 1,368
7,066 Parker-Hannifin Corporation 559 1,201
8,000 Quanta Services Inc. 205 305
15,382 Raytheon Company 1,152 2,675
11,783 Republic Services Inc. 350 1,021
6,510 Robert Half International Inc. 246 371
6,585 Rockwell Automation Inc. 529 1,079
8,050 Rollins Inc. 325 289
5,720 Roper Technologies Inc. 710 2,095
3,033 Snap-on Inc. 239 502
27,213 Southwest Airlines Co. 539 1,382
8,360 Stanley Black & Decker Inc. 652 1,209
12,962 Textron Inc. 478 687
2,700 TransDigm Group Incorporated 747 1,306
39,044 Union Pacific Corporation 1,909 6,603
12,256 United Continental Holdings Inc. 724 1,073
38,475 United Parcel Service Inc., Class B 3,220 3,973
4,330 United Rentals Inc. 512 574
44,744 United Technologies Corporation 3,697 5,826
8,960 Verisk Analytics Inc. 772 1,312
2,437 W.W. Grainger Inc. 324 654
21,554 Waste Management Inc. 923 2,487
nTD U.S. Index Fund (expressed in United States dollars)
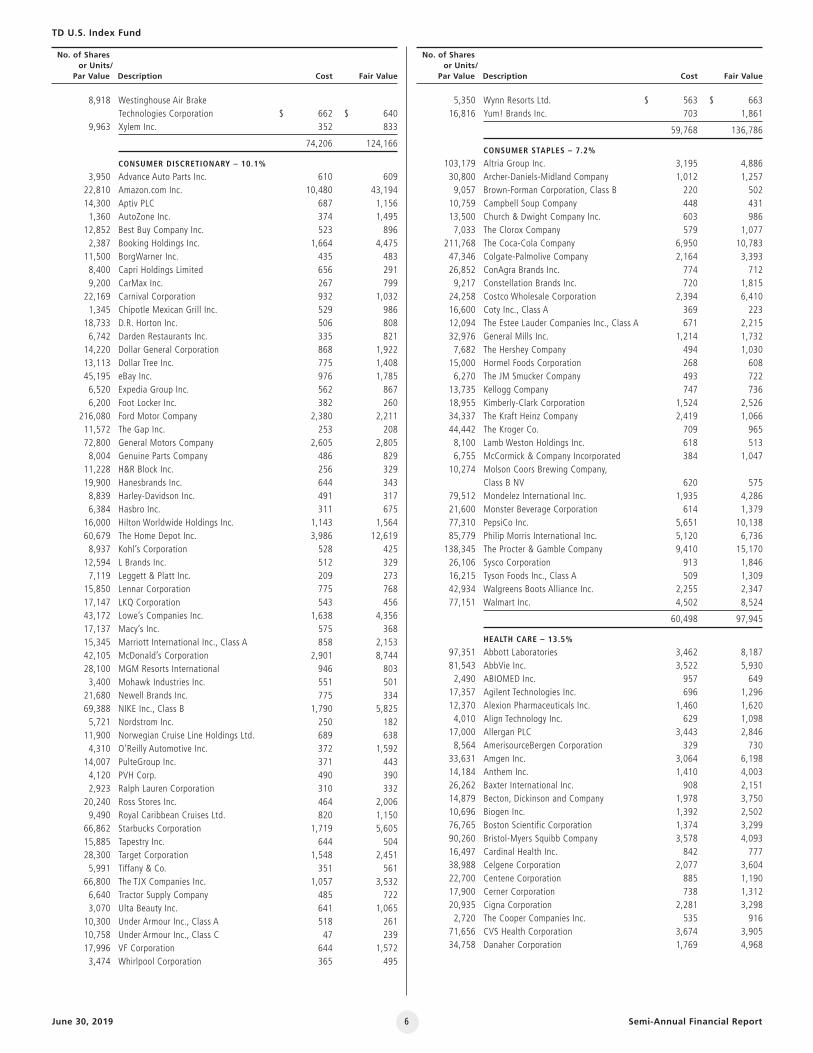
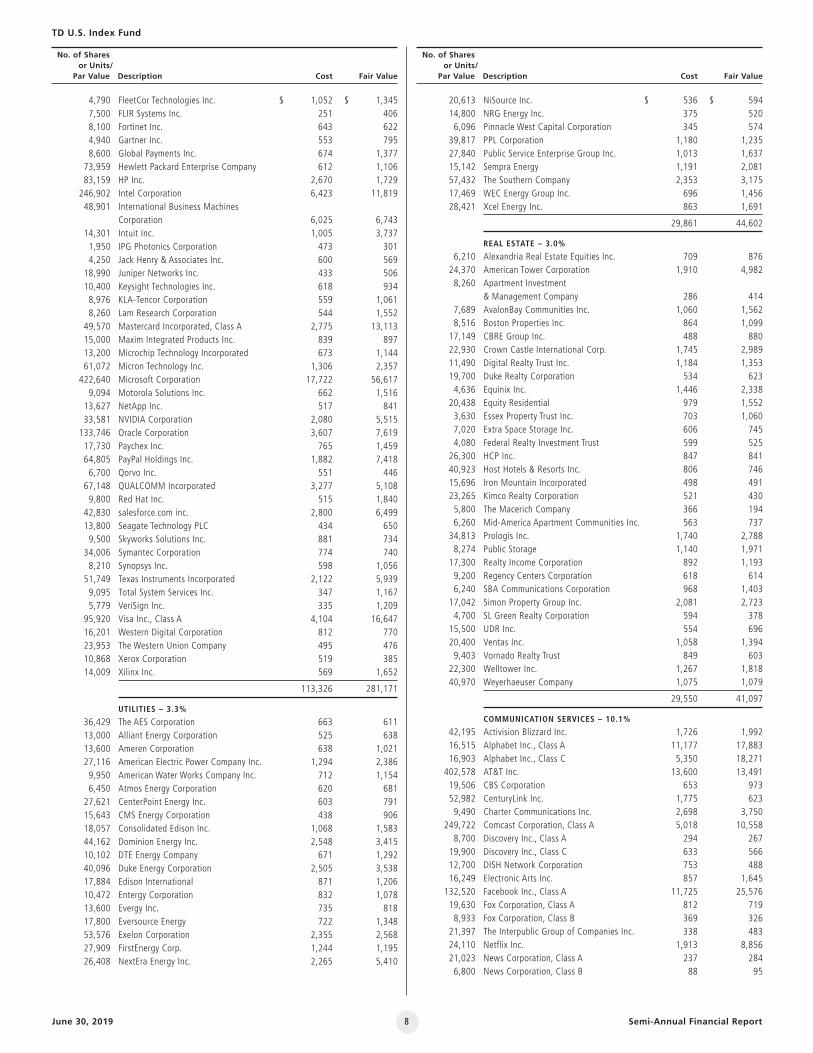
Schedule of Investment Portfolio (in 000s except number of Shares
or Units/Par Value) as at June 30, 2019 (Unaudited)
No. of Shares or Units/ Par Value Description Cost Fair Value
No. of Shares or Units/ Par Value Description Cost Fair Value
$ $
5
8,918 Westinghouse Air Brake Technologies Corporation 662 640
9,963 Xylem Inc. 352 833
74,206 124,166
CONSUMER DISCRETIONARY – 10.1%
3,950 Advance Auto Parts Inc. 610 609
22,810 Amazon.com Inc. 10,480 43,194
14,300 Aptiv PLC 687 1,156
1,360 AutoZone Inc. 374 1,495
12,852 Best Buy Company Inc. 523 896
2,387 Booking Holdings Inc. 1,664 4,475
11,500 BorgWarner Inc. 435 483
8,400 Capri Holdings Limited 656 291
9,200 CarMax Inc. 267 799
22,169 Carnival Corporation 932 1,032
1,345 Chipotle Mexican Grill Inc. 529 986
18,733 D.R. Horton Inc. 506 808
6,742 Darden Restaurants Inc. 335 821
14,220 Dollar General Corporation 868 1,922
13,113 Dollar Tree Inc. 775 1,408
45,195 eBay Inc. 976 1,785
6,520 Expedia Group Inc. 562 867
6,200 Foot Locker Inc. 382 260
216,080 Ford Motor Company 2,380 2,211
11,572 The Gap Inc. 253 208
72,800 General Motors Company 2,605 2,805
8,004 Genuine Parts Company 486 829
11,228 H&R Block Inc. 256 329
19,900 Hanesbrands Inc. 644 343
8,839 Harley-Davidson Inc. 491 317
6,384 Hasbro Inc. 311 675
16,000 Hilton Worldwide Holdings Inc. 1,143 1,564
60,679 The Home Depot Inc. 3,986 12,619
8,937 Kohl’s Corporation 528 425
12,594 L Brands Inc. 512 329
7,119 Leggett & Platt Inc. 209 273
15,850 Lennar Corporation 775 768
17,147 LKQ Corporation 543 456
43,172 Lowe’s Companies Inc. 1,638 4,356
17,137 Macy’s Inc. 575 368
15,345 Marriott International Inc., Class A 858 2,153
42,105 McDonald’s Corporation 2,901 8,744
28,100 MGM Resorts International 946 803
3,400 Mohawk Industries Inc. 551 501
21,680 Newell Brands Inc. 775 334
69,388 NIKE Inc., Class B 1,790 5,825
5,721 Nordstrom Inc. 250 182
11,900 Norwegian Cruise Line Holdings Ltd. 689 638
4,310 O’Reilly Automotive Inc. 372 1,592
14,007 PulteGroup Inc. 371 443
4,120 PVH Corp. 490 390
2,923 Ralph Lauren Corporation 310 332
20,240 Ross Stores Inc. 464 2,006
9,490 Royal Caribbean Cruises Ltd. 820 1,150
66,862 Starbucks Corporation 1,719 5,605
15,885 Tapestry Inc. 644 504
28,300 Target Corporation 1,548 2,451
5,991 Tiffany & Co. 351 561
66,800 The TJX Companies Inc. 1,057 3,532
6,640 Tractor Supply Company 485 722
3,070 Ulta Beauty Inc. 641 1,065
10,300 Under Armour Inc., Class A 518 261
10,758 Under Armour Inc., Class C 47 239
17,996 VF Corporation 644 1,572
3,474 Whirlpool Corporation 365 495
$ $
5,350 Wynn Resorts Ltd. 563 663
16,816 Yum! Brands Inc. 703 1,861
59,768 136,786
CONSUMER STAPLES – 7.2%
103,179 Altria Group Inc. 3,195 4,886
30,800 Archer-Daniels-Midland Company 1,012 1,257
9,057 Brown-Forman Corporation, Class B 220 502
10,759 Campbell Soup Company 448 431
13,500 Church & Dwight Company Inc. 603 986
7,033 The Clorox Company 579 1,077
211,768 The Coca-Cola Company 6,950 10,783
47,346 Colgate-Palmolive Company 2,164 3,393
26,852 ConAgra Brands Inc. 774 712
9,217 Constellation Brands Inc. 720 1,815
24,258 Costco Wholesale Corporation 2,394 6,410
16,600 Coty Inc., Class A 369 223
12,094 The Estee Lauder Companies Inc., Class A 671 2,215
32,976 General Mills Inc. 1,214 1,732
7,682 The Hershey Company 494 1,030
15,000 Hormel Foods Corporation 268 608
6,270 The JM Smucker Company 493 722
13,735 Kellogg Company 747 736
18,955 Kimberly-Clark Corporation 1,524 2,526
34,337 The Kraft Heinz Company 2,419 1,066
44,442 The Kroger Co. 709 965
8,100 Lamb Weston Holdings Inc. 618 513
6,755 McCormick & Company Incorporated 384 1,047
10,274 Molson Coors Brewing Company, Class B NV 620 575
79,512 Mondelez International Inc. 1,935 4,286
21,600 Monster Beverage Corporation 614 1,379
77,310 PepsiCo Inc. 5,651 10,138
85,779 Philip Morris International Inc. 5,120 6,736
138,345 The Procter & Gamble Company 9,410 15,170
26,106 Sysco Corporation 913 1,846
16,215 Tyson Foods Inc., Class A 509 1,309
42,934 Walgreens Boots Alliance Inc. 2,255 2,347
77,151 Walmart Inc. 4,502 8,524
60,498 97,945
HEALTH CARE – 13.5%
97,351 Abbott Laboratories 3,462 8,187
81,543 AbbVie Inc. 3,522 5,930
2,490 ABIOMED Inc. 957 649
17,357 Agilent Technologies Inc. 696 1,296
12,370 Alexion Pharmaceuticals Inc. 1,460 1,620
4,010 Align Technology Inc. 629 1,098
17,000 Allergan PLC 3,443 2,846
8,564 AmerisourceBergen Corporation 329 730
33,631 Amgen Inc. 3,064 6,198
14,184 Anthem Inc. 1,410 4,003
26,262 Baxter International Inc. 908 2,151
14,879 Becton, Dickinson and Company 1,978 3,750
10,696 Biogen Inc. 1,392 2,502
76,765 Boston Scientific Corporation 1,374 3,299
90,260 Bristol-Myers Squibb Company 3,578 4,093
16,497 Cardinal Health Inc. 842 777
38,988 Celgene Corporation 2,077 3,604
22,700 Centene Corporation 885 1,190
17,900 Cerner Corporation 738 1,312
20,935 Cigna Corporation 2,281 3,298
2,720 The Cooper Companies Inc. 535 916
71,656 CVS Health Corporation 3,674 3,905
34,758 Danaher Corporation 1,769 4,968
$ $
June 30, 2019 Semi-Annual Financial Report
No. of Shares or Units/ Par Value Description Cost Fair Value
No. of Shares or Units/ Par Value Description Cost Fair Value
TD U.S. Index Fund
6

6,900 DaVita Inc. 284 388
13,000 DENTSPLY SIRONA Inc. 624 759
11,490 Edwards Lifesciences Corporation 717 2,123
47,648 Eli Lilly & Company 2,839 5,279
70,092 Gilead Sciences Inc. 2,732 4,735
14,730 HCA Healthcare Inc. 1,117 1,991
8,200 Henry Schein Inc. 584 573
14,700 Hologic Inc. 531 706
7,442 Humana Inc. 691 1,974
4,740 IDEXX Laboratories Inc. 603 1,305
8,100 Illumina Inc. 1,524 2,982
9,900 Incyte Corporation 1,259 841
6,368 Intuitive Surgical Inc. 1,180 3,340
8,700 IQVIA Holdings Inc. 841 1,400
146,430 Johnson & Johnson 11,732 20,395
5,445 Laboratory Corporation of America Holdings 517 941
10,463 McKesson Corporation 910 1,406
141,908 Merck & Company Inc. 6,532 11,899
1,366 Mettler-Toledo International Inc. 586 1,147
28,275 Mylan NV 915 538
9,700 Nektar Therapeutics 921 345
6,041 PerkinElmer Inc. 226 582
306,139 Pfizer Inc. 8,240 13,262
7,386 Quest Diagnostics Incorporated 447 752
4,330 Regeneron Pharmaceuticals Inc. 1,272 1,355
7,900 ResMed Inc. 637 964
17,081 Stryker Corporation 1,354 3,512
2,540 Teleflex Incorporated 650 841
22,068 Thermo Fisher Scientific Inc. 2,088 6,481
52,417 UnitedHealth Group Incorporated 4,329 12,790
4,600 Universal Health Services Inc. 529 600
5,000 Varian Medical Systems Inc. 279 681
14,130 Vertex Pharmaceuticals Incorporated 1,383 2,591
3,875 Waters Corporation 306 834
2,780 WellCare Health Plans Inc. 832 793
11,304 Zimmer Biomet Holdings Inc. 1,002 1,331
26,405 Zoetis Inc. 1,026 2,997
103,242 183,755
FINANCIALS – 12.4%
2,800 Affiliated Managers Group Inc. 555 258
41,000 Aflac Inc. 998 2,247
18,528 The Allstate Corporation 1,019 1,884
37,841 American Express Company 2,138 4,671
47,861 American International Group Inc. 4,824 2,550
7,380 Ameriprise Financial Inc. 408 1,071
10,200 Arthur J Gallagher & Co. 532 893
3,390 Assurant Inc. 217 361
487,714 Bank of America Corporation 11,006 14,144
48,581 The Bank of New York Mellon Corporation 1,837 2,145
42,329 BB&T Corporation 1,555 2,080
106,877 Berkshire Hathaway Inc., Class B 12,187 22,783
6,560 BlackRock Inc., Class A 1,741 3,079
25,986 Capital One Financial Corporation 1,600 2,358
6,200 Cboe Global Markets Inc. 541 643
65,540 The Charles Schwab Corporation 1,663 2,634
8,293 Cincinnati Financial Corporation 413 860
127,476 Citigroup Inc. 10,401 8,927
25,200 Citizens Financial Group Inc. 559 891
19,740 CME Group Inc., Class A 2,038 3,832
8,537 Comerica Incorporated 435 620
17,983 Discover Financial Services 513 1,395
13,735 E*TRADE Financial Corporation 439 613
40,121 Fifth Third Bancorp 961 1,119
9,100 First Republic Bank 793 889
$ $ 16,100 Franklin Resources Inc. 571 560
18,774 The Goldman Sachs Group Inc. 3,088 3,841
19,939 The Hartford Financial Services Group Inc. 1,023 1,111
57,702 Huntington Bancshares Inc. 579 797
31,100 Intercontinental Exchange Inc. 1,267 2,673
22,200 Invesco Ltd. 586 454
14,000 Jefferies Financial Group Inc. 434 269
178,921 JPMorgan Chase & Co. 9,336 20,003
55,572 KeyCorp 826 986
11,302 Lincoln National Corporation 534 728
15,047 Loews Corporation 589 823
7,576 M&T Bank Corporation 826 1,288
28,145 Marsh & McLennan Companies Inc. 1,234 2,807
52,490 MetLife Inc. 2,171 2,607
9,071 Moody’s Corporation 632 1,772
70,767 Morgan Stanley 2,773 3,100
4,680 MSCI Inc. 693 1,118
6,300 Nasdaq Inc. 270 606
12,065 Northern Trust Corporation 805 1,086
21,700 People’s United Financial Inc. 370 364
24,974 The PNC Financial Services Group Inc. 2,430 3,428
14,218 Principal Financial Group Inc. 655 824
32,266 The Progressive Corporation 924 2,579
22,362 Prudential Financial Inc. 1,610 2,259
7,000 Raymond James Financial Inc. 551 592
55,836 Regions Financial Corporation 823 834
13,568 S&P Global Inc. 1,017 3,091
20,665 State Street Corporation 1,335 1,159
24,459 SunTrust Banks Inc. 1,166 1,537
2,880 SVB Financial Group 760 647
35,000 Synchrony Financial 1,075 1,213
12,986 T. Rowe Price Group Inc. 761 1,425
5,577 Torchmark Corporation 161 499
14,370 The Travelers Companies Inc. 875 2,149
82,543 U.S. Bancorp 2,785 4,325
11,772 Unum Group 287 395
223,162 Wells Fargo & Company 8,184 10,560
10,162 Zions Bancorporation NA 412 467
113,791 167,923
INFORMATION TECHNOLOGY – 20.7%
26,915 Adobe Inc. 1,884 7,930
48,900 Advanced Micro Devices Inc. 723 1,485
9,100 Akamai Technologies Inc. 448 729
2,480 Alliance Data Systems Corporation 631 347
16,400 Amphenol Corporation 623 1,573
20,401 Analog Devices Inc. 1,095 2,303
4,600 ANSYS Inc. 581 942
241,075 Apple Inc. 12,873 47,714
51,730 Applied Materials Inc. 1,067 2,323
2,920 Arista Networks Inc. 875 758
12,118 Autodesk Inc. 741 1,974
24,001 Automatic Data Processing Inc. 1,447 3,968
21,839 Broadcom Inc. 2,942 6,287
6,400 Broadridge Financial Solutions Inc. 729 817
15,600 Cadence Design Systems Inc. 616 1,105
236,103 Cisco Systems Inc. 6,201 12,922
6,987 Citrix Systems Inc. 312 686
31,356 Cognizant Technology Solutions Corporation 1,098 1,988
43,392 Corning Incorporated 882 1,442
14,808 DXC Technology Company 780 817
3,300 F5 Networks Inc. 414 481
17,868 Fidelity National Information Services Inc. 871 2,192
21,632 Fiserv Inc. 397 1,972
$ $
June 30, 2019 Semi-Annual Financial Report
No. of Shares or Units/ Par Value Description Cost Fair Value
No. of Shares or Units/ Par Value Description Cost Fair Value
TD U.S. Index Fund
7
4,790 FleetCor Technologies Inc. 1,052 1,345
7,500 FLIR Systems Inc. 251 406
8,100 Fortinet Inc. 643 622
4,940 Gartner Inc. 553 795
8,600 Global Payments Inc. 674 1,377
73,959 Hewlett Packard Enterprise Company 612 1,106
83,159 HP Inc. 2,670 1,729
246,902 Intel Corporation 6,423 11,819
48,901 International Business Machines Corporation 6,025 6,743
14,301 Intuit Inc. 1,005 3,737
1,950 IPG Photonics Corporation 473 301
4,250 Jack Henry & Associates Inc. 600 569
18,990 Juniper Networks Inc. 433 506
10,400 Keysight Technologies Inc. 618 934
8,976 KLA-Tencor Corporation 559 1,061
8,260 Lam Research Corporation 544 1,552
49,570 Mastercard Incorporated, Class A 2,775 13,113
15,000 Maxim Integrated Products Inc. 839 897
13,200 Microchip Technology Incorporated 673 1,144
61,072 Micron Technology Inc. 1,306 2,357
422,640 Microsoft Corporation 17,722 56,617
9,094 Motorola Solutions Inc. 662 1,516
13,627 NetApp Inc. 517 841
33,581 NVIDIA Corporation 2,080 5,515
133,746 Oracle Corporation 3,607 7,619
17,730 Paychex Inc. 765 1,459
64,805 PayPal Holdings Inc. 1,882 7,418
6,700 Qorvo Inc. 551 446
67,148 QUALCOMM Incorporated 3,277 5,108
9,800 Red Hat Inc. 515 1,840
42,830 salesforce.com inc. 2,800 6,499
13,800 Seagate Technology PLC 434 650
9,500 Skyworks Solutions Inc. 881 734
34,006 Symantec Corporation 774 740
8,210 Synopsys Inc. 598 1,056
51,749 Texas Instruments Incorporated 2,122 5,939
9,095 Total System Services Inc. 347 1,167
5,779 VeriSign Inc. 335 1,209
95,920 Visa Inc., Class A 4,104 16,647
16,201 Western Digital Corporation 812 770
23,953 The Western Union Company 495 476
10,868 Xerox Corporation 519 385
14,009 Xilinx Inc. 569 1,652
113,326 281,171
UTILITIES – 3.3%
36,429 The AES Corporation 663 611
13,000 Alliant Energy Corporation 525 638
13,600 Ameren Corporation 638 1,021
27,116 American Electric Power Company Inc. 1,294 2,386
9,950 American Water Works Company Inc. 712 1,154
6,450 Atmos Energy Corporation 620 681
27,621 CenterPoint Energy Inc. 603 791
15,643 CMS Energy Corporation 438 906
18,057 Consolidated Edison Inc. 1,068 1,583
44,162 Dominion Energy Inc. 2,548 3,415
10,102 DTE Energy Company 671 1,292
40,096 Duke Energy Corporation 2,505 3,538
17,884 Edison International 871 1,206
10,472 Entergy Corporation 832 1,078
13,600 Evergy Inc. 735 818
17,800 Eversource Energy 722 1,348
53,576 Exelon Corporation 2,355 2,568
27,909 FirstEnergy Corp. 1,244 1,195
26,408 NextEra Energy Inc. 2,265 5,410
$ $ 20,613 NiSource Inc. 536 594
14,800 NRG Energy Inc. 375 520
6,096 Pinnacle West Capital Corporation 345 574
39,817 PPL Corporation 1,180 1,235
27,840 Public Service Enterprise Group Inc. 1,013 1,637
15,142 Sempra Energy 1,191 2,081
57,432 The Southern Company 2,353 3,175
17,469 WEC Energy Group Inc. 696 1,456
28,421 Xcel Energy Inc. 863 1,691
29,861 44,602
REAL ESTATE – 3.0%
6,210 Alexandria Real Estate Equities Inc. 709 876
24,370 American Tower Corporation 1,910 4,982
8,260 Apartment Investment & Management Company 286 414
7,689 AvalonBay Communities Inc. 1,060 1,562
8,516 Boston Properties Inc. 864 1,099
17,149 CBRE Group Inc. 488 880
22,930 Crown Castle International Corp. 1,745 2,989
11,490 Digital Realty Trust Inc. 1,184 1,353
19,700 Duke Realty Corporation 534 623
4,636 Equinix Inc. 1,446 2,338
20,438 Equity Residential 979 1,552
3,630 Essex Property Trust Inc. 703 1,060
7,020 Extra Space Storage Inc. 606 745
4,080 Federal Realty Investment Trust 599 525
26,300 HCP Inc. 847 841
40,923 Host Hotels & Resorts Inc. 806 746
15,696 Iron Mountain Incorporated 498 491
23,265 Kimco Realty Corporation 521 430
5,800 The Macerich Company 366 194
6,260 Mid-America Apartment Communities Inc. 563 737
34,813 Prologis Inc. 1,740 2,788
8,274 Public Storage 1,140 1,971
17,300 Realty Income Corporation 892 1,193
9,200 Regency Centers Corporation 618 614
6,240 SBA Communications Corporation 968 1,403
17,042 Simon Property Group Inc. 2,081 2,723
4,700 SL Green Realty Corporation 594 378
15,500 UDR Inc. 554 696
20,400 Ventas Inc. 1,058 1,394
9,403 Vornado Realty Trust 849 603
22,300 Welltower Inc. 1,267 1,818
40,970 Weyerhaeuser Company 1,075 1,079
29,550 41,097
COMMUNICATION SERVICES – 10.1%
42,195 Activision Blizzard Inc. 1,726 1,992
16,515 Alphabet Inc., Class A 11,177 17,883
16,903 Alphabet Inc., Class C 5,350 18,271
402,578 AT&T Inc. 13,600 13,491
19,506 CBS Corporation 653 973
52,982 CenturyLink Inc. 1,775 623
9,490 Charter Communications Inc. 2,698 3,750
249,722 Comcast Corporation, Class A 5,018 10,558
8,700 Discovery Inc., Class A 294 267
19,900 Discovery Inc., Class C 633 566
12,700 DISH Network Corporation 753 488
16,249 Electronic Arts Inc. 857 1,645
132,520 Facebook Inc., Class A 11,725 25,576
19,630 Fox Corporation, Class A 812 719
8,933 Fox Corporation, Class B 369 326
21,397 The Interpublic Group of Companies Inc. 338 483
24,110 Netflix Inc. 1,913 8,856
21,023 News Corporation, Class A 237 284
6,800 News Corporation, Class B 88 95
$ $
June 30, 2019 Semi-Annual Financial Report
No. of Shares or Units/ Par Value Description Cost Fair Value
No. of Shares or Units/ Par Value Description Cost Fair Value
TD U.S. Index Fund
8

12,178 Omnicom Group Inc. 659 998
6,150 Take-Two Interactive Software Inc. 661 698
5,650 TripAdvisor Inc. 255 262
40,300 Twitter Inc. 1,554 1,407
228,186 Verizon Communications Inc. 9,914 13,036
19,600 Viacom Inc., Class B 784 586
96,286 The Walt Disney Company 6,729 13,445
80,572 137,278
Total U.S. Equities 756,135 1,312,740
International Equities – 2.5%
BERMUDA – 0.0%
2,240 Everest Re Group Ltd. 565 554
IRELAND – 1.1%
35,170 Accenture PLC, Class A 2,999 6,498
5,166 Allegion PLC 270 571
73,951 Medtronic PLC 4,668 7,202
6,900 Perrigo Company PLC 850 329
8,787 14,600
SWITZERLAND – 0.4%
25,256 Chubb Limited 2,326 3,720
6,600 Garmin Ltd. 315 526
18,500 TE Connectivity Ltd. 835 1,772
3,476 6,018
UNITED KINGDOM – 1.0%
89,400 Amcor PLC 998 1,027
13,258 Aon PLC 763 2,559
19,900 IHS Markit Ltd. 936 1,268
29,946 Linde PLC 4,848 6,013
8,647 Pentair PLC 424 322
23,300 TechnipFMC PLC 747 604
7,132 Willis Towers Watson PLC 914 1,366
9,630 13,159
Total International Equities 22,458 34,331
Index Equivalents – 0.2%
11,000 SPDR® S&P 500 ETF Trust 3,154 3,223
Transaction Costs (45)
TOTAL INVESTMENT
PORTFOLIO – 99.4% $ 781,702 $ 1,350,294
FORWARD CONTRACTS
(SCHEDULE 1) – 0.0% 2
TOTAL PORTFOLIO $ 1,350,296
Note: Percentages shown relate investments at fair value to Net Assets as at the period end.
$ $
June 30, 2019 Semi-Annual Financial Report
No. of Shares or Units/ Par Value Description Cost Fair Value
TD U.S. Index Fund
Schedule 1
Foreign Exchange Forward Contracts (in 000s except contract price and total number of contract(s)) U.S. Value U.S. Value Settlement Currency to be as at Currency to be as at Contract USD Unrealized Date Delivered June 30, 2019 Received June 30, 2019 Price Appreciation
July 03, 2019 3,600 CAD $ 2,749 2,751 USD $ 2,751 1.30862 $ 2
TOTAL NUMBER OF CONTRACT(S): 1 USD NET UNREALIZED APPRECIATION $ 2
9

June 30, 2019 Semi-Annual Financial Report
Fund-Specific Notes to the Interim Financial Report (Unaudited)
The Fund (I) The Fund was incepted on July 11, 1986 and its operations commenced on September 30, 1986.
(II) TDAM is the manager, portfolio adviser and trustee of the Fund. TDIS is the principal distributor of the Investor and e-Series units of the Fund.
(III) The presentation and functional currency of the Fund is the United States dollar.
(IV) The investment objective of the Fund is to seek to provide long-term growth of capital by primarily purchasing U.S. equity securities to track the performance of the S&P 500 Total Return Index (US$) (“S&P 500 TR Index”), which is comprised of 500 widely-held U.S. issuers. In seeking to achieve this objective, each security in the S&P 500 TR Index is held by the Fund in close tolerance to its index weight so that the performance of the Fund closely tracks the performance of the S&P 500 TR Index.
(V) As at June 30, 2019, TD and funds managed by TDAM held 11.3% (December 31, 2018: 11.9%) of the net assets of the Fund.
Management Fees and Administration Fees (%) (Note 6) for the periods ended June 30, 2019 and 2018 (exclusive of GST and HST)
Annual Rate
Management Administration Series Fees• Fees
Investor Series 0.50 N/A e-Series 0.35 N/A Institutional Series 0.35 N/A F-Series 0.50 N/A O-Series 0.00 N/A
• Includes management fees paid by the Fund and the proportionate management fees, if any, of the Underlying Funds managed by TDAM held by the Fund. However, there is no duplication of management fees paid to TDAM or its affiliates if the Fund invests in Underlying Funds that are managed by TDAM.
Brokerage Commissions and Soft Dollars (in 000s) (Notes 3 and 6) for the periods ended June 30, 2019 and 2018
2019 2018
Total Brokerage Commissions $ 6 $ 12
Commissions Paid to Related Parties 2 3
Soft Dollars 0 0
Tax Loss Carry Forwards (in 000s) (Note 7) as at December 31, 2018 (expressed in Canadian dollars)
Capital Losses $ 59,275
Non-Capital Losses (by year of expiry) None
Securities Lent (Note 3)
(I) SECURITIES LENDING INCOME
A reconciliation of the gross amount generated from the securities lending transactions to the securities lending income to the Fund for the periods ended June 30, 2019 and 2018 is as follows:
Percentage of Amount (in 000s) Total Amount (%)
2019 2018 2019 2018
Gross Securities Lending Income $ 65 $ 48 100.0 100.0
Agent Fees – The Bank of New York Mellon (13) (9) (19.8) (18.8)
Securities Lending Income to the Fund before Tax Reclaims (Withholding Taxes) 52 39 80.2 81.2
Tax Reclaims (Withholding Taxes) (1) (1) (1.1) (2.1)
Net Securities Lending Income $ 51 $ 38 79.1 79.1
(II) SECURITIES LENT AND COLLATERAL HELD (in 000s) The table below summarizes the aggregate securities lent and related collateral held by the Fund as at June 30, 2019 and December 31, 2018.
June 30, December 31, 2019 2018
Fair Value of Securities Lent $ 73,516 $ 88,394
Fair Value of Collateral Held 77,685 93,162
Collateral held is in the form of debt obligations of the Government of Canada and other countries, Canadian provincial and municipal governments or corporations and is not included in the Statements of Financial Position.
nTD U.S. Index Fund (expressed in United States dollars)
10

June 30, 2019 Semi-Annual Financial Report
Financial Risk Management (Notes 3, 4 and 8) as at June 30, 2019 and December 31, 2018
(I) INTEREST RATE RISK
Not significant to the Fund.
(II) CURRENCY RISK
Not significant to the Fund after hedging activities.
(III) OTHER PRICE RISK
The table below summarizes the impact of other price risk to the Fund. As at June 30, 2019 and December 31, 2018, had the benchmark of the Fund increased or decreased by 5 percent, with all other variables held constant, the net assets of the Fund would have increased or decreased by approximately:
Impact on Impact on Net Assets (in 000s) Net Assets (%)
June 30, December 31, June 30, December 31, Benchmark 2019 2018 2019 2018
S&P 500 Total Return Index $ 67,515 $ 56,468 5.0 5.0
In practice, the actual trading results may differ from the above estimated amounts and the differences could be material.
(IV) CREDIT RISK
Not significant to the Fund.
(V) FINANCIAL INSTRUMENTS BY THE LEVEL IN THE FAIR VALUE HIERARCHY (in 000s) The tables below illustrate the classification of the Fund’s financial instruments within the fair value hierarchy as at June 30, 2019 and December 31, 2018.
Level 1 Level 2 Level 3 Total
June 30, 2019 Equities $ 1,347,071 $ 0 $ 0 $ 1,347,071 Underlying Funds 3,223 0 0 3,223 Forward Contracts 0 2 0 2
$ 1,350,294 $ 2 $ 0 $ 1,350,296
Level 1 Level 2 Level 3 Total
December 31, 2018 Equities $ 1,128,812 $ 0 $ 0 $ 1,128,812 Underlying Funds 550 0 0 550
1,129,362 0 0 1,129,362
Forward Contracts 0 (0) 0 (0)
$ 1,129,362 $ (0) $ 0 $ 1,129,362
As at the end of the periods, transfers between Level 1 and Level 2 were not significant.
(VI) RECONCILIATION OF LEVEL 3 FAIR VALUE MEASUREMENTS (in 000s) Not significant or applicable to the Fund.
Investment Portfolio Concentration (%) (Note 8) As at June 30, 2019 and December 31, 2018, the Fund’s investment portfolio concentration can be summarized as follows:
June 30, December 31, 2019 2018
U.S. Equities Energy 5.0 5.3 Materials 2.3 2.3 Industrials 9.1 9.0 Consumer Discretionary 10.1 9.8 Consumer Staples 7.2 7.4 Health Care 13.5 14.9 Financials 12.4 12.8 Information Technology 20.7 19.5 Utilities 3.3 3.3 Real Estate 3.0 2.9 Communication Services 10.1 10.1 International Equities Bermuda 0.0 0.0 Ireland 1.1 1.1 Switzerland 0.4 0.5 United Kingdom 1.0 0.8 Index Equivalents 0.2 0.0 Forward Contracts 0.0 0.0 Other Net Assets (Liabilities) 0.6 0.3
100.0 100.0
Interest in Unconsolidated Structured Entities (in 000s) (Note 3) The table below illustrates the Fund’s investment details in the Underlying Funds as at June 30, 2019 and December 31, 2018.
Fair Value Underlying of Fund’s Fund’s
Underlying Funds Investment Net Assets
June 30, 2019 SPDR® S&P 500 ETF Trust $ 3,223 $ 268,033,527
December 31, 2018 SPDR® S&P 500 ETF Trust $ 550 $ 243,392,893
Fund-Specific Notes to the Interim Financial ReportTD U.S. Index Fund
11

June 30, 2019 Semi-Annual Financial Report
Offsetting of Financial Assets and Liabilities (in 000s) (Note 3) The following table presents the recognized financial instruments that are offset, or subject to enforceable master netting arrangements, if certain conditions arise, or other similar agreements but that are not offset, and cash and financial instruments collateral received or pledged, as at June 30, 2019 and December 31, 2018 and shows in the Net Amount column what the impact would be in the Fund’s Statements of Financial Position if all set-off rights were exercised.
Amounts Net Amounts Related Amounts Not
Gross Amounts Set-Off in the Presented in Set-Off in the Statements
of Recognized Statements the Statements of Financial Position
Financial Assets of Financial of Financial Financial (Liabilities) Position Position Instruments Cash Net Amount
June 30, 2019 Derivative Assets $ 2 $ 0 $ 2 $ 0 $ 0 $ 2
Derivative Liabilities 0 0 0 0 0 0
December 31, 2018 Derivative Assets $ 0 $ 0 $ 0 $ 0 $ 0 $ 0
Derivative Liabilities 0 0 0 0 0 0
Contingent Liability The Fund is subject to claims from creditors arising from proceeds received from the sale of an investment held by the Fund in Tribune Company. While management currently believes that resolution of these claims will not have a material adverse impact on the Fund, these matters are subject to inherent uncertainties. The amount of the loss, if any, cannot be determined at this time.
Subsequent Events On July 18, 2019, TD Asset Management Inc. announced that, subject to obtaining unitholder approval, the Fund will change its investment objective from tracking the performance of the S&P 500 Total Return Index to tracking the performance of a broad U.S. equity market index that measures the investment return of large capitalization U.S. stocks. Unitholder approval will be sought at a special meeting to be held on or about September 27, 2019. The change will be effective on or about November 7, 2019.
Fund-Specific Notes to the Interim Financial ReportTD U.S. Index Fund
12

June 30, 2019 Semi-Annual Financial Report
The S&P 500 Index is a product of S&P Dow Jones Indices LLC, a divi -sion of S&P Global, or its affiliates (“SPDJI”), and has been licensed for use by The Toronto-Dominion Bank (“TD Bank”). Standard & Poor’s®, S&P® and S&P 500® are registered trademarks of Standard & Poor’s Financial Services LLC, a division of S&P Global (“S&P”); Dow Jones®, Dow Jones Industrial Average® and DJIA® are registered trademarks of Dow Jones Trademark Holdings LLC (“Dow Jones”); and these trade -marks have been licensed for use by SPDJI and sublicensed for certain purposes by TD Bank. It is not possible to invest directly in an index. The TD U.S. Index Fund (“Fund”) is not sponsored, endorsed, sold or promoted by SPDJI, Dow Jones, S&P or any of their respective affiliates (collectively, “S&P Dow Jones Indices”). S&P Dow Jones Indices makes no representation or warranty, express or implied, to the owners of the Fund or any member of the public regarding the advisability of invest-ing in securities generally or in the Fund particularly or the ability of the S&P 500 Index to track general market performance. Past perform-ance of an index is not an indication or guarantee of future results. S&P Dow Jones Indices’ only relationship to TD Bank with respect to the S&P 500 Index is the licensing of the Index and certain trademarks, service marks and/or trade names of S&P Dow Jones Indices or its licensors. The S&P 500 Index is determined, composed and calculated by S&P Dow Jones Indices without regard to TD Bank or the Fund. S&P Dow Jones Indices has no obligation to take the needs of TD Bank or the owners of the Fund into consideration in determining, composing or calculating the S&P 500 Index. S&P Dow Jones Indices is not respon-sible for and has not participated in the determination of the prices, and amount of the Fund or the timing of the issuance or sale of the Fund or in the determination or calculation of the equation by which the Fund is to be converted into cash, surrendered or redeemed, as the case may be. S&P Dow Jones Indices has no obligation or liability in connection with the administration, marketing or offering of the Fund.
There is no assurance that investment products based on the S&P 500 Index will accurately track index performance or provide positive invest-ment returns. S&P Dow Jones Indices LLC is not an investment or tax advisor. A tax advisor should be consulted to evaluate the impact of any tax-exempt securities on portfolios and the tax consequences of making any particular investment decision. Inclusion of a security within an index is not a recommendation by S&P Dow Jones Indices to buy, sell, or hold such security, nor is it considered to be investment advice.
S&P DOW JONES INDICES DOES NOT GUARANTEE THE ADEQUACY, ACCURACY, TIMELINESS AND/OR THE COMPLETENESS OF THE S&P 500 INDEX OR ANY DATA RELATED THERETO OR ANY COMMU NI CATION, INCLUDING BUT NOT LIMITED TO, ORAL OR WRITTEN COMMUNI -CATION (INCLUDING ELECTRONIC COMMUNICATIONS) WITH RESPECT THERETO. S&P DOW JONES INDICES SHALL NOT BE SUBJECT TO ANY DAMAGES OR LIABILITY FOR ANY ERRORS, OMISSIONS, OR DELAYS THEREIN. S&P DOW JONES INDICES MAKES NO EXPRESS OR IMPLIED WARRANTIES, AND EXPRESSLY DISCLAIMS ALL WARRANTIES, OF MERCHANTABILITY OR FITNESS FOR A PARTICULAR PURPOSE OR USE OR AS TO RESULTS TO BE OBTAINED BY TD BANK, OWNERS OF THE FUND, OR ANY OTHER PERSON OR ENTITY FROM THE USE OF THE S&P 500 INDEX OR WITH RESPECT TO ANY DATA RELATED THERETO. WITHOUT LIMITING ANY OF THE FOREGOING, IN NO EVENT WHATSOEVER SHALL S&P DOW JONES INDICES BE LIABLE FOR ANY INDIRECT, SPECIAL, INCIDENTAL, PUNITIVE, OR CONSEQUENTIAL DAMAGES INCLUDING BUT NOT LIMITED TO, LOSS OF PROFITS, TRADING LOSSES, LOST TIME OR GOODWILL, EVEN IF THEY HAVE BEEN ADVISED OF THE POSSIBILITY OF SUCH DAMAGES, WHETHER IN CONTRACT, TORT, STRICT LIABILITY, OR OTHERWISE. THERE ARE NO THIRD PARTY BENEFICIARIES OF ANY AGREEMENTS OR ARRANGE -MENTS BETWEEN S&P DOW JONES INDICES AND TD BANK, OTHER THAN THE LICENSORS OF S&P DOW JONES INDICES.
TD U.S. Index Fund
13

1. The Funds
The TD Mutual Fund Trusts and TD Managed Assets Program Portfolios (collectively, the “Funds” and individually, the “Fund”) are open-end mutual funds established under the laws of Ontario and governed by their respective Declarations of Trust or Trust Indenture, as amended from time to time.
TD Asset Management Inc. (“TDAM”) is the manager, portfolio adviser and trustee of the Funds. TDAM, TDAM USA Inc., TD Investment Services Inc. (“TDIS”), TD Waterhouse Canada Inc. (“TDWCI”) and Epoch Investment Partners, Inc. (“Epoch”) are wholly-owned subsidiaries of The Toronto-Dominion Bank (“TD”). TD Greystone Asset Management (“TD Greystone”) represents Greystone Managed Investments Inc., a wholly-owned subsidiary of Greystone Capital Management Inc. (“GCMI”). GCMI is a wholly-owned subsidiary of TD. The registered address of the Funds is P.O. Box 100, 66 Wellington Street West, TD Bank Tower, Toronto-Dominion Centre, Toronto, Ontario, M5K 1G8.
The financial year-end for the Funds is December 31. The Statements of Financial Position are presented as at June 30, 2019 and December 31, 2018, as applicable. The Statements of Comprehensive Income, Statements of Changes in Net Assets Attributable to Holders of Redeemable Units and Statements of Cash Flows are presented for the six-month periods ended June 30, 2019 and 2018, as applicable. Where a Fund or series of a Fund was established during either period, the information for that Fund or series is provided from the inception date, as disclosed in the Fund-Specific Notes to the Interim Financial Report (“Fund-Specific Notes”), to the applicable period end date and a comparative statement has only been presented for any period for which that Fund was in existence as at the reporting date.
These financial statements were authorized for issue by TDAM on August 14, 2019.
2. Basis of Presentation
These financial statements have been prepared in accordance with International Financial Reporting Standards as issued by the International Accounting Standards Board (“IFRS”), applicable to the preparation of interim financial reports, including International Accounting Standards (“IAS”) 34, “Interim Financial Reporting”. These financial statements have been prepared under the historical cost convention, as modified by the revaluation of financial assets and financial liabilities (including derivative financial instruments) at fair value through profit or loss (“FVTPL”).
3. Summary of Significant Accounting Policies
Financial Instruments Financial instruments include financial assets and financial liabilities, such as investments, derivatives, cash, and other receivables and payables. Derivatives that are reflected in the Statements of Financial Position as Derivative Assets (Liabilities) include rights, warrants, forwards, options, futures and swap contracts, where applicable, and are financial contracts between two or more parties, and whose value is derived from the performance of an underlying asset or group of assets. Underlying assets include stocks, bonds, currencies, interest
rates and market indices. The Funds classify and measure financial instruments in accordance with IFRS 9, “Financial Instruments”. Upon initial recognition, financial instruments are measured at FVTPL. All financial assets and liabilities are recognized in the Statements of Financial Position when a Fund becomes a party to the contractual requirements of the instrument. Financial instruments are derecognized when the right to receive cash flows from the instrument has expired or a Fund has transferred substantially all risks and rewards of owner -ship. As such, investment purchase and sale transactions are recorded as of the trade date.
The Funds’ financial assets and financial liabilities, other than receivables and payables, are subsequently measured at FVTPL with changes in fair value recognized in the Statements of Comprehensive Income. Other receivables and payables are subsequently measured at amortized cost.
The Funds have determined that they meet the definition of an ‘investment entity’ and as a result, the Funds measure subsidiaries, if any, at FVTPL. An investment entity is an entity that: obtains funds from one or more investors for the purpose of providing them with investment management services; commits to its investors that its business purpose is to invest funds solely for returns from capital appreciation, investment income, or both; and measures and evaluates the performance of substantially all of its investments on a fair value basis. The Funds’ investments may also include associates and joint ventures which are measured at FVTPL.
The Funds’ outstanding redeemable units’ entitlements include a contractual obligation to distribute any net income and net realized capital gains in cash (at the request of the unitholder) and therefore the ongoing redemption feature is not the Funds’ only contractual obligation. Consequently, the Funds’ Net Assets Attributable to Holders of Redeemable Units are classified as financial liabilities in accordance with the requirements of IAS 32, “Financial Instruments: Presentation”. The Funds’ obligations for Net Assets Attributable to Holders of Redeemable Units are presented at the redemption amount.
The accounting policies for measuring the fair value of the Funds’ investments and derivatives are substantially similar to those used in measuring the Funds’ net asset value (“NAV”) for transactions with unitholders. The NAV is the value of the total assets of a fund less the value of its total liabilities determined, on each valuation day, in accordance with Part 14 of National Instrument 81-106, “Investment Fund Continuous Disclosure”, for the purpose of processing unitholder transactions. Net Assets Attributable to Holders of Redeemable Units, also referred to as Net Assets, refers to net assets calculated in accor -dance with IFRS. As at all dates presented, there were no differences between the Funds’ NAV per series unit and Net Assets per series unit.
nNotes to the Interim Financial Report (Unaudited)
June 30, 2019 Semi-Annual Financial Report14

Fair Value Measurement Fair value is the price that would be received to sell an asset or paid to transfer a liability in an orderly transaction between market participants at the measurement date. The fair value of financial assets and liabilities traded in active markets (such as publicly traded derivatives and marketable securities) is based on quoted market prices at the close of trading on the reporting date. The Funds use the last traded market price for both financial assets and financial liabilities where the last traded price falls within that day’s bid-ask spread. In circumstances where the last traded price is not within the bid-ask spread, TDAM determines the point within the bid-ask spread that is most representative of fair value based on the specific facts and circumstances.
The fair value of financial assets and liabilities not traded in an active market, including over-the-counter derivatives, is determined using valuation techniques. The Funds use a variety of methods and make assumptions that are based on market conditions existing at each report-ing date. Valuation techniques include the use of comparable recent arm’s length transactions, reference to other instruments that are sub-stantially the same, discounted cash flow analysis, option pricing models and other techniques commonly used by market participants and which attempt to make the maximum use of observable inputs.
The valuation methodology for specific types of investments held by the Funds is summarized below.
(a) Securities not listed on any recognized public securities exchange are valued based on available quotations from recognized dealers in such securities, where readily available. If securities have no available broker-dealer bid/ask quotes, TDAM uses its own pricing model to price the securities. The pricing model will generally include the discounted cash flow valuation approach, the use of a credit spread based on the terms of the security and the use of such credit and yield analysis comparables as TDAM believes are relevant in the circumstances. Debt instruments are valued based on mid prices, where readily available. Other valuation techniques may be used, as described above, where applicable.
(b) Short-term debt instruments, repurchase and reverse repurchase agreements are valued based on quotations received from recognized investment dealers.
(c) Real return bonds are valued based on the available public quotations from recognized dealers. Changes in the inflation factor are included in Interest for Distribution Purposes in the Statements of Comprehensive Income.
(d) The Funds may use foreign exchange forward contracts to hedge against or profit from fluctuations in foreign exchange rates. These contracts are valued on each valuation day based on the difference between the contract rates and the current forward rates at the measurement date applied to the contracts’ notional amount. The net change in unrealized appreciation or depreciation and the net realized gain or loss from closing out contracts are reflected in the Statements of Comprehensive Income as part of Net Gain (Loss) on Investments and Derivatives.
(e) Options contracts that are traded in exchange markets are valued at their closing prices on each valuation day. The premium received or paid on options written or purchased is included in the cost of the options. Any difference between the current value of the contract and the value of the contract originated is recognized as Net Change in Unrealized Appreciation/Depreciation. When options are closed or exercised, the difference between the premium and the amount paid or received, or the full amount of the premium if the option expires worthless, is reflected in the Statements of Comprehensive Income as Net Realized Gain (Loss). The cost of a security purchased will be reduced by the premium received on options when a written put option is exercised or increased by the amount paid on options when a purchased option is exercised.
(f) The Funds may purchase standardized, exchange-traded futures contracts. Any difference between the value at the close of business on the current valuation day and that of the previous valuation day is settled in cash daily and recorded in the Statements of Comprehensive Income as Derivatives Income (Loss). Any cash deposits or borrowings on margin are reflected in the Statements of Financial Position as Margin Deposit (Payable) on Derivatives. Short-term debt instruments as indicated in the Schedule of Investment Portfolio have been segregated and are held as margin against the futures contracts purchased by the Funds, as applicable.
(g) The TD Mutual Fund Trusts may enter into a credit default swap (“CDS”) agreements to gain exposure to debt instruments without investing in them directly. A CDS agreement is a bilateral over- the-counter derivative contract between a protection buyer and a protection seller that exchange the credit risk of a specific issuer (reference entity). The protection buyer pays a periodic premium, often quarterly, to the protection seller to assume the credit risk associated with a particular credit event. Credit events include bankruptcy, a material default and debt restructuring for a specified reference asset. If a credit event occurs, the CDS agreements may be settled by either the physical delivery of the referenced asset for proceeds equal to par value or a cash payment equal to the loss amount. If there is no credit default event, no contingent amount is payable.
During the reporting periods, certain Funds have entered into CDS indices as protection seller. Any upfront payment made or received by these funds at the initiation of a CDS agreement is included in the CDS agreement’s fair value. Quarterly premiums received from the counterparty are accrued daily and recorded as Derivative Income (Loss) in the Statements of Comprehensive Income. Changes in the fair value of the CDS agreements outstanding at the reporting date are disclosed in the Statements of Comprehensive Income as Net Change in Unrealized Appreciation/Depreciation. Prices used to value the CDS are obtained directly from the data vendor or broker. When CDS agreements expire or are closed out, the net realized gain or loss is reflected in the Statements of Comprehensive Income as Net Realized Gain (Loss).
The Funds’ exposure to CDS is limited to the notional amount of the contract less any applicable recoverable amount, calculated by the product of the notional amount and the recovery rate of the respective reference entity.
nNotes to the Interim Financial Report (Unaudited)
Semi-Annual Financial ReportJune 30, 2019 15

(h) The exchange-traded funds (“ETFs”) that are not managed by TDAM are valued based on quoted market prices at the close of trading on the reporting date.
(i) Investments in underlying conventional mutual funds and TDAM managed ETFs are generally valued at the NAV per series unit of the investment funds as reported by the investment funds’ managers.
Fair Value Hierarchy The Funds classify their investments into fair value measurements within a hierarchy that prioritizes the inputs to fair value measurement. The fair value hierarchy has the following three levels:
Level 1 Quoted (unadjusted) prices in active markets for identical assets or liabilities;
Level 2 Inputs other than quoted prices that are observable for the asset or liability either directly (that is, as prices) or indirectly (that is, derived from prices); and
Level 3 Inputs that are not based on observable market data (that is, unobservable inputs).
All fair value measurements are recurring. The carrying values of Cash, Margin Deposit on Derivatives, Subscriptions Receivable, Interest and Dividends Receivables, Receivable for Investments Sold, Bank Overdraft, Margin Payable on Derivatives, Payable for Investments Purchased, Redemptions Payable, Distributions Payable, Accrued Liabilities and the redemption value of Funds’ obligation for Net Assets Attributable to Holders of Redeemable Units approximate their fair values due to their short-term nature.
Fair values are classified as Level 1 when the related security or deriva-tive is actively traded and a quoted price is available. If an instrument classified as Level 1 subsequently ceases to be actively traded, it is transferred out of Level 1. In such cases, instruments are reclassified into Level 2, unless the measurement of their fair value requires the use of significant unobservable inputs, in which case they are classified as Level 3. The Funds’ policy is to recognize transfers into and out of the fair value hierarchy levels at the end of the reporting period.
The hierarchy gives the highest priority to unadjusted quoted prices in active markets for identical assets or liabilities (Level 1) and the lowest priority to unobservable inputs (Level 3).
The classification within the hierarchy is based on the lowest level input that is significant to the fair value measurement. For this purpose, the significance of an input is assessed against the fair value measurement in its entirety. If a fair value measurement uses observable inputs that require significant adjustment based on unobservable inputs, that measurement is a Level 3 measurement. Assessing the significance of a particular input to the fair value measurement in its entirety requires judgement, considering factors specific to the asset or liability.
The determination of what constitutes ‘observable’ requires significant judgement. Observable data is considered to be that market data that is readily available, regularly distributed or updated, reliable and verifiable, not proprietary, and provided by independent sources that are actively involved in the relevant market.
TDAM has a Global Fair Value Committee which oversees the perform -ance of the fair value measurements included in the financial statements of the Funds, including any Level 3 measurements. TDAM utilizes a variety of methods (as listed in the Fair Value Measurement section) in determining the fair value of securities classified as Level 3. The committee also meets quarterly to perform reviews of the valuations of investments held by the Funds.
The classification of the Funds’ financial instruments within the fair value hierarchy as at June 30, 2019 and December 31, 2018, and any transfers between levels at the end of the reporting periods as a result of changes in the lowest level input that is significant to the fair value measurement are disclosed in the Fund-Specific Notes, where applicable.
Interest in Unconsolidated Structured Entities A structured entity is an entity that has been designed so that voting or similar rights are not the dominant factor in deciding who controls the entity, such as when any voting rights relate to administrative tasks only and the relevant activities are directed by means of contractual arrangements. TDAM has determined that all of the underlying invest-ment funds (“Underlying Funds”) in which the Funds invest are unconsolidated structured entities. Underlying Funds include conven-tional mutual funds and ETFs. In making this determination, TDAM evaluated the fact that decision making about Underlying Funds’ activities is generally not governed by voting or similar rights held by the Funds and other investors in any Underlying Funds.
The Funds may invest in Underlying Funds whose investment objectives range from seeking to achieve short- to long-term income and/or capital growth potential. The Funds’ interests in these securities as at June 30, 2019 and December 31, 2018 are included at their fair value in the Statements of Financial Position, which represent the Funds’ exposure in these Underlying Funds. The Funds do not provide and have not committed to provide any additional significant financial or other support to the Underlying Funds. The change in fair value of each of the Underlying Funds during the reporting periods is included in Net Change in Unrealized Appreciation/Depreciation in the Statements of Comprehensive Income as part of Net Gain (Loss) on Investments and Derivatives. Additional information on the Funds’ interest in Underlying Funds, where applicable, is provided in the Schedule of Investment Portfolio and Fund-Specific Notes.
The TD Mutual Fund Trusts may also invest in mortgage-related and/or other asset-backed securities that directly or indirectly represent a participation in, or are secured by and payable from, mortgage loans on real property. Mortgage-related securities are created from pools of residential or commercial mortgage loans, including mortgage loans made by savings and loan institutions, mortgage bankers, commercial banks and others. The debt and equity securities issued by these issuers may include tranches with varying levels of subordination. The Funds may invest in senior notes that have a first lien on assets and have minimum exposure to junior or subordinate tranches. These securities may provide a monthly payment which consists of both interest and principal payments. Other asset-backed securities are created from many types of assets, including auto loans, credit card receivables, home equity loans, and student loans.
nNotes to the Interim Financial Report (Unaudited)
June 30, 2019 Semi-Annual Financial Report16

As at June 30, 2019 and December 31, 2018, the fair value of mortgage-related and other asset-backed securities of these funds, where applicable, is disclosed as Investments in the Statements of Financial Position. The fair value represents the maximum exposure to losses at those dates. The change in fair value of mortgage-related and other asset-backed securities during the reporting periods is included in Net Change in Unrealized Appreciation/Depreciation in the Statements of Comprehensive Income as part of Net Gain (Loss) on Investments and Derivatives.
Translation of Foreign Currencies A Fund’s functional currency, as disclosed in the Fund-Specific Notes, represents the currency that TDAM views to most faithfully represent the economic effects of the Fund’s underlying transactions, events and conditions taking into consideration how units are issued or redeemed and how returns are measured. Foreign currency transactions are trans-lated into the functional currency using the exchange rates prevailing at the dates that transactions occur. Realized foreign exchange gains and losses on income are recognized as income in the Statements of Comprehensive Income.
Assets and liabilities denominated in a foreign currency are translated into the functional currency using the exchange rate prevailing at the measurement date. Foreign exchange gains and losses on the sale of investments are included in Net Realized Gain (Loss). Unrealized foreign exchange gains and losses on investments held and other assets and liabilities are included in Net Change in Unrealized Appreciation/ Depreciation. Realized and unrealized foreign exchange gains and losses relating to cash are presented as Foreign Exchange Gain (Loss) on Cash in the Statements of Comprehensive Income.
Offsetting of Financial Assets and Liabilities Financial assets and liabilities are offset and the net amount reported in the Statements of Financial Position where the Funds have a legally enforceable right to offset the recognized amounts and there is an intention to settle on a net basis or realize the asset and settle the liability simultaneously. In the normal course of business, the Funds may enter into various master netting agreements or other similar arrange -ments that do not meet the criteria for offsetting in the Statements of Financial Position but still allow for the related amounts to be set-off in certain circumstances, such as bankruptcy or the termination of the contracts. Offsetting information, where applicable, is presented in the Fund-Specific Notes.
Reverse Repurchase Agreements Certain TD Mutual Fund Trusts may enter into reverse repurchase transactions. In a reverse repurchase transaction, a fund buys a security at one price from a third party and agrees to sell the same security back to the same party at a specified price on an agreed future date and the difference is reflected as Income from Reverse Repurchase Agreements in the Statements of Comprehensive Income.
The risk with these types of transactions is that the other party may default under the agreement or go bankrupt. These risks are reduced by requiring the other party to provide collateral to these funds. The value of the collateral has to be at least 102 percent of the market value of the security and the collateral is marked to market on each business day. The type of securities received and related collateral held by these funds, where applicable, are listed in the Schedule of Investment Portfolio.
Cash/Bank Overdraft Cash is comprised of deposits with financial institutions. Bank overdrafts are included under Current Liabilities in the Statements of Financial Position.
Margin Deposit (Payable) on Derivatives Margin accounts represent margin deposits or payable in respect of derivatives entered into by the Funds.
Receivable for Investments Sold/Payable for Investments Purchased Receivable for Investments Sold and Payable for Investments Purchased represent trades that have been contracted for but not yet settled or delivered on the Statements of Financial Position dates.
Valuation of Series Units TDAM generally calculates the NAV for each series of the Funds as at 4 p.m. Eastern Time on each day that the Toronto Stock Exchange is open for trading. However, in some unforeseen circumstances, the series NAV per unit may be calculated at another time.
The NAV is calculated, for processing subscription, switch, conversion or redemption orders of series units, for each series of units of the Funds by taking the series’ proportionate share of the individual Fund’s common assets less that series’ proportionate share of its common liabilities and deducting from this amount all liabilities that relate solely to that specific series.
The Net Assets Attributable to Holders of Redeemable Units – Per Series Unit is determined by dividing the total Net Assets Attributable to Holders of Redeemable Units of each series of the Funds by the total number of units outstanding of that series as at the reporting date.
Income Recognition Interest for Distribution Purposes as shown in the Statements of Comprehensive Income consists of interest income from cash and the coupon interest on debt instruments accounted for on an accrual basis. Interest receivable is included in Interest and Dividends Receivables in the Statements of Financial Position based on the debt instruments’ stated rates of interest. The Funds do not amortize premiums paid or discounts received on the purchase of debt securities except for zero coupon bonds which are amortized.
Dividend income from equities and ETFs are recognized on ex-dividend dates and distributions from underlying mutual funds are recognized on ex-distribution dates. Dividends received from ETFs are recognized in the Statements of Comprehensive Income based on the nature of the underlying components such as interest income, dividend income, capital gains and return of capital. Distributions received from underlying mutual funds are included in Distributions from Underlying Funds in the Statements of Comprehensive Income.
The TD Mutual Fund Trusts may engage in securities lending pursuant to the terms of an agreement which includes restrictions as set out in Canadian securities legislation. The income earned from securities lending, where applicable, is included in the Statements of Comprehensive Income as it is earned. The fair value of the securities loaned and fair value of the collateral held are determined daily. The details of securities lending income, aggregate values of securities on loan and related collateral held are provided in the Fund-Specific Notes, where applicable.
nNotes to the Interim Financial Report (Unaudited)
Semi-Annual Financial ReportJune 30, 2019 17

Investment Transactions and Transaction Costs For the purposes of calculating realized and unrealized gains and losses from investment transactions, the cost of each investment security is determined on an average cost basis, excluding transaction costs.
Transaction costs, such as brokerage commissions, incurred by the Funds in the purchase and sale of investments at fair value are recognized in the Statements of Comprehensive Income in the period incurred. Commissions incurred, where applicable, are also disclosed in the Fund-Specific Notes. No transaction costs are incurred when the Funds invest in underlying mutual funds, however, the underlying mutual funds’ investments may be subject to transaction costs.
Allocation of Income and Expenses, Realized and Unrealized Gains (Losses) Expenses (excluding interest charges and portfolio transaction costs) are accrued daily, separately for each series. Interest charges and portfolio transaction costs along with income, gains and losses, are allocated to each series based on their respective Net Assets Attributable to Holders of Redeemable Units.
Increase (Decrease) in Net Assets Attributable to Holders of Redeemable Units – Per Series Unit The Increase (Decrease) in Net Assets Attributable to Holders of Redeemable Units – Per Series Unit is calculated by dividing the Increase (Decrease) in Net Assets Attributable to Holders of Redeemable Units of each series by the weighted average units outstanding of that series for the reporting period, except when a series was established during the reporting period, in which case the Weighted Average Units Outstanding for the Period – Per Series is calculated from the date of commencement of operation of that series.
4. Critical Accounting Estimates and Judgements
The preparation of financial statements requires management to use judgement in applying its accounting policies and to make estimates and assumptions about the future. The following discusses the most significant accounting judgements and estimates that the Funds have made in preparing the financial statements:
Fair Value Measurement of Derivatives and Securities Not Quoted in an Active Market The Funds may hold financial instruments that are not quoted in active markets, including derivatives. As described in Note 3, the use of valuation techniques for financial instruments and derivatives that are not quoted in an active market requires TDAM to make assumptions that are based on market conditions existing as at the reporting date of the financial statements. Changes in assumptions about these factors could affect the reported fair values of financial instruments. Refer to the Fund-Specific Notes for further information about the fair value measurement of the Funds’ financial instruments, where applicable.
Classification and Measurement of Investments In classifying and measuring financial instruments held by the Funds, TDAM has assessed the Funds’ business model for managing their respective portfolios of investments and evaluating the performance on a fair value basis, and concluded that these financial assets and liabilities should be measured at FVTPL in accordance with IFRS 9.
Investment Entity In determining whether a Fund meets the definition of an investment entity, TDAM may be required to make significant judgements about whether a Fund has the typical characteristics of an investment entity. Each Fund may hold only one investment, an underlying fund (or have only one investor or have investors that are its related parties), however, consistent with the investment entity definition, each Fund primarily obtains funds from one or more investors for the purpose of providing investment management services, commits to its investors that the business purpose is to invest the funds solely for returns from capital appreciation, investment income or both, and measures and evaluates the performance of its investments on a fair value basis.
5. Redeemable Units
For TD Mutual Fund Trusts and TD Managed Assets Program Portfolios, each individual series of units is sold under different purchase options and may have higher or lower management fees based on their specific attributes, as summarized below, reflecting the extent of the investment advice provided.
TD Mutual Fund Trusts Each TD Mutual Fund Trust is authorized to issue an unlimited number of units of multiple series that rank equally and are available for sale under a single simplified prospectus. In addition, each of these funds is also authorized to issue an unlimited number of units of multiple series to be sold under a confidential offering memorandum or other separate simplified prospectus. The various series that may be offered by these funds are as described below.
Investor Series: Offered on a no-load basis to investors.
H5 Series Offered on a no-load basis to investors who wish to receive and H8 Series: a regular monthlycash flow from the Funds. Monthly distri -
butions may consist of net income, net realized capital gains and/or a return of capital.
Premium Series: Offered on a no-load basis to large investors and others who make the required minimum investment, as determined by TDAM from time to time.
K-Series: Offered on a no-load basis to large investors and others who make the required minimum investment, as determined by TDAM from time to time, and who wish to receive a regular monthly cash flow from the Funds. Monthly distribu -tions may consist of net income, net realized capital gains, and/or a return of capital.
e-Series: Offered on a no-load basis to investors who want to complete their transactions electronically.
D-Series: Offered on a no-load basis to investors who want to complete their transactions through TD Direct Investing, a division of TDWCI, or other discount brokers.
nNotes to the Interim Financial Report (Unaudited)
June 30, 2019 Semi-Annual Financial Report18

Advisor Series: Offered to investors who seek investment advice and want the option of transacting on a front-end load, back-end load, low-load or low-load-2 basis.
T5 Series Offered to investors who seek investment advice; want the and T8 Series: option of transacting on a front-end load, back-end load,
low-load or low-load-2 basis; and who wish to receive a regular monthly cash flow from the Funds. Monthly distribu-tions may consist of net income, net realized capital gains and/or a return of capital.
F-Series: Offered to investors, through fee-based financial advisors or dealer-sponsored “wrap accounts”, and others who pay an annual fee to their dealer instead of transactional sales charges.
FT5 Series Offered to investors, through fee-based financial advisors and FT8 Series: or dealer-sponsored “wrap accounts”, who wish to receive
a regular monthly cash flow from the Funds. Monthly distributions may consist of net income, net realized capital gains, and/or a return of capital. These series may also be offered to other investors who pay an annual fee to their dealer instead of transactional sales charges.
Premium Offered to large investors, through fee-based financial F-Series: advisors or dealer-sponsored “wrap accounts”, and others
who pay an annual fee to their dealer instead of trans -actional sales charges. For this series, investors must make the required minimum investment, as determined by TDAM from time to time.
W-Series: Offered to investors, through certain wealth management businesses of TD Bank Group, including certain divisions of TDWCI, or other dealers authorized by TDAM, who pay an annual fee to their dealer instead of transactional sales charges.
Private Series Offered on a no-load basis to large investors who make the and Private-EM required minimum investment as determined by TDAM, and Series: have entered into a Private Series agreement with TDAM.
Institutional Offered on a no-load basis to large investors, such as group Series: savings plans and others who make the required minimum
investment, as determined by TDAM from time to time.
C-Series: Offered on a no-load basis to large investors who make the required minimum investment as determined by TDAM and have entered into a C-Series agreement with TDAM.
O-Series: Offered on a no-load basis to large investors, such as institutions and mutual funds, who make the required minimum investment as determined by TDAM, and have entered into an O-Series agreement with TDAM.
Effective July 26, 2018, H-Series was renamed as H5 Series or H8 Series, T-Series was renamed as T5 Series or T8 Series and S-Series was renamed as FT5 Series or FT8 Series. Refer to Fund-Specific Notes of the applicable Funds for further details.
TD Managed Assets Program Portfolios Each TD Managed Assets Program Portfolio is authorized to issue an unlimited number of units of multiple series that rank equally and are available for sale under a single simplified prospectus. The various series that may be offered by these funds are as described below.
Investor Series: Offered on a no-load basis to investors.
H5 Series: Offered on a no-load basis to investors who wish to receive a regular monthly cash flow from the Funds. Monthly distributions may consist of net income, net realized capital gains and/or a return of capital.
Premium Series: Offered on a no-load basis to large investors and others who make the required minimum investment, as determined by TDAM from time to time.
K5 Series: Offered on a no-load basis to large investors and others who make the required minimum investment, as determined by TDAM from time to time, and who wish to receive a regular monthly cash flow from the Funds. Monthly distribu -tions may consist of net income, net realized capital gains, and/or a return of capital.
e-Series: Offered on a no-load basis to investors who want to complete their transactions electronically.
D-Series: Offered on a no-load basis to investors who want to complete their transactions through TD Direct Investing, a division of TDWCI, or other discount brokers.
Advisor Series: Offered to investors who seek investment advice and want the option of transacting on a front-end load, back-end load, low-load or low-load-2 basis.
T5 Series: Offered to investors who seek investment advice; want the option of transacting on a front-end load, back-end load, low-load or low-load-2 basis; and who wish to receive a regular monthly cash flow from the Funds. Monthly distribu -tions may consist of net income, net realized capital gains and/or a return of capital.
F-Series: Offered to investors, through fee-based financial advisors or dealer-sponsored “wrap accounts”, and others who pay an annual fee to their dealer instead of transactional sales charges.
FT5 Series Offered to investors, through fee-based financial advisors and FT8 Series: or dealer-sponsored “wrap accounts”, who wish to receive
a regular monthly cash flow from the Funds. Monthly distributions may consist of net income, net realized capital gains, and/or a return of capital. This series may also be offered to other investors who pay an annual fee to their dealer instead of transactional sales charges.
W-Series: Offered to investors, through certain wealth management businesses of TD Bank Group, including certain divisions of TDWCI, or other dealers authorized by TDAM, who pay an annual fee to their dealer instead of transactional sales charges.
nNotes to the Interim Financial Report (Unaudited)
Semi-Annual Financial ReportJune 30, 2019 19

WT5 Series Offered to investors who wish to receive a regular and WT8 Series: monthly cash flow from the Funds, through certain wealth
management businesses of TD Bank Group, including “certain divisions of TDWCI, or other dealers authorized by TDAM, who pay an annual fee to their dealer instead of transactional sales charges. Monthly distributions may consist of net income, net realized capital gains, and/or a return of capital.
Effective October 25, 2018, H-Series, K-Series, T-Series, S-Series and WT-Series were renamed as H5 Series, K5 Series, T5 Series, FT5 Series and WT5 Series, respectively. Refer to Fund-Specific Notes of the applicable Funds for further details.
Units of TD Mutual Fund Trusts and TD Managed Assets Program Portfolios are redeemable at the option of the unitholder in accordance with their respective provisions of the Declarations of Trust or Trust Indenture. Units of these funds are issued or redeemed on a daily basis at the NAV per series unit next determined after the subscription, switch, conversion order or redemption request, respectively, is received by TDAM. Subscriptions and redemptions include units converted from one series to another series within a Fund in the Statements of Changes in Net Assets Attributable to Holders of Redeemable Units. However, conversions between series within a Fund are excluded from Proceeds from Issuances of Redeemable Units and Amounts Paid on Redemption of Redeemable Units in the Statements of Cash Flows.
6. Related Party Transactions
Capital TDAM, affiliates of TDAM, and/or other investment funds managed by TDAM may invest in units of the Funds from time to time. The investment made by related parties is disclosed in the Fund-Specific Notes if significant.
Management Fees (a) TD Mutual Fund Trusts
In consideration for the provision of management, distribution, and portfolio management services and oversight of any portfolio sub-advisory services provided to the TD Mutual Fund Trusts, TDAM receives an annual management fee in respect of certain series of these funds. The management fee is calculated and accrued on a daily basis for each applicable series based on the NAV of that series and paid monthly to TDAM.
No management fees are charged with respect to Private Series and O-Series units. Instead, unitholders in Private Series and O-Series units may be charged a fee directly by TDAM.
(b) TD Managed Assets Program Portfolios
In consideration for the provision of management, distribution and portfolio management services to the TD Managed Assets Program Portfolios, each series of these funds pay TDAM an annual management fee. The management fee is calculated and accrued on a daily basis for each series based on the NAV of that series and paid monthly to TDAM.
Where the TD Mutual Fund Trusts and TD Managed Assets Program Portfolios invest in any Underlying Funds, there are fees and expenses
payable by the Underlying Funds in addition to those paid by the Funds. However, there is no duplication of management fees paid to TDAM or its affiliates if the Funds invest in Underlying Funds that are managed by TDAM or its affiliates. TDAM may waive all or a portion of the management fees charged to the Funds, which may be discontinued at any time by TDAM at its discretion without notice to unitholders. Detailed information on the management fees of the Funds is provided in the Fund-Specific Notes.
Administration Fees (a) TD Mutual Fund Trusts
In consideration for paying certain operating expenses, TDAM is paid an annual administration fee with respect to certain series of the TD Mutual Fund Trusts. The administration fee includes recordkeeping and communi -cation costs, custodial costs, legal fees, audit fees, filing fees and bank charges. The administration fee is calculated and accrued on a daily basis for each applicable series based on the NAV of that series and paid monthly to TDAM. Annual administration fees for each series of these funds, where applicable, are provided in the Fund-Specific Notes.
The administration fee is payable in respect of Investor Series, H5 Series, H8 Series, D-Series, Advisor Series and T5 Series and T8 Series of the TD Mutual Fund Trusts, as applicable, other than the money market funds, TD Ultra Short Term Bond Fund, TD Short Term Bond Fund, TD Canadian Bond Fund, TD Global Conservative Opportunities Fund, TD Global Balanced Opportunities Fund, the Index funds and Advisor Series units of TD U.S. Equity Portfolio. The administration fee is also payable in respect of Premium Series and K-Series of TD Mutual Fund Trusts other than TD U.S. Money Market Fund, TD Short Term Bond Fund, TD Canadian Bond Fund, TD Income Advantage Portfolio, TD Canadian Core Plus Bond Fund, TD Corporate Bond Plus Fund and TD Global Conservative Opportunities Fund.
No administration fee is charged with respect to other series of the TD Mutual Fund Trusts.
(b) TD Managed Assets Program Portfolios
Except for the TD Managed ETF Portfolios, no administration fee is charged to the TD Managed Assets Program Portfolios. For the TD Managed ETF Portfolios, in consideration for paying certain operating expenses, TDAM is paid an annual administration fee with respect to D-Series of the Funds. The administration fee includes recordkeeping and communication costs, custodial costs, certain legal fees, audit fees, regulatory filing fees and bank charges. The administration fee is calculated and accrued on a daily basis based on the NAV of D-Series and paid monthly to TDAM. Annual administration fees for D-Series of the Funds are provided in the Fund-Specific Notes.
nNotes to the Interim Financial Report (Unaudited)
June 30, 2019 Semi-Annual Financial Report20

Operating Expenses Fund’s Independent Review Committee (“IRC”)
TDAM is responsible for management of the Funds’ investment portfolios, including the making of decisions relating to the investment of the Funds’ assets.
TDAM has established an IRC in respect of the Funds and the Underlying Funds managed by TDAM. The IRC acts as an impartial and independent committee to review and provide recommendations or, if appropriate, approvals respecting any transactions in which TDAM may have a conflict of interest. The IRC prepares, at least annually, a report of its activities for unitholders of the Funds.
The IRC has approved standing instructions to permit the Funds and/or the Underlying Funds managed by TDAM to enter into the following securities transactions:
(i) trades in securities of TD or any affiliate or associate thereof; (ii) investments in the securities of an issuer where TD Securities Inc.,
TDWCI, or any other affiliate of TDAM (a “Related Dealer”) acted as an underwriter during the distribution of such securities and the 60-day period following the completion of the distribution of the underwritten securities;
(iii) purchases or sales of securities of an issuer from or to another investment fund or discretionary managed account managed by TDAM; and
(iv) purchases of securities from or sales of securities to a Related Dealer, where it acted as principal.
Investments in securities of TD, interests in Underlying Funds managed by TDAM, or investments in any affiliates that were held by the Funds at the end of the reporting period are disclosed in the Schedule of Investment Portfolio and/or the Fund-Specific Notes.
The compensation and relevant expenses of IRC members are allocated among the investment funds managed by TDAM and disclosed in the Statements of Comprehensive Income as Independent Review Committee Fees.
(a) TD Mutual Fund Trusts
TDAM pays all of the operating expenses with respect to O-Series units of the TD Mutual Fund Trusts.
Private Series and Private-EM Series of the TD Mutual Fund Trusts and Advisor Series of TD U.S. Equity Portfolio bear their respective pro rata share of the operating expenses which are common to the operation of all series of these funds as well as those expenses which are attributable solely to that series (which may be payable to TDAM or its affiliates), including IRC costs, recordkeeping and communication costs, custodial, legal, audit and filing fees, bank charges, borrowing costs, all taxes, costs relating to compliance with any new governmental and regulatory requirements, and new types of costs or expenses.
For other series of the TD Mutual Fund Trusts, TDAM pays all of the operating expenses (including services provided by TDAM or its affiliates), other than costs and expenses associated with: all taxes; borrowing; the IRC; compliance with any new governmental and regulatory requirements, and new types of costs or expenses.
(b) TD Managed Assets Program Portfolios
Except for the TD Managed ETF Portfolios, all operating expenses of the TD Managed Assets Program Portfolios (including for services provided by TDAM or its affiliates) are paid for by TDAM, including cost of the IRC, recordkeeping and communication costs, custodial, legal, audit and filing fees, bank charges, borrowing costs, and all taxes on such costs.
For the TD Managed ETF Portfolios, TDAM pays certain operating expenses. Each TD Managed ETF Portfolio is responsible for paying expenses associated with borrowing, the IRC, compliance with any new governmental and regulatory requirements, new types of costs or expenses, and all taxes on such costs and expenses.
Taxes on Expenses The Funds also pay applicable goods and services tax and harmonized sales tax at a blended rate to TDAM on management fees, administration fees and certain operating expenses based on the province or territory of residence of the investors in each series of the Funds, which are included with the respective expense in the Statements of Comprehensive Income.
Waived Expenses TDAM, at its discretion, may waive or absorb a portion of the expenses otherwise payable by the Funds. These waivers or absorptions may be terminated at any time without notice to unitholders. The amount of expenses waived or absorbed is disclosed in the Statements of Comprehensive Income as Waived Expenses, where applicable.
The Accrued Liabilities in the Statements of Financial Position represents the amount of management fees, administration fees and operating expenses (including applicable taxes) payable to TDAM by the Funds as at the reporting period end.
Brokerage Commissions and Soft Dollars (a) TD Mutual Fund Trusts
Brokerage commissions (including other transaction costs) paid on securities transactions and amounts paid to related parties of TD for brokerage services provided to these funds for the reporting periods ended June 30, 2019 and 2018, where applicable, are disclosed in the Fund-Specific Notes.
Client brokerage commissions are used as payment for order execution services and/or research services. The portfolio advisers or TDAM may select brokers including its affiliates, who charge a commission in excess of that charged by other brokers (“soft dollars”) if they determine in good faith that the commission is reasonable in relation to the order execution and research services utilized.
For debt instruments traded in the over the counter markets where client brokerage commissions are not charged, soft dollars or client brokerage commissions are not generated. For equities or other securities where client brokerage commissions are charged, the soft dollar portion of the amount paid or payable for goods and services other than order execution for the TD Mutual Fund Trusts is not generally ascertainable. Any ascertainable soft dollar value received under the soft dollar arrangement entered into by the portfolio advisers or TDAM, where applicable, is disclosed in the Fund-Specific Notes.
nNotes to the Interim Financial Report (Unaudited)
Semi-Annual Financial ReportJune 30, 2019 21

(b) TD Managed Assets Program Portfolios
Except for the TD Managed ETF Portfolios, these funds did not incur any brokerage commissions for the reporting periods ended June 30, 2019 and 2018 to execute transactions in the Underlying Funds, and accordingly did not receive any investment or research services from brokers in exchange for commissions paid by these funds. For the TD Managed ETF Portfolios, brokerage commissions paid on the purchase or sale of units of the underlying TD ETFs and amounts paid to related parties of TD for brokerage services provided to these funds for the reporting periods ended June 30, 2019 and 2018, where applicable, are disclosed in the Fund-Specific Notes.
Certain of the Underlying Funds have incurred brokerage commissions, a portion of which may have been received by the Underlying Funds’ investment advisers in the form of investment or research services (“soft dollars”). Such amounts for each of the TDAM managed Underlying Funds are disclosed in the Underlying Funds’ financial statements, where ascertainable.
7. Taxation
The Funds (except for the TD Managed ETF Portfolios) qualify or intend to qualify as mutual fund trusts under the Income Tax Act (Canada) (“Tax Act”), unless otherwise disclosed in the Fund-Specific Notes. TD Managed ETF Portfolios qualify as unit trusts under the Tax Act. All or substantially all of the net investment income and sufficient amounts of net capital gains realized in any taxation year are distributed to unitholders such that no income tax is payable by the Funds, except that in certain circumstances, a Fund that is not a mutual fund trust may become liable to pay alternative minimum tax under the Tax Act. As a result of the distribution, the Funds have determined that they are in substance not taxable and therefore, do not record income taxes in the Statements of Comprehensive Income nor do they recognize any deferred tax assets or liabilities in the Statements of Financial Position. The Funds’ capital and/or non-capital losses carry forward, where applicable, are provided in the Fund-Specific Notes. Capital losses have no expiry. Non-Capital losses can be carried forward for up to twenty years.
The Funds may incur withholding taxes imposed by certain countries on investment income and capital gains. Such income and gains are recorded on a gross basis and the related withholding taxes are reported as Tax Reclaims (Withholding Taxes) in the Statements of Comprehensive Income.
8. Financial Risk Management
Financial Risk Factors Each Fund is exposed to a variety of financial risks: these may include market risk (including interest rate risk, currency risk, and other price risk), credit risk, liquidity risk and concentration risk. All investments present a risk of loss of capital.
TDAM seeks to reduce financial risks by employing and overseeing professional and experienced portfolio advisers that regularly monitor the Funds’ positions and market events and diversify investment portfolios within the constraints of each Fund’s investment objectives, investment strategies and applicable TDAM policies and procedures (collectively referred to as “Investment Restrictions”).
If a Fund invests in Underlying Funds, TDAM seeks to reduce financial risks by diversifying investments across the three main asset classes: money market investments for safety, bonds for income and equity investments for growth, where applicable. Since different types of investments tend to move independently from one another, positive performance in one asset class may help to offset negative performance in another, thereby reducing volatility and overall risk in the long-term.
The Funds are managed in accordance with their respective Investment Restrictions.
(a) Market Risk (i) Interest Rate Risk
Interest rate risk arises from the possibility that changes in interest rates will affect the future cash flows or the fair values of interest-bearing investments.
A Fund’s exposure to interest rate risk is concentrated in its investments in debt instruments (such as bonds and debentures) and interest rate derivative instruments, if any. Short-term investments, currencies and other assets and liabilities are short-term in nature and/or non-interest bearing and not subject to significant amounts of risk due to fluctuations in the prevailing levels of market interest rates.
If a Fund invests in Underlying Funds, it is exposed to indirect interest rate risk to the extent of the interest-bearing financial instruments held by the Underlying Funds. A Fund’s direct exposure to interest rate risk, where significant, is disclosed in the Fund-Specific Notes.
(ii) Currency Risk
A Fund may hold financial instruments denominated in currencies other than its functional currency. It is therefore exposed to currency risk, as the value of the financial instruments denominated in other currencies will fluctuate due to changes in the foreign exchange rates of those currencies in relation to the Fund’s functional currency.
Where a Fund invests in any Underlying Funds, it is exposed to indirect currency risk in the event that the Underlying Funds invest in financial instruments that are denominated in a currency other than the Underlying Funds’ functional currency.
A Fund and/or its Underlying Funds may enter into foreign exchange forward contracts for hedging purposes to reduce its foreign currency exposure or to establish exposure to foreign currencies.
A Fund’s direct exposure to currency risk (including monetary and non-monetary instruments), where significant, is disclosed in the Fund-Specific Notes. Where a Fund invests in a single Underlying Fund, the direct and indirect exposure to currency risk (including monetary and non-monetary instruments), where significant, is disclosed in the Fund-Specific Notes.
nNotes to the Interim Financial Report (Unaudited)
June 30, 2019 Semi-Annual Financial Report22

(iii) Other Price Risk
Other price risk is the risk that securities will fluctuate in value because of changes in market prices (other than those arising from interest rate risk or currency risk). TDAM seeks to reduce this risk through its Investment Restrictions.
In determining each Fund’s sensitivity impact from exposure to other price risk, a historical beta may be used when applicable. Historical beta, a measure of the sensitivity of a fund’s returns to market returns, is generally derived from comparing 36 months of returns between a fund and its benchmark. As such, beta inherently includes effects previously reflected in the interest rate risk and currency risk disclosures. Historical beta may not be representative of future beta.
Where a Fund invests in a single Underlying Fund, it is exposed to indirect other price risk in the event that the Underlying Fund invests in equity securities. As a result, other price risk, reflecting this indirect exposure, is provided in the Fund-Specific Notes.
Where a Fund invests in several Underlying Funds, its exposure to other price risk includes all investments in Underlying Funds. A Fund’s direct exposure to other price risk, where applicable, is disclosed in the Fund-Specific Notes.
Except for written options and equities sold short, the maximum risk resulting from financial instruments is the fair value of the financial instruments as presented in the Statements of Financial Position. Possible losses from written options and equities sold short can be unlimited.
(b) Credit Risk Credit risk is the risk that one party to a financial instrument will cause a financial loss to the other party by failing to discharge an obligation. Where applicable, a Fund’s main credit risk concentration is in debt instruments and derivative instruments it holds. A Fund’s exposure to credit risk is the risk that an issuer of debt instruments or a counterparty to derivative instruments will be unable to pay amounts in full when due. All transactions in listed securities are settled or paid for upon delivery using approved brokers. The risk of default with a broker is considered minimal, as delivery of securities sold is only made once the broker has received payment. Payment is made on a purchase once the securities have been received by the broker. The trade will fail if either party fails to meet its obligation.
A Fund may be exposed to credit risk from the use of counterparties for foreign exchange forward contracts. Where applicable, this risk is minimized by:
(i) using counterparties with a minimum credit rating of A by S&P Global Ratings (“S&PGR”) or an equivalent rating from another recognized credit rating agency;
(ii) limiting the term of the foreign exchange forward contracts to a maximum of 365 days; and,
(iii) limiting the mark-to-market exposure to any one counterparty to 10 percent of the portfolio value.
A Fund may also be exposed indirectly to credit risk if it invests in Underlying Funds in the event that the Underlying Funds invest in debt instruments and derivatives.
The Funds and their Underlying Funds managed by TDAM only buy and hold short-term notes with a minimum of R-1 Low credit rating by DBRS Limited or an equivalent rating from another recognized credit rating agency.
A Fund’s direct exposure to short-term and/or debt instruments, by ratings categories, where applicable, is disclosed in the Fund- Specific Notes.
The TD Mutual Fund Trusts and the Underlying Funds held by the Funds may also engage in securities lending transactions. For these funds that are managed by TDAM, the securities lending transactions are with counterparties that have a minimum credit rating of A by S&PGR or an equivalent rating from another credit agency. The value of cash or securities held as collateral by these funds in connection with these transactions is at least 102 percent of the fair value of the securities loaned. The collateral and loaned securities are marked to market on each business day. The aggregate fair value of the securities loaned, together with repurchase transactions, are limited to 50 percent of each fund’s NAV at the time these funds enter into the transactions. Information about the fair values of securities lent and collateral held and securities lending income earned, where applicable, is disclosed in the Fund-Specific Notes.
In the TD Managed Assets Program Portfolios, where applicable, the portfolio adviser reviews these funds’ credit positions as part of the investment management process.
(c) Liquidity Risk Liquidity risk is defined as the risk that a fund may not be able to settle or meet its obligations on time or at a reasonable price. A fund’s exposure to this risk is concentrated in the daily cash redemptions of redeemable units. The Funds primarily invest in securities that are traded in active markets and can be readily disposed of. In addition, the Funds retain sufficient cash and cash equivalents to maintain liquidity, and have the ability to borrow up to 5 percent of their respective NAV for the purpose of funding redemptions.
All non-derivative financial liabilities, other than redeemable units outstanding, are due in less than 3 months.
(d) Concentration Risk Concentration risk arises as a result of the concentration of exposures within the same category, whether it is geographical location, security type or industry sector. A Fund’s concentration risk is disclosed in the Fund-Specific Notes.
nNotes to the Interim Financial Report (Unaudited)
Semi-Annual Financial ReportJune 30, 2019 23

9. Capital Risk Management
Units issued and outstanding represent the capital of the Funds. The Funds do not have any specific capital requirements on the subscription and redemption of units, other than certain minimum subscription requirements. Changes in the Funds’ capital during the reporting periods are reflected in the Statements of Changes in Net Assets Attributable to Holders of Redeemable Units. TDAM is responsible for managing the capital of the Funds in accordance with each Fund’s investment objec -tives and for managing liquidity in order to meet redemption requests.
10. Comparative Financial Information
Where applicable, certain comparative figures in the Statements of Comprehensive Income have been reclassified. Amounts related to Net Gain (Loss) on Derivatives, including the derivatives’ Net Realized Gain (Loss) and Net Change in Unrealized Appreciation/Depreciation, have been reclassified into Net Realized Gain (Loss) and Net Change in Unrealized Appreciation/Depreciation, respectively, under Net Gain (Loss) on Investments and Derivatives. Amounts related to Income Distributions and Capital Gain Distributions from Underlying Funds have been aggregated into Distributions from Underlying Funds. For these reclassifications, there was no impact on the Increase (Decrease) in Net Assets Attributable to Holders of Redeemable Units.
If applicable, the most recent financial statements of the Underlying Funds managed by TDAM are available, without charge, by writing to TD Asset Management Inc., P.O. Box 100, 66 Wellington Street West, TD Bank Tower, Toronto-Dominion Centre, Toronto, Ontario, M5K 1G8, or by e-mail to [email protected], or by visiting our website at www.tdassetmanagement.com or the SEDAR website at www.sedar.com
nNotes to the Interim Financial Report (Unaudited)
June 30, 2019 Semi-Annual Financial Report
Currency codes used throughout the report:
Currency Code
Description
Currency Code
Description
Currency Code
Description
AED UAE Dirham HKD Hong Kong Dollar PHP Philippine Peso
ARS Argentine Peso HUF Hungarian Forint PKR Pakistan Rupee
AUD Australian Dollar IDR Indonesian Rupiah PLN Polish Zloty
BRL Brazilian Real ILS Israeli Shekel QAR Qatari Riyal
CAD/C$ Canadian Dollar INR Indian Rupee RON Romanian Leu
CHF Swiss Franc JOD Jordanian Dinar RUB Russian Ruble
CLP Chilean Peso JPY Japanese Yen SEK Swedish Krona
CNY/CNH China Renminbi KRW South Korean Won SGD Singapore Dollar
COP Colombian Peso LKR Sri Lanka Rupee THB Thai Baht
CZK Czech Koruna MAD Moroccan Dirham TRY Turkish Lira
DKK Danish Krone MXN Mexican Peso TWD New Taiwan Dollar
EGP Egyptian Pound MYR Malaysian Ringgit USD/US$ United States Dollar
EUR Euro NOK Norwegian Krone ZAR South African Rand
GBP British Pound NZD New Zealand Dollar
24

June 30, 2019 Semi-Annual Financial Report
Source: London Stock Exchange Group plc and its group undertakings (collectively, the “LSE Group”). © LSE Group 2019. FTSE Russell is a trading name of certain of the LSE Group companies. “FTSE®”, “Russell®”, and “FTSE Russell®” are trade marks of the relevant LSE Group companies and are used by any other LSE Group company under license. “TMX®” is a trade mark of TSX, Inc. and used by the LSE Group under license. All rights in the FTSE Russell indexes or data vest in the relevant LSE Group company which owns the index or the data. Neither LSE Group nor its licensors accept any liability for any errors or omissions in the indexes or data and no party may rely on any indexes or data contained in this communication. No further distribution of data from the LSE Group is permitted without the relevant LSE Group company’s express written consent. The LSE Group does not promote, sponsor or endorse the content of this communication.
TD Mutual Funds, TD Pools and the TD Managed Assets Program portfolios are managed by TD Asset Management Inc., a wholly-owned subsidiary of The Toronto-Dominion Bank and are available through authorized dealers.
TD Exchange-Traded Funds are managed by TD Asset Management Inc., a wholly-owned subsidiary of The Toronto-Dominion Bank.
TD Greystone Asset Management (“TD Greystone”) represents Greystone Managed Investments Inc., a wholly-owned subsidiary of Greystone Capital Management Inc. (“GCMI”). GCMI, TDAM USA Inc. and Epoch Investment Partners Inc. are affiliates of TD Asset Management Inc. TD Asset Management operates through TD Asset Management Inc. in Canada and through TDAM USA Inc. in the United States. All entities are affiliates and wholly-owned subsidiaries of The Toronto-Dominion Bank.
All trademarks are the property of their respective owners.
® The TD logo and other trade-marks are the property of The Toronto-Dominion Bank.
25


