TDL syngas sensor for in situ monitoring of CO, CH 4 , CO 2 ,& H 2 O in an engineering‐scale high‐pressure coal gasifier Ronald K. Hanson, Ritobrata Sur, Kai Sun, Jay B. Jeffries High Temperature Gasdynamics Laboratory, Stanford University NETL's Crosscutting Research Review Meeting May 19‐23, 2014, Pittsburgh, PA Vision for gasifier sensing Absorption sensor fundamentals NCCC gasifier facility Stanford optics design Results for CO, CH 4 , CO 2 , & H 2 O Summary and further work Gasifier in Wilsonville, Alabama USA Supported by DOE NETL – Dr. Susan Maley
Transcript
TDL syngas sensor for in situmonitoring of CO, CH4, CO2, & H2O in an engineering‐scale high‐pressure coal gasifier
Ronald K. Hanson, Ritobrata Sur, Kai Sun, Jay B. JeffriesHigh Temperature Gasdynamics Laboratory, Stanford University
NETL's Crosscutting Research Review Meeting May 19‐23, 2014, Pittsburgh, PA
Vision for gasifier sensing Absorption sensor fundamentals NCCC gasifier facility Stanford optics design Results for CO, CH4, CO2, & H2O Summary and further work
Gasifier in Wilsonville, Alabama USA
Supported by DOE NETL – Dr. Susan Maley
2
Stanford’s Vision for TDL Sensing in IGCC
X
XCoal
Oxygen or Steam
Oxygen/CoalRatio Control
Sensor for T & SyngasComposition
3 4
Fuel/air Ratio Control1
Gasifier
ReactorCore
Quench
2SyngasCleanup Gas Turbine
X
XCoal
Oxygen or Steam
Oxygen/CoalRatio Control
Sensor for T & SyngasComposition
3 4
Fuel/air Ratio Control1
Gasifier
ReactorCore
Quench
ReactorCore
Quench
2SyngasCleanup Gas Turbine
Sensor for control signals to optimize gasifier output and gas turbine input 1st generation laser absorption sensor for CO, CO2, CH4, and H2O
Stanford sensor tested in a pilot-scale (1 T/day coal) gasifier (U Utah 2009-2012)
2nd generation CO, CO2, CH4, and H2O sensor developed Tested in an engineering-scale (30,000 lb/hr syngas) gasifier at NCCC
(December 2012 & March 2014)
Vision:
Absorption sensing: How does it work?
Absorption Fundamentals: Species
Scanned-wavelength line-of-sight direct absorption
Beer-Lambert relation
Spectral absorption coefficient
Wavelength-scanning yields
exp( )t
o
I k LI
PPTTSk ii ),,()(
3
Absorption of monochromatic light
( ) ik L d S T P L
Integrated absorbance
Two Absorption Sensor Strategies:Direct Absorption (DA)
WMS
Direct Absorption
Gas sample
Io It
Direct absorption: Simple, if absorption is strong and isolated WMS: More sensitive especially for small signals (near zero baseline)
WMS with TDLs improves noise rejection Normalized WMS, e.g. 2f/1f cancels scattering losses!
What wavelengths for syngas detection?
Injection current tuning
+ Injection current modulation @f
i’
i 0.4 0.5 0.6 0.7
0.00
0.25
0.50
0.75
Abs
orba
nce
W avelength (re lative cm -1)
D irect absorption lineshape
0.4 0.5 0.6 0.7 0.8 0.9 1.00.0
0.1
0.2
0.3 Direct Absorption Scan
Lase
r Int
ensi
ty S
igna
l
T ime(ms)
Baselinefit
for Io
Lockin@1f, 2f
-0.02
0.00
0.02
0.04
WMS-2f lineshapeNor
mal
ized
2f s
igna
l
Wavelength (relative cm-1)0.4 0.5 0.6 0.7
0
2
4
6
8
WMS Scan
WM
S S
igna
l
Time (ms)0.4 0.5 0.6 0.7 0.8 0.9 1.0
& Wavelength Modulation Spectroscopy (WMS)
4
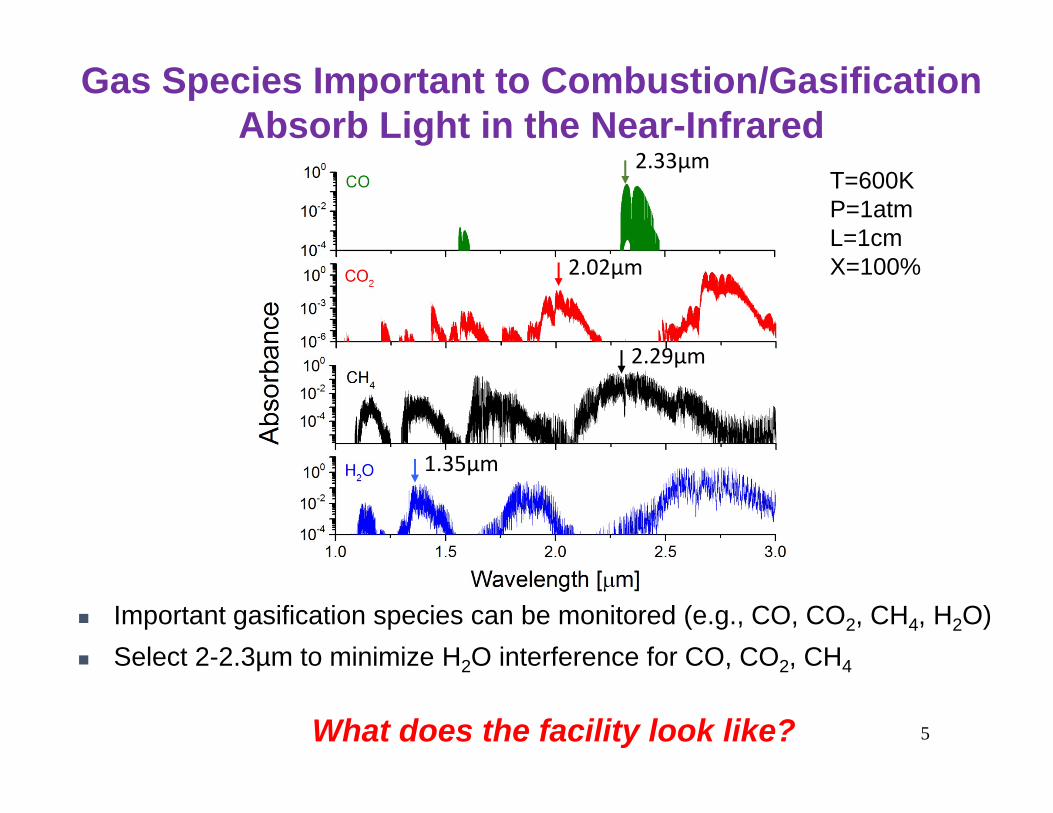
Gas Species Important to Combustion/Gasification Absorb Light in the Near-Infrared
Important gasification species can be monitored (e.g., CO, CO2, CH4, H2O) Select 2-2.3µm to minimize H2O interference for CO, CO2, CH4
What does the facility look like? 5
T=600KP=1atmL=1cmX=100%
2.33µm
2.02µm
2.29µm
1.35µm
6
NCCC Gasifier Large-Scale DoE Demo
Instrumentation shelter
NCCC transport gasifier based on a circulating fluidized bed conceptGoal:Laser absorption in situ measurements of syngas products composition
Where is sensor located?
~100 m
TDL sensor monitors syngas flow 30m downstream of the PCD Flow laden with particulate (< 0.1% transmission) at sensor location
How do we measure 4 species?
TDL Sensor Location and Syngas conditions
7
Transport gasifier
Particulate control device (PCD)
Syngas coolerCyclone
Burner
Nominal conditions at TDL sensorT~600 KP~220 psig (15 atm)Gas composition
H2O 6-10%CO2 6-10%CO ~12%H2 ~ 8%CH4 ~ 1%Minor species <1%
(e.g., NH3, H2S, SO2…)N2 Balance
LDetection Strategy:Time Demultiplexing
Wavelength Scanned WMS-2f with 1f Normalization
0 0.5 1 1.5 2 2.5 3 3.5 4 4.5 5
x 10-3
-0.5
0
0.5
1
1.5
2
2.5
0 0.5 1 1.5 2 2.5 3 3.5 4 4.5 5
x 10-3
-0.5
0
0.5
1
1.5
2
2.5
0 0.5 1 1.5 2 2.5 3 3.5 4 4.5 5
x 10-3
-0.5
0
0.5
1
1.5
2
2.5
0 0.5 1 1.5 2 2.5 3 3.5 4 4.5 5
x 10-3
-0.5
0
0.5
1
1.5
2
2.5
0ms 5ms 10ms 15ms 20ms
Detector signal
7393 7394 73950.0
0.5
1.0
1.5
2f/1
f [un
itles
s]
Frequency [cm-1]
Measurement Best fit
Lock‐in @ 1f and 2f
1f Normalized WMS‐2f
@ f
0‐5m
s
5‐10
ms
10‐15m
s
15‐20m
s
Separate laser for each species Time multiplexing (each laser takes a turn)
4 species in 20ms w/ one detector Wavelength scanned 1f‐normalized WMS‐2f
Enables measurements in opaque flows
Unique Stanford detection strategy
200Hz
10kHz
H2O 1.4m CO 2.35m CO2 2m CH4 2.29m
8
Experiment control House (DAQ, laser
controller)
BNC
Detector pow
er sup
ply
DB 25
Detector gain sw
itch
Four laser controller cables
DB 25
Lasers
Fibers
Connections of Stanford Sensor to NCCC Facility
Electronics in the control house ~30m to measurement location Lasers near measurement location (~ 2m away) Sensor operated remotely (alignment, detector gain, laser scanning)
Next: Further details of optical system 9
Redundant valves and windows
Transmitter optics
Window pair
Valve pair
Receiver optics
Valve pair
Window pair Syngas flow
Optics Design:Multiplex Four Lasers
Fiber bundle delivers light from four lasers Optics combine all beams onto common line-of-sight w/ only one detector Large beam size reduces beam steering noise
10
2 cm 1.5 cm
Fiberbundle
0.2m Pitch sideCatch side
5cm
Insulation5m
Next: Data from gasifier warm-up
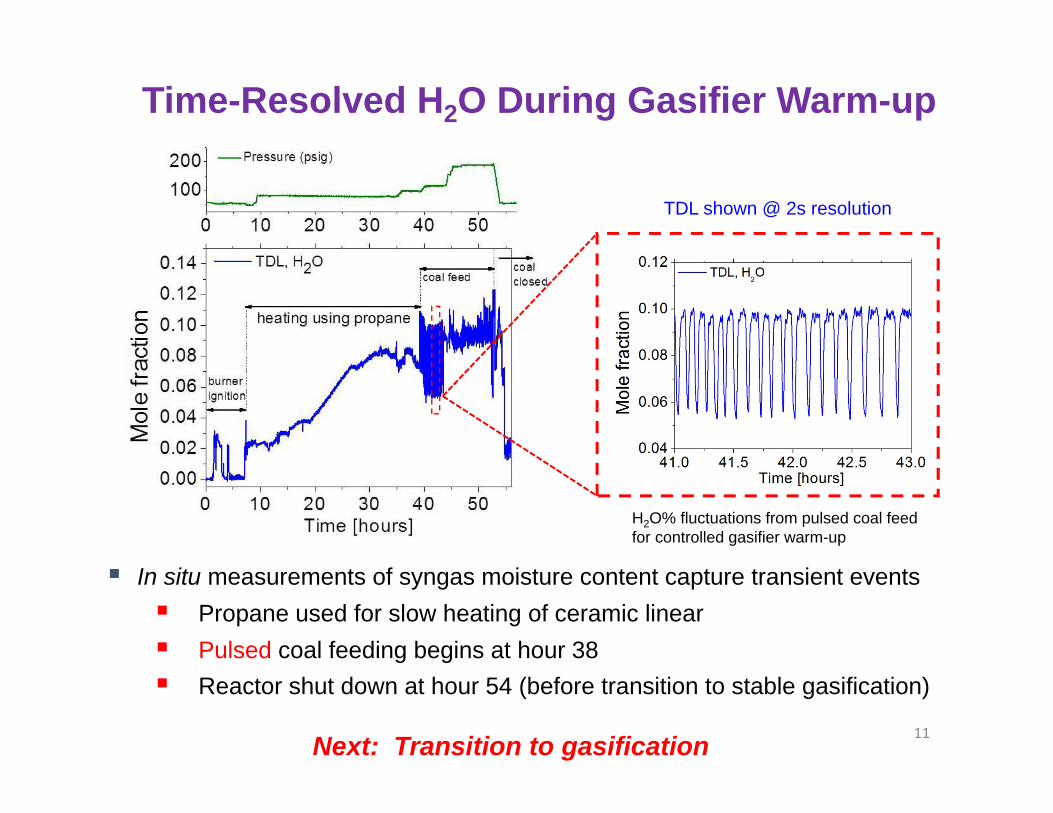
Time-Resolved H2O During Gasifier Warm-up
In situ measurements of syngas moisture content capture transient events Propane used for slow heating of ceramic linear Pulsed coal feeding begins at hour 38 Reactor shut down at hour 54 (before transition to stable gasification)
TDL shown @ 2s resolution
H2O% fluctuations from pulsed coal feed for controlled gasifier warm-up
11Next: Transition to gasification
H2O and CO2 During Transition to Gasification
6840 6860 6880
5
10
15
Mol
e fra
ctio
n [%
]
Time [mins]
GC : CO2CO2
H2O
CO2 fluctuations damped when reactor transitions to gasification GC time resolution does not capture transients, only average mole fraction
P = 120 psig
Onset of gasification
12
Rapid jump in CO and CH4 at onset of gasification GC data have large time lag (shifted here by 20 minutes for comparison with laser) GC data also have poor time resolution (note slow CO response vs laser)
6850 6900 69500
1
2
3
4
5
6
Pressurization & coal increased
Mol
e fra
ctio
n [%
]
Time [mins]
GC:CH42xCH4
GC : COCO
Onset of gasification
Sensor Captures Onset of Gasification via CO & CH4
13Next: Data from “Stable Gasification”
Four Species Measurements After Gasifier “Stable”
7320 7340 73600
3
6
9
12
15
P = 220 psig, T = 630 K
GC: CH4
GC: CO2
GC: CO
CO2
CH4
H2O
Mol
e Fr
actio
n [%
]
Time [mins]
CO
Laser sensor provides simultaneous CO, CH4, CO2, and H2O Correlation of CO with CH4 confirms that fluctuations are real GC time resolution does not capture temporal fluctuations
14Next: Long unattended monitoring
Continuous, stable measurements for 18 days (terminated by NCCC) Periodic liquid H2O samples taken from syngas agree with laser sensor Laser sensor show small fluctuations in the H2O mole fraction
15
Are sensor fluctuations real or noise?
18 Days of H2O Unattended Monitoring
H2O Sensor Captures Fluctuations in Gasifier Reactor
16
H2O fluctuation tracks the reactor thermocouple (note small T) H2O fluctuation tracks the reactor coal feed pulse Laser sensor captures small H2O change (mole fraction ~ 0.1%)
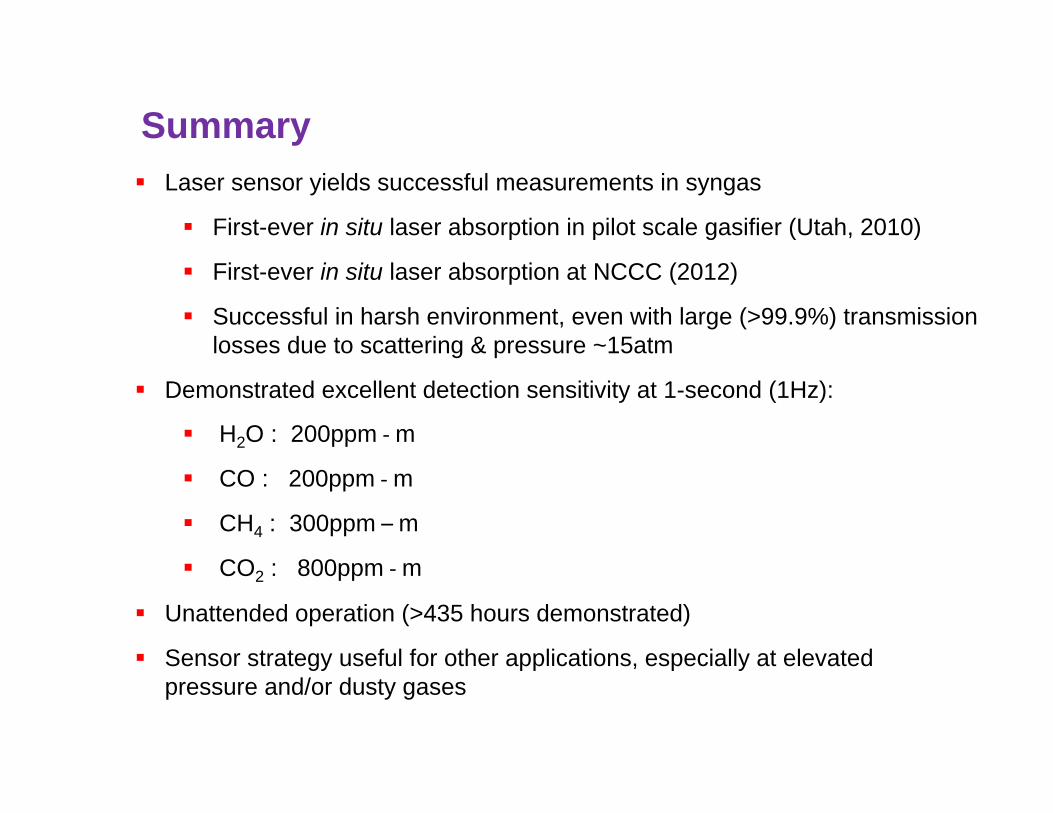
Laser sensor yields successful measurements in syngas
First-ever in situ laser absorption in pilot scale gasifier (Utah, 2010)
First-ever in situ laser absorption at NCCC (2012)
Successful in harsh environment, even with large (>99.9%) transmission losses due to scattering & pressure ~15atm
Demonstrated excellent detection sensitivity at 1-second (1Hz):
H2O : 200ppm ‐ m
CO : 200ppm ‐ m
CH4 : 300ppm – m
CO2 : 800ppm ‐ m
Unattended operation (>435 hours demonstrated)
Sensor strategy useful for other applications, especially at elevated pressure and/or dusty gases
Summary
Add additional species important to specific application, for example
NH3, H2S, SO2, ….
Improve data processing
Provide real time readout compatible with facility record
Provide web-based monitoring for unattended operation
Refine optical engineering and repackage in smaller containers
Recommendations for future work
Acknowledgements DoE, NETL: Dr. Susan Maley and Mr. Charles Miller
National Carbon Capture Center, Southern Company Services, Mr. John Socha