83
Teacher Attrition and Mobility Results from the Teacher Follow-up Survey,2000–01 E.D.Tabs U.S. Department of Education Institute of Education Sciences NCES 2004–301
Teacher Attrition and MobilityResults from the TeacherFollow-up Survey, 2000–01
E.D.TabsU.S. Department of EducationInstitute of Education SciencesNCES 2004–301
Teacher Attrition and MobilityResults from the TeacherFollow-up Survey, 2000–01
E.D.Tabs
August 2004
U.S. Department of EducationInstitute of Education SciencesNCES 2004–301
Michael T. LuekensDeanna M. LyterErin E. FoxEducation Statistics Services Institute/American Institutes for Research
Kathryn ChandlerProject OfficerNational Center for Education Statistics
Schools and Staffing Survey
SASS
ii Teacher Attrition and Mobility: Results from the Teacher Follow-up Survey, 2000–01
U.S. Department of EducationRod PaigeSecretary
Institute of Education SciencesGrover J. WhitehurstDirector
National Center for Education StatisticsRobert LernerCommissioner
The National Center for Education Statistics (NCES) is the primary federal entity for collecting, analyzing, and reportingdata related to education in the United States and other nations. It fulfills a congressional mandate to collect, collate, ana-lyze, and report full and complete statistics on the condition of education in the United States; conduct and publishreports and specialized analyses of the meaning and significance of such statistics; assist state and local education agen-cies in improving their statistical systems; and review and report on education activities in foreign countries.
NCES activities are designed to address high priority education data needs; provide consistent, reliable, complete, andaccurate indicators of education status and trends; and report timely, useful, and high quality data to the U.S. Departmentof Education, the Congress, the states, other education policymakers, practitioners, data users, and the general public.
We strive to make our products available in a variety of formats and in language that is appropriate to a variety of audi-ences. You, as our customer, are the best judge of our success in communicating information effectively. If you have anycomments or suggestions about this or any other NCES product or report, we would like to hear from you. Please directyour comments to:
National Center for Education StatisticsInstitute of Education SciencesU.S. Department of Education1990 K Street NWWashington, DC 20006–5651
August 2004
The NCES World Wide Web Home Page address is: http://nces.ed.govThe NCES World Wide Web Electronic Catalog is: http://nces.ed.gov/pubsearch
Suggested Citation
Luekens, M.T., Lyter, D.M., and Fox, E.E. (2004). Teacher Attrition and Mobility: Results from the Teacher Follow-up Survey,2000–01 (NCES 2004–301). U.S. Department of Education, National Center for Education Statistics. Washington, DC: U.S.Government Printing Office.
For ordering information on this report, write:
U.S. Department of EducationED PubsP.O. Box 1398Jessup, MD 20794–1398
Call toll free 1–877–4ED–Pubs; or order online at http://www.edpubs.org
Content Contact:Kerry Gruber(202) [email protected]
iiiAcknowledgments
Many people contributed to the production of this report, and the authors would like to thank several in partic-ular. At the American Institutes for Research, Education Statistics Services Institute, special thanks goes to GregStrizek for overseeing much of the project, Dan McGrath, Sarah Kaffenberger, Erica McKnight, Perry Grossman,Mike Planty, and Gerard Rainville for editing and review, and Heather Block for graphic design work.
At the National Center for Education Statistics, Kathryn Chandler, Kerry Gruber, Stephen Broughman, andLynn Zhao of the Elementary/Secondary and Library Studies Division reviewed several drafts of the report andprovided valuable feedback and guidance. Marilyn McMillen Seastrom, Chief Statistician for NCES, was the sta-tistical standards reviewer for this report. Their suggestions improved the final product.
The tables in this report were generated by the U.S. Census Bureau under the direction of Steven Tourkin,Demographic Surveys Division, and Howard McGowan, Education Surveys Programming Branch. JenniferPeterson produced many of the tables and was a great help in responding to questions. The authors appreciatetheir hard work and attention to detail.
Finally, the authors wish to thank the respondents to the Teacher Follow-up Survey. This report would not bepossible without their participation.
The draft manuscript of this report was reviewed within NCES by Tai Phan, Chris Chapman, and Kristin Perry.
Acknowledgments

iv Teacher Attrition and Mobility: Results from the Teacher Follow-up Survey, 2000–01
vTable of Contents
Acknowledgments . . . . . . . . . . . . . . . . . . . . . . . . . . . . . . . . . . . . . . . . . . . . . . . . . . . . . . . . . . . .iii
List of Tables . . . . . . . . . . . . . . . . . . . . . . . . . . . . . . . . . . . . . . . . . . . . . . . . . . . . . . . . . . . . . . .vii
Summary . . . . . . . . . . . . . . . . . . . . . . . . . . . . . . . . . . . . . . . . . . . . . . . . . . . . . . . . . . . . . . . . . .1
Introduction . . . . . . . . . . . . . . . . . . . . . . . . . . . . . . . . . . . . . . . . . . . . . . . . . . . . . . . . . . . . . .1
Data Source . . . . . . . . . . . . . . . . . . . . . . . . . . . . . . . . . . . . . . . . . . . . . . . . . . . . . . . . . . . . . . .1
Organization of the Report . . . . . . . . . . . . . . . . . . . . . . . . . . . . . . . . . . . . . . . . . . . . . . . . . . .2
Selected Findings . . . . . . . . . . . . . . . . . . . . . . . . . . . . . . . . . . . . . . . . . . . . . . . . . . . . . . . . . . .3
Who Is Most Likely to Move or Leave? . . . . . . . . . . . . . . . . . . . . . . . . . . . . . . . . . . . . . . . . . . . . . . . . . . . . . . . .3
Why Do Teachers Move or Leave? . . . . . . . . . . . . . . . . . . . . . . . . . . . . . . . . . . . . . . . . . . . . . . . . . . . . . . . . . . .4
Where Do These Teachers Go When They Move or Leave? . . . . . . . . . . . . . . . . . . . . . . . . . . . . . . . . . . . . . . . . .4
Who Is Most Likely to Move or Leave? . . . . . . . . . . . . . . . . . . . . . . . . . . . . . . . . . . . . . . . . . . . . .7
Why Do Teachers Move or Leave? . . . . . . . . . . . . . . . . . . . . . . . . . . . . . . . . . . . . . . . . . . . . . . .15
Where Do Teachers Go When They Move or Leave? . . . . . . . . . . . . . . . . . . . . . . . . . . . . . . . . . .23
Appendix A: Standard Error Tables . . . . . . . . . . . . . . . . . . . . . . . . . . . . . . . . . . . . . . . . . . . . . .27
Appendix B: Technical Notes . . . . . . . . . . . . . . . . . . . . . . . . . . . . . . . . . . . . . . . . . . . . . . . . . . .45
Appendix C: Description of Variables . . . . . . . . . . . . . . . . . . . . . . . . . . . . . . . . . . . . . . . . . . . . .67
Table of Contents

vi Teacher Attrition and Mobility: Results from the Teacher Follow-up Survey, 2000–01
viiList of Tables
Table 1. Number and percentage of public and private school teacher stayers, movers, and leavers, by sector: 1988–89, 1991–92, 1994–95, and 2000–01 . . . . . . . . . . . . . . . . . . . . . . . . . . . . . . . . . . . . . . .8
Table 2. Percentage of public and private school teacher stayers, movers, and leavers, by selected school and teacher characteristics: 1987–88 to 1988–89, 1990–91 to 1991–92, 1993–94 to 1994–95, and1999–2000 to 2000–01 . . . . . . . . . . . . . . . . . . . . . . . . . . . . . . . . . . . . . . . . . . . . . . . . . . . . . . . . . . . . . .9
Table 3. Number and percentage of public and private school teacher stayers, movers, and leavers, by selected school and teacher characteristics: 1999–2000 to 2000–01 . . . . . . . . . . . . . . . . . . . . . . . .11
Table 4. Percentage of public and private school teacher stayers, movers, and leavers with various averagereported income levels during the base year, by selected school and teacher characteristics: 2000–01 . . . . . . . . . . . . . . . . . . . . . . . . . . . . . . . . . . . . . . . . . . . . . . . . . .12
Table 5. Percentage of public and private school teacher stayers, movers, and leavers that reported plans to remain in teaching: 1999–2000 and 2000–01 . . . . . . . . . . . . . . . . . . . . . . . . . . . . . . . . . . . . . . . . . .14
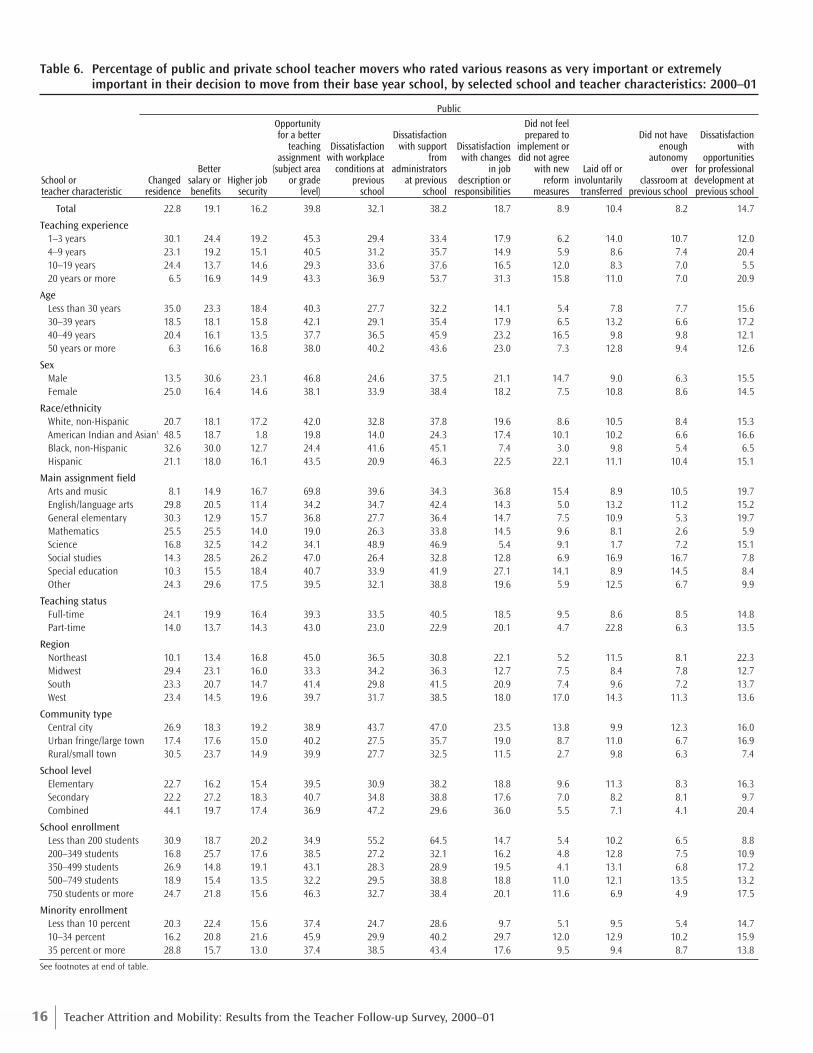
Table 6. Percentage of public and private school teacher movers who rated various reasons as very important or extremely important in their decision to move from their base year school, by selected school and teacher characteristics: 2000–01 . . . . . . . . . . . . . . . . . . . . . . . . . . . . . . . . . . . . . .16
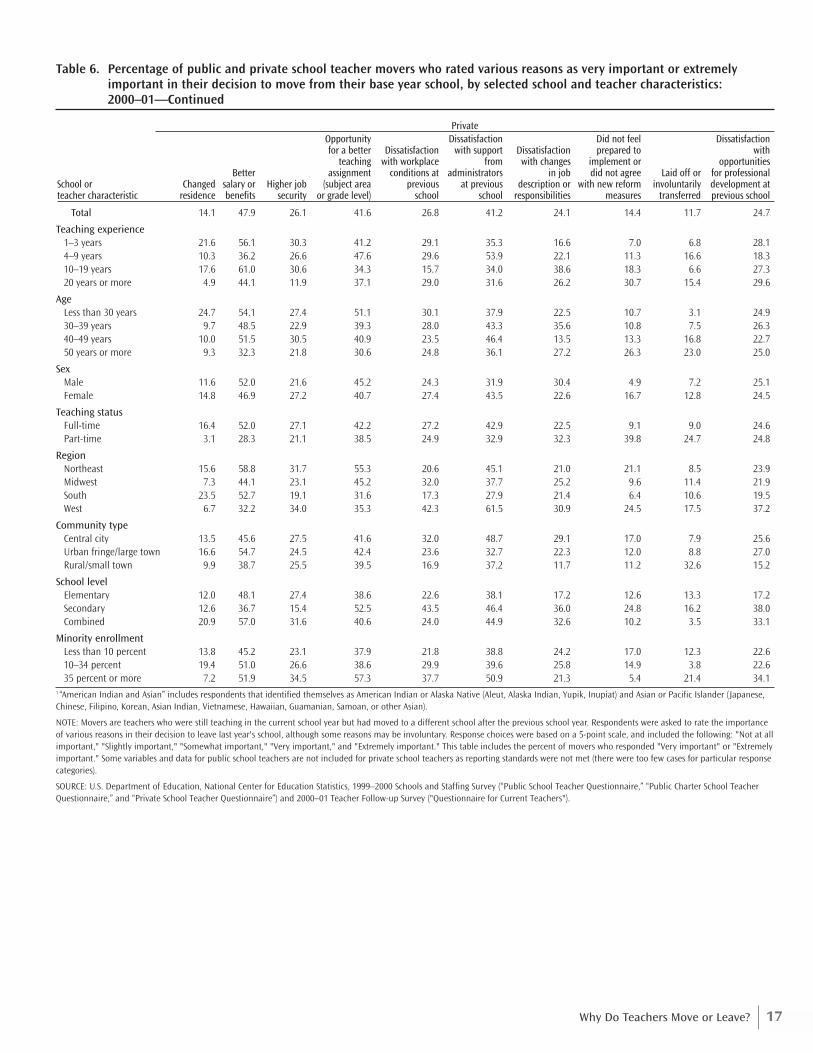
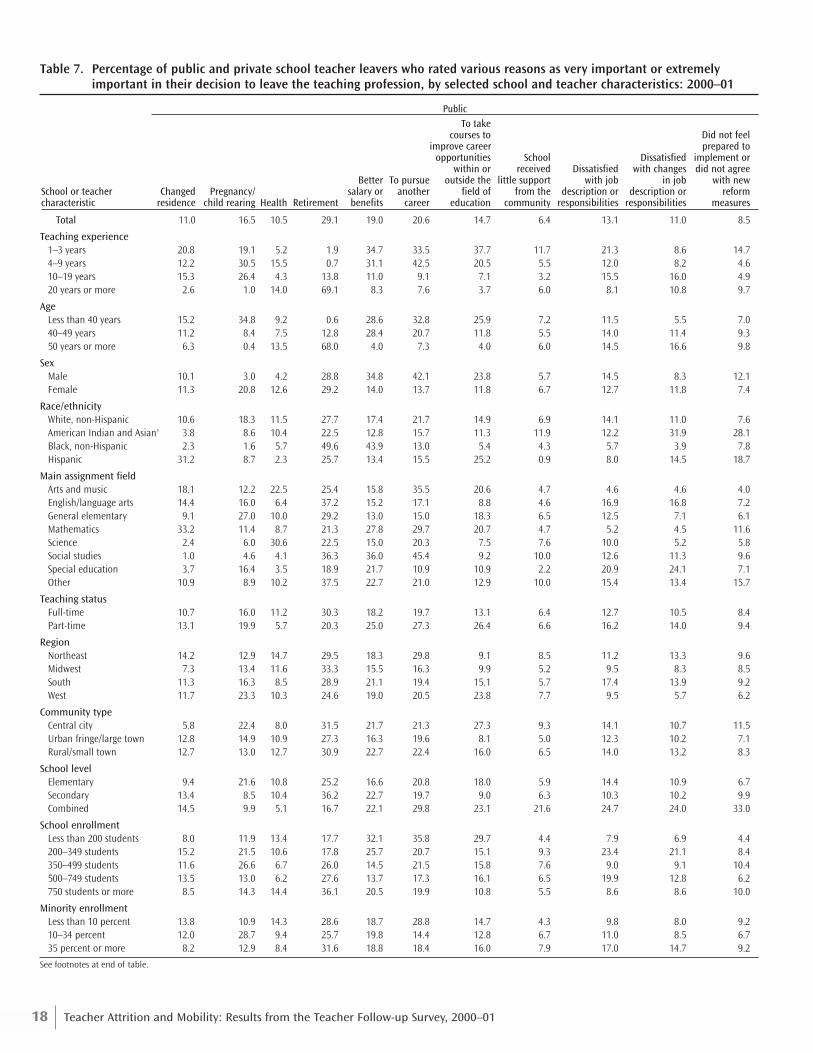
Table 7. Percentage of public and private school teacher leavers who rated various reasons as very important or extremely important in their decision to leave the teaching profession, by selected school and teacher characteristics: 2000–01 . . . . . . . . . . . . . . . . . . . . . . . . . . . . . . . . . . . . . . . . . . . . .18
Table 8. Percentage of public school teacher leavers collecting a pension from a teacher retirement system, and percentage of leavers collecting a pension reporting that various factors were very important or extremely important in their decision to retire, by selected school and teacher characteristics:2000–01 . . . . . . . . . . . . . . . . . . . . . . . . . . . . . . . . . . . . . . . . . . . . . . . . . . . . . . . . . . . . . . . . . . . . . . . . .20
Table 9. Percentage of public and private school teacher movers and leavers who strongly agreed or strongly disagreed with various statements about their former schools: 2000–01 . . . . . . . . . . . . . . . .21
Table 10. Percentage of public and private school teacher stayers, movers, and leavers who indicated the instructional leader in their base year school was very effective or extremely effective at performing various activities: 2000–01 . . . . . . . . . . . . . . . . . . . . . . . . . . . . . . . . . . . . . . . . . . . . . . . . .22
Table 11. Percentage of public and private school teacher stayers and movers who strongly agreed or strongly disagreed with various statements about the administrators and staff at their base yearschools: 2000–01 . . . . . . . . . . . . . . . . . . . . . . . . . . . . . . . . . . . . . . . . . . . . . . . . . . . . . . . . . . . . . . . . . .22
Table 12. Percentage of base year teachers moving across schools, school districts, and sectors: 1999–2000 to 2000–01 . . . . . . . . . . . . . . . . . . . . . . . . . . . . . . . . . . . . . . . . . . . . . . . . . . . . . . . . . . . . . . . . . . . . . .24
Table 13. Current main occupational status of public and private school teacher leavers: 2000–01 . . . . . . . . . .24
Table 14. Percentage of public and private school teacher leavers who were working that rated various aspects of their current main occupation as better than teaching, not better than teaching, or no difference: 2000–01 . . . . . . . . . . . . . . . . . . . . . . . . . . . . . . . . . . . . . . . . . . . . . . . . . . . . . . . . . . . . . . .25
List of Tables
viii Teacher Attrition and Mobility: Results from the Teacher Follow-up Survey, 2000–01
Appendix A: Standard Error Tables
Table A1. Standard errors for table 1: Number and percentage of public and private school teacher stayers, movers, and leavers, by sector: 1988–89, 1991–92, 1994–95, and 2000–01 . . . . . . . . . . . . . . . . . . . . .28
Table A2. Standard errors for table 2: Percentage of public and private school teacher stayers, movers, and leavers, by selected school and teacher characteristics: 1987–88 to 1988–89, 1990–91 to 1991–92, 1993–94 to 1994–95, and 1999–2000 to 2000–01 . . . . . . . . . . . . . . . . . . . . . . . . . . . . . . . . .29
Table A3. Standard errors for table 3: Number and percentage of public and private school teacher stayers, movers, and leavers, by selected school and teacher characteristics: 1999–2000 to 2000–01 . . . . . . .31
Table A4. Standard errors for table 4: Percentage of public and private school teacher stayers, movers, and leavers with various average reported income levels during the base year, by selected school and teacher characteristics: 2000–01 . . . . . . . . . . . . . . . . . . . . . . . . . . . . . . . . . . . . . . . . . . . . . . . . . .32
Table A5. Standard errors for table 5: Percentage of public and private school teacher stayers, movers, and leavers that reported plans to remain in teaching: 1999–2000 and 2000–01 . . . . . . . . . . . . . . . . . . . .34
Table A6. Standard errors for table 6: Percentage of public and private school teacher movers who rated various reasons as very important or extremely important in their decision to move from their base year school, by selected school and teacher characteristics: 2000–01 . . . . . . . . . . . . . . . . . . . . .35
Table A7. Standard errors for table 7: Percentage of public and private school teacher leavers who rated various reasons as very important or extremely important in their decision to leave the teaching profession, by selected school and teacher characteristics: 2000–01 . . . . . . . . . . . . . . . . . . . . . . . . . .37
Table A8. Standard errors for table 8: Percentage of public school teacher leavers collecting a pension from a teacher retirement system, and percentage of leavers collecting a pension reporting that various factors were very important or extremely important in their decision to retire, by selected school and teacher characteristics: 2000–01 . . . . . . . . . . . . . . . . . . . . . . . . . . . . . . . . . . . . . . . . . . . . . . . . . .39
Table A9. Standard errors for table 9: Percentage of public and private school teacher movers and leavers who strongly agreed or strongly disagreed with various statements about their former schools: 2000–01 . . . . . . . . . . . . . . . . . . . . . . . . . . . . . . . . . . . . . . . . . . . . . . . . . . . . . . . . . . . . . . . . . . . . . . . . .40
Table A10. Standard errors for table 10: Percentage of public and private school teacher stayers, movers, and leavers who indicated the instructional leader in their base year school was very effective or extremely effective at performing various activities: 2000–01 . . . . . . . . . . . . . . . . . . . . . . . . . . . . . . .41
Table A11. Standard errors for table 11: Percentage of public and private school teacher stayers and movers who strongly agreed or strongly disagreed with various statements about the administrators and staff at their base year schools: 2000–01 . . . . . . . . . . . . . . . . . . . . . . . . . . . . . . . . . . . . . . . . . . . . . . .41
Table A12. Standard errors for table 12: Percentage of base year teachers moving across schools, school districts, and sectors: 1999–2000 to 2000–01 . . . . . . . . . . . . . . . . . . . . . . . . . . . . . . . . . . . . . . . . . . . .42
Table A13. Standard errors for table 13: Current main occupational status of public and private school teacherleavers: 2000–01 . . . . . . . . . . . . . . . . . . . . . . . . . . . . . . . . . . . . . . . . . . . . . . . . . . . . . . . . . . . . . . . . . .42
Table A14. Standard errors for table 14: Percentage of public and private school teacher leavers who were working that rated various aspects of their current main occupation as better than teaching, not better than teaching, or no difference: 2000–01 . . . . . . . . . . . . . . . . . . . . . . . . . . . . . . . . . . . . . . . . .43
ixList of Tables
Appendix B: Technical Notes Tables
Table B1. Number of selected teachers in the SASS sample, by teacher type: 1999–2000 . . . . . . . . . . . . . . . . . .52
Table B2. TFS sample allocation: 2000–01 . . . . . . . . . . . . . . . . . . . . . . . . . . . . . . . . . . . . . . . . . . . . . . . . . . . . . .54
Table B3. TFS final interview status, by 1999–2000 SASS final interview status: 2000–01 . . . . . . . . . . . . . . . . . .55
Table B4. TFS data collection schedule: 2000–01 . . . . . . . . . . . . . . . . . . . . . . . . . . . . . . . . . . . . . . . . . . . . . . . . .56
Table B5. TFS Image Data Capture Quality Assurance Summary: 2000–01 . . . . . . . . . . . . . . . . . . . . . . . . . . . . . .58
Table B6. TFS survey response rates, by sector and teaching status, unweighted and weighted: 2000–01 . . . . . .59
Table B7. Survey response rates for the 1999–2000 SASS Teacher Listing Form, 1999–2000 SASS TeacherQuestionnaire, and 2000–01 Teacher Follow-up Survey, weighted . . . . . . . . . . . . . . . . . . . . . . . . . . . .59
Table B8. Summary of TFS item response rates, unweighted: 2000–01 . . . . . . . . . . . . . . . . . . . . . . . . . . . . . . . .60

x Teacher Attrition and Mobility: Results from the Teacher Follow-up Survey, 2000–01
1Summary
Introduction
Between the 1999–2000 and 2000–01 school years, approximately 8 percent of public and private school teach-ers transferred to a different school and 7 percent and 13 percent of public and private school teachers, respec-tively, chose to leave the teaching profession (table 1). Teachers who change schools or leave the teaching pro-fession create difficulties for school administrators who must spend valuable time and resources to adequatelystaff their classrooms. Additionally, teachers moving and leaving raise questions about the professional satisfac-tion of teachers. In order to gain an understanding of the professional motivations of teachers who leave theirpositions, three related questions must be examined. First, who is most likely to move or leave? Understandingtrends in teachers moving and leaving will enable policymakers to target those teachers who are most likely toleave their positions. Second, why do teachers move or leave? It is important to understand the underlying rea-sons for these decisions to develop strategies to retain teachers. Finally, where do teachers go when they move orleave? Information about what teachers do after they leave their position, and how these new positions compareto teaching, provides insight about the professional needs of teachers. This report seeks to shed light on thesequestions by examining the characteristics of teachers who left the teaching profession between the 1999–2000and 2000–01 school years (“leavers”), teachers who continued teaching but changed schools (“movers”), andteachers who continued teaching in the same school in 2000–01 (“stayers”).
Data Source
The Teacher Follow-up Survey (TFS) is a one-year follow-up of a sample of approximately 8,400 teachers whowere originally selected for the teacher component in the Schools and Staffing Survey (SASS). The Schools andStaffing Survey is an integrated set of surveys of public and private schools, principals, teachers, library mediacenters, and public school districts throughout the United States of America. There have been four data cyclesfor the Schools and Staffing Survey, and likewise, four Teacher Follow-up Surveys.
The 2000–01 Teacher Follow-up Survey data in this report link responses from the 2000–01 school year to char-acteristics of those same teachers who participated in SASS during the 1999–2000 school year. Within thisreport, there are some data that are drawn directly from the 1999–2000 SASS. These data are termed “baseyear” because the SASS sample is the “base” for the teachers who are selected for the Teacher Follow-up Survey.Base year characteristics include personal and professional descriptors of the teacher (age, sex, race/ethnicity,teaching assignment field), as well as characteristics of the school in which the teachers worked in 1999–2000(whether the school was public or private, region of the country in which the school was located, and the com-munity type or locale of the school). These “base year” characteristics provide the context for the data collectedin the Teacher Follow-up Survey.
The purpose of the Teacher Follow-up Survey is to provide information about teacher mobility and attrition. Forexample, how do teachers who remain teaching at the same school from year to year (“stayers”) compare withthose who do not? How many teachers move from one school to another school (“movers”)? What percentageof teachers leave the profession between one year and the next (“leavers”)? These types of questions can beanswered with data from the Teacher Follow-up Survey. For teachers who leave the profession, TFS asks about
Summary
2 Teacher Attrition and Mobility: Results from the Teacher Follow-up Survey, 2000–01
their occupational status (are former teachers working, retired, or caring for family members?) or whether theyare seeking further education, and reasons for leaving teaching, as well as recommendations for how schoolsmight retain teachers. Those who remain in teaching are asked about changes in teaching assignment, opinionsabout retaining teachers, and retirement plans. Teachers who move from one school to another are asked todescribe the type of school to which they moved. Furthermore, data from the Teacher Follow-up Survey can beused to compare attrition and mobility across the public and private school sectors.
Approximately 3,300 stayers, 2,200 movers, and 2,800 leavers were included in the initial 2000–01 TeacherFollow-up Survey sample. A questionnaire for former teachers was mailed to leavers, while stayers and moverswere mailed a separate questionnaire for current teachers. The unit survey response rate for the TFS was 90 per-cent (90 percent for current teachers and 89 percent for former teachers), and 97 percent of questionnaire itemshad a response rate of 90 percent or higher. The cumulative overall response rate for the Teacher Follow-upSurvey is based on the response rate to the SASS teacher listing form, the SASS teacher questionnaire responserate, and the TFS response rate. Because TFS estimates are based on a sample, they may differ somewhat fromthe values obtained from administering a complete census using the same questionnaire, instructions, and proce-dures. For more detailed technical information about the Teacher Follow-up Survey, please see appendix B of thisreport.
Organization of the Report
The body of this report is organized around the three previously described questions related to teacher attritionand mobility in the United States: Who is most likely to move or leave? Why do teachers move or leave? Wheredo these teachers go? A set of tables with data from the 2000–01 Teacher Follow-up Survey is presented for eachquestion.
The first section, “Who Is Most Likely to Move or Leave?,” presents basic information on base year (1999–2000)teachers who left the teaching profession (“leavers”), as well as corresponding characteristics of teachers whoremained in their base year schools (“stayers”) or who moved to another school to teach during the 2000–01school year (“movers”). The number and percentage of stayers, movers, and leavers are reported along a num-ber of selected teacher, school, and job characteristics, as well as teachers’ plans to remain in teaching, as report-ed in SASS in 1999–2000. This section also includes the average income levels of stayers, movers, and leaversduring the 1999–2000 school year.
The second section, “Why Do Teachers Move or Leave?,” includes current and former teachers’ satisfaction withtheir base year schools, their perceptions of the administrators, instructional leaders, and staff at their base yearschools, and the reasons movers and leavers gave for leaving the school in which they taught in 1999–2000.
Finally, the section titled, “Where Do Teachers Go When They Move or Leave?,” reports the current main occu-pational status of former teachers, as well as how those teachers perceived their current jobs relative to their for-mer teaching positions. The percentage of base year teachers moving across schools, school districts, and sectorsis also considered in this section, as are data on base year teachers who retired from the teaching professionbetween the 1999–2000 and 2000–01 school years.
Many of the tables found in this report present findings by a set of selected teacher and school characteristics.Included among these characteristics are the sector (public or private) and level of the school (elementary,
3Summary
secondary, or combined-grade) at which the respondent taught during the 1999–2000 school year, the mainassignment field (e.g., mathematics, science) and teaching status (full-time or part-time) of the respondent in1999–2000, and the current or former teachers’ years of teaching experience, age, sex, and race/ethnicity1.Public school teachers include those who teach in public charter schools as well as in traditional publicschools.
The final portion of this report includes three appendices that provide supporting information for the datareported. Standard error tables for every table included in this report are located in appendix A. Technicalnotes, located in appendix B, include an overview of the survey content, target populations and estimates, sam-ple design and implementation, data collection procedures, response rates, imputation procedures, and weight-ing. Finally, appendix C provides a brief description of the SASS and TFS variables used to produce the tablesin this report.
This report was written to be understandable to readers with little statistical background. For more informa-tion concerning survey design and collection, the statistical procedures used in the report, and the accuracy ofestimates, please see appendix B. Additional information concerning the Teacher Follow-up Survey is alsoavailable on the World Wide Web at http://nces.ed.gov/surveys/SASS. All differences discussed in this reportwere tested and found to be statistically significant at the .05 level. However, not all statistically significant dif-ferences are discussed. As this is a descriptive report, readers should not attempt to draw causal inferences fromthe findings.
Selected FindingsWho Is Most Likely to Move or Leave?
■ Between the 1999–2000 and 2000–01 school years 85 percent of all public school teachers remained at thesame school, 8 percent moved to a different school, and 7 percent left the teaching profession (table 1). Ahigher proportion of public school teachers left the profession between the 1999–2000 and 2000–01 schoolyears compared to the 1990–91 to 1991–92 and 1987–88 to 1988–89 school years.
■ Between 1999–2000 and 2000–01, private school teachers were more likely to leave teaching (13 percent)than their public school counterparts (7 percent) (table 1). Conversely, public school teachers were more like-ly to stay, and 8 percent of the teachers in both sectors moved.
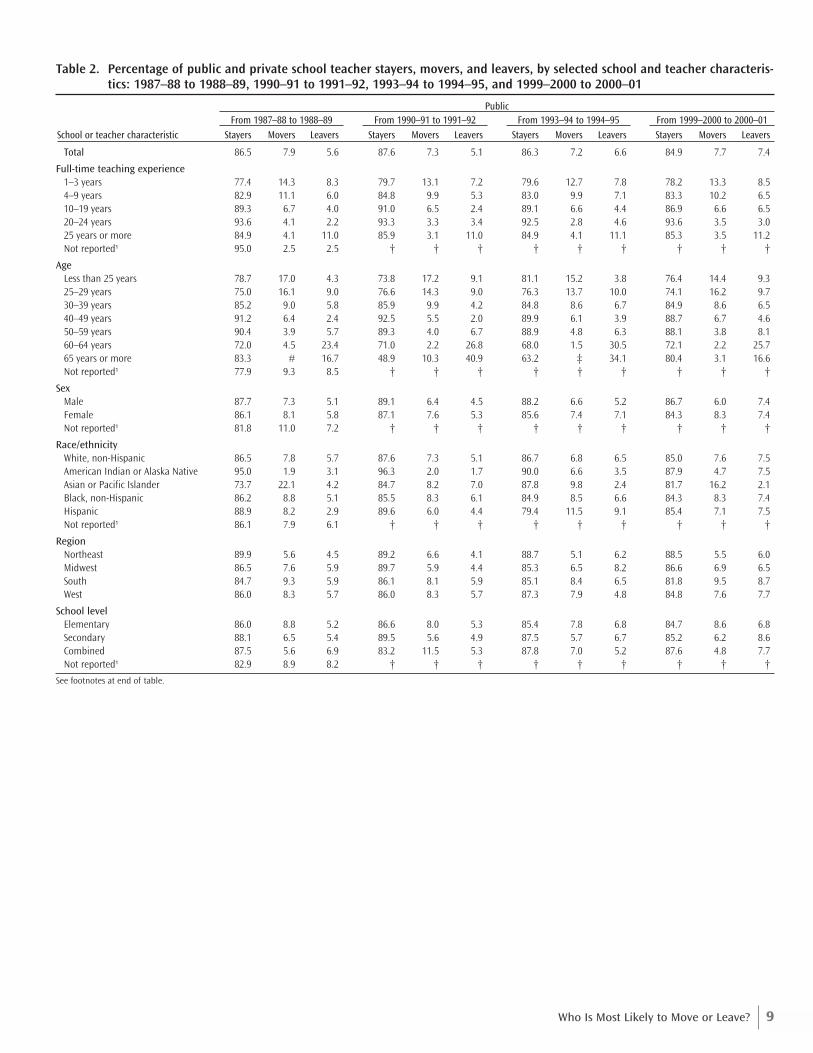
■ Public and private school teachers with fewer than 10 years of teaching experience were more likely thantheir more experienced colleagues to move to a different school between the 1999–2000 and 2000–01 schoolyears (table 2). Additionally, private school teachers with one to three years of experience were more likelyto leave the profession than more experienced teachers.
■ Public and private school teachers who were younger than age 30 were also more likely to move than olderteachers in both sectors (table 3). In public and private schools, respectively, 16 percent and 13 percent ofteachers who were less than 30 years old transferred to another school. Public school teachers who were olderthan 50 years of age or younger than 30 years of age were more likely to leave the teaching profession after1999–2000 than other public school teachers, while private school teachers younger than 30 years old werealso more likely to leave than their older counterparts.
1 For more information on these and other variables used in this report, please see appendix C.
4 Teacher Attrition and Mobility: Results from the Teacher Follow-up Survey, 2000–01
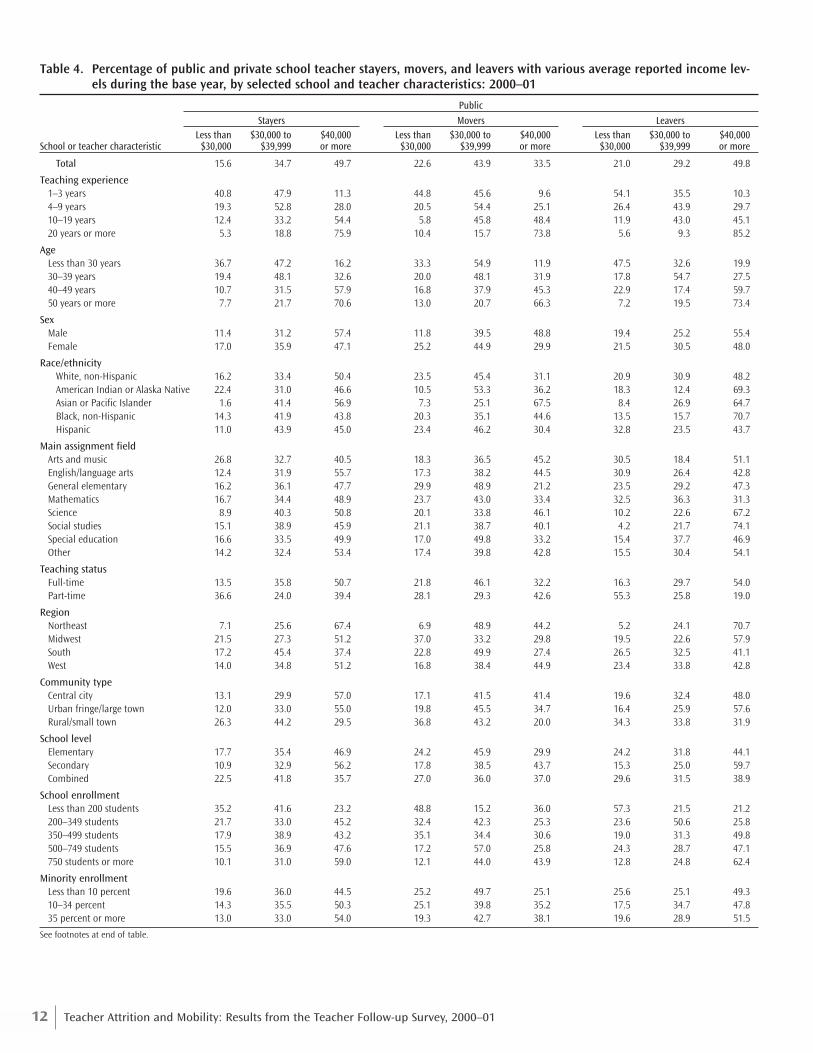
■ Approximately 34 percent of public school movers earned $40,000 or more in 1999–2000, in comparison to50 percent of public school stayers and leavers (table 4). Additionally, both public school movers and leaverswere more likely to earn less than $30,000 (23 percent and 21 percent, respectively) compared to public schoolstayers (16 percent). Similar trends appear among private school teachers. For example, 69 percent of privateschool leavers and 68 percent of movers reported earning less than $30,000 in annual income, compared to54 percent of private school stayers. For more information regarding public and private school teachers’ aver-age salaries and earned income, please see tables 76–79 in the Digest of Education Statistics 2002 (NCES2003–060), U.S. Department of Education, National Center for Education Statistics.
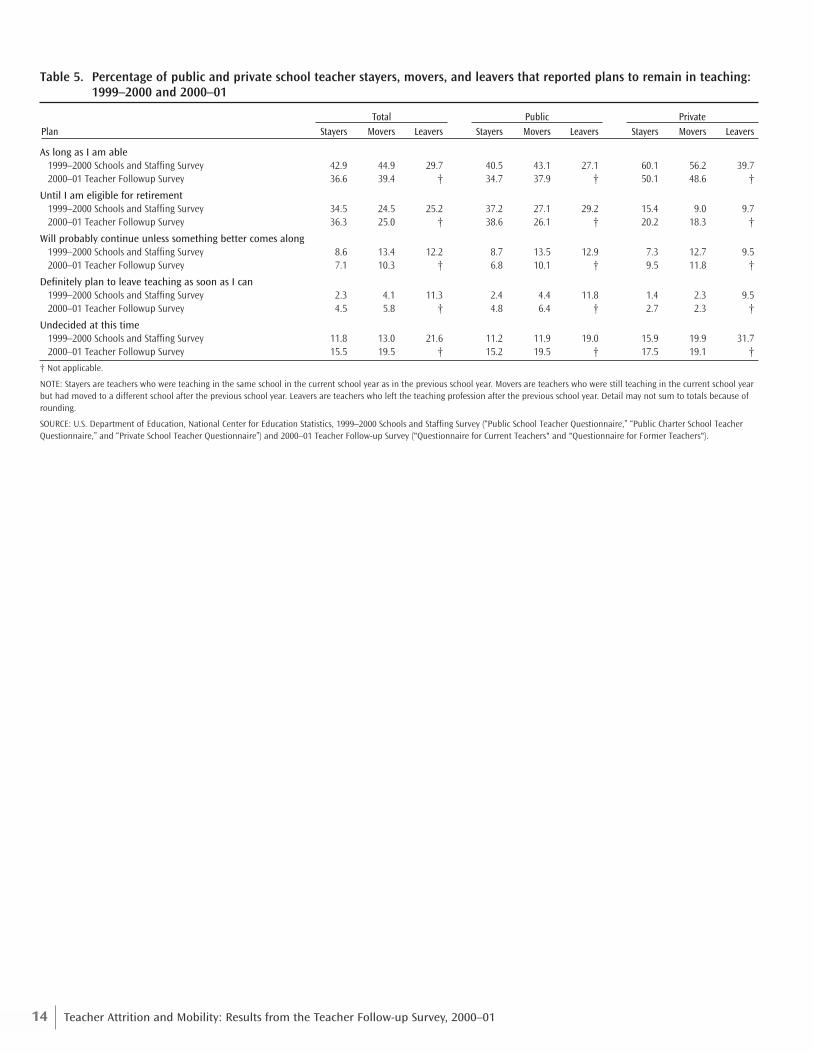
■ Many public and private school leavers did not plan to leave the teaching profession when asked during the2000–01 school year (table 5). Twenty-seven percent of public school leavers and 40 percent of private schoolleavers stated in 1999–2000 that they planned to remain in teaching as long as they were able. Nineteen per-cent and 32 percent of public and private school leavers, respectively, were undecided about their future plansto remain in teaching when asked during the base year.
Why Do Teachers Move or Leave?■ Among the reasons that public school teachers gave in 2000–01 for moving to a new school were an opportu-
nity for a better teaching assignment (40 percent), dissatisfaction with support from administrators (38 per-cent), and dissatisfaction with workplace conditions (32 percent) (table 6).
■ Like public school movers, private school movers frequently cited an opportunity for a better teaching assign-ment (42 percent) and dissatisfaction with support from administrators (41 percent) as reasons for changingschools following the 1999–2000 school year (table 6). However, private school movers more frequently report-ed changing schools to obtain a better salary or benefits (48 percent) than public school movers (19 percent).
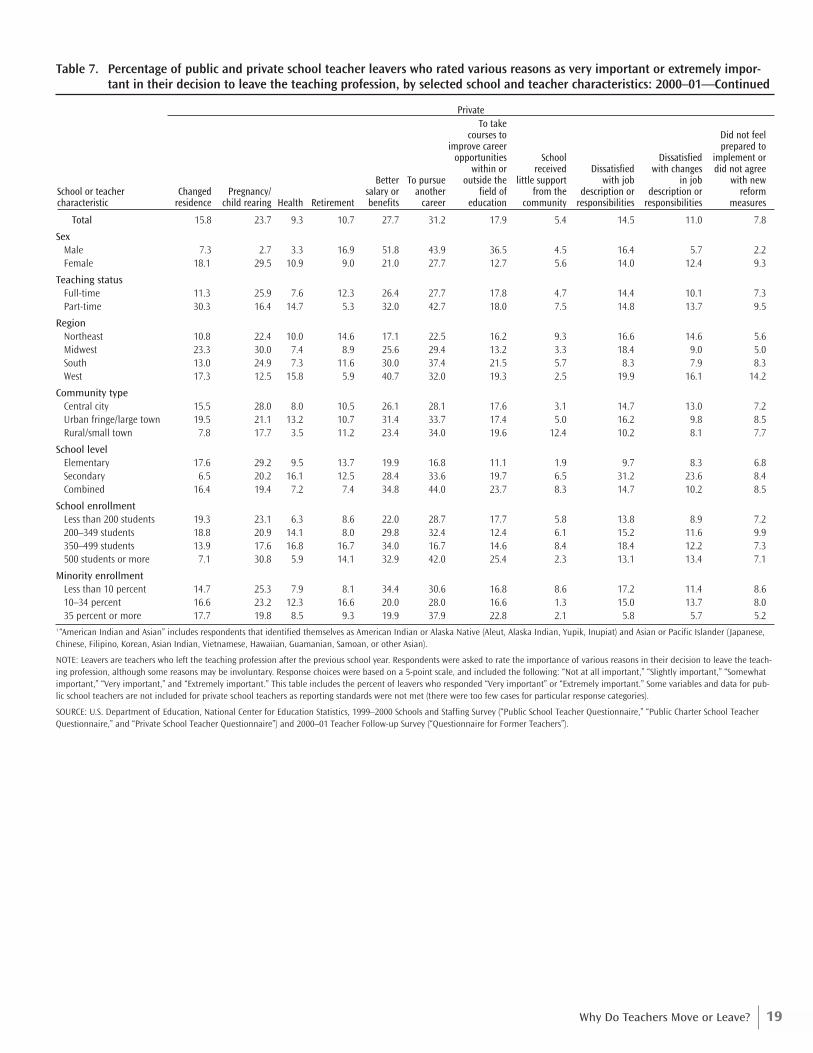
■ Twenty-nine percent of public school leavers reported in 2000–01 that they left the teaching profession inorder to retire and about 20 percent each reported that they left to pursue another career and obtain a bettersalary or benefits (table 7). Private school leavers also frequently reported that they left teaching to pursueanother career (31 percent) or obtain a better salary or benefits (28 percent). However, private school leaverswere less likely than public school teachers to report that they left in order to retire (11 percent).
■ Among public and private school teachers who left the teaching profession between 1999–2000 and 2000–01,larger percentages of women than men cited pregnancy/child rearing and health as very important or extreme-ly important reasons in their decision to leave teaching (table 7). Conversely, men were more likely thanwomen to report leaving their public or private school teaching position for a better salary or benefits, to pur-sue another career, or to take courses to improve their career opportunities within or outside the field of edu-cation.
■ One-half of all black, non-Hispanic public school leavers in 2000–01 cited retirement as a very or extremelyimportant reason in their decision to leave teaching, compared to 28 percent of white leavers (table 7). Black,non-Hispanic public school leavers (44 percent) were also more likely to report that they left teaching to pur-sue a better salary or benefits than white, non-Hispanic (17 percent), Hispanic (13 percent), and AmericanIndian or Asian (13 percent) leavers.
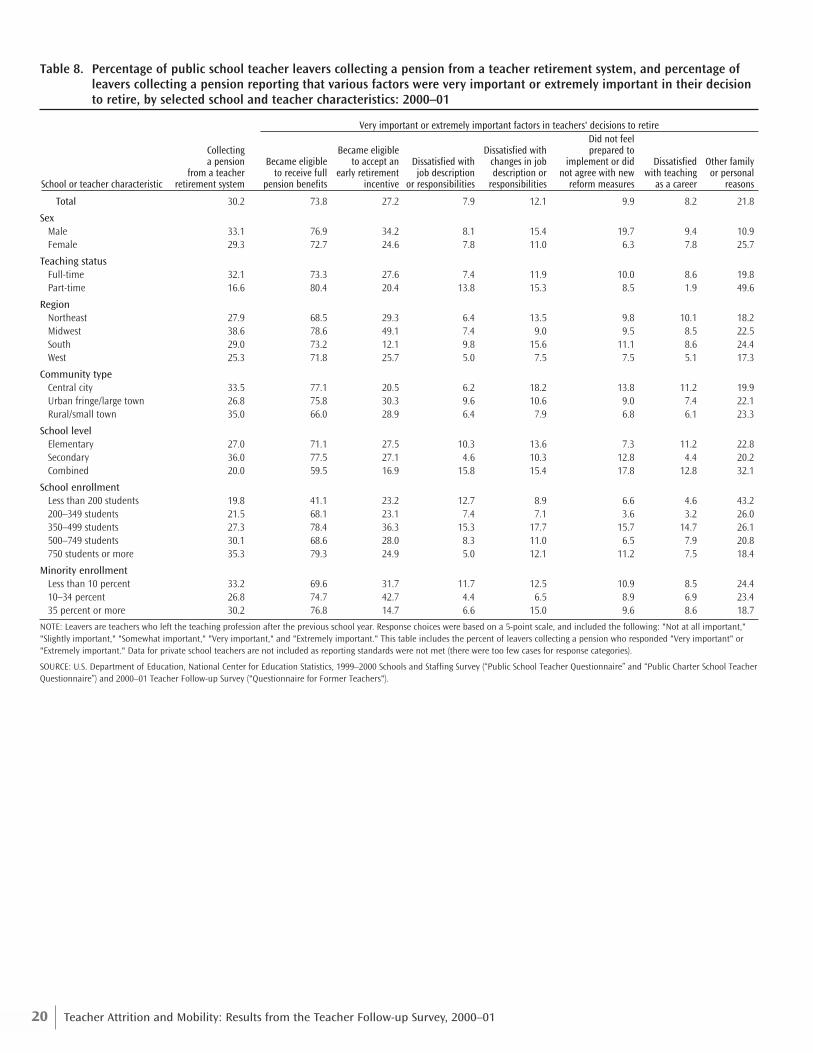
■ Of public school teachers who left teaching after the 1999–2000 school year and who were drawing a pen-sion in 2000–01, about three-quarters indicated that their eligibility to receive full pension benefits was avery or extremely important factor in their decision to retire (table 8). Eligibility for an early retirementincentive was also an important factor in the decision to retire for about one-quarter (27 percent) of theseformer teachers.
5Summary
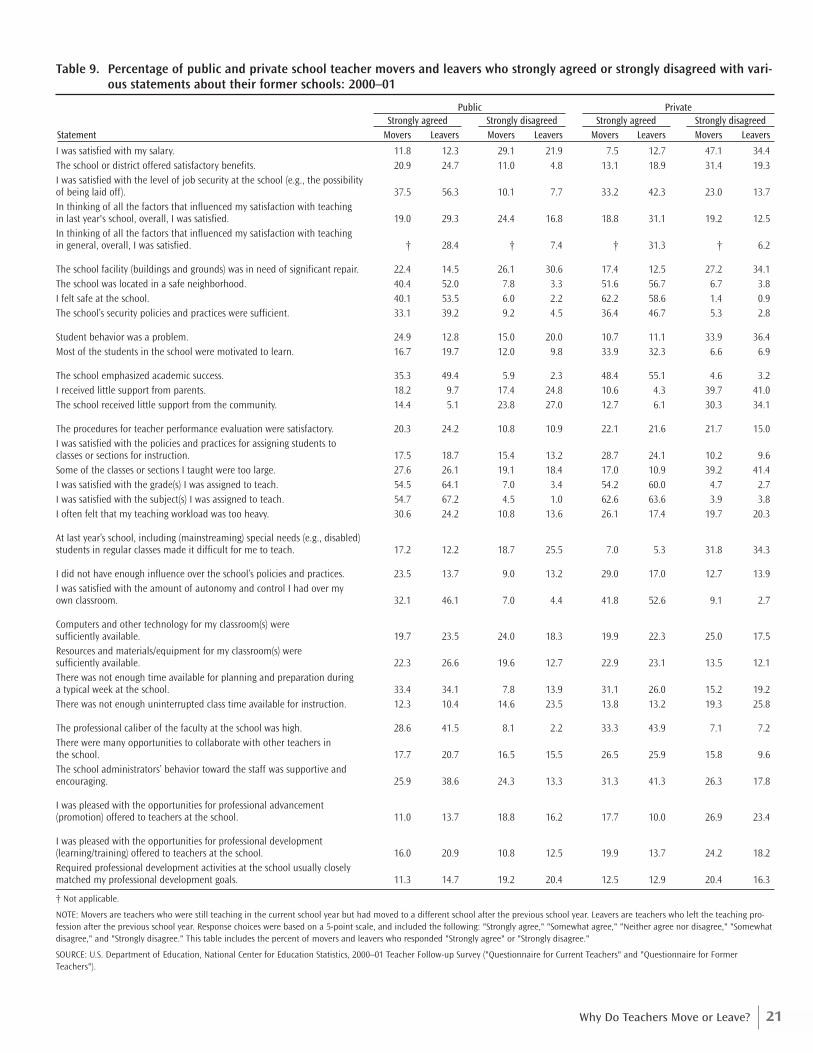
■ Public school movers were generally more likely to report dissatisfaction with their teaching experience in theirformer school than public school leavers (table 9). For example, movers were more likely to report that they werenot satisfied with their salary at their 1999–2000 school (29 percent) than leavers (22 percent). Additionally,public school movers were more likely to report that student behavior was a problem (25 percent) than leavers(13 percent).
■ A comparison of private school movers’ and leavers’ levels of satisfaction with aspects of their 1999–2000school shows that movers were less satisfied than leavers with the salary and benefits they received (table 9).Private school movers were also more likely than leavers to report that they had neither enough influence overthe school’s policies and practices nor enough autonomy and control over the classroom in 1999–2000.
■ Movers were more critical of the instructional leader at their 1999–2000 school than stayers, in both publicand private schools, on all eight measures included in the Teacher Follow-up Survey (table 10). Public schoolmovers were also less likely than leavers to report that their 1999–2000 instructional leader was very orextremely effective at communicating respect and value of teachers, encouraging teachers to change teachingmethods if students were not doing well, encouraging professional collaboration among teachers, and workingwith teaching staff to solve school or department problems. Private school movers were more critical of theirprevious year’s instructional leader than private school leavers on one measure: encouraging teachers to changeteaching methods if students were not doing well.
■ Private school movers and leavers were less likely than private school stayers to rate their former instruction-al leader as being effective on a variety of measures (table 10). For example, 66 percent of stayers, 41 percentof movers, and 46 percent of leavers reported that their instructional leader was effective at encouraging professional collaboration among teachers in the 1999–2000 school year. Sixty-three percent of stayers, 39percent of movers, and 40 percent of leavers reported that their instructional leader was very or extremelyeffective at facilitating and encouraging professional development activities of teachers. Additionally, 70 per-cent of stayers reported that their instructional leader was very or extremely effective at communicating respectand value of teachers compared to 52 percent of movers and 61 percent of leavers.
■ Movers were generally less satisfied than stayers with their former school’s administrators and staff (table 11).For example, fewer public and private school movers strongly agreed that there was a great deal of coopera-tive effort among staff members at their 1999–2000 school compared to public and private school stayers.
Where Do Teachers Go When They Move or Leave?■ Between the 1999–2000 and 2000–01 school years, private school movers were much more likely to transfer
to the public school sector (53 percent) than public school movers were to transfer to the private school sec-tor (2 percent) (table 12). Additionally, switching to the public school sector was more common among pri-vate school teachers with less than 5 years experience (61 percent) than among those with 5 or more yearsexperience (48 percent).
■ About half (53 percent) of public school movers chose to move to a public school in a different school dis-trict for the 2000–01 school year, while 45 percent moved to a different school but remained in the samepublic school district (table 12).
■ Public school leavers were most likely to specify “retired” as their main occupational status in 2000–01 (28percent), whereas private school leavers were most likely to report that they were working in an occupationoutside the field of education (30 percent) or were caring for family members (24 percent) (table 13). About20 percent of public school leavers and 14 percent of private school leavers continued to work in a K–12 schoolin 2000–01, but were no longer teaching.
6 Teacher Attrition and Mobility: Results from the Teacher Follow-up Survey, 2000–01
■ Of leavers who reported that their main occupational status in 2000–01 was working, private school leavers(67 percent) were more likely than public school leavers (32 percent) to be employed in the private sector(table 13). Fifty-nine percent and 23 percent of public and private school leavers whose main occupationalstatus was working, respectively, reported being employed by the local, state, or federal government.
■ Leavers who were working in a non-teaching position in 2000–01 were asked to compare their current posi-tion to their 1999–2000 teaching position on 17 occupational characteristics, like salary, intellectual challenge,availability of resources, and recognition and support from administrators or managers (table 14). Of leaverswho did not report “no difference” between the two positions, public school leavers indicated that 15 of the17 characteristics were better in their current position than in teaching, with the exception of benefits and jobsecurity. Similarly, private school leavers were more likely to report that 16 of the 17 characteristics were bet-ter in their current position than better in teaching, with job security being the lone exception.
■ In comparing their new positions with teaching, half or more of both public and private school leavers whoselected working as their main occupational status reported that the manageability of their workload, oppor-tunities for professional advancement, professional prestige, and general work conditions were better in theircurrent (2000–01) positions (table 14). Private school leavers were more likely to report that they received abetter salary in their current position (65 percent) than were public school leavers (44 percent).
7Who Is Most Likely to Move or Leave?
Who Is Most Likely to Move or Leave?

8 Teacher Attrition and Mobility: Results from the Teacher Follow-up Survey, 2000–01
Table 1. Number and percentage of public and private school teacher stayers, movers, and leavers, by sector: 1988–89, 1991–92,1994–95, and 2000–01
Sector and year Total base year teachers1 Stayers Movers Leavers Stayers Movers Leavers
Public1988–89 2,386,500 2,065,800 188,400 132,300 86.5 7.9 5.61991–92 2,553,500 2,237,300 185,700 130,500 87.6 7.3 5.11994–95 2,555,800 2,205,300 182,900 167,600 86.3 7.2 6.62000–01 2,994,700 2,542,200 231,000 221,400 84.9 7.7 7.4
Private1988–89 311,900 242,500 29,700 39,700 77.8 9.5 12.71991–92 353,800 287,100 23,200 43,500 81.1 6.6 12.31994–95 376,800 310,100 21,700 45,000 82.3 5.8 11.92000–01 448,600 354,800 37,600 56,200 79.1 8.4 12.5
1The total number of base year teachers for any year is slightly lower than previously published counts, as all teachers who responded to SASS but were ineligible for the TFS (died or moved outof the country) were removed from the weighted count of base year teachers.
NOTE: Stayers are teachers who were teaching in the same school in the current school year as in the previous school year. Movers are teachers who were still teaching in the current school yearbut had moved to a different school after the previous school year. Leavers are teachers who left the teaching profession after the previous school year. Total numbers are rounded to the nearest100. Detail may not sum to totals because of rounding.
SOURCE: U.S. Department of Education, National Center for Education Statistics, 2000–01 Teacher Follow-up Survey ("Questionnaire for Current Teachers" and "Questionnaire for FormerTeachers"); and U.S. Department of Education, National Center for Education Statistics, Characteristics of Stayers, Movers, and Leavers: Results from the Teacher Followup Survey: 1994–95(NCES 97–450).
PercentageNumber
9Who Is Most Likely to Move or Leave?
Table 2. Percentage of public and private school teacher stayers, movers, and leavers, by selected school and teacher characteris-tics: 1987–88 to 1988–89, 1990–91 to 1991–92, 1993–94 to 1994–95, and 1999–2000 to 2000–01
School or teacher characteristic Stayers Movers Leavers Stayers Movers Leavers Stayers Movers Leavers Stayers Movers Leavers
Total 86.5 7.9 5.6 87.6 7.3 5.1 86.3 7.2 6.6 84.9 7.7 7.4
Full-time teaching experience1–3 years 77.4 14.3 8.3 79.7 13.1 7.2 79.6 12.7 7.8 78.2 13.3 8.54–9 years 82.9 11.1 6.0 84.8 9.9 5.3 83.0 9.9 7.1 83.3 10.2 6.510–19 years 89.3 6.7 4.0 91.0 6.5 2.4 89.1 6.6 4.4 86.9 6.6 6.520–24 years 93.6 4.1 2.2 93.3 3.3 3.4 92.5 2.8 4.6 93.6 3.5 3.025 years or more 84.9 4.1 11.0 85.9 3.1 11.0 84.9 4.1 11.1 85.3 3.5 11.2Not reported¹ 95.0 2.5 2.5 † † † † † † † † †
AgeLess than 25 years 78.7 17.0 4.3 73.8 17.2 9.1 81.1 15.2 3.8 76.4 14.4 9.325–29 years 75.0 16.1 9.0 76.6 14.3 9.0 76.3 13.7 10.0 74.1 16.2 9.730–39 years 85.2 9.0 5.8 85.9 9.9 4.2 84.8 8.6 6.7 84.9 8.6 6.540–49 years 91.2 6.4 2.4 92.5 5.5 2.0 89.9 6.1 3.9 88.7 6.7 4.650–59 years 90.4 3.9 5.7 89.3 4.0 6.7 88.9 4.8 6.3 88.1 3.8 8.160–64 years 72.0 4.5 23.4 71.0 2.2 26.8 68.0 1.5 30.5 72.1 2.2 25.765 years or more 83.3 # 16.7 48.9 10.3 40.9 63.2 ‡ 34.1 80.4 3.1 16.6Not reported¹ 77.9 9.3 8.5 † † † † † † † † †
SexMale 87.7 7.3 5.1 89.1 6.4 4.5 88.2 6.6 5.2 86.7 6.0 7.4Female 86.1 8.1 5.8 87.1 7.6 5.3 85.6 7.4 7.1 84.3 8.3 7.4Not reported¹ 81.8 11.0 7.2 † † † † † † † † †
Race/ethnicityWhite, non-Hispanic 86.5 7.8 5.7 87.6 7.3 5.1 86.7 6.8 6.5 85.0 7.6 7.5American Indian or Alaska Native 95.0 1.9 3.1 96.3 2.0 1.7 90.0 6.6 3.5 87.9 4.7 7.5Asian or Pacific Islander 73.7 22.1 4.2 84.7 8.2 7.0 87.8 9.8 2.4 81.7 16.2 2.1Black, non-Hispanic 86.2 8.8 5.1 85.5 8.3 6.1 84.9 8.5 6.6 84.3 8.3 7.4Hispanic 88.9 8.2 2.9 89.6 6.0 4.4 79.4 11.5 9.1 85.4 7.1 7.5Not reported¹ 86.1 7.9 6.1 † † † † † † † † †
RegionNortheast 89.9 5.6 4.5 89.2 6.6 4.1 88.7 5.1 6.2 88.5 5.5 6.0Midwest 86.5 7.6 5.9 89.7 5.9 4.4 85.3 6.5 8.2 86.6 6.9 6.5South 84.7 9.3 5.9 86.1 8.1 5.9 85.1 8.4 6.5 81.8 9.5 8.7West 86.0 8.3 5.7 86.0 8.3 5.7 87.3 7.9 4.8 84.8 7.6 7.7
School levelElementary 86.0 8.8 5.2 86.6 8.0 5.3 85.4 7.8 6.8 84.7 8.6 6.8Secondary 88.1 6.5 5.4 89.5 5.6 4.9 87.5 5.7 6.7 85.2 6.2 8.6Combined 87.5 5.6 6.9 83.2 11.5 5.3 87.8 7.0 5.2 87.6 4.8 7.7Not reported¹ 82.9 8.9 8.2 † † † † † † † † †
See footnotes at end of table.
From 1990–91 to 1991–92 From 1993–94 to 1994–95From 1987–88 to 1988–89 From 1999–2000 to 2000–01Public
10 Teacher Attrition and Mobility: Results from the Teacher Follow-up Survey, 2000–01
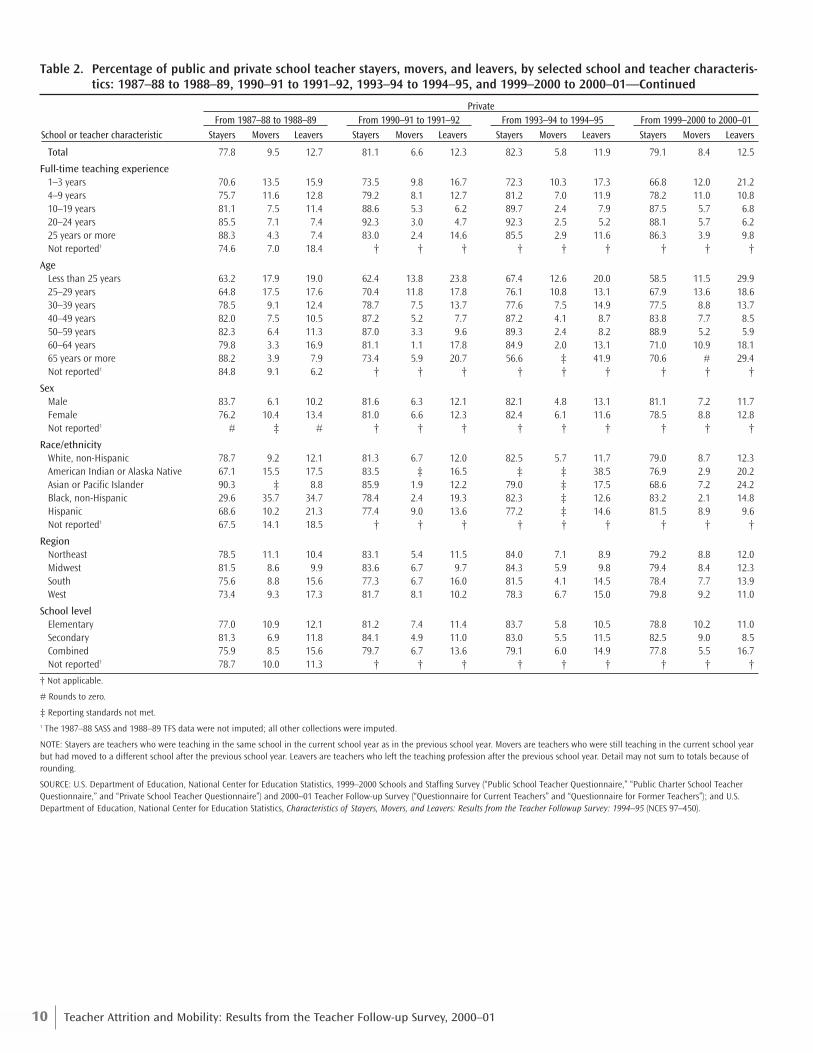
Table 2. Percentage of public and private school teacher stayers, movers, and leavers, by selected school and teacher characteris-tics: 1987–88 to 1988–89, 1990–91 to 1991–92, 1993–94 to 1994–95, and 1999–2000 to 2000–01—Continued
School or teacher characteristic Stayers Movers Leavers Stayers Movers Leavers Stayers Movers Leavers Stayers Movers Leavers
Total 77.8 9.5 12.7 81.1 6.6 12.3 82.3 5.8 11.9 79.1 8.4 12.5
Full-time teaching experience1–3 years 70.6 13.5 15.9 73.5 9.8 16.7 72.3 10.3 17.3 66.8 12.0 21.24–9 years 75.7 11.6 12.8 79.2 8.1 12.7 81.2 7.0 11.9 78.2 11.0 10.810–19 years 81.1 7.5 11.4 88.6 5.3 6.2 89.7 2.4 7.9 87.5 5.7 6.820–24 years 85.5 7.1 7.4 92.3 3.0 4.7 92.3 2.5 5.2 88.1 5.7 6.225 years or more 88.3 4.3 7.4 83.0 2.4 14.6 85.5 2.9 11.6 86.3 3.9 9.8Not reported1 74.6 7.0 18.4 † † † † † † † † †
AgeLess than 25 years 63.2 17.9 19.0 62.4 13.8 23.8 67.4 12.6 20.0 58.5 11.5 29.925–29 years 64.8 17.5 17.6 70.4 11.8 17.8 76.1 10.8 13.1 67.9 13.6 18.630–39 years 78.5 9.1 12.4 78.7 7.5 13.7 77.6 7.5 14.9 77.5 8.8 13.740–49 years 82.0 7.5 10.5 87.2 5.2 7.7 87.2 4.1 8.7 83.8 7.7 8.550–59 years 82.3 6.4 11.3 87.0 3.3 9.6 89.3 2.4 8.2 88.9 5.2 5.960–64 years 79.8 3.3 16.9 81.1 1.1 17.8 84.9 2.0 13.1 71.0 10.9 18.165 years or more 88.2 3.9 7.9 73.4 5.9 20.7 56.6 ‡ 41.9 70.6 # 29.4Not reported1 84.8 9.1 6.2 † † † † † † † † †
SexMale 83.7 6.1 10.2 81.6 6.3 12.1 82.1 4.8 13.1 81.1 7.2 11.7Female 76.2 10.4 13.4 81.0 6.6 12.3 82.4 6.1 11.6 78.5 8.8 12.8Not reported1 # ‡ # † † † † † † † † †
Race/ethnicityWhite, non-Hispanic 78.7 9.2 12.1 81.3 6.7 12.0 82.5 5.7 11.7 79.0 8.7 12.3American Indian or Alaska Native 67.1 15.5 17.5 83.5 ‡ 16.5 ‡ ‡ 38.5 76.9 2.9 20.2Asian or Pacific Islander 90.3 ‡ 8.8 85.9 1.9 12.2 79.0 ‡ 17.5 68.6 7.2 24.2Black, non-Hispanic 29.6 35.7 34.7 78.4 2.4 19.3 82.3 ‡ 12.6 83.2 2.1 14.8Hispanic 68.6 10.2 21.3 77.4 9.0 13.6 77.2 ‡ 14.6 81.5 8.9 9.6Not reported1 67.5 14.1 18.5 † † † † † † † † †
RegionNortheast 78.5 11.1 10.4 83.1 5.4 11.5 84.0 7.1 8.9 79.2 8.8 12.0Midwest 81.5 8.6 9.9 83.6 6.7 9.7 84.3 5.9 9.8 79.4 8.4 12.3South 75.6 8.8 15.6 77.3 6.7 16.0 81.5 4.1 14.5 78.4 7.7 13.9West 73.4 9.3 17.3 81.7 8.1 10.2 78.3 6.7 15.0 79.8 9.2 11.0
School levelElementary 77.0 10.9 12.1 81.2 7.4 11.4 83.7 5.8 10.5 78.8 10.2 11.0Secondary 81.3 6.9 11.8 84.1 4.9 11.0 83.0 5.5 11.5 82.5 9.0 8.5Combined 75.9 8.5 15.6 79.7 6.7 13.6 79.1 6.0 14.9 77.8 5.5 16.7Not reported1 78.7 10.0 11.3 † † † † † † † † †
† Not applicable.
# Rounds to zero.
‡ Reporting standards not met.1 The 1987–88 SASS and 1988–89 TFS data were not imputed; all other collections were imputed.
NOTE: Stayers are teachers who were teaching in the same school in the current school year as in the previous school year. Movers are teachers who were still teaching in the current school yearbut had moved to a different school after the previous school year. Leavers are teachers who left the teaching profession after the previous school year. Detail may not sum to totals because ofrounding.
SOURCE: U.S. Department of Education, National Center for Education Statistics, 1999–2000 Schools and Staffing Survey (“Public School Teacher Questionnaire,” “Public Charter School TeacherQuestionnaire,” and “Private School Teacher Questionnaire”) and 2000–01 Teacher Follow-up Survey (“Questionnaire for Current Teachers” and “Questionnaire for Former Teachers”); and U.S.Department of Education, National Center for Education Statistics, Characteristics of Stayers, Movers, and Leavers: Results from the Teacher Followup Survey: 1994–95 (NCES 97–450).
From 1990–91 to 1991–92 From 1993–94 to 1994–95From 1987–88 to 1988–89 From 1999–2000 to 2000–01Private
11Who Is Most Likely to Move or Leave?
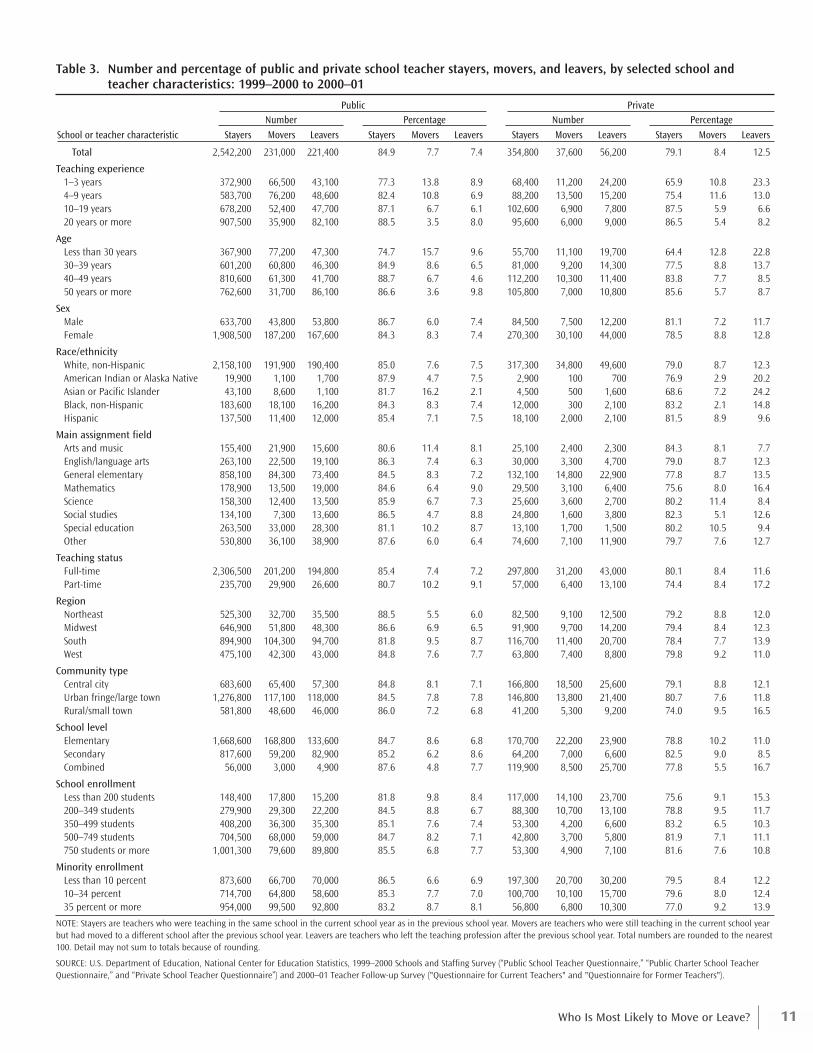
Table 3. Number and percentage of public and private school teacher stayers, movers, and leavers, by selected school andteacher characteristics: 1999–2000 to 2000–01
School or teacher characteristic Stayers Movers Leavers Stayers Movers Leavers Stayers Movers Leavers Stayers Movers Leavers
Total 2,542,200 231,000 221,400 84.9 7.7 7.4 354,800 37,600 56,200 79.1 8.4 12.5
Teaching experience1–3 years 372,900 66,500 43,100 77.3 13.8 8.9 68,400 11,200 24,200 65.9 10.8 23.34–9 years 583,700 76,200 48,600 82.4 10.8 6.9 88,200 13,500 15,200 75.4 11.6 13.010–19 years 678,200 52,400 47,700 87.1 6.7 6.1 102,600 6,900 7,800 87.5 5.9 6.620 years or more 907,500 35,900 82,100 88.5 3.5 8.0 95,600 6,000 9,000 86.5 5.4 8.2
AgeLess than 30 years 367,900 77,200 47,300 74.7 15.7 9.6 55,700 11,100 19,700 64.4 12.8 22.830–39 years 601,200 60,800 46,300 84.9 8.6 6.5 81,000 9,200 14,300 77.5 8.8 13.740–49 years 810,600 61,300 41,700 88.7 6.7 4.6 112,200 10,300 11,400 83.8 7.7 8.550 years or more 762,600 31,700 86,100 86.6 3.6 9.8 105,800 7,000 10,800 85.6 5.7 8.7
SexMale 633,700 43,800 53,800 86.7 6.0 7.4 84,500 7,500 12,200 81.1 7.2 11.7Female 1,908,500 187,200 167,600 84.3 8.3 7.4 270,300 30,100 44,000 78.5 8.8 12.8
Race/ethnicityWhite, non-Hispanic 2,158,100 191,900 190,400 85.0 7.6 7.5 317,300 34,800 49,600 79.0 8.7 12.3American Indian or Alaska Native 19,900 1,100 1,700 87.9 4.7 7.5 2,900 100 700 76.9 2.9 20.2Asian or Pacific Islander 43,100 8,600 1,100 81.7 16.2 2.1 4,500 500 1,600 68.6 7.2 24.2Black, non-Hispanic 183,600 18,100 16,200 84.3 8.3 7.4 12,000 300 2,100 83.2 2.1 14.8Hispanic 137,500 11,400 12,000 85.4 7.1 7.5 18,100 2,000 2,100 81.5 8.9 9.6
Main assignment fieldArts and music 155,400 21,900 15,600 80.6 11.4 8.1 25,100 2,400 2,300 84.3 8.1 7.7English/language arts 263,100 22,500 19,100 86.3 7.4 6.3 30,000 3,300 4,700 79.0 8.7 12.3General elementary 858,100 84,300 73,400 84.5 8.3 7.2 132,100 14,800 22,900 77.8 8.7 13.5Mathematics 178,900 13,500 19,000 84.6 6.4 9.0 29,500 3,100 6,400 75.6 8.0 16.4Science 158,300 12,400 13,500 85.9 6.7 7.3 25,600 3,600 2,700 80.2 11.4 8.4Social studies 134,100 7,300 13,600 86.5 4.7 8.8 24,800 1,600 3,800 82.3 5.1 12.6Special education 263,500 33,000 28,300 81.1 10.2 8.7 13,100 1,700 1,500 80.2 10.5 9.4Other 530,800 36,100 38,900 87.6 6.0 6.4 74,600 7,100 11,900 79.7 7.6 12.7
Teaching statusFull-time 2,306,500 201,200 194,800 85.4 7.4 7.2 297,800 31,200 43,000 80.1 8.4 11.6Part-time 235,700 29,900 26,600 80.7 10.2 9.1 57,000 6,400 13,100 74.4 8.4 17.2
RegionNortheast 525,300 32,700 35,500 88.5 5.5 6.0 82,500 9,100 12,500 79.2 8.8 12.0Midwest 646,900 51,800 48,300 86.6 6.9 6.5 91,900 9,700 14,200 79.4 8.4 12.3South 894,900 104,300 94,700 81.8 9.5 8.7 116,700 11,400 20,700 78.4 7.7 13.9West 475,100 42,300 43,000 84.8 7.6 7.7 63,800 7,400 8,800 79.8 9.2 11.0
Community typeCentral city 683,600 65,400 57,300 84.8 8.1 7.1 166,800 18,500 25,600 79.1 8.8 12.1Urban fringe/large town 1,276,800 117,100 118,000 84.5 7.8 7.8 146,800 13,800 21,400 80.7 7.6 11.8Rural/small town 581,800 48,600 46,000 86.0 7.2 6.8 41,200 5,300 9,200 74.0 9.5 16.5
School levelElementary 1,668,600 168,800 133,600 84.7 8.6 6.8 170,700 22,200 23,900 78.8 10.2 11.0Secondary 817,600 59,200 82,900 85.2 6.2 8.6 64,200 7,000 6,600 82.5 9.0 8.5Combined 56,000 3,000 4,900 87.6 4.8 7.7 119,900 8,500 25,700 77.8 5.5 16.7
School enrollmentLess than 200 students 148,400 17,800 15,200 81.8 9.8 8.4 117,000 14,100 23,700 75.6 9.1 15.3200–349 students 279,900 29,300 22,200 84.5 8.8 6.7 88,300 10,700 13,100 78.8 9.5 11.7350–499 students 408,200 36,300 35,300 85.1 7.6 7.4 53,300 4,200 6,600 83.2 6.5 10.3500–749 students 704,500 68,000 59,000 84.7 8.2 7.1 42,800 3,700 5,800 81.9 7.1 11.1750 students or more 1,001,300 79,600 89,800 85.5 6.8 7.7 53,300 4,900 7,100 81.6 7.6 10.8
Minority enrollmentLess than 10 percent 873,600 66,700 70,000 86.5 6.6 6.9 197,300 20,700 30,200 79.5 8.4 12.210–34 percent 714,700 64,800 58,600 85.3 7.7 7.0 100,700 10,100 15,700 79.6 8.0 12.435 percent or more 954,000 99,500 92,800 83.2 8.7 8.1 56,800 6,800 10,300 77.0 9.2 13.9
NOTE: Stayers are teachers who were teaching in the same school in the current school year as in the previous school year. Movers are teachers who were still teaching in the current school yearbut had moved to a different school after the previous school year. Leavers are teachers who left the teaching profession after the previous school year. Total numbers are rounded to the nearest100. Detail may not sum to totals because of rounding.
SOURCE: U.S. Department of Education, National Center for Education Statistics, 1999–2000 Schools and Staffing Survey (“Public School Teacher Questionnaire,” “Public Charter School TeacherQuestionnaire,” and “Private School Teacher Questionnaire”) and 2000–01 Teacher Follow-up Survey ("Questionnaire for Current Teachers" and "Questionnaire for Former Teachers").
Percentage NumberNumber PercentagePublic Private
12 Teacher Attrition and Mobility: Results from the Teacher Follow-up Survey, 2000–01
Table 4. Percentage of public and private school teacher stayers, movers, and leavers with various average reported income lev-els during the base year, by selected school and teacher characteristics: 2000–01
Less than $30,000 to $40,000 Less than $30,000 to $40,000 Less than $30,000 to $40,000School or teacher characteristic $30,000 $39,999 or more $30,000 $39,999 or more $30,000 $39,999 or more
Total 15.6 34.7 49.7 22.6 43.9 33.5 21.0 29.2 49.8
Teaching experience1–3 years 40.8 47.9 11.3 44.8 45.6 9.6 54.1 35.5 10.34–9 years 19.3 52.8 28.0 20.5 54.4 25.1 26.4 43.9 29.710–19 years 12.4 33.2 54.4 5.8 45.8 48.4 11.9 43.0 45.120 years or more 5.3 18.8 75.9 10.4 15.7 73.8 5.6 9.3 85.2
AgeLess than 30 years 36.7 47.2 16.2 33.3 54.9 11.9 47.5 32.6 19.930–39 years 19.4 48.1 32.6 20.0 48.1 31.9 17.8 54.7 27.540–49 years 10.7 31.5 57.9 16.8 37.9 45.3 22.9 17.4 59.750 years or more 7.7 21.7 70.6 13.0 20.7 66.3 7.2 19.5 73.4
SexMale 11.4 31.2 57.4 11.8 39.5 48.8 19.4 25.2 55.4Female 17.0 35.9 47.1 25.2 44.9 29.9 21.5 30.5 48.0
Race/ethnicityWhite, non-Hispanic 16.2 33.4 50.4 23.5 45.4 31.1 20.9 30.9 48.2American Indian or Alaska Native 22.4 31.0 46.6 10.5 53.3 36.2 18.3 12.4 69.3Asian or Pacific Islander 1.6 41.4 56.9 7.3 25.1 67.5 8.4 26.9 64.7Black, non-Hispanic 14.3 41.9 43.8 20.3 35.1 44.6 13.5 15.7 70.7Hispanic 11.0 43.9 45.0 23.4 46.2 30.4 32.8 23.5 43.7
Main assignment fieldArts and music 26.8 32.7 40.5 18.3 36.5 45.2 30.5 18.4 51.1English/language arts 12.4 31.9 55.7 17.3 38.2 44.5 30.9 26.4 42.8General elementary 16.2 36.1 47.7 29.9 48.9 21.2 23.5 29.2 47.3Mathematics 16.7 34.4 48.9 23.7 43.0 33.4 32.5 36.3 31.3Science 8.9 40.3 50.8 20.1 33.8 46.1 10.2 22.6 67.2Social studies 15.1 38.9 45.9 21.1 38.7 40.1 4.2 21.7 74.1Special education 16.6 33.5 49.9 17.0 49.8 33.2 15.4 37.7 46.9Other 14.2 32.4 53.4 17.4 39.8 42.8 15.5 30.4 54.1
Teaching statusFull-time 13.5 35.8 50.7 21.8 46.1 32.2 16.3 29.7 54.0Part-time 36.6 24.0 39.4 28.1 29.3 42.6 55.3 25.8 19.0
RegionNortheast 7.1 25.6 67.4 6.9 48.9 44.2 5.2 24.1 70.7Midwest 21.5 27.3 51.2 37.0 33.2 29.8 19.5 22.6 57.9South 17.2 45.4 37.4 22.8 49.9 27.4 26.5 32.5 41.1West 14.0 34.8 51.2 16.8 38.4 44.9 23.4 33.8 42.8
Community typeCentral city 13.1 29.9 57.0 17.1 41.5 41.4 19.6 32.4 48.0Urban fringe/large town 12.0 33.0 55.0 19.8 45.5 34.7 16.4 25.9 57.6Rural/small town 26.3 44.2 29.5 36.8 43.2 20.0 34.3 33.8 31.9
School levelElementary 17.7 35.4 46.9 24.2 45.9 29.9 24.2 31.8 44.1Secondary 10.9 32.9 56.2 17.8 38.5 43.7 15.3 25.0 59.7Combined 22.5 41.8 35.7 27.0 36.0 37.0 29.6 31.5 38.9
School enrollmentLess than 200 students 35.2 41.6 23.2 48.8 15.2 36.0 57.3 21.5 21.2200–349 students 21.7 33.0 45.2 32.4 42.3 25.3 23.6 50.6 25.8350–499 students 17.9 38.9 43.2 35.1 34.4 30.6 19.0 31.3 49.8500–749 students 15.5 36.9 47.6 17.2 57.0 25.8 24.3 28.7 47.1750 students or more 10.1 31.0 59.0 12.1 44.0 43.9 12.8 24.8 62.4
Minority enrollmentLess than 10 percent 19.6 36.0 44.5 25.2 49.7 25.1 25.6 25.1 49.310–34 percent 14.3 35.5 50.3 25.1 39.8 35.2 17.5 34.7 47.835 percent or more 13.0 33.0 54.0 19.3 42.7 38.1 19.6 28.9 51.5
See footnotes at end of table.
MoversStayers Leavers
Public

13Who Is Most Likely to Move or Leave?
Table 4. Percentage of public and private school teacher stayers, movers, and leavers with various average reported income lev-els during the base year, by selected school and teacher characteristics: 2000–01—Continued
Less than $30,000 to $40,000 Less than $30,000 to $40,000 Less than $30,000 to $40,000School or teacher characteristic $30,000 $39,999 or more $30,000 $39,999 or more $30,000 $39,999 or more
Total 53.9 24.1 22.1 67.8 22.3 9.9 69.0 21.1 9.9
Teaching experience1–9 years 66.7 21.8 11.6 76.8 18.9 4.4 72.0 17.8 10.210–19 years 55.5 25.9 18.6 65.6 15.9 18.6 71.8 24.4 3.920 years or more 31.0 25.9 43.1 33.0 44.0 23.1 53.7 32.8 13.5
AgeLess than 30 years 73.8 18.3 7.9 78.1 20.2 1.7 73.9 17.6 8.630–39 years 53.0 29.3 17.7 63.8 20.6 15.5 67.7 17.0 15.340–49 years 55.6 21.0 23.5 70.9 19.7 9.5 75.4 19.5 5.150 years or more 42.2 26.3 31.5 52.2 31.5 16.3 55.3 34.8 9.9
SexMale 32.4 25.3 42.4 36.7 38.4 25.0 53.6 32.5 13.8Female 60.6 23.7 15.8 75.5 18.3 6.2 73.3 18.0 8.8
Teaching statusFull-time 53.0 24.7 22.3 67.7 22.7 9.7 67.8 23.2 9.0Part-time 58.2 20.9 20.9 68.3 20.5 11.2 73.0 14.4 12.6
RegionNortheast 45.6 27.4 27.0 73.3 18.4 8.3 61.6 22.9 15.6Midwest 64.6 17.5 17.9 66.7 29.1 4.2 72.1 18.3 9.6South 57.3 23.4 19.4 68.6 16.5 14.9 75.5 18.8 5.7West 42.7 30.4 26.9 61.0 27.2 11.8 59.6 28.6 11.8
School levelElementary 63.7 23.0 13.3 79.4 14.6 6.1 78.6 18.1 3.4Secondary 35.0 27.1 37.9 51.8 36.7 11.5 44.9 38.1 17.0Combined 49.9 23.9 26.2 50.7 30.5 18.8 66.4 19.6 14.0
School enrollmentLess than 200 students 67.5 18.8 13.7 72.9 21.6 5.5 77.5 17.4 5.2200–349 students 60.7 25.8 13.5 70.5 20.5 9.0 79.1 10.8 10.2350–499 students 45.4 27.2 27.4 65.1 22.4 12.6 65.7 22.7 11.6500–749 students 47.8 28.1 24.1 53.5 37.6 8.9 65.5 21.8 12.7750 students or more 25.9 26.2 48.0 60.3 16.6 23.1 28.3 50.7 21.1
Minority enrollmentLess than 10 percent 58.1 21.9 20.0 72.8 17.4 9.8 75.0 17.8 7.310–34 percent 49.3 27.5 23.3 61.1 27.7 11.2 57.8 29.6 12.635 percent or more 47.1 25.6 27.3 62.5 29.1 8.3 68.7 18.0 13.3
NOTE: Stayers are teachers who were teaching in the same school in the current school year as in the previous school year. Movers are teachers who were still teaching in the current school yearbut had moved to a different school after the previous school year. Leavers are teachers who left the teaching profession after the previous school year. Detail may not sum to totals because ofrounding. For more information regarding public and private school teachers’ average salaries and earned income, please see tables 76–79 in the Digest of Education Statistics 2002 (NCES2003–060), U.S. Department of Education, National Center for Education Statistics. Some variables and data for public school teachers are not included for private school teachers as reportingstandards were not met (there were too few cases for particular response categories).
SOURCE: U.S. Department of Education, National Center for Education Statistics, 1999–2000 Schools and Staffing Survey (“Public School Teacher Questionnaire,” “Public Charter School TeacherQuestionnaire,” and “Private School Teacher Questionnaire”) and 2000–01 Teacher Follow-up Survey ("Questionnaire for Current Teachers" and "Questionnaire for Former Teachers").
MoversStayers Leavers
Private
14 Teacher Attrition and Mobility: Results from the Teacher Follow-up Survey, 2000–01
Table 5. Percentage of public and private school teacher stayers, movers, and leavers that reported plans to remain in teaching:1999–2000 and 2000–01
Plan Stayers Movers Leavers Stayers Movers Leavers Stayers Movers Leavers
As long as I am able1999–2000 Schools and Staffing Survey 42.9 44.9 29.7 40.5 43.1 27.1 60.1 56.2 39.72000–01 Teacher Followup Survey 36.6 39.4 † 34.7 37.9 † 50.1 48.6 †
Until I am eligible for retirement1999–2000 Schools and Staffing Survey 34.5 24.5 25.2 37.2 27.1 29.2 15.4 9.0 9.72000–01 Teacher Followup Survey 36.3 25.0 † 38.6 26.1 † 20.2 18.3 †
Will probably continue unless something better comes along 1999–2000 Schools and Staffing Survey 8.6 13.4 12.2 8.7 13.5 12.9 7.3 12.7 9.52000–01 Teacher Followup Survey 7.1 10.3 † 6.8 10.1 † 9.5 11.8 †
Definitely plan to leave teaching as soon as I can1999–2000 Schools and Staffing Survey 2.3 4.1 11.3 2.4 4.4 11.8 1.4 2.3 9.52000–01 Teacher Followup Survey 4.5 5.8 † 4.8 6.4 † 2.7 2.3 †
Undecided at this time1999–2000 Schools and Staffing Survey 11.8 13.0 21.6 11.2 11.9 19.0 15.9 19.9 31.72000–01 Teacher Followup Survey 15.5 19.5 † 15.2 19.5 † 17.5 19.1 †
† Not applicable.
NOTE: Stayers are teachers who were teaching in the same school in the current school year as in the previous school year. Movers are teachers who were still teaching in the current school yearbut had moved to a different school after the previous school year. Leavers are teachers who left the teaching profession after the previous school year. Detail may not sum to totals because ofrounding.
SOURCE: U.S. Department of Education, National Center for Education Statistics, 1999–2000 Schools and Staffing Survey (“Public School Teacher Questionnaire,” “Public Charter School TeacherQuestionnaire,” and “Private School Teacher Questionnaire”) and 2000–01 Teacher Follow-up Survey ("Questionnaire for Current Teachers" and "Questionnaire for Former Teachers").
PublicTotal Private
15Why Do Teachers Move or Leave?
Why Do Teachers Move or Leave?
16 Teacher Attrition and Mobility: Results from the Teacher Follow-up Survey, 2000–01
Table 6. Percentage of public and private school teacher movers who rated various reasons as very important or extremelyimportant in their decision to move from their base year school, by selected school and teacher characteristics: 2000–01
Opportunity Did not feelfor a better Dissatisfaction prepared to Did not have Dissatisfaction
teaching Dissatisfaction with support Dissatisfaction implement or enough withassignment with workplace from with changes did not agree autonomy opportunities
Better (subject area conditions at administrators in job with new Laid off or over for professionalSchool or Changed salary or Higher job or grade previous at previous description or reform involuntarily classroom at development at teacher characteristic residence benefits security level) school school responsibilities measures transferred previous school previous school
Total 22.8 19.1 16.2 39.8 32.1 38.2 18.7 8.9 10.4 8.2 14.7
Teaching experience1–3 years 30.1 24.4 19.2 45.3 29.4 33.4 17.9 6.2 14.0 10.7 12.04–9 years 23.1 19.2 15.1 40.5 31.2 35.7 14.9 5.9 8.6 7.4 20.410–19 years 24.4 13.7 14.6 29.3 33.6 37.6 16.5 12.0 8.3 7.0 5.520 years or more 6.5 16.9 14.9 43.3 36.9 53.7 31.3 15.8 11.0 7.0 20.9
AgeLess than 30 years 35.0 23.3 18.4 40.3 27.7 32.2 14.1 5.4 7.8 7.7 15.630–39 years 18.5 18.1 15.8 42.1 29.1 35.4 17.9 6.5 13.2 6.6 17.240–49 years 20.4 16.1 13.5 37.7 36.5 45.9 23.2 16.5 9.8 9.8 12.150 years or more 6.3 16.6 16.8 38.0 40.2 43.6 23.0 7.3 12.8 9.4 12.6
SexMale 13.5 30.6 23.1 46.8 24.6 37.5 21.1 14.7 9.0 6.3 15.5Female 25.0 16.4 14.6 38.1 33.9 38.4 18.2 7.5 10.8 8.6 14.5
Race/ethnicityWhite, non-Hispanic 20.7 18.1 17.2 42.0 32.8 37.8 19.6 8.6 10.5 8.4 15.3American Indian and Asian1 48.5 18.7 1.8 19.8 14.0 24.3 17.4 10.1 10.2 6.6 16.6Black, non-Hispanic 32.6 30.0 12.7 24.4 41.6 45.1 7.4 3.0 9.8 5.4 6.5Hispanic 21.1 18.0 16.1 43.5 20.9 46.3 22.5 22.1 11.1 10.4 15.1
Main assignment fieldArts and music 8.1 14.9 16.7 69.8 39.6 34.3 36.8 15.4 8.9 10.5 19.7English/language arts 29.8 20.5 11.4 34.2 34.7 42.4 14.3 5.0 13.2 11.2 15.2General elementary 30.3 12.9 15.7 36.8 27.7 36.4 14.7 7.5 10.9 5.3 19.7Mathematics 25.5 25.5 14.0 19.0 26.3 33.8 14.5 9.6 8.1 2.6 5.9Science 16.8 32.5 14.2 34.1 48.9 46.9 5.4 9.1 1.7 7.2 15.1Social studies 14.3 28.5 26.2 47.0 26.4 32.8 12.8 6.9 16.9 16.7 7.8Special education 10.3 15.5 18.4 40.7 33.9 41.9 27.1 14.1 8.9 14.5 8.4Other 24.3 29.6 17.5 39.5 32.1 38.8 19.6 5.9 12.5 6.7 9.9
Teaching statusFull-time 24.1 19.9 16.4 39.3 33.5 40.5 18.5 9.5 8.6 8.5 14.8Part-time 14.0 13.7 14.3 43.0 23.0 22.9 20.1 4.7 22.8 6.3 13.5
RegionNortheast 10.1 13.4 16.8 45.0 36.5 30.8 22.1 5.2 11.5 8.1 22.3Midwest 29.4 23.1 16.0 33.3 34.2 36.3 12.7 7.5 8.4 7.8 12.7South 23.3 20.7 14.7 41.4 29.8 41.5 20.9 7.4 9.6 7.2 13.7West 23.4 14.5 19.6 39.7 31.7 38.5 18.0 17.0 14.3 11.3 13.6
Community typeCentral city 26.9 18.3 19.2 38.9 43.7 47.0 23.5 13.8 9.9 12.3 16.0Urban fringe/large town 17.4 17.6 15.0 40.2 27.5 35.7 19.0 8.7 11.0 6.7 16.9Rural/small town 30.5 23.7 14.9 39.9 27.7 32.5 11.5 2.7 9.8 6.3 7.4
School levelElementary 22.7 16.2 15.4 39.5 30.9 38.2 18.8 9.6 11.3 8.3 16.3Secondary 22.2 27.2 18.3 40.7 34.8 38.8 17.6 7.0 8.2 8.1 9.7Combined 44.1 19.7 17.4 36.9 47.2 29.6 36.0 5.5 7.1 4.1 20.4
School enrollmentLess than 200 students 30.9 18.7 20.2 34.9 55.2 64.5 14.7 5.4 10.2 6.5 8.8200–349 students 16.8 25.7 17.6 38.5 27.2 32.1 16.2 4.8 12.8 7.5 10.9350–499 students 26.9 14.8 19.1 43.1 28.3 28.9 19.5 4.1 13.1 6.8 17.2500–749 students 18.9 15.4 13.5 32.2 29.5 38.8 18.8 11.0 12.1 13.5 13.2750 students or more 24.7 21.8 15.6 46.3 32.7 38.4 20.1 11.6 6.9 4.9 17.5
Minority enrollmentLess than 10 percent 20.3 22.4 15.6 37.4 24.7 28.6 9.7 5.1 9.5 5.4 14.710–34 percent 16.2 20.8 21.6 45.9 29.9 40.2 29.7 12.0 12.9 10.2 15.935 percent or more 28.8 15.7 13.0 37.4 38.5 43.4 17.6 9.5 9.4 8.7 13.8
See footnotes at end of table.
Public
17Why Do Teachers Move or Leave?
Table 6. Percentage of public and private school teacher movers who rated various reasons as very important or extremelyimportant in their decision to move from their base year school, by selected school and teacher characteristics:2000–01—Continued
Opportunity Dissatisfaction Did not feel Dissatisfactionfor a better Dissatisfaction with support Dissatisfaction prepared to with
teaching with workplace from with changes implement or opportunitiesBetter assignment conditions at administrators in job did not agree Laid off or for professional
School or Changed salary or Higher job (subject area previous at previous description or with new reform involuntarily development at teacher characteristic residence benefits security or grade level) school school responsibilities measures transferred previous school
Total 14.1 47.9 26.1 41.6 26.8 41.2 24.1 14.4 11.7 24.7
Teaching experience1–3 years 21.6 56.1 30.3 41.2 29.1 35.3 16.6 7.0 6.8 28.14–9 years 10.3 36.2 26.6 47.6 29.6 53.9 22.1 11.3 16.6 18.310–19 years 17.6 61.0 30.6 34.3 15.7 34.0 38.6 18.3 6.6 27.320 years or more 4.9 44.1 11.9 37.1 29.0 31.6 26.2 30.7 15.4 29.6
Age Less than 30 years 24.7 54.1 27.4 51.1 30.1 37.9 22.5 10.7 3.1 24.930–39 years 9.7 48.5 22.9 39.3 28.0 43.3 35.6 10.8 7.5 26.340–49 years 10.0 51.5 30.5 40.9 23.5 46.4 13.5 13.3 16.8 22.750 years or more 9.3 32.3 21.8 30.6 24.8 36.1 27.2 26.3 23.0 25.0
SexMale 11.6 52.0 21.6 45.2 24.3 31.9 30.4 4.9 7.2 25.1Female 14.8 46.9 27.2 40.7 27.4 43.5 22.6 16.7 12.8 24.5
Teaching statusFull-time 16.4 52.0 27.1 42.2 27.2 42.9 22.5 9.1 9.0 24.6Part-time 3.1 28.3 21.1 38.5 24.9 32.9 32.3 39.8 24.7 24.8
RegionNortheast 15.6 58.8 31.7 55.3 20.6 45.1 21.0 21.1 8.5 23.9Midwest 7.3 44.1 23.1 45.2 32.0 37.7 25.2 9.6 11.4 21.9South 23.5 52.7 19.1 31.6 17.3 27.9 21.4 6.4 10.6 19.5West 6.7 32.2 34.0 35.3 42.3 61.5 30.9 24.5 17.5 37.2
Community typeCentral city 13.5 45.6 27.5 41.6 32.0 48.7 29.1 17.0 7.9 25.6Urban fringe/large town 16.6 54.7 24.5 42.4 23.6 32.7 22.3 12.0 8.8 27.0Rural/small town 9.9 38.7 25.5 39.5 16.9 37.2 11.7 11.2 32.6 15.2
School levelElementary 12.0 48.1 27.4 38.6 22.6 38.1 17.2 12.6 13.3 17.2Secondary 12.6 36.7 15.4 52.5 43.5 46.4 36.0 24.8 16.2 38.0Combined 20.9 57.0 31.6 40.6 24.0 44.9 32.6 10.2 3.5 33.1
Minority enrollmentLess than 10 percent 13.8 45.2 23.1 37.9 21.8 38.8 24.2 17.0 12.3 22.610–34 percent 19.4 51.0 26.6 38.6 29.9 39.6 25.8 14.9 3.8 22.635 percent or more 7.2 51.9 34.5 57.3 37.7 50.9 21.3 5.4 21.4 34.1
1 “American Indian and Asian” includes respondents that identified themselves as American Indian or Alaska Native (Aleut, Alaska Indian, Yupik, Inupiat) and Asian or Pacific Islander (Japanese,Chinese, Filipino, Korean, Asian Indian, Vietnamese, Hawaiian, Guamanian, Samoan, or other Asian).
NOTE: Movers are teachers who were still teaching in the current school year but had moved to a different school after the previous school year. Respondents were asked to rate the importanceof various reasons in their decision to leave last year's school, although some reasons may be involuntary. Response choices were based on a 5-point scale, and included the following: "Not at allimportant," "Slightly important," "Somewhat important," "Very important," and "Extremely important." This table includes the percent of movers who responded "Very important" or "Extremelyimportant." Some variables and data for public school teachers are not included for private school teachers as reporting standards were not met (there were too few cases for particular responsecategories).
SOURCE: U.S. Department of Education, National Center for Education Statistics, 1999–2000 Schools and Staffing Survey (“Public School Teacher Questionnaire,” “Public Charter School TeacherQuestionnaire,” and “Private School Teacher Questionnaire”) and 2000–01 Teacher Follow-up Survey ("Questionnaire for Current Teachers").
Private
18 Teacher Attrition and Mobility: Results from the Teacher Follow-up Survey, 2000–01
Table 7. Percentage of public and private school teacher leavers who rated various reasons as very important or extremelyimportant in their decision to leave the teaching profession, by selected school and teacher characteristics: 2000–01
To takecourses to Did not feel
improve career prepared toopportunities School Dissatisfied implement or
within or received Dissatisfied with changes did not agreeBetter To pursue outside the little support with job in job with new
School or teacher Changed Pregnancy/ salary or another field of from the description or description or reformcharacteristic residence child rearing Health Retirement benefits career education community responsibilities responsibilities measures
Total 11.0 16.5 10.5 29.1 19.0 20.6 14.7 6.4 13.1 11.0 8.5
Teaching experience1–3 years 20.8 19.1 5.2 1.9 34.7 33.5 37.7 11.7 21.3 8.6 14.74–9 years 12.2 30.5 15.5 0.7 31.1 42.5 20.5 5.5 12.0 8.2 4.610–19 years 15.3 26.4 4.3 13.8 11.0 9.1 7.1 3.2 15.5 16.0 4.920 years or more 2.6 1.0 14.0 69.1 8.3 7.6 3.7 6.0 8.1 10.8 9.7
AgeLess than 40 years 15.2 34.8 9.2 0.6 28.6 32.8 25.9 7.2 11.5 5.5 7.040–49 years 11.2 8.4 7.5 12.8 28.4 20.7 11.8 5.5 14.0 11.4 9.350 years or more 6.3 0.4 13.5 68.0 4.0 7.3 4.0 6.0 14.5 16.6 9.8
SexMale 10.1 3.0 4.2 28.8 34.8 42.1 23.8 5.7 14.5 8.3 12.1Female 11.3 20.8 12.6 29.2 14.0 13.7 11.8 6.7 12.7 11.8 7.4
Race/ethnicityWhite, non-Hispanic 10.6 18.3 11.5 27.7 17.4 21.7 14.9 6.9 14.1 11.0 7.6American Indian and Asian1 3.8 8.6 10.4 22.5 12.8 15.7 11.3 11.9 12.2 31.9 28.1Black, non-Hispanic 2.3 1.6 5.7 49.6 43.9 13.0 5.4 4.3 5.7 3.9 7.8Hispanic 31.2 8.7 2.3 25.7 13.4 15.5 25.2 0.9 8.0 14.5 18.7
Main assignment fieldArts and music 18.1 12.2 22.5 25.4 15.8 35.5 20.6 4.7 4.6 4.6 4.0English/language arts 14.4 16.0 6.4 37.2 15.2 17.1 8.8 4.6 16.9 16.8 7.2General elementary 9.1 27.0 10.0 29.2 13.0 15.0 18.3 6.5 12.5 7.1 6.1Mathematics 33.2 11.4 8.7 21.3 27.8 29.7 20.7 4.7 5.2 4.5 11.6Science 2.4 6.0 30.6 22.5 15.0 20.3 7.5 7.6 10.0 5.2 5.8Social studies 1.0 4.6 4.1 36.3 36.0 45.4 9.2 10.0 12.6 11.3 9.6Special education 3.7 16.4 3.5 18.9 21.7 10.9 10.9 2.2 20.9 24.1 7.1Other 10.9 8.9 10.2 37.5 22.7 21.0 12.9 10.0 15.4 13.4 15.7
Teaching statusFull-time 10.7 16.0 11.2 30.3 18.2 19.7 13.1 6.4 12.7 10.5 8.4Part-time 13.1 19.9 5.7 20.3 25.0 27.3 26.4 6.6 16.2 14.0 9.4
RegionNortheast 14.2 12.9 14.7 29.5 18.3 29.8 9.1 8.5 11.2 13.3 9.6Midwest 7.3 13.4 11.6 33.3 15.5 16.3 9.9 5.2 9.5 8.3 8.5South 11.3 16.3 8.5 28.9 21.1 19.4 15.1 5.7 17.4 13.9 9.2West 11.7 23.3 10.3 24.6 19.0 20.5 23.8 7.7 9.5 5.7 6.2
Community typeCentral city 5.8 22.4 8.0 31.5 21.7 21.3 27.3 9.3 14.1 10.7 11.5Urban fringe/large town 12.8 14.9 10.9 27.3 16.3 19.6 8.1 5.0 12.3 10.2 7.1Rural/small town 12.7 13.0 12.7 30.9 22.7 22.4 16.0 6.5 14.0 13.2 8.3
School levelElementary 9.4 21.6 10.8 25.2 16.6 20.8 18.0 5.9 14.4 10.9 6.7Secondary 13.4 8.5 10.4 36.2 22.7 19.7 9.0 6.3 10.3 10.2 9.9Combined 14.5 9.9 5.1 16.7 22.1 29.8 23.1 21.6 24.7 24.0 33.0
School enrollmentLess than 200 students 8.0 11.9 13.4 17.7 32.1 35.8 29.7 4.4 7.9 6.9 4.4200–349 students 15.2 21.5 10.6 17.8 25.7 20.7 15.1 9.3 23.4 21.1 8.4350–499 students 11.6 26.6 6.7 26.0 14.5 21.5 15.8 7.6 9.0 9.1 10.4500–749 students 13.5 13.0 6.2 27.6 13.7 17.3 16.1 6.5 19.9 12.8 6.2750 students or more 8.5 14.3 14.4 36.1 20.5 19.9 10.8 5.5 8.6 8.6 10.0
Minority enrollmentLess than 10 percent 13.8 10.9 14.3 28.6 18.7 28.8 14.7 4.3 9.8 8.0 9.210–34 percent 12.0 28.7 9.4 25.7 19.8 14.4 12.8 6.7 11.0 8.5 6.735 percent or more 8.2 12.9 8.4 31.6 18.8 18.4 16.0 7.9 17.0 14.7 9.2
See footnotes at end of table.
Public
19Why Do Teachers Move or Leave?
Table 7. Percentage of public and private school teacher leavers who rated various reasons as very important or extremely impor-tant in their decision to leave the teaching profession, by selected school and teacher characteristics: 2000–01—Continued
To takecourses to Did not feel
improve career prepared toopportunities School Dissatisfied implement or
within or received Dissatisfied with changes did not agreeBetter To pursue outside the little support with job in job with new
School or teacher Changed Pregnancy/ salary or another field of from the description or description or reformcharacteristic residence child rearing Health Retirement benefits career education community responsibilities responsibilities measures
Total 15.8 23.7 9.3 10.7 27.7 31.2 17.9 5.4 14.5 11.0 7.8
SexMale 7.3 2.7 3.3 16.9 51.8 43.9 36.5 4.5 16.4 5.7 2.2Female 18.1 29.5 10.9 9.0 21.0 27.7 12.7 5.6 14.0 12.4 9.3
Teaching statusFull-time 11.3 25.9 7.6 12.3 26.4 27.7 17.8 4.7 14.4 10.1 7.3Part-time 30.3 16.4 14.7 5.3 32.0 42.7 18.0 7.5 14.8 13.7 9.5
RegionNortheast 10.8 22.4 10.0 14.6 17.1 22.5 16.2 9.3 16.6 14.6 5.6Midwest 23.3 30.0 7.4 8.9 25.6 29.4 13.2 3.3 18.4 9.0 5.0South 13.0 24.9 7.3 11.6 30.0 37.4 21.5 5.7 8.3 7.9 8.3West 17.3 12.5 15.8 5.9 40.7 32.0 19.3 2.5 19.9 16.1 14.2
Community typeCentral city 15.5 28.0 8.0 10.5 26.1 28.1 17.6 3.1 14.7 13.0 7.2Urban fringe/large town 19.5 21.1 13.2 10.7 31.4 33.7 17.4 5.0 16.2 9.8 8.5Rural/small town 7.8 17.7 3.5 11.2 23.4 34.0 19.6 12.4 10.2 8.1 7.7
School levelElementary 17.6 29.2 9.5 13.7 19.9 16.8 11.1 1.9 9.7 8.3 6.8Secondary 6.5 20.2 16.1 12.5 28.4 33.6 19.7 6.5 31.2 23.6 8.4Combined 16.4 19.4 7.2 7.4 34.8 44.0 23.7 8.3 14.7 10.2 8.5
School enrollmentLess than 200 students 19.3 23.1 6.3 8.6 22.0 28.7 17.7 5.8 13.8 8.9 7.2200–349 students 18.8 20.9 14.1 8.0 29.8 32.4 12.4 6.1 15.2 11.6 9.9350–499 students 13.9 17.6 16.8 16.7 34.0 16.7 14.6 8.4 18.4 12.2 7.3500 students or more 7.1 30.8 5.9 14.1 32.9 42.0 25.4 2.3 13.1 13.4 7.1
Minority enrollmentLess than 10 percent 14.7 25.3 7.9 8.1 34.4 30.6 16.8 8.6 17.2 11.4 8.610–34 percent 16.6 23.2 12.3 16.6 20.0 28.0 16.6 1.3 15.0 13.7 8.035 percent or more 17.7 19.8 8.5 9.3 19.9 37.9 22.8 2.1 5.8 5.7 5.2
1 “American Indian and Asian” includes respondents that identified themselves as American Indian or Alaska Native (Aleut, Alaska Indian, Yupik, Inupiat) and Asian or Pacific Islander (Japanese,Chinese, Filipino, Korean, Asian Indian, Vietnamese, Hawaiian, Guamanian, Samoan, or other Asian).
NOTE: Leavers are teachers who left the teaching profession after the previous school year. Respondents were asked to rate the importance of various reasons in their decision to leave the teach-ing profession, although some reasons may be involuntary. Response choices were based on a 5-point scale, and included the following: “Not at all important,” “Slightly important,” “Somewhatimportant,” “Very important,” and “Extremely important.” This table includes the percent of leavers who responded “Very important” or “Extremely important.” Some variables and data for pub-lic school teachers are not included for private school teachers as reporting standards were not met (there were too few cases for particular response categories).
SOURCE: U.S. Department of Education, National Center for Education Statistics, 1999–2000 Schools and Staffing Survey (“Public School Teacher Questionnaire,” “Public Charter School TeacherQuestionnaire,” and “Private School Teacher Questionnaire”) and 2000–01 Teacher Follow-up Survey (“Questionnaire for Former Teachers”).
Private
20 Teacher Attrition and Mobility: Results from the Teacher Follow-up Survey, 2000–01
Table 8. Percentage of public school teacher leavers collecting a pension from a teacher retirement system, and percentage ofleavers collecting a pension reporting that various factors were very important or extremely important in their decisionto retire, by selected school and teacher characteristics: 2000–01
Did not feelCollecting Became eligible Dissatisfied with prepared toa pension Became eligible to accept an Dissatisfied with changes in job implement or did Dissatisfied Other family
from a teacher to receive full early retirement job description description or not agree with new with teaching or personalSchool or teacher characteristic retirement system pension benefits incentive or responsibilities responsibilities reform measures as a career reasons
Total 30.2 73.8 27.2 7.9 12.1 9.9 8.2 21.8
SexMale 33.1 76.9 34.2 8.1 15.4 19.7 9.4 10.9Female 29.3 72.7 24.6 7.8 11.0 6.3 7.8 25.7
Teaching statusFull-time 32.1 73.3 27.6 7.4 11.9 10.0 8.6 19.8Part-time 16.6 80.4 20.4 13.8 15.3 8.5 1.9 49.6
RegionNortheast 27.9 68.5 29.3 6.4 13.5 9.8 10.1 18.2Midwest 38.6 78.6 49.1 7.4 9.0 9.5 8.5 22.5South 29.0 73.2 12.1 9.8 15.6 11.1 8.6 24.4West 25.3 71.8 25.7 5.0 7.5 7.5 5.1 17.3
Community typeCentral city 33.5 77.1 20.5 6.2 18.2 13.8 11.2 19.9Urban fringe/large town 26.8 75.8 30.3 9.6 10.6 9.0 7.4 22.1Rural/small town 35.0 66.0 28.9 6.4 7.9 6.8 6.1 23.3
School levelElementary 27.0 71.1 27.5 10.3 13.6 7.3 11.2 22.8Secondary 36.0 77.5 27.1 4.6 10.3 12.8 4.4 20.2Combined 20.0 59.5 16.9 15.8 15.4 17.8 12.8 32.1
School enrollmentLess than 200 students 19.8 41.1 23.2 12.7 8.9 6.6 4.6 43.2200–349 students 21.5 68.1 23.1 7.4 7.1 3.6 3.2 26.0350–499 students 27.3 78.4 36.3 15.3 17.7 15.7 14.7 26.1500–749 students 30.1 68.6 28.0 8.3 11.0 6.5 7.9 20.8750 students or more 35.3 79.3 24.9 5.0 12.1 11.2 7.5 18.4
Minority enrollmentLess than 10 percent 33.2 69.6 31.7 11.7 12.5 10.9 8.5 24.410–34 percent 26.8 74.7 42.7 4.4 6.5 8.9 6.9 23.435 percent or more 30.2 76.8 14.7 6.6 15.0 9.6 8.6 18.7
NOTE: Leavers are teachers who left the teaching profession after the previous school year. Response choices were based on a 5-point scale, and included the following: "Not at all important,""Slightly important," "Somewhat important," "Very important," and "Extremely important." This table includes the percent of leavers collecting a pension who responded "Very important" or"Extremely important." Data for private school teachers are not included as reporting standards were not met (there were too few cases for response categories).
SOURCE: U.S. Department of Education, National Center for Education Statistics, 1999–2000 Schools and Staffing Survey (“Public School Teacher Questionnaire” and “Public Charter School TeacherQuestionnaire”) and 2000–01 Teacher Follow-up Survey ("Questionnaire for Former Teachers").
Very important or extremely important factors in teachers' decisions to retire
21Why Do Teachers Move or Leave?
Table 9. Percentage of public and private school teacher movers and leavers who strongly agreed or strongly disagreed with vari-ous statements about their former schools: 2000–01
Statement Movers Leavers Movers Leavers Movers Leavers Movers Leavers
I was satisfied with my salary. 11.8 12.3 29.1 21.9 7.5 12.7 47.1 34.4The school or district offered satisfactory benefits. 20.9 24.7 11.0 4.8 13.1 18.9 31.4 19.3I was satisfied with the level of job security at the school (e.g., the possibility of being laid off). 37.5 56.3 10.1 7.7 33.2 42.3 23.0 13.7In thinking of all the factors that influenced my satisfaction with teaching in last year's school, overall, I was satisfied. 19.0 29.3 24.4 16.8 18.8 31.1 19.2 12.5In thinking of all the factors that influenced my satisfaction with teaching in general, overall, I was satisfied. † 28.4 † 7.4 † 31.3 † 6.2
The school facility (buildings and grounds) was in need of significant repair. 22.4 14.5 26.1 30.6 17.4 12.5 27.2 34.1The school was located in a safe neighborhood. 40.4 52.0 7.8 3.3 51.6 56.7 6.7 3.8I felt safe at the school. 40.1 53.5 6.0 2.2 62.2 58.6 1.4 0.9The school’s security policies and practices were sufficient. 33.1 39.2 9.2 4.5 36.4 46.7 5.3 2.8
Student behavior was a problem. 24.9 12.8 15.0 20.0 10.7 11.1 33.9 36.4Most of the students in the school were motivated to learn. 16.7 19.7 12.0 9.8 33.9 32.3 6.6 6.9
The school emphasized academic success. 35.3 49.4 5.9 2.3 48.4 55.1 4.6 3.2I received little support from parents. 18.2 9.7 17.4 24.8 10.6 4.3 39.7 41.0The school received little support from the community. 14.4 5.1 23.8 27.0 12.7 6.1 30.3 34.1
The procedures for teacher performance evaluation were satisfactory. 20.3 24.2 10.8 10.9 22.1 21.6 21.7 15.0I was satisfied with the policies and practices for assigning students to classes or sections for instruction. 17.5 18.7 15.4 13.2 28.7 24.1 10.2 9.6Some of the classes or sections I taught were too large. 27.6 26.1 19.1 18.4 17.0 10.9 39.2 41.4I was satisfied with the grade(s) I was assigned to teach. 54.5 64.1 7.0 3.4 54.2 60.0 4.7 2.7I was satisfied with the subject(s) I was assigned to teach. 54.7 67.2 4.5 1.0 62.6 63.6 3.9 3.8I often felt that my teaching workload was too heavy. 30.6 24.2 10.8 13.6 26.1 17.4 19.7 20.3
At last year’s school, including (mainstreaming) special needs (e.g., disabled) students in regular classes made it difficult for me to teach. 17.2 12.2 18.7 25.5 7.0 5.3 31.8 34.3
I did not have enough influence over the school’s policies and practices. 23.5 13.7 9.0 13.2 29.0 17.0 12.7 13.9I was satisfied with the amount of autonomy and control I had over my own classroom. 32.1 46.1 7.0 4.4 41.8 52.6 9.1 2.7
Computers and other technology for my classroom(s) were sufficiently available. 19.7 23.5 24.0 18.3 19.9 22.3 25.0 17.5Resources and materials/equipment for my classroom(s) were sufficiently available. 22.3 26.6 19.6 12.7 22.9 23.1 13.5 12.1There was not enough time available for planning and preparation during a typical week at the school. 33.4 34.1 7.8 13.9 31.1 26.0 15.2 19.2There was not enough uninterrupted class time available for instruction. 12.3 10.4 14.6 23.5 13.8 13.2 19.3 25.8
The professional caliber of the faculty at the school was high. 28.6 41.5 8.1 2.2 33.3 43.9 7.1 7.2There were many opportunities to collaborate with other teachers in the school. 17.7 20.7 16.5 15.5 26.5 25.9 15.8 9.6The school administrators’ behavior toward the staff was supportive and encouraging. 25.9 38.6 24.3 13.3 31.3 41.3 26.3 17.8
I was pleased with the opportunities for professional advancement (promotion) offered to teachers at the school. 11.0 13.7 18.8 16.2 17.7 10.0 26.9 23.4
I was pleased with the opportunities for professional development (learning/training) offered to teachers at the school. 16.0 20.9 10.8 12.5 19.9 13.7 24.2 18.2Required professional development activities at the school usually closely matched my professional development goals. 11.3 14.7 19.2 20.4 12.5 12.9 20.4 16.3
† Not applicable.
NOTE: Movers are teachers who were still teaching in the current school year but had moved to a different school after the previous school year. Leavers are teachers who left the teaching pro-fession after the previous school year. Response choices were based on a 5-point scale, and included the following: "Strongly agree," "Somewhat agree," "Neither agree nor disagree," "Somewhatdisagree," and "Strongly disagree." This table includes the percent of movers and leavers who responded "Strongly agree" or "Strongly disagree."
SOURCE: U.S. Department of Education, National Center for Education Statistics, 2000–01 Teacher Follow-up Survey ("Questionnaire for Current Teachers" and "Questionnaire for FormerTeachers").
Public PrivateStrongly agreed Strongly disagreedStrongly agreed Strongly disagreed
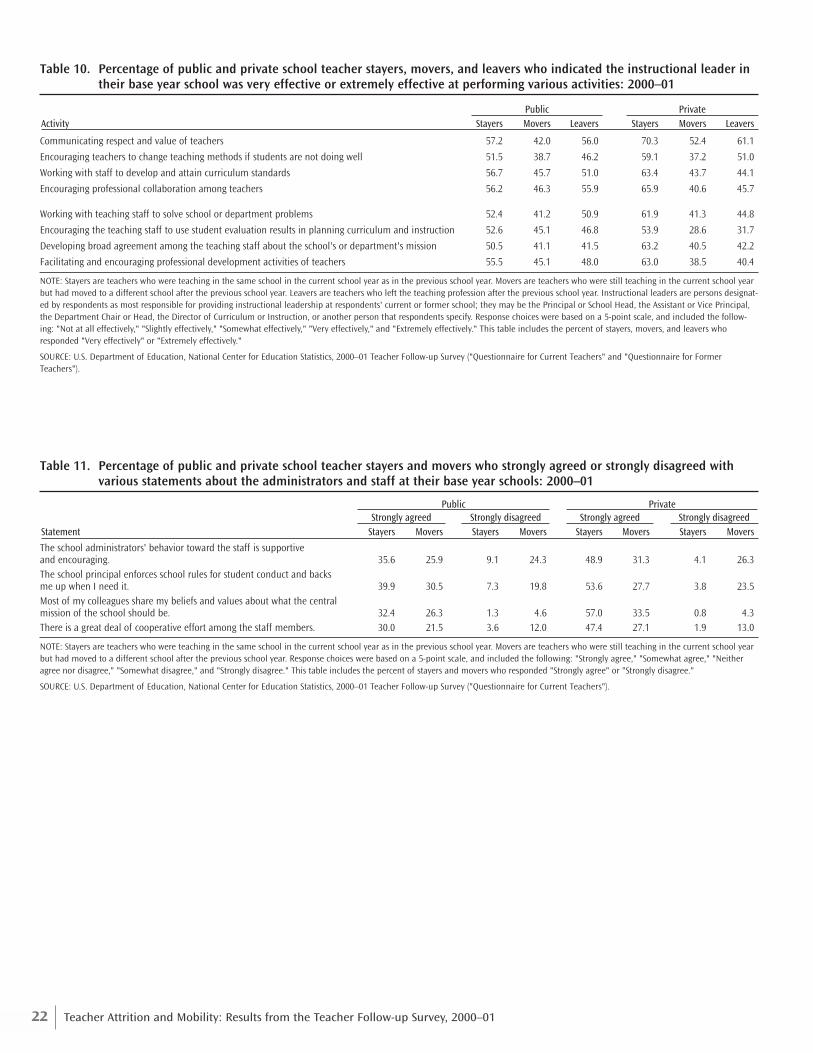
22 Teacher Attrition and Mobility: Results from the Teacher Follow-up Survey, 2000–01
Table 10. Percentage of public and private school teacher stayers, movers, and leavers who indicated the instructional leader intheir base year school was very effective or extremely effective at performing various activities: 2000–01
Activity Stayers Movers Leavers Stayers Movers Leavers
Communicating respect and value of teachers 57.2 42.0 56.0 70.3 52.4 61.1
Encouraging teachers to change teaching methods if students are not doing well 51.5 38.7 46.2 59.1 37.2 51.0
Working with staff to develop and attain curriculum standards 56.7 45.7 51.0 63.4 43.7 44.1
Encouraging professional collaboration among teachers 56.2 46.3 55.9 65.9 40.6 45.7
Working with teaching staff to solve school or department problems 52.4 41.2 50.9 61.9 41.3 44.8
Encouraging the teaching staff to use student evaluation results in planning curriculum and instruction 52.6 45.1 46.8 53.9 28.6 31.7
Developing broad agreement among the teaching staff about the school's or department's mission 50.5 41.1 41.5 63.2 40.5 42.2
Facilitating and encouraging professional development activities of teachers 55.5 45.1 48.0 63.0 38.5 40.4
NOTE: Stayers are teachers who were teaching in the same school in the current school year as in the previous school year. Movers are teachers who were still teaching in the current school yearbut had moved to a different school after the previous school year. Leavers are teachers who left the teaching profession after the previous school year. Instructional leaders are persons designat-ed by respondents as most responsible for providing instructional leadership at respondents' current or former school; they may be the Principal or School Head, the Assistant or Vice Principal,the Department Chair or Head, the Director of Curriculum or Instruction, or another person that respondents specify. Response choices were based on a 5-point scale, and included the follow-ing: "Not at all effectively," "Slightly effectively," "Somewhat effectively," "Very effectively," and "Extremely effectively." This table includes the percent of stayers, movers, and leavers whoresponded "Very effectively" or "Extremely effectively."
SOURCE: U.S. Department of Education, National Center for Education Statistics, 2000–01 Teacher Follow-up Survey ("Questionnaire for Current Teachers" and "Questionnaire for FormerTeachers").
Public Private
Table 11. Percentage of public and private school teacher stayers and movers who strongly agreed or strongly disagreed withvarious statements about the administrators and staff at their base year schools: 2000–01
Statement Stayers Movers Stayers Movers Stayers Movers Stayers Movers
The school administrators' behavior toward the staff is supportive and encouraging. 35.6 25.9 9.1 24.3 48.9 31.3 4.1 26.3The school principal enforces school rules for student conduct and backs me up when I need it. 39.9 30.5 7.3 19.8 53.6 27.7 3.8 23.5Most of my colleagues share my beliefs and values about what the central mission of the school should be. 32.4 26.3 1.3 4.6 57.0 33.5 0.8 4.3There is a great deal of cooperative effort among the staff members. 30.0 21.5 3.6 12.0 47.4 27.1 1.9 13.0
NOTE: Stayers are teachers who were teaching in the same school in the current school year as in the previous school year. Movers are teachers who were still teaching in the current school yearbut had moved to a different school after the previous school year. Response choices were based on a 5-point scale, and included the following: "Strongly agree," "Somewhat agree," "Neitheragree nor disagree," "Somewhat disagree," and "Strongly disagree." This table includes the percent of stayers and movers who responded "Strongly agree" or "Strongly disagree."
SOURCE: U.S. Department of Education, National Center for Education Statistics, 2000–01 Teacher Follow-up Survey ("Questionnaire for Current Teachers").
Public PrivateStrongly agreed Strongly disagreedStrongly agreed Strongly disagreed
23Where Do Teachers Go When They Move or Leave?
Where Do Teachers Go When They Move or Leave?
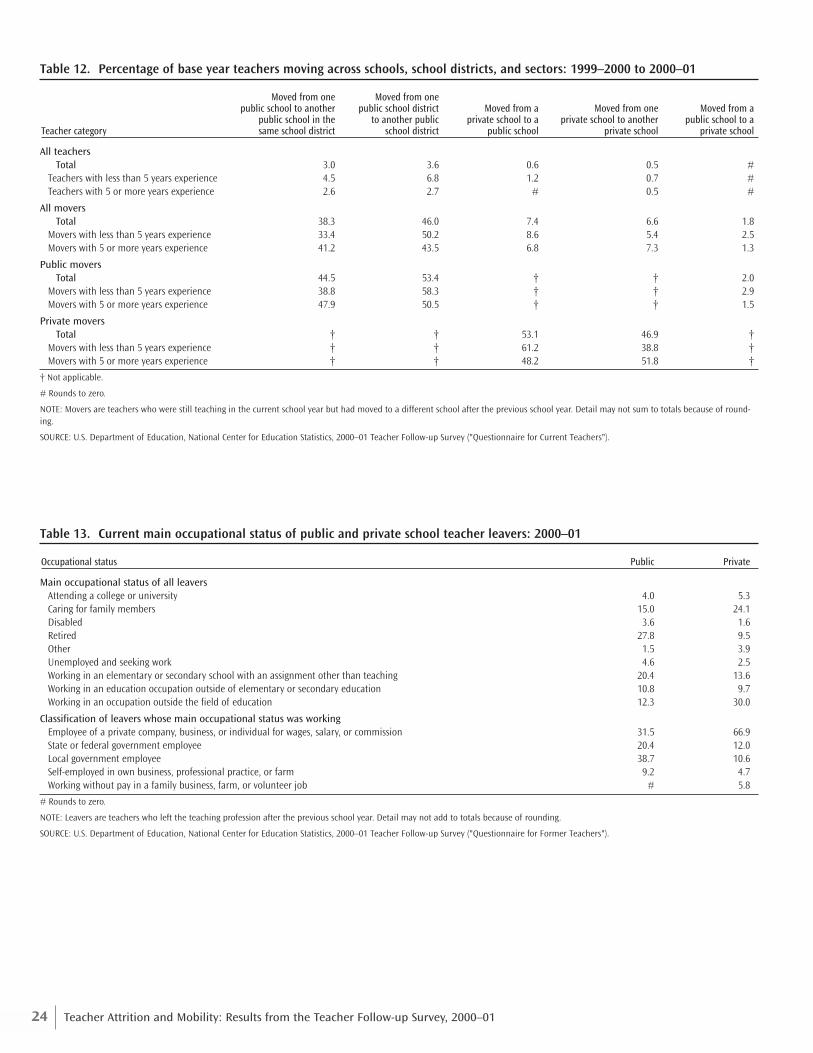
24 Teacher Attrition and Mobility: Results from the Teacher Follow-up Survey, 2000–01
Table 13. Current main occupational status of public and private school teacher leavers: 2000–01
Occupational status Public Private
Main occupational status of all leavers Attending a college or university 4.0 5.3Caring for family members 15.0 24.1Disabled 3.6 1.6Retired 27.8 9.5Other 1.5 3.9Unemployed and seeking work 4.6 2.5Working in an elementary or secondary school with an assignment other than teaching 20.4 13.6Working in an education occupation outside of elementary or secondary education 10.8 9.7Working in an occupation outside the field of education 12.3 30.0
Classification of leavers whose main occupational status was working Employee of a private company, business, or individual for wages, salary, or commission 31.5 66.9State or federal government employee 20.4 12.0Local government employee 38.7 10.6Self-employed in own business, professional practice, or farm 9.2 4.7Working without pay in a family business, farm, or volunteer job # 5.8
# Rounds to zero.
NOTE: Leavers are teachers who left the teaching profession after the previous school year. Detail may not add to totals because of rounding.
SOURCE: U.S. Department of Education, National Center for Education Statistics, 2000–01 Teacher Follow-up Survey ("Questionnaire for Former Teachers").
Table 12. Percentage of base year teachers moving across schools, school districts, and sectors: 1999–2000 to 2000–01
Moved from one Moved from onepublic school to another public school district Moved from a Moved from one Moved from a
public school in the to another public private school to a private school to another public school to a Teacher category same school district school district public school private school private school
All teachers Total 3.0 3.6 0.6 0.5 #
Teachers with less than 5 years experience 4.5 6.8 1.2 0.7 #Teachers with 5 or more years experience 2.6 2.7 # 0.5 #
All movers Total 38.3 46.0 7.4 6.6 1.8
Movers with less than 5 years experience 33.4 50.2 8.6 5.4 2.5Movers with 5 or more years experience 41.2 43.5 6.8 7.3 1.3
Public movers Total 44.5 53.4 † † 2.0
Movers with less than 5 years experience 38.8 58.3 † † 2.9Movers with 5 or more years experience 47.9 50.5 † † 1.5
Private moversTotal † † 53.1 46.9 †
Movers with less than 5 years experience † † 61.2 38.8 †Movers with 5 or more years experience † † 48.2 51.8 †
† Not applicable.
# Rounds to zero.
NOTE: Movers are teachers who were still teaching in the current school year but had moved to a different school after the previous school year. Detail may not sum to totals because of round-ing.
SOURCE: U.S. Department of Education, National Center for Education Statistics, 2000–01 Teacher Follow-up Survey ("Questionnaire for Current Teachers").
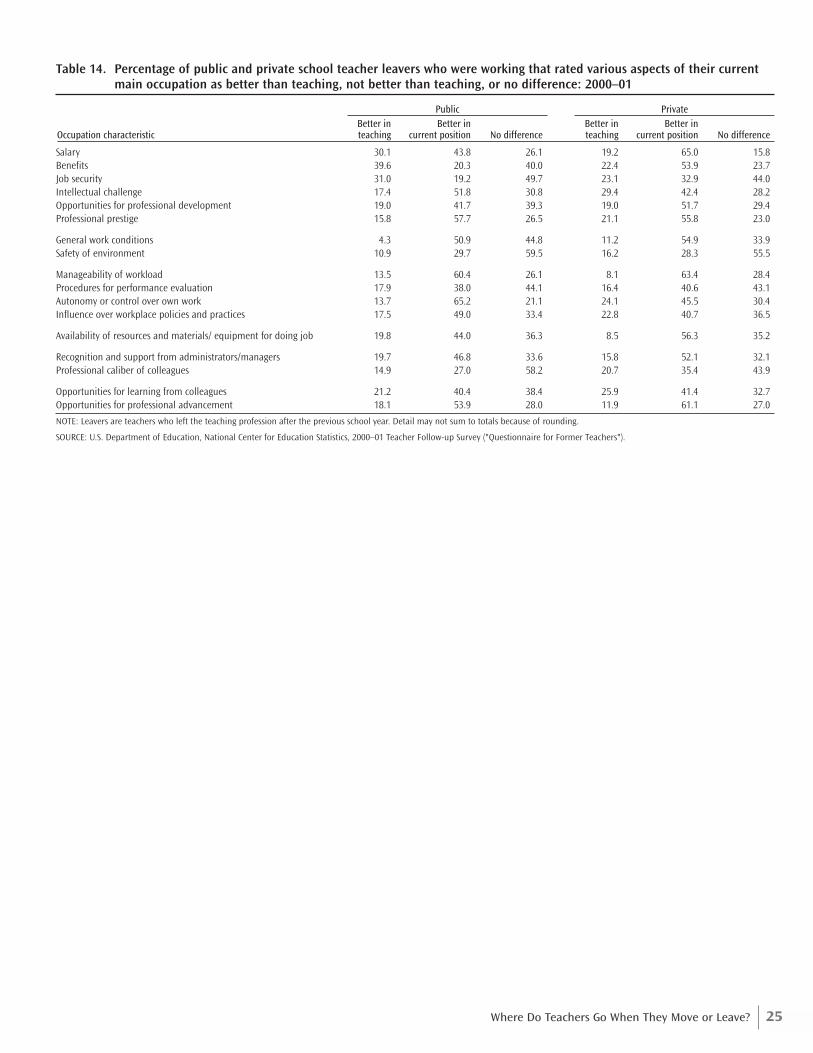
25Where Do Teachers Go When They Move or Leave?
Table 14. Percentage of public and private school teacher leavers who were working that rated various aspects of their currentmain occupation as better than teaching, not better than teaching, or no difference: 2000–01
Better in Better in Better in Better inOccupation characteristic teaching current position No difference teaching current position No difference
Salary 30.1 43.8 26.1 19.2 65.0 15.8Benefits 39.6 20.3 40.0 22.4 53.9 23.7Job security 31.0 19.2 49.7 23.1 32.9 44.0Intellectual challenge 17.4 51.8 30.8 29.4 42.4 28.2Opportunities for professional development 19.0 41.7 39.3 19.0 51.7 29.4Professional prestige 15.8 57.7 26.5 21.1 55.8 23.0
General work conditions 4.3 50.9 44.8 11.2 54.9 33.9Safety of environment 10.9 29.7 59.5 16.2 28.3 55.5
Manageability of workload 13.5 60.4 26.1 8.1 63.4 28.4Procedures for performance evaluation 17.9 38.0 44.1 16.4 40.6 43.1Autonomy or control over own work 13.7 65.2 21.1 24.1 45.5 30.4Influence over workplace policies and practices 17.5 49.0 33.4 22.8 40.7 36.5
Availability of resources and materials/ equipment for doing job 19.8 44.0 36.3 8.5 56.3 35.2
Recognition and support from administrators/managers 19.7 46.8 33.6 15.8 52.1 32.1Professional caliber of colleagues 14.9 27.0 58.2 20.7 35.4 43.9
Opportunities for learning from colleagues 21.2 40.4 38.4 25.9 41.4 32.7Opportunities for professional advancement 18.1 53.9 28.0 11.9 61.1 27.0
NOTE: Leavers are teachers who left the teaching profession after the previous school year. Detail may not sum to totals because of rounding.
SOURCE: U.S. Department of Education, National Center for Education Statistics, 2000–01 Teacher Follow-up Survey ("Questionnaire for Former Teachers").
Public Private

26 Teacher Attrition and Mobility: Results from the Teacher Follow-up Survey, 2000–01
27Appendix A: Standard Error Tables
Appendix A: Standard Error Tables
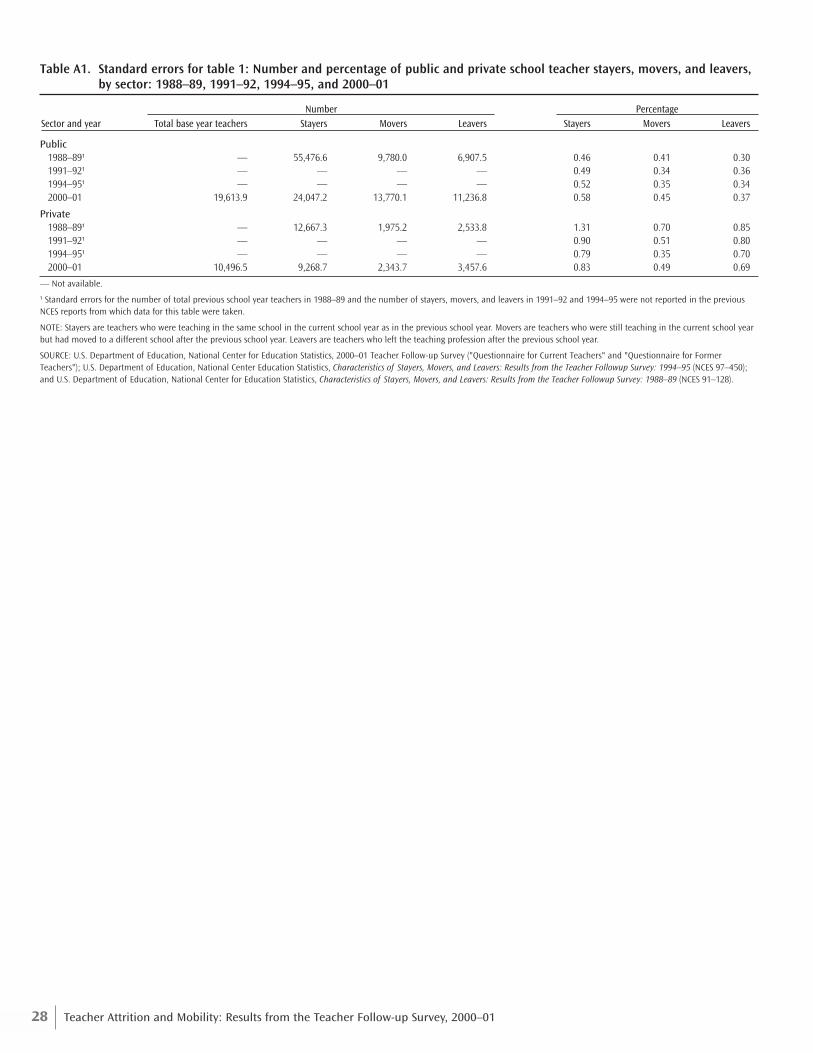
28 Teacher Attrition and Mobility: Results from the Teacher Follow-up Survey, 2000–01
Table A1. Standard errors for table 1: Number and percentage of public and private school teacher stayers, movers, and leavers,by sector: 1988–89, 1991–92, 1994–95, and 2000–01
Sector and year Total base year teachers Stayers Movers Leavers Stayers Movers Leavers
Public1988–89¹ — 55,476.6 9,780.0 6,907.5 0.46 0.41 0.301991–92¹ — — — — 0.49 0.34 0.361994–95¹ — — — — 0.52 0.35 0.342000–01 19,613.9 24,047.2 13,770.1 11,236.8 0.58 0.45 0.37
Private1988–89¹ — 12,667.3 1,975.2 2,533.8 1.31 0.70 0.851991–92¹ — — — — 0.90 0.51 0.801994–95¹ — — — — 0.79 0.35 0.702000–01 10,496.5 9,268.7 2,343.7 3,457.6 0.83 0.49 0.69
— Not available.
¹ Standard errors for the number of total previous school year teachers in 1988–89 and the number of stayers, movers, and leavers in 1991–92 and 1994–95 were not reported in the previousNCES reports from which data for this table were taken.
NOTE: Stayers are teachers who were teaching in the same school in the current school year as in the previous school year. Movers are teachers who were still teaching in the current school yearbut had moved to a different school after the previous school year. Leavers are teachers who left the teaching profession after the previous school year.
SOURCE: U.S. Department of Education, National Center for Education Statistics, 2000–01 Teacher Follow-up Survey ("Questionnaire for Current Teachers" and "Questionnaire for FormerTeachers"); U.S. Department of Education, National Center Education Statistics, Characteristics of Stayers, Movers, and Leavers: Results from the Teacher Followup Survey: 1994–95 (NCES 97–450);and U.S. Department of Education, National Center for Education Statistics, Characteristics of Stayers, Movers, and Leavers: Results from the Teacher Followup Survey: 1988–89 (NCES 91–128).
PercentageNumber
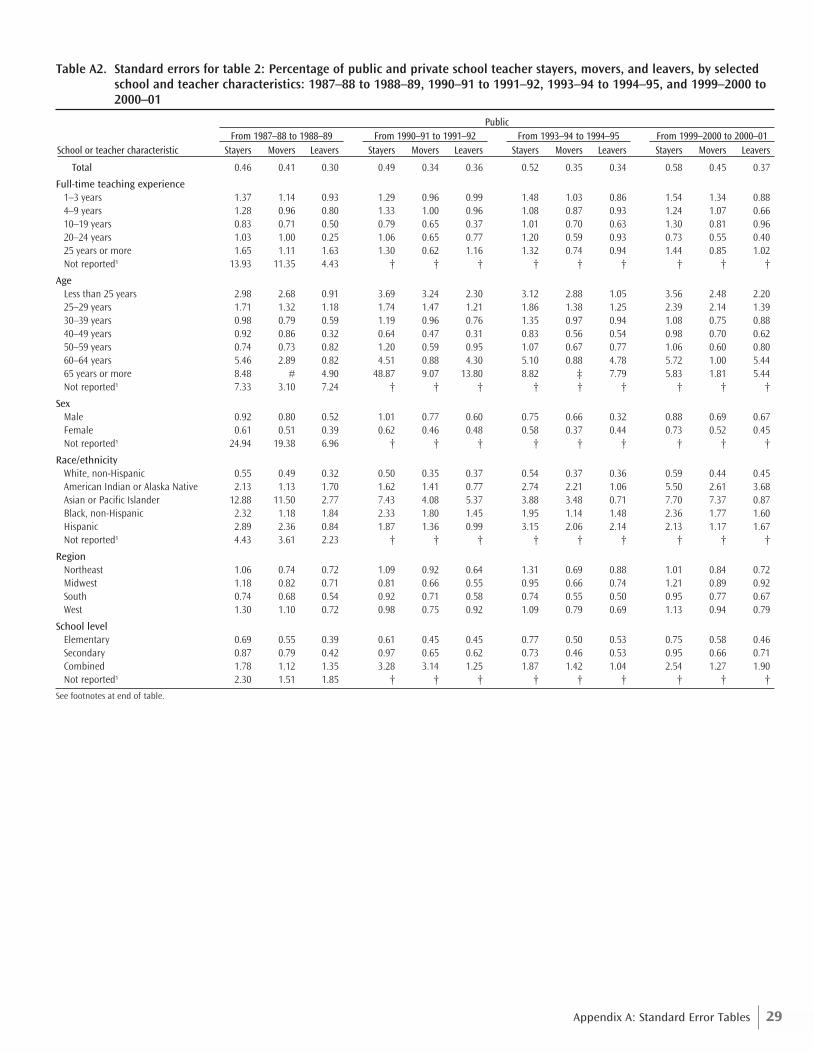
29Appendix A: Standard Error Tables
Table A2. Standard errors for table 2: Percentage of public and private school teacher stayers, movers, and leavers, by selectedschool and teacher characteristics: 1987–88 to 1988–89, 1990–91 to 1991–92, 1993–94 to 1994–95, and 1999–2000 to2000–01
School or teacher characteristic Stayers Movers Leavers Stayers Movers Leavers Stayers Movers Leavers Stayers Movers Leavers
Total 0.46 0.41 0.30 0.49 0.34 0.36 0.52 0.35 0.34 0.58 0.45 0.37
Full-time teaching experience1–3 years 1.37 1.14 0.93 1.29 0.96 0.99 1.48 1.03 0.86 1.54 1.34 0.884–9 years 1.28 0.96 0.80 1.33 1.00 0.96 1.08 0.87 0.93 1.24 1.07 0.6610–19 years 0.83 0.71 0.50 0.79 0.65 0.37 1.01 0.70 0.63 1.30 0.81 0.9620–24 years 1.03 1.00 0.25 1.06 0.65 0.77 1.20 0.59 0.93 0.73 0.55 0.4025 years or more 1.65 1.11 1.63 1.30 0.62 1.16 1.32 0.74 0.94 1.44 0.85 1.02Not reported¹ 13.93 11.35 4.43 † † † † † † † † †
AgeLess than 25 years 2.98 2.68 0.91 3.69 3.24 2.30 3.12 2.88 1.05 3.56 2.48 2.2025–29 years 1.71 1.32 1.18 1.74 1.47 1.21 1.86 1.38 1.25 2.39 2.14 1.3930–39 years 0.98 0.79 0.59 1.19 0.96 0.76 1.35 0.97 0.94 1.08 0.75 0.8840–49 years 0.92 0.86 0.32 0.64 0.47 0.31 0.83 0.56 0.54 0.98 0.70 0.6250–59 years 0.74 0.73 0.82 1.20 0.59 0.95 1.07 0.67 0.77 1.06 0.60 0.8060–64 years 5.46 2.89 0.82 4.51 0.88 4.30 5.10 0.88 4.78 5.72 1.00 5.4465 years or more 8.48 # 4.90 48.87 9.07 13.80 8.82 ‡ 7.79 5.83 1.81 5.44Not reported¹ 7.33 3.10 7.24 † † † † † † † † †
SexMale 0.92 0.80 0.52 1.01 0.77 0.60 0.75 0.66 0.32 0.88 0.69 0.67Female 0.61 0.51 0.39 0.62 0.46 0.48 0.58 0.37 0.44 0.73 0.52 0.45Not reported¹ 24.94 19.38 6.96 † † † † † † † † †
Race/ethnicityWhite, non-Hispanic 0.55 0.49 0.32 0.50 0.35 0.37 0.54 0.37 0.36 0.59 0.44 0.45American Indian or Alaska Native 2.13 1.13 1.70 1.62 1.41 0.77 2.74 2.21 1.06 5.50 2.61 3.68Asian or Pacific Islander 12.88 11.50 2.77 7.43 4.08 5.37 3.88 3.48 0.71 7.70 7.37 0.87Black, non-Hispanic 2.32 1.18 1.84 2.33 1.80 1.45 1.95 1.14 1.48 2.36 1.77 1.60Hispanic 2.89 2.36 0.84 1.87 1.36 0.99 3.15 2.06 2.14 2.13 1.17 1.67Not reported¹ 4.43 3.61 2.23 † † † † † † † † †
RegionNortheast 1.06 0.74 0.72 1.09 0.92 0.64 1.31 0.69 0.88 1.01 0.84 0.72Midwest 1.18 0.82 0.71 0.81 0.66 0.55 0.95 0.66 0.74 1.21 0.89 0.92South 0.74 0.68 0.54 0.92 0.71 0.58 0.74 0.55 0.50 0.95 0.77 0.67West 1.30 1.10 0.72 0.98 0.75 0.92 1.09 0.79 0.69 1.13 0.94 0.79
School levelElementary 0.69 0.55 0.39 0.61 0.45 0.45 0.77 0.50 0.53 0.75 0.58 0.46Secondary 0.87 0.79 0.42 0.97 0.65 0.62 0.73 0.46 0.53 0.95 0.66 0.71Combined 1.78 1.12 1.35 3.28 3.14 1.25 1.87 1.42 1.04 2.54 1.27 1.90Not reported¹ 2.30 1.51 1.85 † † † † † † † † †
See footnotes at end of table.
From 1990–91 to 1991–92 From 1993–94 to 1994–95From 1987–88 to 1988–89 From 1999–2000 to 2000–01Public
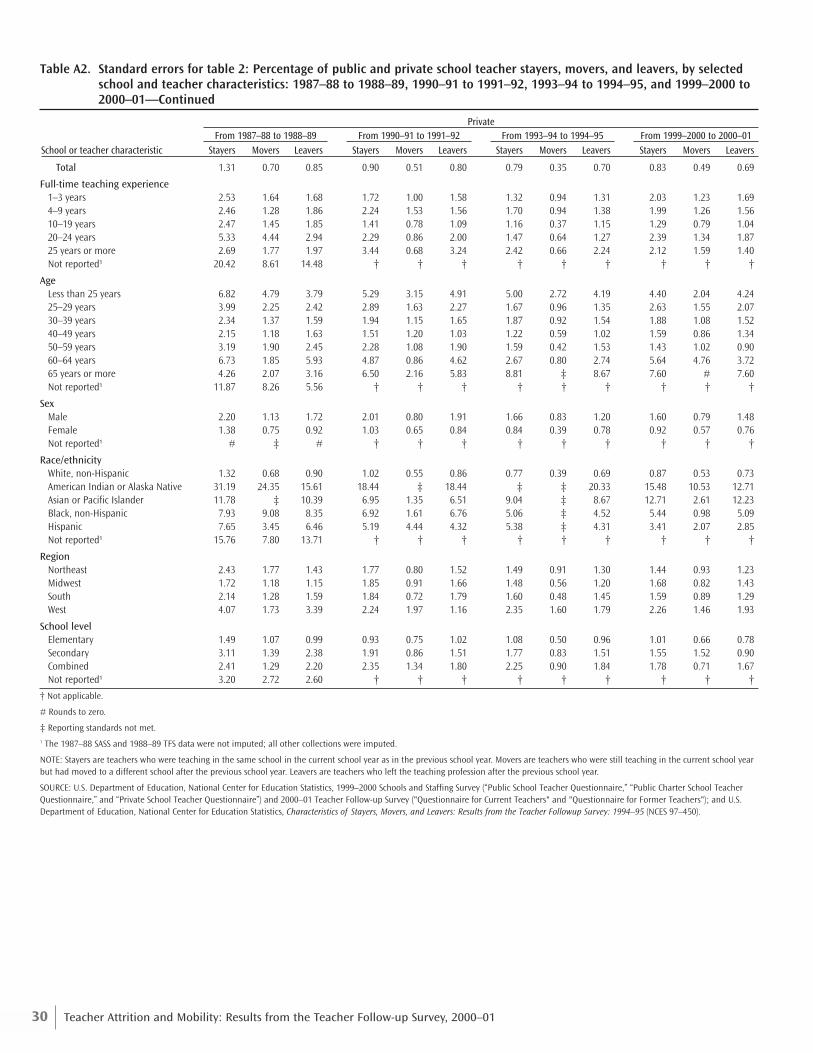
30 Teacher Attrition and Mobility: Results from the Teacher Follow-up Survey, 2000–01
Table A2. Standard errors for table 2: Percentage of public and private school teacher stayers, movers, and leavers, by selectedschool and teacher characteristics: 1987–88 to 1988–89, 1990–91 to 1991–92, 1993–94 to 1994–95, and 1999–2000 to2000–01—Continued
School or teacher characteristic Stayers Movers Leavers Stayers Movers Leavers Stayers Movers Leavers Stayers Movers Leavers
Total 1.31 0.70 0.85 0.90 0.51 0.80 0.79 0.35 0.70 0.83 0.49 0.69
Full-time teaching experience1–3 years 2.53 1.64 1.68 1.72 1.00 1.58 1.32 0.94 1.31 2.03 1.23 1.694–9 years 2.46 1.28 1.86 2.24 1.53 1.56 1.70 0.94 1.38 1.99 1.26 1.5610–19 years 2.47 1.45 1.85 1.41 0.78 1.09 1.16 0.37 1.15 1.29 0.79 1.0420–24 years 5.33 4.44 2.94 2.29 0.86 2.00 1.47 0.64 1.27 2.39 1.34 1.8725 years or more 2.69 1.77 1.97 3.44 0.68 3.24 2.42 0.66 2.24 2.12 1.59 1.40Not reported¹ 20.42 8.61 14.48 † † † † † † † † †
AgeLess than 25 years 6.82 4.79 3.79 5.29 3.15 4.91 5.00 2.72 4.19 4.40 2.04 4.2425–29 years 3.99 2.25 2.42 2.89 1.63 2.27 1.67 0.96 1.35 2.63 1.55 2.0730–39 years 2.34 1.37 1.59 1.94 1.15 1.65 1.87 0.92 1.54 1.88 1.08 1.5240–49 years 2.15 1.18 1.63 1.51 1.20 1.03 1.22 0.59 1.02 1.59 0.86 1.3450–59 years 3.19 1.90 2.45 2.28 1.08 1.90 1.59 0.42 1.53 1.43 1.02 0.9060–64 years 6.73 1.85 5.93 4.87 0.86 4.62 2.67 0.80 2.74 5.64 4.76 3.7265 years or more 4.26 2.07 3.16 6.50 2.16 5.83 8.81 ‡ 8.67 7.60 # 7.60Not reported¹ 11.87 8.26 5.56 † † † † † † † † †
SexMale 2.20 1.13 1.72 2.01 0.80 1.91 1.66 0.83 1.20 1.60 0.79 1.48Female 1.38 0.75 0.92 1.03 0.65 0.84 0.84 0.39 0.78 0.92 0.57 0.76Not reported¹ # ‡ # † † † † † † † † †
Race/ethnicityWhite, non-Hispanic 1.32 0.68 0.90 1.02 0.55 0.86 0.77 0.39 0.69 0.87 0.53 0.73American Indian or Alaska Native 31.19 24.35 15.61 18.44 ‡ 18.44 ‡ ‡ 20.33 15.48 10.53 12.71Asian or Pacific Islander 11.78 ‡ 10.39 6.95 1.35 6.51 9.04 ‡ 8.67 12.71 2.61 12.23Black, non-Hispanic 7.93 9.08 8.35 6.92 1.61 6.76 5.06 ‡ 4.52 5.44 0.98 5.09Hispanic 7.65 3.45 6.46 5.19 4.44 4.32 5.38 ‡ 4.31 3.41 2.07 2.85Not reported¹ 15.76 7.80 13.71 † † † † † † † † †
RegionNortheast 2.43 1.77 1.43 1.77 0.80 1.52 1.49 0.91 1.30 1.44 0.93 1.23Midwest 1.72 1.18 1.15 1.85 0.91 1.66 1.48 0.56 1.20 1.68 0.82 1.43South 2.14 1.28 1.59 1.84 0.72 1.79 1.60 0.48 1.45 1.59 0.89 1.29West 4.07 1.73 3.39 2.24 1.97 1.16 2.35 1.60 1.79 2.26 1.46 1.93
School levelElementary 1.49 1.07 0.99 0.93 0.75 1.02 1.08 0.50 0.96 1.01 0.66 0.78Secondary 3.11 1.39 2.38 1.91 0.86 1.51 1.77 0.83 1.51 1.55 1.52 0.90Combined 2.41 1.29 2.20 2.35 1.34 1.80 2.25 0.90 1.84 1.78 0.71 1.67Not reported¹ 3.20 2.72 2.60 † † † † † † † † †
† Not applicable.
# Rounds to zero.
‡ Reporting standards not met.1 The 1987–88 SASS and 1988–89 TFS data were not imputed; all other collections were imputed.
NOTE: Stayers are teachers who were teaching in the same school in the current school year as in the previous school year. Movers are teachers who were still teaching in the current school yearbut had moved to a different school after the previous school year. Leavers are teachers who left the teaching profession after the previous school year.
SOURCE: U.S. Department of Education, National Center for Education Statistics, 1999–2000 Schools and Staffing Survey (“Public School Teacher Questionnaire,” “Public Charter School TeacherQuestionnaire,” and “Private School Teacher Questionnaire”) and 2000–01 Teacher Follow-up Survey ("Questionnaire for Current Teachers" and "Questionnaire for Former Teachers"); and U.S.Department of Education, National Center for Education Statistics, Characteristics of Stayers, Movers, and Leavers: Results from the Teacher Followup Survey: 1994–95 (NCES 97–450).
From 1990–91 to 1991–92 From 1993–94 to 1994–95From 1987–88 to 1988–89 From 1999–2000 to 2000–01Private
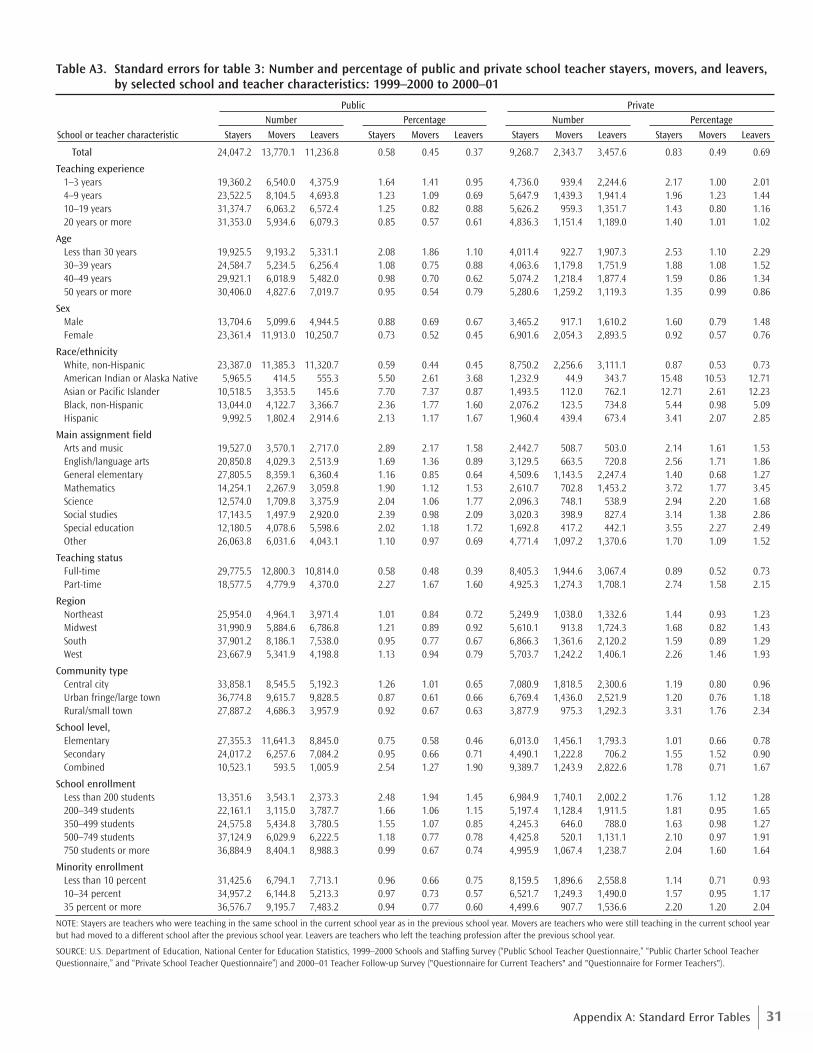
31Appendix A: Standard Error Tables
Table A3. Standard errors for table 3: Number and percentage of public and private school teacher stayers, movers, and leavers,by selected school and teacher characteristics: 1999–2000 to 2000–01
School or teacher characteristic Stayers Movers Leavers Stayers Movers Leavers Stayers Movers Leavers Stayers Movers Leavers
Total 24,047.2 13,770.1 11,236.8 0.58 0.45 0.37 9,268.7 2,343.7 3,457.6 0.83 0.49 0.69
Teaching experience1–3 years 19,360.2 6,540.0 4,375.9 1.64 1.41 0.95 4,736.0 939.4 2,244.6 2.17 1.00 2.014–9 years 23,522.5 8,104.5 4,693.8 1.23 1.09 0.69 5,647.9 1,439.3 1,941.4 1.96 1.23 1.4410–19 years 31,374.7 6,063.2 6,572.4 1.25 0.82 0.88 5,626.2 959.3 1,351.7 1.43 0.80 1.1620 years or more 31,353.0 5,934.6 6,079.3 0.85 0.57 0.61 4,836.3 1,151.4 1,189.0 1.40 1.01 1.02
AgeLess than 30 years 19,925.5 9,193.2 5,331.1 2.08 1.86 1.10 4,011.4 922.7 1,907.3 2.53 1.10 2.2930–39 years 24,584.7 5,234.5 6,256.4 1.08 0.75 0.88 4,063.6 1,179.8 1,751.9 1.88 1.08 1.5240–49 years 29,921.1 6,018.9 5,482.0 0.98 0.70 0.62 5,074.2 1,218.4 1,877.4 1.59 0.86 1.3450 years or more 30,406.0 4,827.6 7,019.7 0.95 0.54 0.79 5,280.6 1,259.2 1,119.3 1.35 0.99 0.86
SexMale 13,704.6 5,099.6 4,944.5 0.88 0.69 0.67 3,465.2 917.1 1,610.2 1.60 0.79 1.48Female 23,361.4 11,913.0 10,250.7 0.73 0.52 0.45 6,901.6 2,054.3 2,893.5 0.92 0.57 0.76
Race/ethnicityWhite, non-Hispanic 23,387.0 11,385.3 11,320.7 0.59 0.44 0.45 8,750.2 2,256.6 3,111.1 0.87 0.53 0.73American Indian or Alaska Native 5,965.5 414.5 555.3 5.50 2.61 3.68 1,232.9 44.9 343.7 15.48 10.53 12.71Asian or Pacific Islander 10,518.5 3,353.5 145.6 7.70 7.37 0.87 1,493.5 112.0 762.1 12.71 2.61 12.23Black, non-Hispanic 13,044.0 4,122.7 3,366.7 2.36 1.77 1.60 2,076.2 123.5 734.8 5.44 0.98 5.09Hispanic 9,992.5 1,802.4 2,914.6 2.13 1.17 1.67 1,960.4 439.4 673.4 3.41 2.07 2.85
Main assignment fieldArts and music 19,527.0 3,570.1 2,717.0 2.89 2.17 1.58 2,442.7 508.7 503.0 2.14 1.61 1.53English/language arts 20,850.8 4,029.3 2,513.9 1.69 1.36 0.89 3,129.5 663.5 720.8 2.56 1.71 1.86General elementary 27,805.5 8,359.1 6,360.4 1.16 0.85 0.64 4,509.6 1,143.5 2,247.4 1.40 0.68 1.27Mathematics 14,254.1 2,267.9 3,059.8 1.90 1.12 1.53 2,610.7 702.8 1,453.2 3.72 1.77 3.45Science 12,574.0 1,709.8 3,375.9 2.04 1.06 1.77 2,096.3 748.1 538.9 2.94 2.20 1.68Social studies 17,143.5 1,497.9 2,920.0 2.39 0.98 2.09 3,020.3 398.9 827.4 3.14 1.38 2.86Special education 12,180.5 4,078.6 5,598.6 2.02 1.18 1.72 1,692.8 417.2 442.1 3.55 2.27 2.49Other 26,063.8 6,031.6 4,043.1 1.10 0.97 0.69 4,771.4 1,097.2 1,370.6 1.70 1.09 1.52
Teaching statusFull-time 29,775.5 12,800.3 10,814.0 0.58 0.48 0.39 8,405.3 1,944.6 3,067.4 0.89 0.52 0.73Part-time 18,577.5 4,779.9 4,370.0 2.27 1.67 1.60 4,925.3 1,274.3 1,708.1 2.74 1.58 2.15
RegionNortheast 25,954.0 4,964.1 3,971.4 1.01 0.84 0.72 5,249.9 1,038.0 1,332.6 1.44 0.93 1.23Midwest 31,990.9 5,884.6 6,786.8 1.21 0.89 0.92 5,610.1 913.8 1,724.3 1.68 0.82 1.43South 37,901.2 8,186.1 7,538.0 0.95 0.77 0.67 6,866.3 1,361.6 2,120.2 1.59 0.89 1.29West 23,667.9 5,341.9 4,198.8 1.13 0.94 0.79 5,703.7 1,242.2 1,406.1 2.26 1.46 1.93
Community typeCentral city 33,858.1 8,545.5 5,192.3 1.26 1.01 0.65 7,080.9 1,818.5 2,300.6 1.19 0.80 0.96Urban fringe/large town 36,774.8 9,615.7 9,828.5 0.87 0.61 0.66 6,769.4 1,436.0 2,521.9 1.20 0.76 1.18Rural/small town 27,887.2 4,686.3 3,957.9 0.92 0.67 0.63 3,877.9 975.3 1,292.3 3.31 1.76 2.34
School level,Elementary 27,355.3 11,641.3 8,845.0 0.75 0.58 0.46 6,013.0 1,456.1 1,793.3 1.01 0.66 0.78Secondary 24,017.2 6,257.6 7,084.2 0.95 0.66 0.71 4,490.1 1,222.8 706.2 1.55 1.52 0.90Combined 10,523.1 593.5 1,005.9 2.54 1.27 1.90 9,389.7 1,243.9 2,822.6 1.78 0.71 1.67
School enrollmentLess than 200 students 13,351.6 3,543.1 2,373.3 2.48 1.94 1.45 6,984.9 1,740.1 2,002.2 1.76 1.12 1.28200–349 students 22,161.1 3,115.0 3,787.7 1.66 1.06 1.15 5,197.4 1,128.4 1,911.5 1.81 0.95 1.65350–499 students 24,575.8 5,434.8 3,780.5 1.55 1.07 0.85 4,245.3 646.0 788.0 1.63 0.98 1.27500–749 students 37,124.9 6,029.9 6,222.5 1.18 0.77 0.78 4,425.8 520.1 1,131.1 2.10 0.97 1.91750 students or more 36,884.9 8,404.1 8,988.3 0.99 0.67 0.74 4,995.9 1,067.4 1,238.7 2.04 1.60 1.64
Minority enrollmentLess than 10 percent 31,425.6 6,794.1 7,713.1 0.96 0.66 0.75 8,159.5 1,896.6 2,558.8 1.14 0.71 0.9310–34 percent 34,957.2 6,144.8 5,213.3 0.97 0.73 0.57 6,521.7 1,249.3 1,490.0 1.57 0.95 1.1735 percent or more 36,576.7 9,195.7 7,483.2 0.94 0.77 0.60 4,499.6 907.7 1,536.6 2.20 1.20 2.04
NOTE: Stayers are teachers who were teaching in the same school in the current school year as in the previous school year. Movers are teachers who were still teaching in the current school yearbut had moved to a different school after the previous school year. Leavers are teachers who left the teaching profession after the previous school year.
SOURCE: U.S. Department of Education, National Center for Education Statistics, 1999–2000 Schools and Staffing Survey (“Public School Teacher Questionnaire,” “Public Charter School TeacherQuestionnaire,” and “Private School Teacher Questionnaire”) and 2000–01 Teacher Follow-up Survey ("Questionnaire for Current Teachers" and "Questionnaire for Former Teachers").
Percentage NumberNumber PercentagePublic Private

32 Teacher Attrition and Mobility: Results from the Teacher Follow-up Survey, 2000–01
Table A4. Standard errors for table 4: Percentage of public and private school teacher stayers, movers, and leavers with variousaverage reported income levels during the base year, by selected school and teacher characteristics: 2000–01
Less than $30,000 to $40,000 Less than $30,000 to $40,000 Less than $30,000 to $40,000School or teacher characteristic $30,000 $39,999 or more $30,000 $39,999 or more $30,000 $39,999 or more
Total 0.87 1.18 1.23 2.00 2.46 2.58 2.17 2.40 2.85
Teaching experience1–3 years 2.47 2.53 1.93 4.57 4.15 2.07 6.19 6.09 2.714–9 years 2.30 2.64 2.41 2.82 4.44 4.32 4.26 4.57 5.6210–19 years 1.80 2.55 2.74 1.91 5.27 5.45 3.86 7.95 7.9220 years or more 1.08 1.62 1.81 3.99 3.69 5.48 1.61 1.12 1.93
AgeLess than 30 years 2.78 3.00 2.56 4.35 5.11 3.58 5.70 5.11 4.1830–39 years 2.38 2.78 2.68 2.77 4.76 4.60 3.77 6.84 7.3840–49 years 1.59 2.29 2.62 2.70 5.16 5.57 4.58 3.36 5.6350 years or more 1.39 2.00 2.05 4.22 4.28 5.64 1.51 3.17 3.65
SexMale 1.52 2.25 2.57 2.50 5.11 5.83 4.63 4.61 5.99Female 0.99 1.30 1.35 2.27 2.79 2.49 2.29 2.75 3.15
Race/ethnicityWhite, non-Hispanic 0.92 1.22 1.21 2.36 2.57 2.71 2.43 2.74 3.20American Indian or Alaska Native 13.78 18.15 18.15 7.61 22.02 22.61 12.44 6.81 14.49Asian or Pacific Islander 2.47 11.99 12.48 6.06 15.63 19.64 3.74 6.71 7.27Black, non-Hispanic 3.59 5.21 4.79 6.71 8.80 10.89 6.42 4.69 7.96Hispanic 3.11 5.68 5.82 8.02 8.62 7.61 12.14 10.64 12.87
Main assignment fieldArts and music 4.97 5.11 5.47 6.11 7.10 10.10 9.07 5.82 8.89English/language arts 2.32 4.50 4.67 5.06 8.23 10.06 6.80 6.14 5.87General elementary 1.59 2.27 2.48 4.44 5.00 3.02 4.04 4.62 4.22Mathematics 4.12 4.95 5.42 6.30 7.87 6.96 8.69 7.98 6.79Science 2.52 5.48 5.15 5.59 7.17 7.79 3.87 8.25 10.70Social studies 3.85 5.41 5.90 5.02 9.61 10.43 1.65 7.99 8.68Special education 2.49 2.96 3.47 3.73 5.80 4.68 5.30 9.91 10.71Other 1.80 2.72 2.79 3.86 8.28 9.79 3.13 4.53 4.87
Teaching statusFull-time 0.86 1.27 1.37 2.21 2.74 2.78 1.96 2.54 2.73Part-time 3.84 3.74 4.48 5.34 5.87 8.92 7.99 8.45 4.94
RegionNortheast 1.38 2.83 2.87 2.43 7.46 7.24 1.83 5.18 5.19Midwest 2.00 2.39 2.85 6.20 4.42 5.83 3.75 5.53 6.68South 1.54 2.00 1.97 2.43 3.82 3.76 3.63 4.20 4.37West 2.31 2.49 2.89 2.68 5.51 5.31 3.44 4.99 4.60
Community typeCentral city 1.73 2.56 2.48 2.82 5.50 6.11 4.13 5.78 4.87Urban fringe/large town 1.05 1.64 1.77 3.41 3.84 3.72 2.79 3.36 4.19Rural/small town 2.22 2.68 2.52 3.86 4.64 2.95 4.26 3.59 3.76
School levelElementary 1.21 1.53 1.51 2.50 2.97 2.60 2.80 3.52 3.52Secondary 1.31 2.00 2.28 2.80 5.06 6.09 2.34 3.40 3.90Combined 6.29 8.74 9.88 7.04 10.03 10.72 7.27 11.83 8.28
School enrollmentLess than 200 students 4.73 4.64 4.46 10.95 5.01 12.93 7.42 4.54 5.14200–349 students 3.13 4.10 4.09 5.30 6.90 4.47 5.41 8.99 6.45350–499 students 2.48 3.00 2.67 8.96 5.17 7.95 3.74 5.77 5.74500–749 students 1.72 2.16 2.36 2.59 3.90 3.29 5.40 4.47 4.54750 students or more 1.26 1.92 1.99 1.66 4.38 4.65 2.58 3.80 4.43
Minority enrollmentLess than 10 percent 1.69 2.20 2.34 3.28 5.00 3.63 4.59 4.07 5.8810–34 percent 1.61 2.75 2.32 3.18 4.50 5.25 3.40 4.80 4.5535 percent or more 1.52 1.89 2.16 3.25 4.24 4.32 3.56 4.22 4.14
See footnotes at end of table.
MoversStayers Leavers
Public

33Appendix A: Standard Error Tables
Table A4. Standard errors for table 4: Percentage of public and private school teacher stayers, movers, and leavers with variousaverage reported income levels during the base year, by selected school and teacher characteristics: 2000–01—Continued
Less than $30,000 to $40,000 Less than $30,000 to $40,000 Less than $30,000 to $40,000School or teacher characteristic $30,000 $39,999 or more $30,000 $39,999 or more $30,000 $39,999 or more
Total 1.60 1.19 1.36 3.09 2.68 2.07 2.88 2.35 2.36
Teaching experience1–9 years 2.24 1.73 1.42 2.92 2.68 1.45 3.63 2.65 3.4310–19 years 3.02 2.88 2.61 6.13 3.58 6.89 7.29 7.17 1.4320 years or more 2.62 2.30 2.66 8.23 10.32 6.52 6.71 6.24 2.77
AgeLess than 30 years 3.29 3.24 1.73 3.76 3.80 0.76 5.80 3.45 5.7030–39 years 3.23 2.69 2.50 6.33 4.29 6.15 5.69 4.18 4.9840–49 years 3.17 2.39 2.51 5.51 4.49 2.48 6.14 5.86 1.3650 years or more 2.66 2.62 2.49 8.99 9.42 5.32 4.83 5.12 1.84
SexMale 2.89 2.40 2.80 5.54 5.38 6.14 6.16 6.11 3.04Female 1.67 1.43 1.39 3.35 3.03 1.51 3.29 2.39 2.88
Teaching statusFull-time 1.74 1.36 1.59 3.03 2.34 2.15 3.07 2.94 1.83Part-time 4.18 3.01 3.40 9.47 9.84 4.18 7.02 3.84 7.21
RegionNortheast 2.68 2.59 2.71 4.49 3.84 2.09 6.29 5.05 5.82Midwest 3.22 2.30 2.64 5.36 5.22 1.27 6.75 3.14 7.22South 3.07 2.08 2.32 5.60 3.12 4.95 3.96 3.71 1.86West 4.09 3.70 3.30 9.24 9.04 4.46 6.60 7.35 3.48
School levelElementary 2.30 1.90 1.62 2.88 2.60 1.54 2.76 2.54 1.26Secondary 3.13 2.73 3.11 7.49 7.98 3.53 6.48 6.54 2.90Combined 3.32 2.21 2.53 7.71 5.55 6.43 5.24 3.93 4.63
School enrollmentLess than 200 students 2.57 2.00 2.24 5.86 5.78 2.10 2.85 2.58 1.82200–349 students 2.86 2.50 1.97 4.38 3.93 2.53 7.05 3.16 7.52350–499 students 3.93 3.21 4.03 7.92 7.33 3.86 6.23 5.84 3.56500–749 students 3.56 3.75 3.51 6.93 6.63 3.54 7.94 6.11 3.88750 students or more 3.46 2.81 3.96 10.85 5.08 10.48 6.89 9.41 9.73
Minority enrollmentLess than 10 percent 1.98 1.53 1.84 3.80 2.73 2.85 3.74 2.58 3.7710–34 percent 3.08 2.62 2.47 6.70 6.65 3.63 5.18 5.09 2.8035 percent or more 4.18 3.34 4.10 6.43 6.12 2.67 8.00 5.48 6.99
NOTE: Stayers are teachers who were teaching in the same school in the current school year as in the previous school year. Movers are teachers who were still teaching in the current school yearbut had moved to a different school after the previous school year. Leavers are teachers who left the teaching profession after the previous school year. For more information regarding publicand private school teachers’ average salaries and earned income, please see tables 76–79 in the Digest of Education Statistics 2002 (NCES 2003–060), U.S. Department of Education, NationalCenter for Education Statistics. Some variables and data for public school teachers are not included for private school teachers as reporting standards were not met (there were too few cases forparticular response categories).
SOURCE: U.S. Department of Education, National Center for Education Statistics, 1999–2000 Schools and Staffing Survey (“Public School Teacher Questionnaire,” “Public Charter School TeacherQuestionnaire,” and “Private School Teacher Questionnaire”) and 2000–01 Teacher Follow-up Survey ("Questionnaire for Current Teachers" and "Questionnaire for Former Teachers").
MoversStayers Leavers
Private
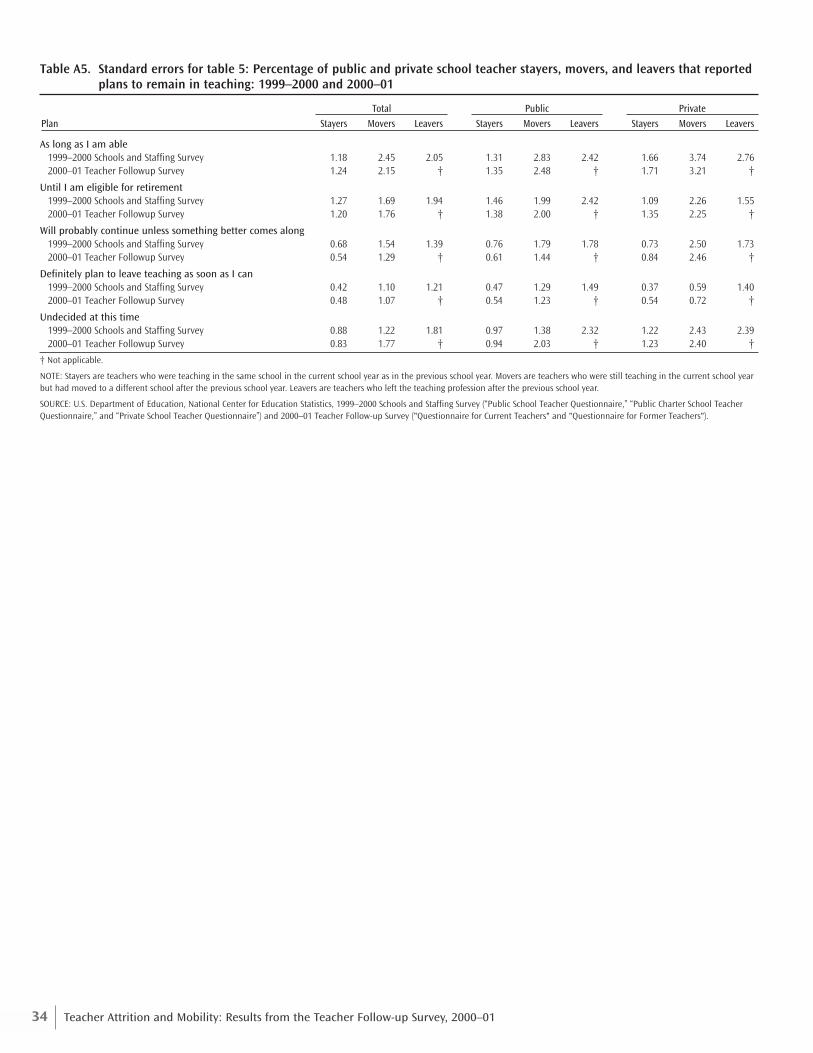
34 Teacher Attrition and Mobility: Results from the Teacher Follow-up Survey, 2000–01
Table A5. Standard errors for table 5: Percentage of public and private school teacher stayers, movers, and leavers that reportedplans to remain in teaching: 1999–2000 and 2000–01
Plan Stayers Movers Leavers Stayers Movers Leavers Stayers Movers Leavers
As long as I am able1999–2000 Schools and Staffing Survey 1.18 2.45 2.05 1.31 2.83 2.42 1.66 3.74 2.762000–01 Teacher Followup Survey 1.24 2.15 † 1.35 2.48 † 1.71 3.21 †
Until I am eligible for retirement1999–2000 Schools and Staffing Survey 1.27 1.69 1.94 1.46 1.99 2.42 1.09 2.26 1.552000–01 Teacher Followup Survey 1.20 1.76 † 1.38 2.00 † 1.35 2.25 †
Will probably continue unless something better comes along 1999–2000 Schools and Staffing Survey 0.68 1.54 1.39 0.76 1.79 1.78 0.73 2.50 1.732000–01 Teacher Followup Survey 0.54 1.29 † 0.61 1.44 † 0.84 2.46 †
Definitely plan to leave teaching as soon as I can1999–2000 Schools and Staffing Survey 0.42 1.10 1.21 0.47 1.29 1.49 0.37 0.59 1.402000–01 Teacher Followup Survey 0.48 1.07 † 0.54 1.23 † 0.54 0.72 †
Undecided at this time1999–2000 Schools and Staffing Survey 0.88 1.22 1.81 0.97 1.38 2.32 1.22 2.43 2.392000–01 Teacher Followup Survey 0.83 1.77 † 0.94 2.03 † 1.23 2.40 †
† Not applicable.
NOTE: Stayers are teachers who were teaching in the same school in the current school year as in the previous school year. Movers are teachers who were still teaching in the current school yearbut had moved to a different school after the previous school year. Leavers are teachers who left the teaching profession after the previous school year.
SOURCE: U.S. Department of Education, National Center for Education Statistics, 1999–2000 Schools and Staffing Survey (“Public School Teacher Questionnaire,” “Public Charter School TeacherQuestionnaire,” and “Private School Teacher Questionnaire”) and 2000–01 Teacher Follow-up Survey ("Questionnaire for Current Teachers" and "Questionnaire for Former Teachers").
PublicTotal Private
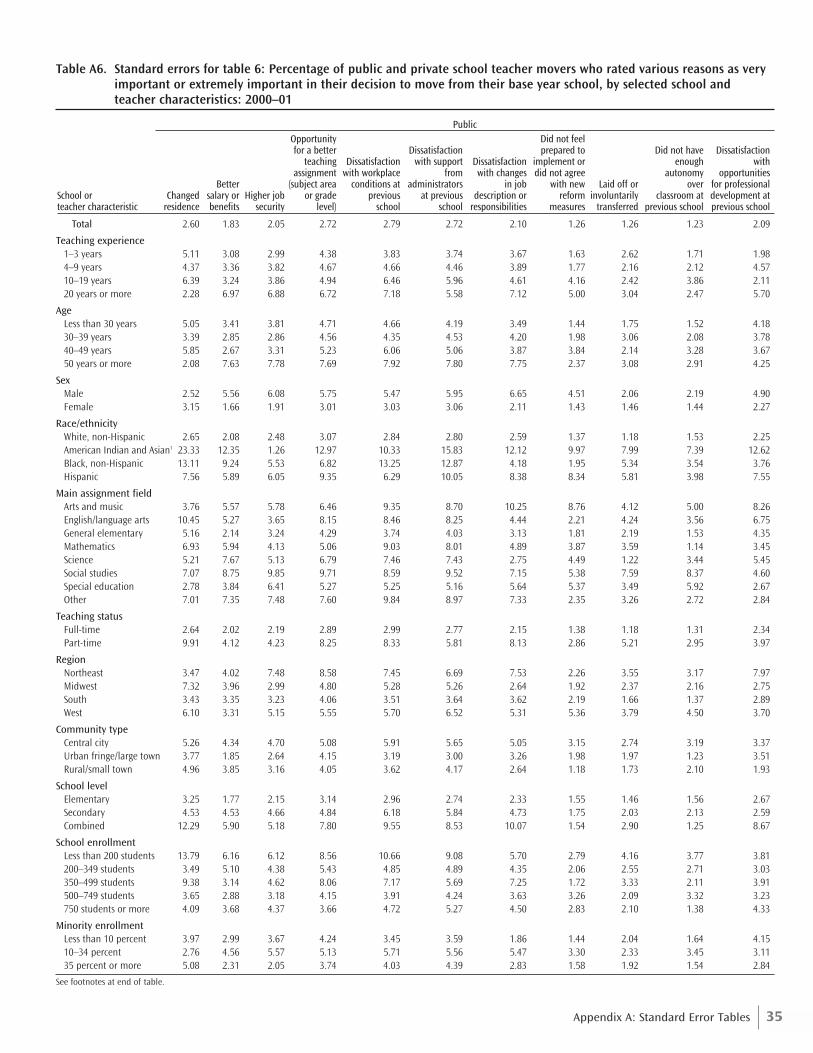
35Appendix A: Standard Error Tables
Table A6. Standard errors for table 6: Percentage of public and private school teacher movers who rated various reasons as veryimportant or extremely important in their decision to move from their base year school, by selected school andteacher characteristics: 2000–01
Opportunity Did not feelfor a better Dissatisfaction prepared to Did not have Dissatisfaction
teaching Dissatisfaction with support Dissatisfaction implement or enough withassignment with workplace from with changes did not agree autonomy opportunities
Better (subject area conditions at administrators in job with new Laid off or over for professionalSchool or Changed salary or Higher job or grade previous at previous description or reform involuntarily classroom at development at teacher characteristic residence benefits security level) school school responsibilities measures transferred previous school previous school
Total 2.60 1.83 2.05 2.72 2.79 2.72 2.10 1.26 1.26 1.23 2.09
Teaching experience1–3 years 5.11 3.08 2.99 4.38 3.83 3.74 3.67 1.63 2.62 1.71 1.984–9 years 4.37 3.36 3.82 4.67 4.66 4.46 3.89 1.77 2.16 2.12 4.5710–19 years 6.39 3.24 3.86 4.94 6.46 5.96 4.61 4.16 2.42 3.86 2.1120 years or more 2.28 6.97 6.88 6.72 7.18 5.58 7.12 5.00 3.04 2.47 5.70
AgeLess than 30 years 5.05 3.41 3.81 4.71 4.66 4.19 3.49 1.44 1.75 1.52 4.1830–39 years 3.39 2.85 2.86 4.56 4.35 4.53 4.20 1.98 3.06 2.08 3.7840–49 years 5.85 2.67 3.31 5.23 6.06 5.06 3.87 3.84 2.14 3.28 3.6750 years or more 2.08 7.63 7.78 7.69 7.92 7.80 7.75 2.37 3.08 2.91 4.25
SexMale 2.52 5.56 6.08 5.75 5.47 5.95 6.65 4.51 2.06 2.19 4.90Female 3.15 1.66 1.91 3.01 3.03 3.06 2.11 1.43 1.46 1.44 2.27
Race/ethnicityWhite, non-Hispanic 2.65 2.08 2.48 3.07 2.84 2.80 2.59 1.37 1.18 1.53 2.25American Indian and Asian1 23.33 12.35 1.26 12.97 10.33 15.83 12.12 9.97 7.99 7.39 12.62Black, non-Hispanic 13.11 9.24 5.53 6.82 13.25 12.87 4.18 1.95 5.34 3.54 3.76Hispanic 7.56 5.89 6.05 9.35 6.29 10.05 8.38 8.34 5.81 3.98 7.55
Main assignment fieldArts and music 3.76 5.57 5.78 6.46 9.35 8.70 10.25 8.76 4.12 5.00 8.26English/language arts 10.45 5.27 3.65 8.15 8.46 8.25 4.44 2.21 4.24 3.56 6.75General elementary 5.16 2.14 3.24 4.29 3.74 4.03 3.13 1.81 2.19 1.53 4.35Mathematics 6.93 5.94 4.13 5.06 9.03 8.01 4.89 3.87 3.59 1.14 3.45Science 5.21 7.67 5.13 6.79 7.46 7.43 2.75 4.49 1.22 3.44 5.45Social studies 7.07 8.75 9.85 9.71 8.59 9.52 7.15 5.38 7.59 8.37 4.60Special education 2.78 3.84 6.41 5.27 5.25 5.16 5.64 5.37 3.49 5.92 2.67Other 7.01 7.35 7.48 7.60 9.84 8.97 7.33 2.35 3.26 2.72 2.84
Teaching statusFull-time 2.64 2.02 2.19 2.89 2.99 2.77 2.15 1.38 1.18 1.31 2.34Part-time 9.91 4.12 4.23 8.25 8.33 5.81 8.13 2.86 5.21 2.95 3.97
RegionNortheast 3.47 4.02 7.48 8.58 7.45 6.69 7.53 2.26 3.55 3.17 7.97Midwest 7.32 3.96 2.99 4.80 5.28 5.26 2.64 1.92 2.37 2.16 2.75South 3.43 3.35 3.23 4.06 3.51 3.64 3.62 2.19 1.66 1.37 2.89West 6.10 3.31 5.15 5.55 5.70 6.52 5.31 5.36 3.79 4.50 3.70
Community typeCentral city 5.26 4.34 4.70 5.08 5.91 5.65 5.05 3.15 2.74 3.19 3.37Urban fringe/large town 3.77 1.85 2.64 4.15 3.19 3.00 3.26 1.98 1.97 1.23 3.51Rural/small town 4.96 3.85 3.16 4.05 3.62 4.17 2.64 1.18 1.73 2.10 1.93
School levelElementary 3.25 1.77 2.15 3.14 2.96 2.74 2.33 1.55 1.46 1.56 2.67Secondary 4.53 4.53 4.66 4.84 6.18 5.84 4.73 1.75 2.03 2.13 2.59Combined 12.29 5.90 5.18 7.80 9.55 8.53 10.07 1.54 2.90 1.25 8.67
School enrollmentLess than 200 students 13.79 6.16 6.12 8.56 10.66 9.08 5.70 2.79 4.16 3.77 3.81200–349 students 3.49 5.10 4.38 5.43 4.85 4.89 4.35 2.06 2.55 2.71 3.03350–499 students 9.38 3.14 4.62 8.06 7.17 5.69 7.25 1.72 3.33 2.11 3.91500–749 students 3.65 2.88 3.18 4.15 3.91 4.24 3.63 3.26 2.09 3.32 3.23750 students or more 4.09 3.68 4.37 3.66 4.72 5.27 4.50 2.83 2.10 1.38 4.33
Minority enrollmentLess than 10 percent 3.97 2.99 3.67 4.24 3.45 3.59 1.86 1.44 2.04 1.64 4.1510–34 percent 2.76 4.56 5.57 5.13 5.71 5.56 5.47 3.30 2.33 3.45 3.1135 percent or more 5.08 2.31 2.05 3.74 4.03 4.39 2.83 1.58 1.92 1.54 2.84
See footnotes at end of table.
Public
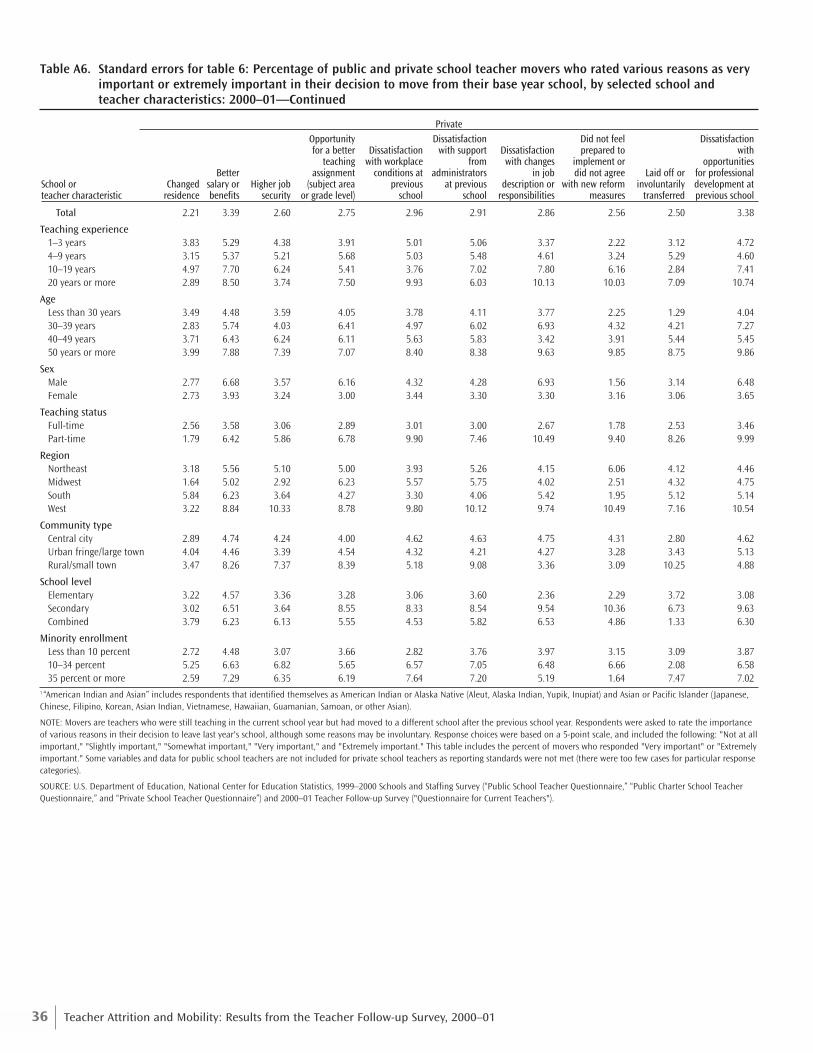
36 Teacher Attrition and Mobility: Results from the Teacher Follow-up Survey, 2000–01
Table A6. Standard errors for table 6: Percentage of public and private school teacher movers who rated various reasons as veryimportant or extremely important in their decision to move from their base year school, by selected school andteacher characteristics: 2000–01—Continued
Opportunity Dissatisfaction Did not feel Dissatisfactionfor a better Dissatisfaction with support Dissatisfaction prepared to with
teaching with workplace from with changes implement or opportunitiesBetter assignment conditions at administrators in job did not agree Laid off or for professional
School or Changed salary or Higher job (subject area previous at previous description or with new reform involuntarily development at teacher characteristic residence benefits security or grade level) school school responsibilities measures transferred previous school
Total 2.21 3.39 2.60 2.75 2.96 2.91 2.86 2.56 2.50 3.38
Teaching experience1–3 years 3.83 5.29 4.38 3.91 5.01 5.06 3.37 2.22 3.12 4.724–9 years 3.15 5.37 5.21 5.68 5.03 5.48 4.61 3.24 5.29 4.6010–19 years 4.97 7.70 6.24 5.41 3.76 7.02 7.80 6.16 2.84 7.4120 years or more 2.89 8.50 3.74 7.50 9.93 6.03 10.13 10.03 7.09 10.74
AgeLess than 30 years 3.49 4.48 3.59 4.05 3.78 4.11 3.77 2.25 1.29 4.0430–39 years 2.83 5.74 4.03 6.41 4.97 6.02 6.93 4.32 4.21 7.2740–49 years 3.71 6.43 6.24 6.11 5.63 5.83 3.42 3.91 5.44 5.4550 years or more 3.99 7.88 7.39 7.07 8.40 8.38 9.63 9.85 8.75 9.86
SexMale 2.77 6.68 3.57 6.16 4.32 4.28 6.93 1.56 3.14 6.48Female 2.73 3.93 3.24 3.00 3.44 3.30 3.30 3.16 3.06 3.65
Teaching statusFull-time 2.56 3.58 3.06 2.89 3.01 3.00 2.67 1.78 2.53 3.46Part-time 1.79 6.42 5.86 6.78 9.90 7.46 10.49 9.40 8.26 9.99
RegionNortheast 3.18 5.56 5.10 5.00 3.93 5.26 4.15 6.06 4.12 4.46Midwest 1.64 5.02 2.92 6.23 5.57 5.75 4.02 2.51 4.32 4.75South 5.84 6.23 3.64 4.27 3.30 4.06 5.42 1.95 5.12 5.14West 3.22 8.84 10.33 8.78 9.80 10.12 9.74 10.49 7.16 10.54
Community typeCentral city 2.89 4.74 4.24 4.00 4.62 4.63 4.75 4.31 2.80 4.62Urban fringe/large town 4.04 4.46 3.39 4.54 4.32 4.21 4.27 3.28 3.43 5.13Rural/small town 3.47 8.26 7.37 8.39 5.18 9.08 3.36 3.09 10.25 4.88
School levelElementary 3.22 4.57 3.36 3.28 3.06 3.60 2.36 2.29 3.72 3.08Secondary 3.02 6.51 3.64 8.55 8.33 8.54 9.54 10.36 6.73 9.63Combined 3.79 6.23 6.13 5.55 4.53 5.82 6.53 4.86 1.33 6.30
Minority enrollmentLess than 10 percent 2.72 4.48 3.07 3.66 2.82 3.76 3.97 3.15 3.09 3.8710–34 percent 5.25 6.63 6.82 5.65 6.57 7.05 6.48 6.66 2.08 6.5835 percent or more 2.59 7.29 6.35 6.19 7.64 7.20 5.19 1.64 7.47 7.02
1 “American Indian and Asian” includes respondents that identified themselves as American Indian or Alaska Native (Aleut, Alaska Indian, Yupik, Inupiat) and Asian or Pacific Islander (Japanese,Chinese, Filipino, Korean, Asian Indian, Vietnamese, Hawaiian, Guamanian, Samoan, or other Asian).
NOTE: Movers are teachers who were still teaching in the current school year but had moved to a different school after the previous school year. Respondents were asked to rate the importanceof various reasons in their decision to leave last year's school, although some reasons may be involuntary. Response choices were based on a 5-point scale, and included the following: "Not at allimportant," "Slightly important," "Somewhat important," "Very important," and "Extremely important." This table includes the percent of movers who responded "Very important" or "Extremelyimportant." Some variables and data for public school teachers are not included for private school teachers as reporting standards were not met (there were too few cases for particular responsecategories).
SOURCE: U.S. Department of Education, National Center for Education Statistics, 1999–2000 Schools and Staffing Survey (“Public School Teacher Questionnaire,” “Public Charter School TeacherQuestionnaire,” and “Private School Teacher Questionnaire”) and 2000–01 Teacher Follow-up Survey ("Questionnaire for Current Teachers").
Private

37Appendix A: Standard Error Tables
Table A7. Standard errors for table 7: Percentage of public and private school teacher leavers who rated various reasons as veryimportant or extremely important in their decision to leave the teaching profession, by selected school and teachercharacteristics: 2000–01
To takecourses to Did not feel
improve career prepared toopportunities School Dissatisfied implement or
within or received Dissatisfied with changes did not agreeBetter To pursue outside the little support with job in job with new
School or teacher Changed Pregnancy/ salary or another field of from the description or description or reformcharacteristic residence child rearing Health Retirement benefits career education community responsibilities responsibilities measures
Total 1.63 1.88 1.62 2.27 2.08 1.96 1.68 0.87 1.73 1.57 1.27
Teaching experience1–3 years 4.26 4.34 2.09 1.07 5.77 5.99 5.52 3.27 5.42 3.02 3.954–9 years 3.22 4.95 4.51 0.77 5.87 5.61 4.89 1.60 2.95 2.13 1.6310–19 years 4.76 7.04 1.42 4.44 3.76 2.13 1.83 1.14 5.34 5.52 1.7820 years or more 0.71 0.49 3.56 4.69 3.08 1.08 0.85 1.09 1.16 2.34 2.33
AgeLess than 40 years 2.59 4.31 2.35 0.52 4.21 4.35 3.81 1.67 2.72 1.46 1.7440–49 years 4.34 2.27 2.20 4.29 6.60 4.41 2.53 1.82 3.65 3.05 2.9050 years or more 1.61 0.16 3.42 4.00 0.77 1.21 0.98 1.11 3.15 3.63 2.15
SexMale 2.88 1.00 0.98 3.98 4.83 5.43 5.16 1.43 4.52 3.07 3.21Female 1.91 2.33 2.26 2.55 2.29 1.67 1.57 0.99 1.83 1.82 1.10
Race/ethnicityWhite, non-Hispanic 1.64 2.14 1.84 2.28 1.99 2.28 1.95 1.03 2.01 1.54 1.08American Indian and Asian1 2.03 5.66 3.52 5.76 3.91 4.42 3.65 5.89 4.02 12.57 13.48Black, non-Hispanic 1.66 0.91 1.89 10.96 12.63 3.81 2.05 2.08 3.17 2.78 3.14Hispanic 11.63 5.51 1.26 12.17 6.71 6.35 8.72 0.34 4.17 11.74 11.58
Main assignment fieldArts and music 9.29 5.91 10.04 5.31 4.84 9.25 7.15 2.16 1.89 1.59 1.30English/language arts 4.68 4.83 2.57 6.75 4.50 3.83 3.07 1.45 5.13 5.02 2.18General elementary 2.53 3.84 2.07 3.71 3.51 3.64 4.07 1.63 3.14 1.57 1.59Mathematics 7.98 3.40 2.85 5.25 8.96 8.63 9.16 1.90 1.99 1.53 2.91Science 1.38 2.43 19.02 7.37 6.61 6.36 2.58 4.97 4.41 2.40 2.61Social studies 0.47 1.86 2.10 9.81 13.38 13.03 4.82 6.88 7.66 7.29 6.68Special education 1.92 8.39 1.36 6.73 7.41 3.73 3.49 0.78 8.43 8.48 3.36Other 2.94 2.52 2.53 4.96 6.12 3.33 2.94 2.48 3.21 4.77 5.27
Teaching statusFull-time 1.66 1.75 1.79 2.38 2.21 2.04 1.65 0.96 1.83 1.81 1.36Part-time 5.86 8.29 2.26 5.73 7.37 7.94 7.80 2.14 4.95 4.52 3.89
RegionNortheast 3.60 3.24 5.19 4.20 6.09 6.76 2.43 3.00 3.42 3.89 3.51Midwest 2.42 5.41 5.50 4.87 4.95 3.86 2.46 2.00 2.49 2.20 2.93South 2.98 3.33 1.36 3.38 3.37 3.05 3.09 1.10 3.28 3.36 2.35West 3.47 3.97 2.84 4.69 3.79 4.01 5.22 1.82 1.79 1.01 1.74
Community typeCentral city 1.61 4.36 1.86 3.79 4.79 4.79 4.54 1.76 3.79 3.43 3.77Urban fringe/large town 2.72 2.71 2.75 3.44 3.07 2.81 1.18 1.06 2.22 2.12 1.27Rural/small town 2.41 2.00 2.83 3.46 4.24 3.83 4.42 2.18 3.60 3.54 1.91
School levelElementary 2.27 2.89 1.93 2.58 2.56 2.82 2.67 0.97 2.66 2.24 1.27Secondary 2.71 1.60 3.48 4.46 4.07 2.91 1.40 1.35 1.70 2.54 2.43Combined 5.43 2.36 1.30 3.52 7.13 7.92 6.25 13.08 12.84 12.87 11.65
School enrollmentLess than 200 students 3.42 4.54 6.19 3.87 10.59 10.76 11.52 1.35 2.00 1.83 1.09200–349 students 5.02 9.06 2.51 4.57 6.25 4.96 4.63 4.42 7.92 8.12 3.96350–499 students 4.05 5.10 2.03 3.65 4.32 4.42 4.62 2.83 2.61 2.53 3.23500–749 students 4.31 2.10 1.28 3.25 3.79 3.85 4.21 1.36 5.33 3.94 1.67750 students or more 1.83 3.22 3.74 4.61 4.17 3.31 1.50 1.04 1.56 2.40 2.70
Minority enrollmentLess than 10 percent 2.70 2.56 4.34 3.69 3.98 4.85 3.25 1.47 2.07 1.79 2.2310–34 percent 3.61 4.64 2.00 2.85 4.86 2.71 3.12 1.67 2.03 1.72 1.4735 percent or more 2.30 2.71 1.62 3.71 2.91 2.91 2.92 1.36 3.65 3.43 2.54
See footnotes at end of table.
Public
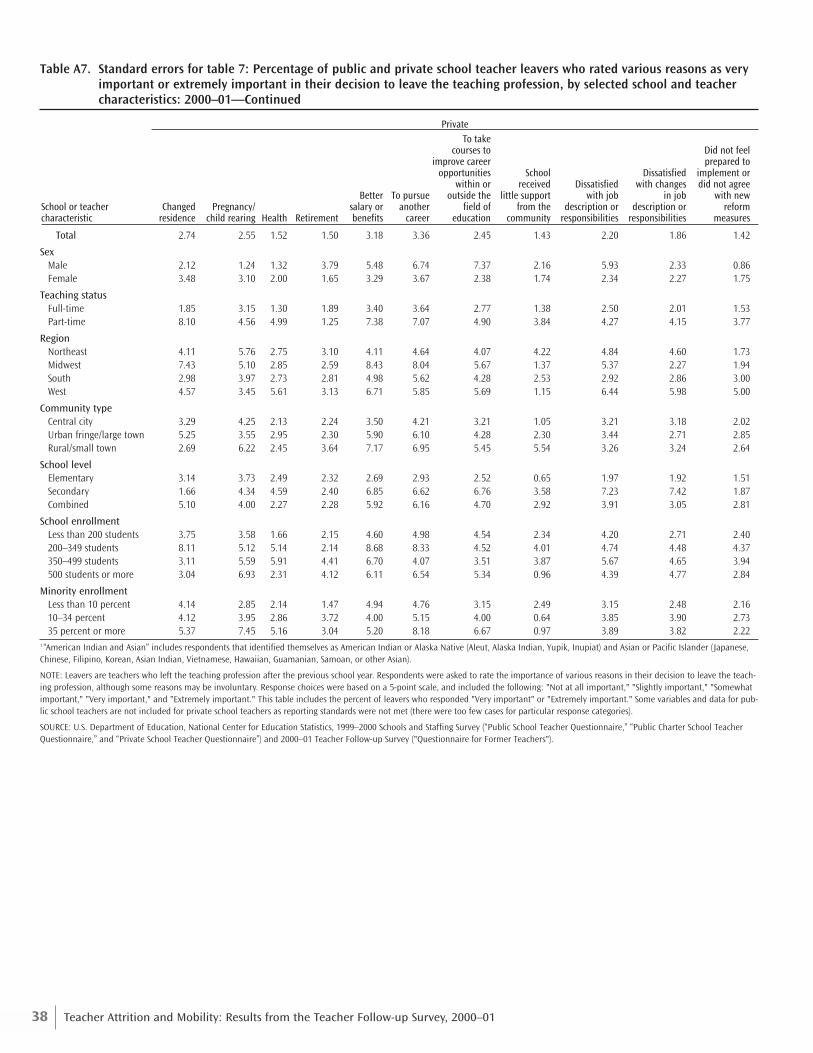
38 Teacher Attrition and Mobility: Results from the Teacher Follow-up Survey, 2000–01
Table A7. Standard errors for table 7: Percentage of public and private school teacher leavers who rated various reasons as veryimportant or extremely important in their decision to leave the teaching profession, by selected school and teachercharacteristics: 2000–01—Continued
To takecourses to Did not feel
improve career prepared toopportunities School Dissatisfied implement or
within or received Dissatisfied with changes did not agreeBetter To pursue outside the little support with job in job with new
School or teacher Changed Pregnancy/ salary or another field of from the description or description or reformcharacteristic residence child rearing Health Retirement benefits career education community responsibilities responsibilities measures
Total 2.74 2.55 1.52 1.50 3.18 3.36 2.45 1.43 2.20 1.86 1.42
SexMale 2.12 1.24 1.32 3.79 5.48 6.74 7.37 2.16 5.93 2.33 0.86Female 3.48 3.10 2.00 1.65 3.29 3.67 2.38 1.74 2.34 2.27 1.75
Teaching statusFull-time 1.85 3.15 1.30 1.89 3.40 3.64 2.77 1.38 2.50 2.01 1.53Part-time 8.10 4.56 4.99 1.25 7.38 7.07 4.90 3.84 4.27 4.15 3.77
RegionNortheast 4.11 5.76 2.75 3.10 4.11 4.64 4.07 4.22 4.84 4.60 1.73Midwest 7.43 5.10 2.85 2.59 8.43 8.04 5.67 1.37 5.37 2.27 1.94South 2.98 3.97 2.73 2.81 4.98 5.62 4.28 2.53 2.92 2.86 3.00West 4.57 3.45 5.61 3.13 6.71 5.85 5.69 1.15 6.44 5.98 5.00
Community typeCentral city 3.29 4.25 2.13 2.24 3.50 4.21 3.21 1.05 3.21 3.18 2.02Urban fringe/large town 5.25 3.55 2.95 2.30 5.90 6.10 4.28 2.30 3.44 2.71 2.85Rural/small town 2.69 6.22 2.45 3.64 7.17 6.95 5.45 5.54 3.26 3.24 2.64
School levelElementary 3.14 3.73 2.49 2.32 2.69 2.93 2.52 0.65 1.97 1.92 1.51Secondary 1.66 4.34 4.59 2.40 6.85 6.62 6.76 3.58 7.23 7.42 1.87Combined 5.10 4.00 2.27 2.28 5.92 6.16 4.70 2.92 3.91 3.05 2.81
School enrollmentLess than 200 students 3.75 3.58 1.66 2.15 4.60 4.98 4.54 2.34 4.20 2.71 2.40200–349 students 8.11 5.12 5.14 2.14 8.68 8.33 4.52 4.01 4.74 4.48 4.37350–499 students 3.11 5.59 5.91 4.41 6.70 4.07 3.51 3.87 5.67 4.65 3.94500 students or more 3.04 6.93 2.31 4.12 6.11 6.54 5.34 0.96 4.39 4.77 2.84
Minority enrollmentLess than 10 percent 4.14 2.85 2.14 1.47 4.94 4.76 3.15 2.49 3.15 2.48 2.1610–34 percent 4.12 3.95 2.86 3.72 4.00 5.15 4.00 0.64 3.85 3.90 2.7335 percent or more 5.37 7.45 5.16 3.04 5.20 8.18 6.67 0.97 3.89 3.82 2.22
1 “American Indian and Asian” includes respondents that identified themselves as American Indian or Alaska Native (Aleut, Alaska Indian, Yupik, Inupiat) and Asian or Pacific Islander (Japanese,Chinese, Filipino, Korean, Asian Indian, Vietnamese, Hawaiian, Guamanian, Samoan, or other Asian).
NOTE: Leavers are teachers who left the teaching profession after the previous school year. Respondents were asked to rate the importance of various reasons in their decision to leave the teach-ing profession, although some reasons may be involuntary. Response choices were based on a 5-point scale, and included the following: "Not at all important," "Slightly important," "Somewhatimportant," "Very important," and "Extremely important." This table includes the percent of leavers who responded "Very important" or "Extremely important." Some variables and data for pub-lic school teachers are not included for private school teachers as reporting standards were not met (there were too few cases for particular response categories).
SOURCE: U.S. Department of Education, National Center for Education Statistics, 1999–2000 Schools and Staffing Survey (“Public School Teacher Questionnaire,” “Public Charter School TeacherQuestionnaire,” and “Private School Teacher Questionnaire”) and 2000–01 Teacher Follow-up Survey ("Questionnaire for Former Teachers").
Private
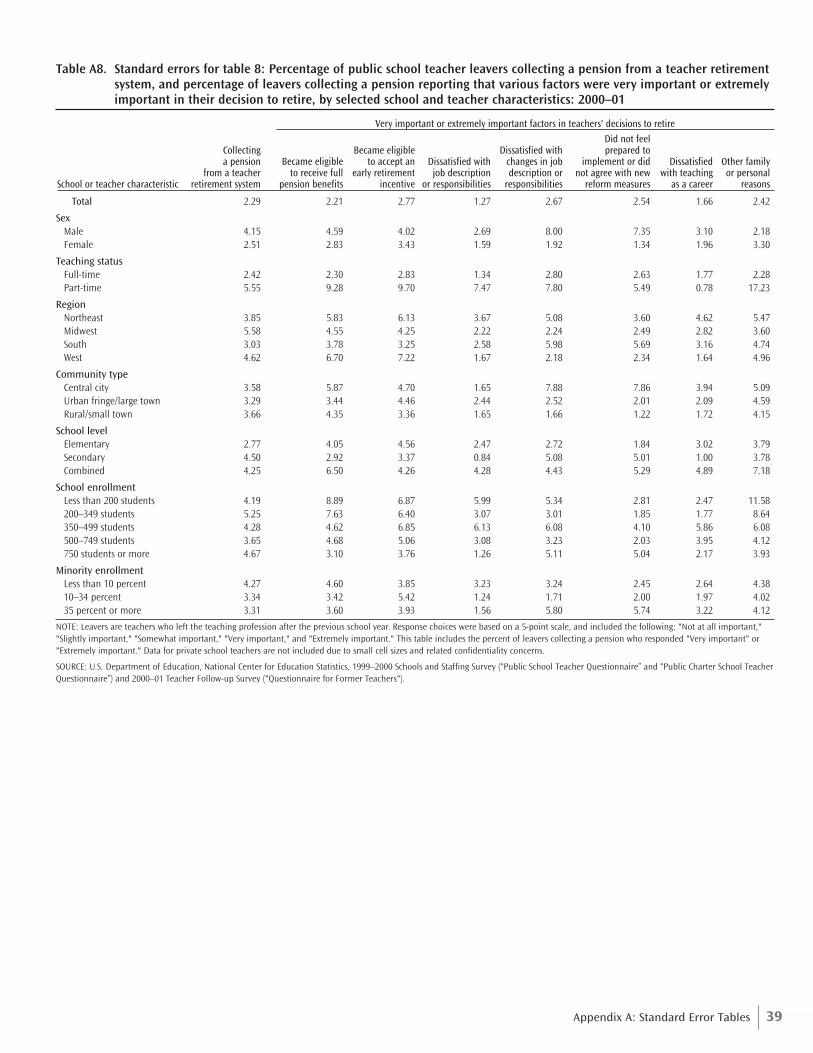
39Appendix A: Standard Error Tables
Table A8. Standard errors for table 8: Percentage of public school teacher leavers collecting a pension from a teacher retirementsystem, and percentage of leavers collecting a pension reporting that various factors were very important or extremelyimportant in their decision to retire, by selected school and teacher characteristics: 2000–01
Did not feelCollecting Became eligible Dissatisfied with prepared toa pension Became eligible to accept an Dissatisfied with changes in job implement or did Dissatisfied Other family
from a teacher to receive full early retirement job description description or not agree with new with teaching or personalSchool or teacher characteristic retirement system pension benefits incentive or responsibilities responsibilities reform measures as a career reasons
Total 2.29 2.21 2.77 1.27 2.67 2.54 1.66 2.42
SexMale 4.15 4.59 4.02 2.69 8.00 7.35 3.10 2.18Female 2.51 2.83 3.43 1.59 1.92 1.34 1.96 3.30
Teaching statusFull-time 2.42 2.30 2.83 1.34 2.80 2.63 1.77 2.28Part-time 5.55 9.28 9.70 7.47 7.80 5.49 0.78 17.23
RegionNortheast 3.85 5.83 6.13 3.67 5.08 3.60 4.62 5.47Midwest 5.58 4.55 4.25 2.22 2.24 2.49 2.82 3.60South 3.03 3.78 3.25 2.58 5.98 5.69 3.16 4.74West 4.62 6.70 7.22 1.67 2.18 2.34 1.64 4.96
Community typeCentral city 3.58 5.87 4.70 1.65 7.88 7.86 3.94 5.09Urban fringe/large town 3.29 3.44 4.46 2.44 2.52 2.01 2.09 4.59Rural/small town 3.66 4.35 3.36 1.65 1.66 1.22 1.72 4.15
School levelElementary 2.77 4.05 4.56 2.47 2.72 1.84 3.02 3.79Secondary 4.50 2.92 3.37 0.84 5.08 5.01 1.00 3.78Combined 4.25 6.50 4.26 4.28 4.43 5.29 4.89 7.18
School enrollmentLess than 200 students 4.19 8.89 6.87 5.99 5.34 2.81 2.47 11.58200–349 students 5.25 7.63 6.40 3.07 3.01 1.85 1.77 8.64350–499 students 4.28 4.62 6.85 6.13 6.08 4.10 5.86 6.08500–749 students 3.65 4.68 5.06 3.08 3.23 2.03 3.95 4.12750 students or more 4.67 3.10 3.76 1.26 5.11 5.04 2.17 3.93
Minority enrollmentLess than 10 percent 4.27 4.60 3.85 3.23 3.24 2.45 2.64 4.3810–34 percent 3.34 3.42 5.42 1.24 1.71 2.00 1.97 4.0235 percent or more 3.31 3.60 3.93 1.56 5.80 5.74 3.22 4.12
NOTE: Leavers are teachers who left the teaching profession after the previous school year. Response choices were based on a 5-point scale, and included the following: "Not at all important,""Slightly important," "Somewhat important," "Very important," and "Extremely important." This table includes the percent of leavers collecting a pension who responded "Very important" or"Extremely important." Data for private school teachers are not included due to small cell sizes and related confidentiality concerns.
SOURCE: U.S. Department of Education, National Center for Education Statistics, 1999–2000 Schools and Staffing Survey (“Public School Teacher Questionnaire” and “Public Charter School TeacherQuestionnaire”) and 2000–01 Teacher Follow-up Survey ("Questionnaire for Former Teachers").
Very important or extremely important factors in teachers' decisions to retire
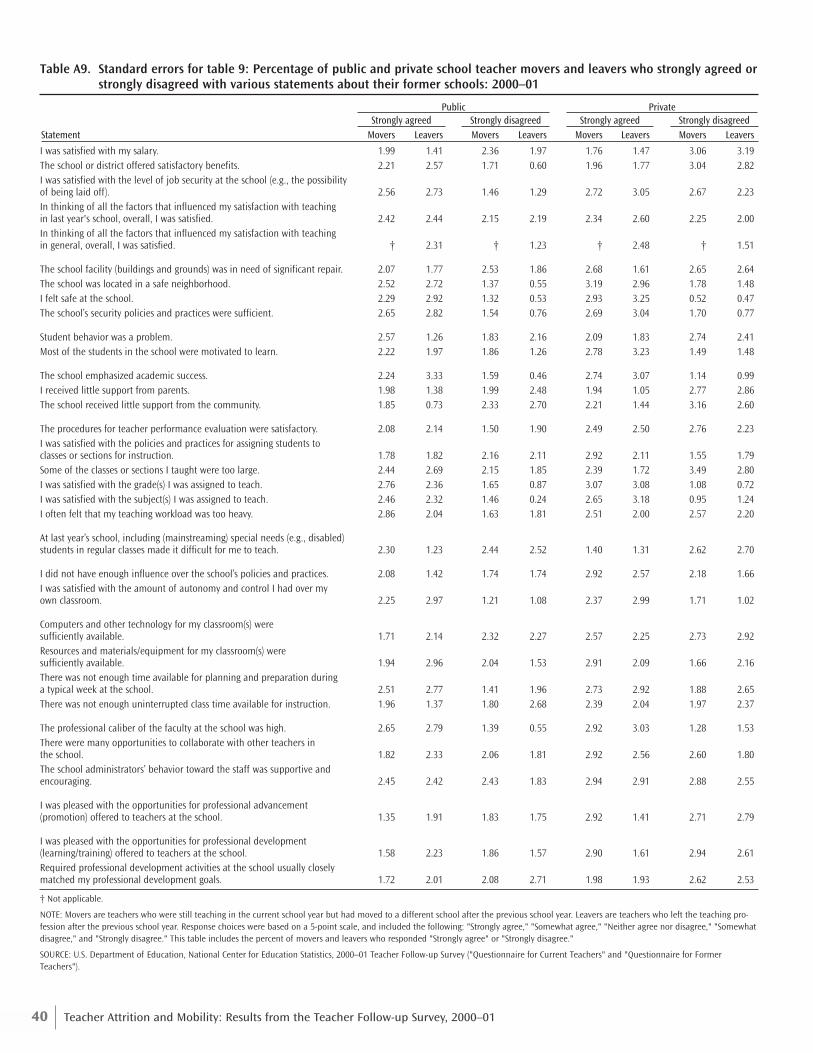
40 Teacher Attrition and Mobility: Results from the Teacher Follow-up Survey, 2000–01
Table A9. Standard errors for table 9: Percentage of public and private school teacher movers and leavers who strongly agreed orstrongly disagreed with various statements about their former schools: 2000–01
Statement Movers Leavers Movers Leavers Movers Leavers Movers Leavers
I was satisfied with my salary. 1.99 1.41 2.36 1.97 1.76 1.47 3.06 3.19The school or district offered satisfactory benefits. 2.21 2.57 1.71 0.60 1.96 1.77 3.04 2.82I was satisfied with the level of job security at the school (e.g., the possibility of being laid off). 2.56 2.73 1.46 1.29 2.72 3.05 2.67 2.23In thinking of all the factors that influenced my satisfaction with teaching in last year's school, overall, I was satisfied. 2.42 2.44 2.15 2.19 2.34 2.60 2.25 2.00In thinking of all the factors that influenced my satisfaction with teaching in general, overall, I was satisfied. † 2.31 † 1.23 † 2.48 † 1.51
The school facility (buildings and grounds) was in need of significant repair. 2.07 1.77 2.53 1.86 2.68 1.61 2.65 2.64The school was located in a safe neighborhood. 2.52 2.72 1.37 0.55 3.19 2.96 1.78 1.48I felt safe at the school. 2.29 2.92 1.32 0.53 2.93 3.25 0.52 0.47The school’s security policies and practices were sufficient. 2.65 2.82 1.54 0.76 2.69 3.04 1.70 0.77
Student behavior was a problem. 2.57 1.26 1.83 2.16 2.09 1.83 2.74 2.41Most of the students in the school were motivated to learn. 2.22 1.97 1.86 1.26 2.78 3.23 1.49 1.48
The school emphasized academic success. 2.24 3.33 1.59 0.46 2.74 3.07 1.14 0.99I received little support from parents. 1.98 1.38 1.99 2.48 1.94 1.05 2.77 2.86The school received little support from the community. 1.85 0.73 2.33 2.70 2.21 1.44 3.16 2.60
The procedures for teacher performance evaluation were satisfactory. 2.08 2.14 1.50 1.90 2.49 2.50 2.76 2.23I was satisfied with the policies and practices for assigning students to classes or sections for instruction. 1.78 1.82 2.16 2.11 2.92 2.11 1.55 1.79Some of the classes or sections I taught were too large. 2.44 2.69 2.15 1.85 2.39 1.72 3.49 2.80I was satisfied with the grade(s) I was assigned to teach. 2.76 2.36 1.65 0.87 3.07 3.08 1.08 0.72I was satisfied with the subject(s) I was assigned to teach. 2.46 2.32 1.46 0.24 2.65 3.18 0.95 1.24I often felt that my teaching workload was too heavy. 2.86 2.04 1.63 1.81 2.51 2.00 2.57 2.20
At last year’s school, including (mainstreaming) special needs (e.g., disabled) students in regular classes made it difficult for me to teach. 2.30 1.23 2.44 2.52 1.40 1.31 2.62 2.70
I did not have enough influence over the school’s policies and practices. 2.08 1.42 1.74 1.74 2.92 2.57 2.18 1.66I was satisfied with the amount of autonomy and control I had over my own classroom. 2.25 2.97 1.21 1.08 2.37 2.99 1.71 1.02
Computers and other technology for my classroom(s) were sufficiently available. 1.71 2.14 2.32 2.27 2.57 2.25 2.73 2.92Resources and materials/equipment for my classroom(s) were sufficiently available. 1.94 2.96 2.04 1.53 2.91 2.09 1.66 2.16There was not enough time available for planning and preparation during a typical week at the school. 2.51 2.77 1.41 1.96 2.73 2.92 1.88 2.65There was not enough uninterrupted class time available for instruction. 1.96 1.37 1.80 2.68 2.39 2.04 1.97 2.37
The professional caliber of the faculty at the school was high. 2.65 2.79 1.39 0.55 2.92 3.03 1.28 1.53There were many opportunities to collaborate with other teachers in the school. 1.82 2.33 2.06 1.81 2.92 2.56 2.60 1.80The school administrators’ behavior toward the staff was supportive and encouraging. 2.45 2.42 2.43 1.83 2.94 2.91 2.88 2.55
I was pleased with the opportunities for professional advancement (promotion) offered to teachers at the school. 1.35 1.91 1.83 1.75 2.92 1.41 2.71 2.79
I was pleased with the opportunities for professional development (learning/training) offered to teachers at the school. 1.58 2.23 1.86 1.57 2.90 1.61 2.94 2.61Required professional development activities at the school usually closely matched my professional development goals. 1.72 2.01 2.08 2.71 1.98 1.93 2.62 2.53
† Not applicable.
NOTE: Movers are teachers who were still teaching in the current school year but had moved to a different school after the previous school year. Leavers are teachers who left the teaching pro-fession after the previous school year. Response choices were based on a 5-point scale, and included the following: "Strongly agree," "Somewhat agree," "Neither agree nor disagree," "Somewhatdisagree," and "Strongly disagree." This table includes the percent of movers and leavers who responded "Strongly agree" or "Strongly disagree."
SOURCE: U.S. Department of Education, National Center for Education Statistics, 2000–01 Teacher Follow-up Survey ("Questionnaire for Current Teachers" and "Questionnaire for FormerTeachers").
Public PrivateStrongly agreed Strongly disagreedStrongly agreed Strongly disagreed
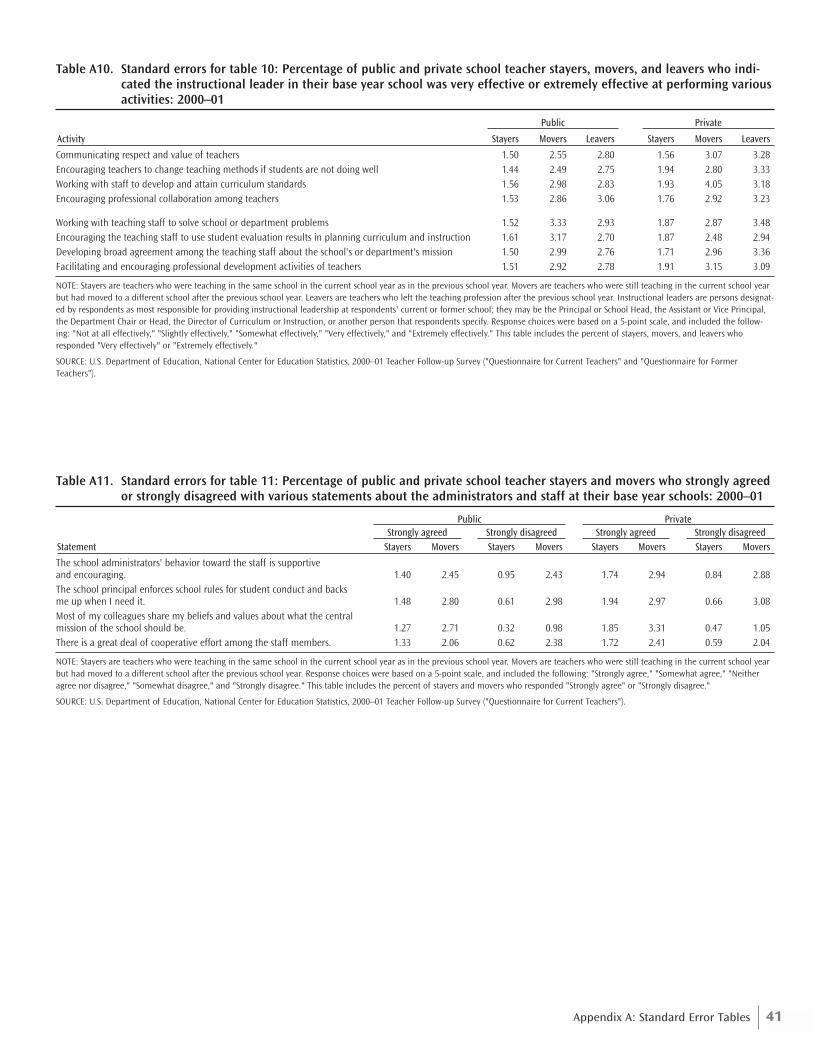
41Appendix A: Standard Error Tables
Table A11. Standard errors for table 11: Percentage of public and private school teacher stayers and movers who strongly agreedor strongly disagreed with various statements about the administrators and staff at their base year schools: 2000–01
Statement Stayers Movers Stayers Movers Stayers Movers Stayers Movers
The school administrators' behavior toward the staff is supportive and encouraging. 1.40 2.45 0.95 2.43 1.74 2.94 0.84 2.88The school principal enforces school rules for student conduct and backs me up when I need it. 1.48 2.80 0.61 2.98 1.94 2.97 0.66 3.08Most of my colleagues share my beliefs and values about what the central mission of the school should be. 1.27 2.71 0.32 0.98 1.85 3.31 0.47 1.05There is a great deal of cooperative effort among the staff members. 1.33 2.06 0.62 2.38 1.72 2.41 0.59 2.04
NOTE: Stayers are teachers who were teaching in the same school in the current school year as in the previous school year. Movers are teachers who were still teaching in the current school yearbut had moved to a different school after the previous school year. Response choices were based on a 5-point scale, and included the following: "Strongly agree," "Somewhat agree," "Neitheragree nor disagree," "Somewhat disagree," and "Strongly disagree." This table includes the percent of stayers and movers who responded "Strongly agree" or "Strongly disagree."
SOURCE: U.S. Department of Education, National Center for Education Statistics, 2000–01 Teacher Follow-up Survey ("Questionnaire for Current Teachers").
Table A10. Standard errors for table 10: Percentage of public and private school teacher stayers, movers, and leavers who indi-cated the instructional leader in their base year school was very effective or extremely effective at performing variousactivities: 2000–01
Activity Stayers Movers Leavers Stayers Movers Leavers
Communicating respect and value of teachers 1.50 2.55 2.80 1.56 3.07 3.28Encouraging teachers to change teaching methods if students are not doing well 1.44 2.49 2.75 1.94 2.80 3.33Working with staff to develop and attain curriculum standards 1.56 2.98 2.83 1.93 4.05 3.18Encouraging professional collaboration among teachers 1.53 2.86 3.06 1.76 2.92 3.23
Working with teaching staff to solve school or department problems 1.52 3.33 2.93 1.87 2.87 3.48Encouraging the teaching staff to use student evaluation results in planning curriculum and instruction 1.61 3.17 2.70 1.87 2.48 2.94Developing broad agreement among the teaching staff about the school's or department's mission 1.50 2.99 2.76 1.71 2.96 3.36Facilitating and encouraging professional development activities of teachers 1.51 2.92 2.78 1.91 3.15 3.09
NOTE: Stayers are teachers who were teaching in the same school in the current school year as in the previous school year. Movers are teachers who were still teaching in the current school yearbut had moved to a different school after the previous school year. Leavers are teachers who left the teaching profession after the previous school year. Instructional leaders are persons designat-ed by respondents as most responsible for providing instructional leadership at respondents' current or former school; they may be the Principal or School Head, the Assistant or Vice Principal,the Department Chair or Head, the Director of Curriculum or Instruction, or another person that respondents specify. Response choices were based on a 5-point scale, and included the follow-ing: "Not at all effectively," "Slightly effectively," "Somewhat effectively," "Very effectively," and "Extremely effectively." This table includes the percent of stayers, movers, and leavers whoresponded "Very effectively" or "Extremely effectively."
SOURCE: U.S. Department of Education, National Center for Education Statistics, 2000–01 Teacher Follow-up Survey ("Questionnaire for Current Teachers" and "Questionnaire for FormerTeachers").
Public Private
Public PrivateStrongly agreed Strongly disagreedStrongly agreed Strongly disagreed
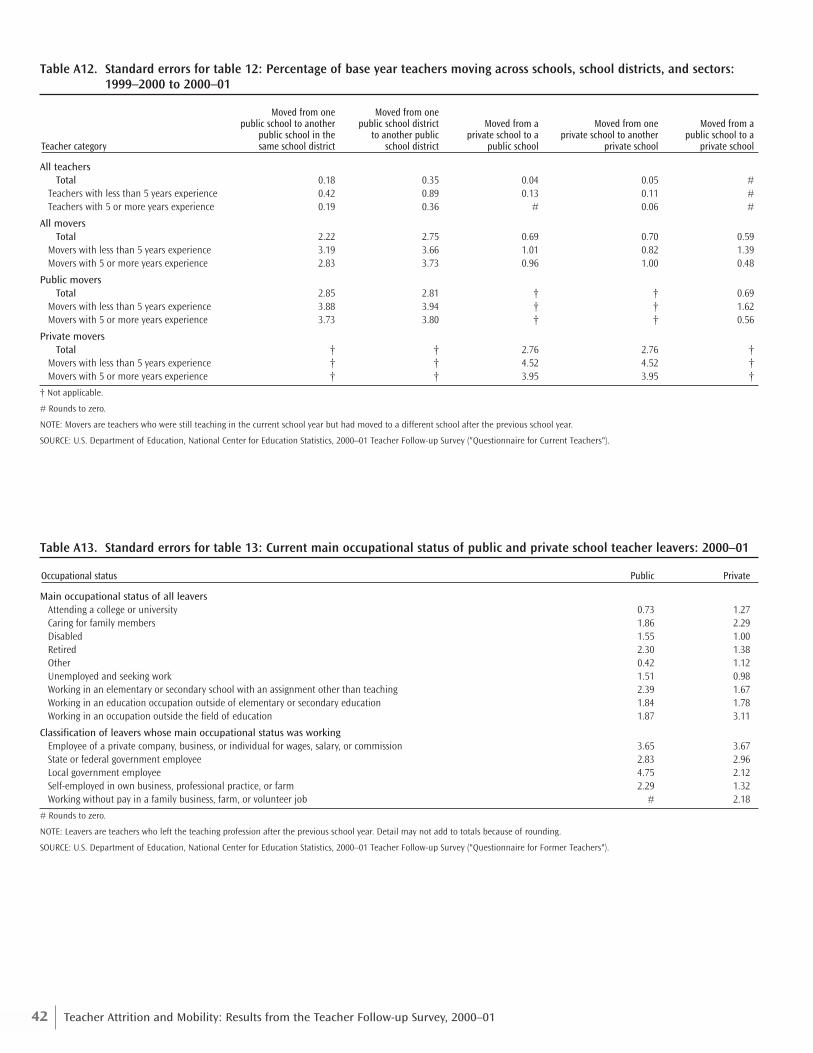
42 Teacher Attrition and Mobility: Results from the Teacher Follow-up Survey, 2000–01
Table A13. Standard errors for table 13: Current main occupational status of public and private school teacher leavers: 2000–01
Occupational status Public Private
Main occupational status of all leavers Attending a college or university 0.73 1.27Caring for family members 1.86 2.29Disabled 1.55 1.00Retired 2.30 1.38Other 0.42 1.12Unemployed and seeking work 1.51 0.98Working in an elementary or secondary school with an assignment other than teaching 2.39 1.67Working in an education occupation outside of elementary or secondary education 1.84 1.78Working in an occupation outside the field of education 1.87 3.11
Classification of leavers whose main occupational status was working Employee of a private company, business, or individual for wages, salary, or commission 3.65 3.67State or federal government employee 2.83 2.96Local government employee 4.75 2.12Self-employed in own business, professional practice, or farm 2.29 1.32Working without pay in a family business, farm, or volunteer job # 2.18
# Rounds to zero.
NOTE: Leavers are teachers who left the teaching profession after the previous school year. Detail may not add to totals because of rounding.
SOURCE: U.S. Department of Education, National Center for Education Statistics, 2000–01 Teacher Follow-up Survey ("Questionnaire for Former Teachers").
Table A12. Standard errors for table 12: Percentage of base year teachers moving across schools, school districts, and sectors:1999–2000 to 2000–01
Moved from one Moved from onepublic school to another public school district Moved from a Moved from one Moved from a
public school in the to another public private school to a private school to another public school to a Teacher category same school district school district public school private school private school
All teachers Total 0.18 0.35 0.04 0.05 #
Teachers with less than 5 years experience 0.42 0.89 0.13 0.11 #Teachers with 5 or more years experience 0.19 0.36 # 0.06 #
All moversTotal 2.22 2.75 0.69 0.70 0.59
Movers with less than 5 years experience 3.19 3.66 1.01 0.82 1.39Movers with 5 or more years experience 2.83 3.73 0.96 1.00 0.48
Public movers Total 2.85 2.81 † † 0.69
Movers with less than 5 years experience 3.88 3.94 † † 1.62Movers with 5 or more years experience 3.73 3.80 † † 0.56
Private moversTotal † † 2.76 2.76 †
Movers with less than 5 years experience † † 4.52 4.52 †Movers with 5 or more years experience † † 3.95 3.95 †
† Not applicable.
# Rounds to zero.
NOTE: Movers are teachers who were still teaching in the current school year but had moved to a different school after the previous school year.
SOURCE: U.S. Department of Education, National Center for Education Statistics, 2000–01 Teacher Follow-up Survey ("Questionnaire for Current Teachers").
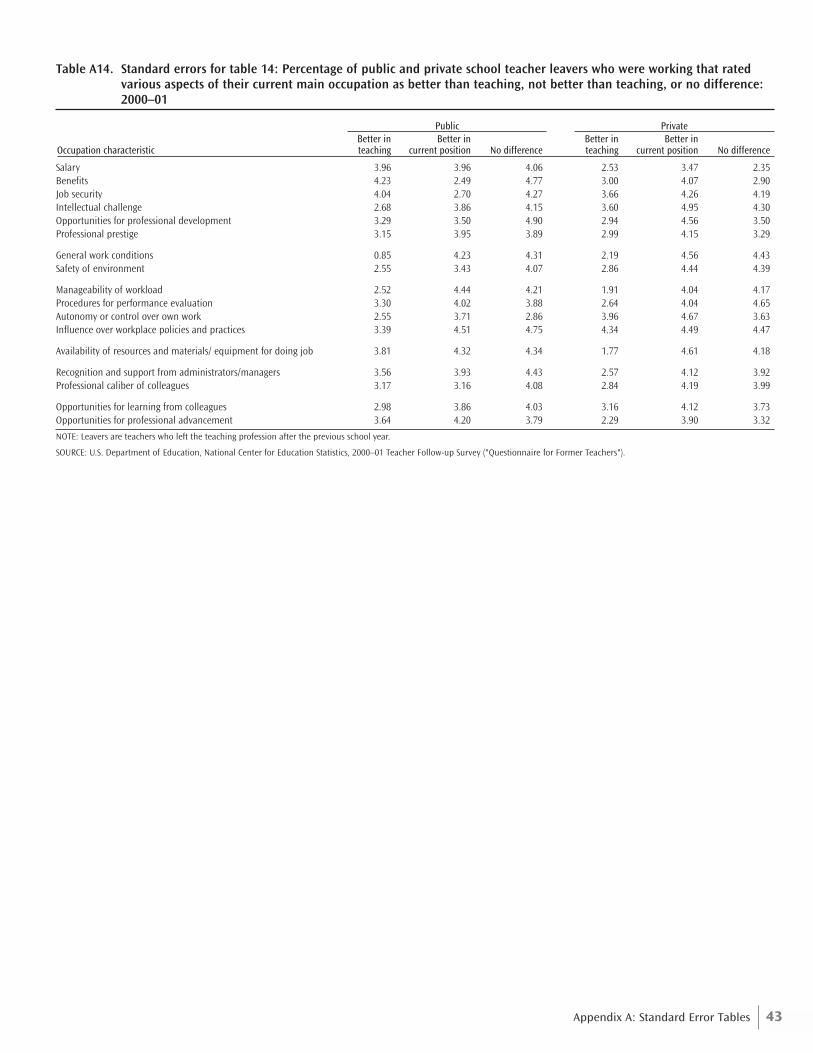
43Appendix A: Standard Error Tables
Table A14. Standard errors for table 14: Percentage of public and private school teacher leavers who were working that ratedvarious aspects of their current main occupation as better than teaching, not better than teaching, or no difference:2000–01
Better in Better in Better in Better inOccupation characteristic teaching current position No difference teaching current position No difference
Salary 3.96 3.96 4.06 2.53 3.47 2.35Benefits 4.23 2.49 4.77 3.00 4.07 2.90Job security 4.04 2.70 4.27 3.66 4.26 4.19Intellectual challenge 2.68 3.86 4.15 3.60 4.95 4.30Opportunities for professional development 3.29 3.50 4.90 2.94 4.56 3.50Professional prestige 3.15 3.95 3.89 2.99 4.15 3.29
General work conditions 0.85 4.23 4.31 2.19 4.56 4.43Safety of environment 2.55 3.43 4.07 2.86 4.44 4.39
Manageability of workload 2.52 4.44 4.21 1.91 4.04 4.17Procedures for performance evaluation 3.30 4.02 3.88 2.64 4.04 4.65Autonomy or control over own work 2.55 3.71 2.86 3.96 4.67 3.63Influence over workplace policies and practices 3.39 4.51 4.75 4.34 4.49 4.47
Availability of resources and materials/ equipment for doing job 3.81 4.32 4.34 1.77 4.61 4.18
Recognition and support from administrators/managers 3.56 3.93 4.43 2.57 4.12 3.92Professional caliber of colleagues 3.17 3.16 4.08 2.84 4.19 3.99
Opportunities for learning from colleagues 2.98 3.86 4.03 3.16 4.12 3.73Opportunities for professional advancement 3.64 4.20 3.79 2.29 3.90 3.32
NOTE: Leavers are teachers who left the teaching profession after the previous school year.
SOURCE: U.S. Department of Education, National Center for Education Statistics, 2000–01 Teacher Follow-up Survey ("Questionnaire for Former Teachers").
Public Private

44 Teacher Attrition and Mobility: Results from the Teacher Follow-up Survey, 2000–01
45Appendix B: Technical Notes
I. Overview of TFS
The Teacher Follow-up Survey (TFS) is sponsored by the National Center for Education Statistics (NCES) ofthe U.S. Department of Education’s Institute of Education Sciences (IES) and is conducted by the U.S. CensusBureau.
The TFS is a follow-up survey of selected elementary and secondary school teachers who have participated inthe Schools and Staffing Survey (SASS)1 and is conducted in the school year following the SASS data collection.The sample for TFS was selected from those teachers who participated in the SASS; it consisted of all who leftteaching within the year after SASS and a subsample of those who continued teaching.
The major objectives of TFS are to:
■ Provide estimates of teacher attrition rates;
■ Examine the characteristics of those who stay in the teaching profession and those who leave, includingretirees;
■ Obtain data on occupations or other activities for those who leave teaching and career information for thosewho are still teaching;
■ Update information on education, other training, and career plans; and
■ Collect data on attitudes about the teaching profession and job satisfaction.
The Teacher Follow-up Survey was conducted in the 1988–89, 1991–92, 1994–95, and 2000–01 school years(after the 1987–88, 1990–91, 1993–94, and 1999–2000 administrations of SASS, respectively). NCES current-ly plans to conduct the next survey in the 2004–05 school year; it will collect data from a subsample of teach-ers who participated in the 2003–04 SASS.
Congress, state education departments, federal agencies, private school associations, teacher associations, andeducational organizations have used data from the 1987–88, 1990–91, and 1993–94 SASS, and 1988–89,1991–92, and 1994–95 TFS surveys.
II. Survey Content: 2000–01
A. Content Changes
Prior to the 2000–01 TFS administration, pre-tests were undertaken (for further explanation of the pre-tests,see section V). As a result of these pre-tests, the following additions and deletions were made to the TFS ques-tionnaires between the 1994–95 and 2000–01 administrations.
Appendix B: Technical Notes
1 For a complete description of the 1999–2000 Schools and Staffing Survey, see 1999–2000 Schools and Staffing Survey: Data File User’s Manual (Tourkin etal. forthcoming).
46 Teacher Attrition and Mobility: Results from the Teacher Follow-up Survey, 2000–01
1. Additions and Enhancements
a. Questionnaire for Former Teachers (TFS-2)
■ Effectiveness of instructional leadership
■ Reasons for retirement
■ Impression of last year’s school
■ Factors that may influence return to teaching
■ Increased use of rating scales to measure reasons for leaving and job satisfaction
■ Race/ethnicity categories were revised to allow for multi-race reporting
b. Questionnaire for Current Teachers (TFS-3)
■ Computers and technology in the classroom
■ Scheduling and planning activities
■ Increased use of rating scales to measure reasons for moving and job satisfaction
■ Race/ethnicity categories were revised to allow for multi-race reporting
2. Deletions
a. Questionnaire for Former Teachers (TFS-2)
■ Effective steps to encourage teacher retention
b. Questionnaire for Current Teachers (TFS-3)
■ Teaching methods
■ Effective steps to encourage teaching retention
B. Final Content of 2000–01 TFS
The following is a brief description of the components of the 2000–01 TFS.
■ The Teacher Status Form for Public and Private Schools (TFS-1) is an administrative form sent to princi-pals in order to determine whether teachers who participated in the 1999–2000 SASS remained in theschool, moved to another school, or left the teaching profession. This information is used to help locate andadminister the appropriate questionnaire to TFS participants.
■ The Questionnaire for Former Teachers (TFS-2) obtained information such as employment status, reasonsfor leaving the teaching profession, future employment and educational plans, impressions of last year’sschool, of teaching in general, and of the current occupation relative to teaching.
■ The Questionnaire for Current Teachers (TFS-3) obtained information such as teaching assignments andcertification, conditions and experiences of teaching in current school, scheduling and planning, comput-ers and technology in the classroom, changes from last school year to this school year, and future educa-tion plans.
Copies of the 2000–01 TFS questionnaires may be obtained on the Internet at http://nces.ed.gov/surveys/sass/questionnaire.asp or by e-mail to [email protected].
C. Sampling Changes
Due to processing delays in SASS, the final interview status for teachers was not available when the sample wasselected for TFS. As a result, teachers were sampled based on their preliminary interview status in SASS. Ofthe 8,353 teachers selected for TFS, 643 ended up being nonrespondents for SASS based on the final interviewstatus, making them ineligible for TFS. This represents a considerably higher proportion of the TFS sample
47Appendix B: Technical Notes
that was lost in 1994–95 and in other past rounds of TFS, and can be attributed to the processing delays inSASS. These 643 cases were teachers whose questionnaire responses were insufficient to be considered a finalinterview. This process occurs in all SASS data collections, in which what appear to be responses initially, endup as non-interviews after the criteria for a final interview are applied (usually, at least a small percentageof items must be filled in, plus a few critical items). In 1999–2000, delays to the processing of SASS meantthat the final interview had not been run when the TFS sample had to be selected. Nonresponse bias analy-ses were performed on the 1993–94 and 1999–2000 SASS, but not specifically on the group that changedfrom interview to non-interview status during processing. Although these cases represent only 7.7 percent ofthe TFS sample, it is impossible to know if these cases have any impact on the attrition rates shown in thisreport without a specific analysis of the characteristics of these excluded teachers from SASS against the eli-gible teachers in TFS.
III. Target Populations, Sampling Frames, and Comparisons of Estimates
A. Target Populations and Key Terms
The target population for the 2000–01 TFS was the universe of elementary and secondary school teachers inthe United States during the 1999–2000 school year. This population was divided into two components—thosewho left teaching after the 1999–2000 school year (“leavers”) and those who continued teaching (“stayers”and “movers”).
The following terms are used in this publication and are defined as they apply to TFS:
■ Teacher. For the purposes of the Teacher Follow-up Survey, a teacher is any full-time or part-time schoolstaff member who teaches one or more regularly scheduled classes in any of grades K–12 (or comparableungraded levels). Pre-kindergarten teachers are included if they also teach kindergarten. In addition to reg-ular full-time teachers, the following types of teachers are also included: (1) itinerant teachers, (2) long-term substitutes who fill the role of a regular teacher for at least three months, (3) administrators, coun-selors, librarians, or other professional or support staff who teach any regularly scheduled classes, and (4)other part-time teachers.
■ Leavers. Teachers who left the teaching profession or teachers who were no longer teaching in any ofgrades K–12 after the 1999–2000 school year (includes teachers whose status changed to short-term sub-stitute, student teacher, or teacher aide).
■ Movers. Teachers who were still teaching any of grades K–12 in 2000–01, but had moved to a differentschool after the 1999–2000 school year.
■ Stayers. Teachers who were still teaching any of grades K–12 and in the same school in 2000–01 as in1999–2000.
■ Out-of-Scope TFS teachers. Teachers who left the United States or died.
The following definitions were used in the 2000–01 Schools and Staffing Survey; they describe variables includ-ed on each TFS respondent’s record to identify the school where he/she taught during the 1999–2000 schoolyear. Many are also used in this publication.
■ Census region. The four Census regions are:
Northeast—Maine, New Hampshire, Vermont, Massachusetts, Rhode Island, Connecticut, New York,New Jersey, Pennsylvania
Midwest—Ohio, Indiana, Illinois, Michigan, Wisconsin, Minnesota, Iowa, Missouri, North Dakota,South Dakota, Nebraska, Kansas

48 Teacher Attrition and Mobility: Results from the Teacher Follow-up Survey, 2000–01
South—Delaware, Maryland, District of Columbia, Virginia, West Virginia, North Carolina, SouthCarolina, Georgia, Florida, Kentucky, Tennessee, Alabama, Mississippi, Arkansas, Louisiana,Oklahoma, Texas
West—Montana, Idaho, Wyoming, Colorado, New Mexico, Arizona, Utah, Nevada, Washington, Oregon,California, Alaska, Hawaii
■ Common Core of Data. The Common Core of Data is a group of surveys that acquire and maintain pub-lic elementary and secondary education data from the 50 states, the District of Columbia, and the outly-ing areas through the state-level (or equivalent) education agencies. Information about staff and studentsin public schools is collected annually at the school, LEA (Local Education Agency or School District), andstate levels. Information about revenues and expenditures is also collected at the state level.
■ Local education agency (LEA). LEAs, or public school districts, are government agencies that employ ele-mentary or secondary teachers and are administratively responsible for providing public elementary/sec-ondary instruction and educational support services. Included are education agencies that do not operateschools but employ teachers, e.g., regional cooperatives that employ special education teachers who teachin schools in more than one school district.
■ School, alternative. Alternative schools serve students whose needs cannot be met in a regular, special edu-cation, or vocational school. They provide nontraditional education and may serve as an adjunct to a reg-ular school. They fall outside the categories of regular, special education, and vocational education,although they may provide similar services or curriculum. Some examples of alternative schools are thosefor potential dropouts, residential treatment centers for substance abuse (if they provide elementary or sec-ondary education), and schools for chronic truants.
■ School, BIA. A BIA school is a school funded by the Bureau of Indian Affairs (BIA) of the U.S. Departmentof the Interior. Any school included in the 1997–98 Office of Indian Education Programs: EducationDirectory is a BIA-funded school. This directory was the population frame for the Indian School compo-nent of the 1999–2000 SASS. Schools listed in the BIA directory receive federal funds but may be operat-ed by a local school district, a local tribe, or as a public charter school.
■ School, Charter or Public Charter. A charter school is a public school that, in accordance with an enablingstate statute, has been granted a charter exempting it from selected state or local rules and regulations. Acharter school may be a newly created school or it may previously have been a public or private school. Itincludes schools open for instruction as a public charter school as of the 1998–99 school year and operat-ing in the 1999–2000 school year.
■ School, combined. A combined school has one or more of grades K–6 and one or more of grades 9–12; forexample, schools with grades K–12, 6–12, 6–9, or 1–12 are classified as combined schools. Schools in whichall students are ungraded (i.e., not classified by standard grade levels) are also classified as combined.
■ School, elementary. A school is elementary if it has one or more of grades 1–6 and does not have any gradehigher than grade 8; for example, schools with grades K–6, 1–3, or 6–8 are classified as elementary schools.
■ School, private. A private school is defined as a school not in the public system that provides instructionfor any of grades 1–12 (or comparable ungraded levels). The instruction is typically given in a buildingthat is not used primarily as a private home. Individual cases where instruction was primarily given in thehome were manually checked to verify that the school was not a home school.
■ School, public. A public school is an institution that provides educational services for at least one of grades1 through 12 (or comparable ungraded levels), has one or more teachers, is located in one or more build-ings, and is supported primarily by public funds. State schools (e.g., schools for the deaf or the blind),
49Appendix B: Technical Notes
schools in juvenile detention centers, and schools located on military bases in the U.S. and operated by theDepartment of Defense are included.
■ School, secondary. A school is secondary if it has one or more of grades 7–12 and does not have any gradeslower than grade 7; for example, schools with grades 9–12, 7–8, 10–12, or 7–9 are classified as secondaryschools.
■ School, special education. Special education schools provide educational services to students with specialphysical or mental needs, i.e., students with mental disabilities (such as mental retardation or autism),physical disabilities (such as hearing-impairment), or learning disabilities (such as dyslexia).
■ School, vocational. Vocational schools primarily serve students who are being trained for semi-skilled ortechnical occupations.
■ Typology, private school. Categories (three major ones with three sub-categories each) into which privateschools are divided based on religious orientation, association membership, and program emphasis: 1)Catholic—parochial, diocesan, private; 2) Other religious—affiliated with a Conservative Christian schoolassociation (e.g., Accelerated Christian Education, American Association of Christian Schools, Associationof Christian Schools International, Oral Roberts University Educational Fellowship), affiliated with a nation-al denomination, unaffiliated; 3) Non-sectarian—regular, special program emphasis, special education.
■ Ungraded students. Ungraded students are those who are not assigned to a particular grade level (kinder-garten, first grade, second grade, etc.); for example, special education centers and alternative schools oftenclassify their students as ungraded. Students in Montessori schools are also considered ungraded if theschool assigns them to “primary” and “intermediate” levels instead of specific grades.
B. SASS Sampling Frames
More detailed information on the sample design for SASS can be found in the 1999–2000 Schools and StaffingSurvey: Data File User’s Manual.
1. Public Schools
The SASS was designed to support estimates at the national, regional, and state levels for public school dis-tricts, schools, principals, teachers, and school library media centers. The public school sampling frame wasbased on the 1997–98 school year Common Core of Data (CCD), a file of information collected annually byNCES from all state education agencies and believed to be the most complete public school listing availableat the time of sample selection. Public schools not in existence in school year 1997–98 or not opening as aresult of a merger with an existing school were not included in the SASS sampling universe. The frame con-tains regular public schools and special purpose schools such as special education, vocational, and alterna-tive schools. The frame was enhanced with a list of schools operated by the Department of Defense. Afterthe deletion of duplicate schools, schools outside of the United States, and schools that only teach prekinder-garten, kindergarten, or postsecondary students, 88,266 schools remained on the public school frame.
2. Private Schools
The SASS was designed to provide detailed private school estimates at the affiliation level. The samplingframe for private schools was derived from affiliation lists, because state coverage of private schools isuneven. The sampling frame for private schools was the 1997–98 Private School Survey (PSS), updatedwith more current information from 1998–99 private school affiliation lists (Broughman and Colaciello1999). A list frame consisting of 28,164 schools was the primary private school frame. An area frame wasused to identify schools not included on the list frame and thereby compensate for the undercoverage ofthe list frame. The area frame was taken from the 1997–98 PSS because there was no opportunity to
50 Teacher Attrition and Mobility: Results from the Teacher Follow-up Survey, 2000–01
update it prior to SASS data collection. See Cole et al. (forthcoming) for more detail. The area frame con-sisted of 140 schools drawn from a sample of 3,142 counties throughout the nation, representing an esti-mated 1,760 schools not found on affiliation lists.
The affiliation group for a school was determined in a hierarchical order; that is, if more than one defini-tion applied, the school was classified into the first group that applied:
1) Military—membership in the Association of American Military Colleges and Schools;
2) Catholic—affiliation as Catholic or membership in the National Catholic Education Association or theJesuit Secondary Education Association;
3) Friends—affiliation as Friends or membership in the Friends Council on Education;
4) Episcopal—affiliation as Episcopal or membership in the National Association of Episcopal Schools;
5) Hebrew Day—membership in the National Society for Hebrew Day Schools;
6) Solomon Schechter—membership in the Schechter Day Schools;
7) Other Jewish—any other Jewish affiliation;
8) Missouri Synod—membership in the Lutheran Church, Missouri Synod;
9) Wisconsin Synod—affiliation as Evangelical Lutheran, Wisconsin Synod or membership in theEvangelical Lutheran Church, Wisconsin Synod;
10) Evangelical Lutheran—affiliation as Evangelical Lutheran Church in America or membership in theAssociation of Evangelical Lutheran Churches;
11) Other Lutheran—any other Lutheran affiliation;
12) Seventh-Day Adventist—affiliation as Seventh-Day Adventist or membership in the GeneralConference of Seventh-Day Adventists;
13) Christian Schools International—membership in Christian Schools International;
14) American Association of Christian Schools—membership in the American Association of ChristianSchools;
15) Association of Christian Schools International—membership in the Association of Christian SchoolsInternational;
16) National Association of Private Schools for Exceptional Children—membership in the NationalAssociation of Private Schools for Exceptional Children;
17) Montessori—membership in the American Montessori Society or other Montessori associations;
18) National Association of Independent Schools—membership in the National Association of IndependentSchools;
19) National Independent Private School Association—membership in the National Independent PrivateSchool Association;
20) Other—no affiliation with or membership in any of the groups listed above.
3. Public Charter Schools
The universe of 1,122 public charter schools was identified from a list provided by the Office ofEducational Research and Improvement (OERI) as described in The State of Charter Schools 2000 (2000).The OERI list was used since not all of the public charter schools were listed on the Common Core of Data(CCD). The OERI list included public charter schools open during the 1998–99 school year; there were1,122 schools on the public charter school frame. To be included in the 1999–2000 SASS population of

51Appendix B: Technical Notes
public charter schools, public charter schools were required to still be open as a public charter school dur-ing the 1999–2000 school year. One hundred and twelve schools on the sampling frame failed to meet thesecriteria, resulting in 1,010 in-scope public charter schools.
An independent verification of charter school information was provided by the National Charter SchoolDirectory 2000, Sixth Edition (Dale 2000). Census personnel used this resource to verify the eligibility sta-tus of specific public charter schools.
4. Bureau of Indian Affairs-Funded Schools
The universe of BIA schools was identified from the 1997–98 list of schools provided by the Bureau ofIndian Affairs. For the 1997–98 school year, there were 197 schools in the Department of Interior’s Bureauof Indian Affairs, Office of Indian Education Programs (OIEP) “Education Directory” (Bureau of IndianAffairs 1998). Collecting and analyzing data from BIA schools is complicated because some BIA-fundedschools are operated as public schools or public charter schools. Of the original 197 schools listed in theOIEP “Education Directory” for 1997–98, 124 were considered BIA schools; 65 were considered to be pub-lic schools; and 8 were considered to be public charter schools.
Starting from the 197 schools in the OIEP Directory, only 169 of the listed entities are considered to beschools meeting the eligibility requirements of SASS: the facility must provide educational services for anyof grades 1 through 12. Some of the OIEP listings were for dormitories or schools that provided only pre-school or adult educational services and thus are ineligible for the SASS. Out of these 169 schools, 152were school respondents.
IV. Sample Selection Procedures and Sample Sizes
A. SASS Sample Selection Procedures
Selecting the teacher sample in public, private, and public charter schools involved the following steps:
a. The selected schools were asked to provide teacher lists using the SASS Teacher Listing Form; and
b. From the lists, 56,860 public school teachers (including BIA teachers), 10,760 private school teachers, and4,438 public charter school teachers were selected.
The public, private, and public charter teacher sample selections are described together because identicalmethodologies were used. The only difference was in the average number of teachers selected within a school.
1. Teacher Frame
Each selected school was asked to provide a list of their teachers with selected information for each teacher.Of sampled schools, 7 percent of public schools, 14 percent of private schools, 9 percent of public charterschools, and 2 percent of Bureau of Indian Affairs (BIA) schools did not provide teacher listing forms. Afactor in the teacher weighting system was used to adjust for these nonparticipant schools.
The sample schools were asked to provide the following information for each teacher listed:
■ Whether the teacher was new or experienced, where “new” was defined as less than three years oftotal teaching completed and “experienced” was defined as three or more completed years of teach-ing;
■ Race/ethnicity;
■ Whether the teacher taught classes designed for students with limited-English proficiency; and
■ Subject matter taught (general elementary, special education, math, science, English, social studies,vocational education, and all other teachers).
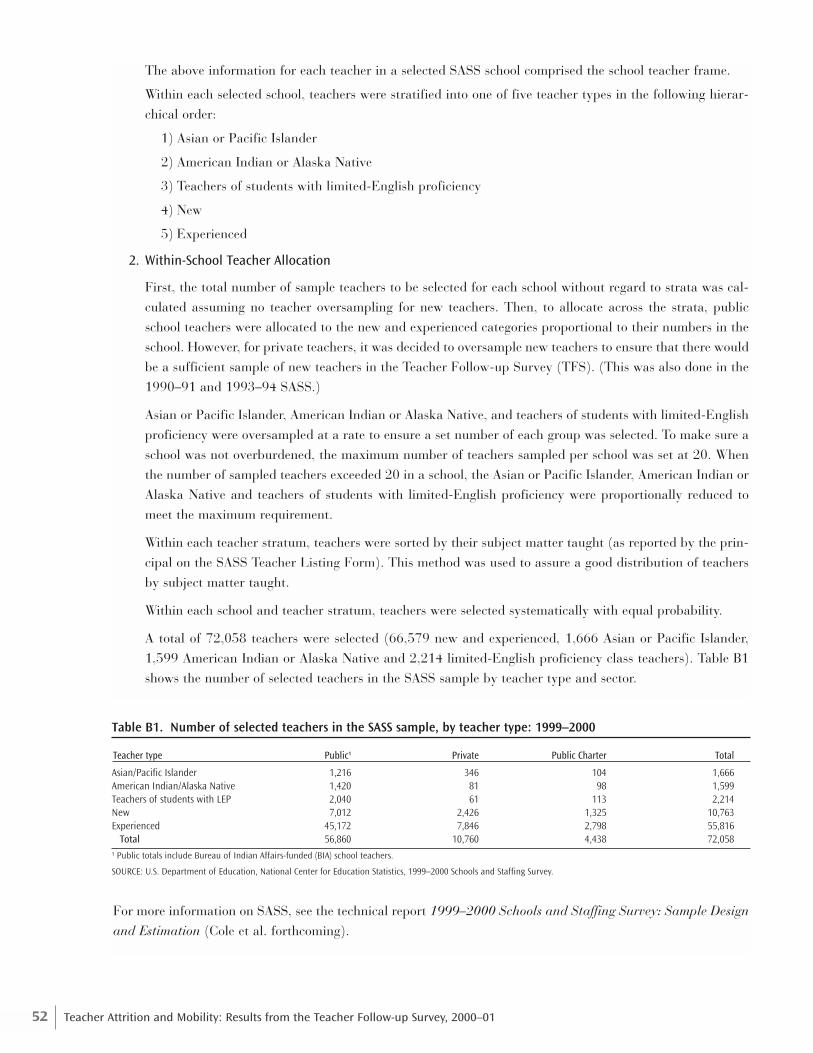
52 Teacher Attrition and Mobility: Results from the Teacher Follow-up Survey, 2000–01
The above information for each teacher in a selected SASS school comprised the school teacher frame.
Within each selected school, teachers were stratified into one of five teacher types in the following hierar-chical order:
1) Asian or Pacific Islander
2) American Indian or Alaska Native
3) Teachers of students with limited-English proficiency
4) New
5) Experienced
2. Within-School Teacher Allocation
First, the total number of sample teachers to be selected for each school without regard to strata was cal-culated assuming no teacher oversampling for new teachers. Then, to allocate across the strata, publicschool teachers were allocated to the new and experienced categories proportional to their numbers in theschool. However, for private teachers, it was decided to oversample new teachers to ensure that there wouldbe a sufficient sample of new teachers in the Teacher Follow-up Survey (TFS). (This was also done in the1990–91 and 1993–94 SASS.)
Asian or Pacific Islander, American Indian or Alaska Native, and teachers of students with limited-Englishproficiency were oversampled at a rate to ensure a set number of each group was selected. To make sure aschool was not overburdened, the maximum number of teachers sampled per school was set at 20. Whenthe number of sampled teachers exceeded 20 in a school, the Asian or Pacific Islander, American Indian orAlaska Native and teachers of students with limited-English proficiency were proportionally reduced tomeet the maximum requirement.
Within each teacher stratum, teachers were sorted by their subject matter taught (as reported by the prin-cipal on the SASS Teacher Listing Form). This method was used to assure a good distribution of teachersby subject matter taught.
Within each school and teacher stratum, teachers were selected systematically with equal probability.
A total of 72,058 teachers were selected (66,579 new and experienced, 1,666 Asian or Pacific Islander,1,599 American Indian or Alaska Native and 2,214 limited-English proficiency class teachers). Table B1shows the number of selected teachers in the SASS sample by teacher type and sector.
Table B1. Number of selected teachers in the SASS sample, by teacher type: 1999–2000
Teacher type Public¹ Private Public Charter Total
Asian/Pacific Islander 1,216 346 104 1,666American Indian/Alaska Native 1,420 81 98 1,599Teachers of students with LEP 2,040 61 113 2,214New 7,012 2,426 1,325 10,763Experienced 45,172 7,846 2,798 55,816
Total 56,860 10,760 4,438 72,058
¹ Public totals include Bureau of Indian Affairs-funded (BIA) school teachers.
SOURCE: U.S. Department of Education, National Center for Education Statistics, 1999–2000 Schools and Staffing Survey.
For more information on SASS, see the technical report 1999–2000 Schools and Staffing Survey: Sample Designand Estimation (Cole et al. forthcoming).
53Appendix B: Technical Notes
B. TFS Sample Selection Procedures
The Teacher Follow-up Survey (TFS) is a survey of approximately 8,400 teachers who were interviewed in the1999–2000 SASS Teacher Survey. As described earlier, the purpose of the 2000–01 TFS was to measure teacherattrition rates a year after the 1999–2000 SASS data collection. In SASS, schools were selected first. Next, teach-ers were selected within each sampled school. The TFS teachers were selected from the SASS teacher sample.The TFS sample is a stratified sample that was allocated in order to allow comparisons of stayers, movers, andleavers within sector (public/private/public charter), experience groups, and level. Therefore, for the TFS, theresponding 1999–2000 SASS teachers were stratified by four variables (sector, teacher status, experience, teach-ing level) in the order shown below:
1. Sector (Public/Private School Indicator):
Public—teachers who taught in a public school system or BIA school in the 1999–2000 school year;
Public Charter—teachers who taught in a public charter school in the 1999–2000 school year;
Private—teachers who taught in a private school in the 1999–2000 school year;
2. Teacher status:
Leavers—teachers in the 1999–2000 school year who left the teaching profession prior to the 2000–01school year;
Stayers—teachers in the 1999–2000 school year who were still teaching in the same school in 2000–01 asthey were in the previous school year;
Movers—teachers in the 1999–2000 school year who were still teaching in 2000–01, but were in a differ-ent school in the 2000–01 school year;
Don’t know—teachers whose status was unknown (or was not reported) in 2000–01 by staff at their1999–2000 school.
3. Experience (New/Experienced Teacher Indicator):
New—teachers who had completed less than three years of teaching during the 1999–2000 school year;
Experienced—teachers who had three or more years of teaching experience during the 1999–2000 schoolyear;
4. Teaching level:
Elementary—teachers who taught elementary students in the 1999–2000 school year regardless of thelevel of the school (elementary, secondary, combined) in which they taught;
Secondary—teachers who taught secondary students in the 1999–2000 school year regardless of the levelof the school (elementary, secondary, combined) in which they taught.
The sample for TFS was allocated from those teachers who participated in the SASS; it consisted of all who leftteaching within the year after SASS and a subsample of those who continued teaching. All teachers with less than3 years of teaching experience and who moved to a different school were included, while for teachers who wereexperienced and who moved to another school, the proportion sampled ranged from 23 percent for public teach-ers to 77 percent for public charter teachers, and 100 percent of private teachers. Teachers who stayed in thesame school were sampled at lower rates, ranging from 4 percent for public teachers to 15 percent for privateteachers and 27 percent for public charter teachers. The final TFS sample allocation, which is summarized intable B2 on the following page, was selected to ensure that a sufficient number of teachers from each of therespective sectors were included in the sample to provide nationally representative estimates.
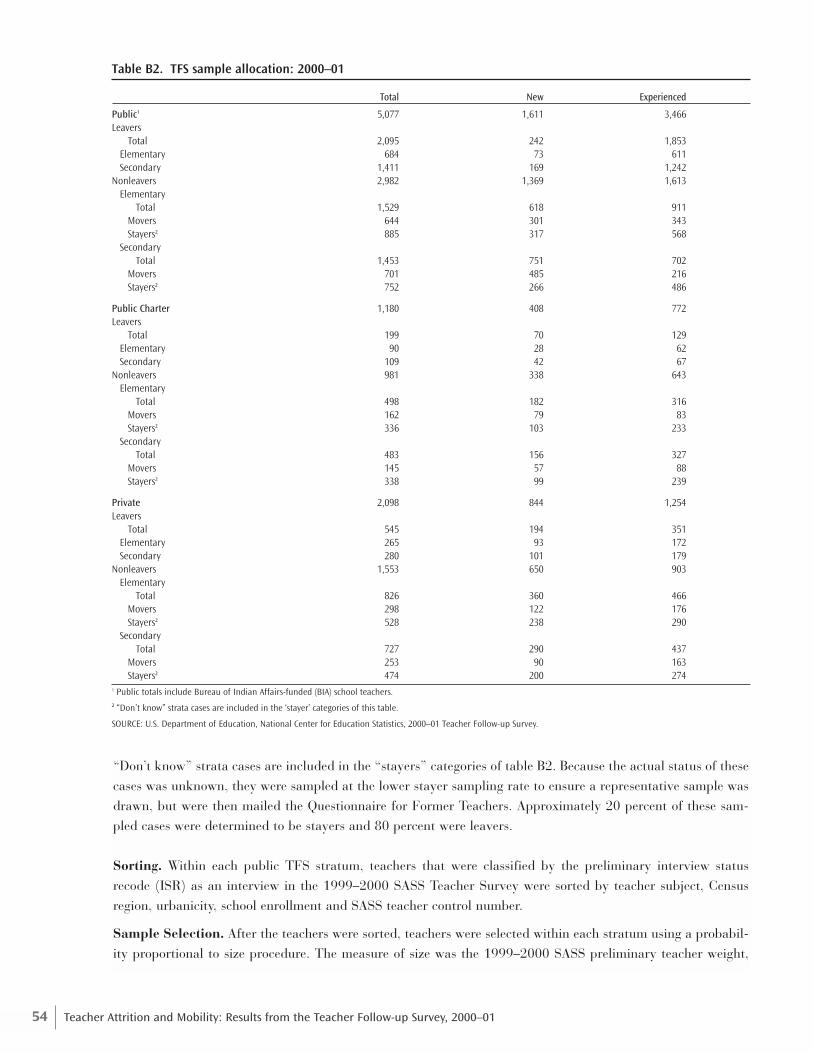
54 Teacher Attrition and Mobility: Results from the Teacher Follow-up Survey, 2000–01
Table B2. TFS sample allocation: 2000–01
Total New Experienced
Public1 5,077 1,611 3,466Leavers
Total 2,095 242 1,853Elementary 684 73 611Secondary 1,411 169 1,242
Nonleavers 2,982 1,369 1,613Elementary
Total 1,529 618 911Movers 644 301 343Stayers2 885 317 568
SecondaryTotal 1,453 751 702
Movers 701 485 216Stayers2 752 266 486
Public Charter 1,180 408 772Leavers
Total 199 70 129Elementary 90 28 62Secondary 109 42 67
Nonleavers 981 338 643Elementary
Total 498 182 316Movers 162 79 83Stayers2 336 103 233
SecondaryTotal 483 156 327
Movers 145 57 88Stayers2 338 99 239
Private 2,098 844 1,254Leavers
Total 545 194 351Elementary 265 93 172Secondary 280 101 179
Nonleavers 1,553 650 903Elementary
Total 826 360 466Movers 298 122 176Stayers2 528 238 290
SecondaryTotal 727 290 437
Movers 253 90 163Stayers2 474 200 274
1 Public totals include Bureau of Indian Affairs-funded (BIA) school teachers.2 “Don’t know” strata cases are included in the ‘stayer’ categories of this table.
SOURCE: U.S. Department of Education, National Center for Education Statistics, 2000–01 Teacher Follow-up Survey.
“Don’t know” strata cases are included in the “stayers” categories of table B2. Because the actual status of thesecases was unknown, they were sampled at the lower stayer sampling rate to ensure a representative sample wasdrawn, but were then mailed the Questionnaire for Former Teachers. Approximately 20 percent of these sam-pled cases were determined to be stayers and 80 percent were leavers.
Sorting. Within each public TFS stratum, teachers that were classified by the preliminary interview statusrecode (ISR) as an interview in the 1999–2000 SASS Teacher Survey were sorted by teacher subject, Censusregion, urbanicity, school enrollment and SASS teacher control number.
Sample Selection. After the teachers were sorted, teachers were selected within each stratum using a probabil-ity proportional to size procedure. The measure of size was the 1999–2000 SASS preliminary teacher weight,
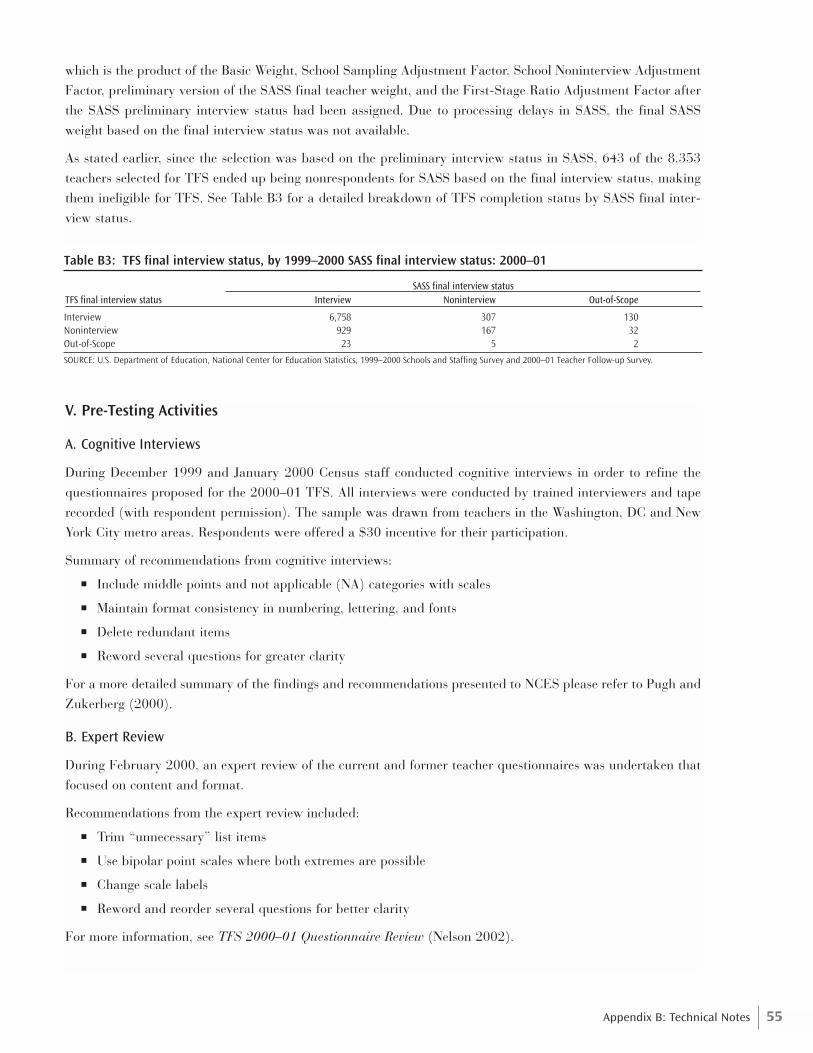
55Appendix B: Technical Notes
which is the product of the Basic Weight, School Sampling Adjustment Factor, School Noninterview AdjustmentFactor, preliminary version of the SASS final teacher weight, and the First-Stage Ratio Adjustment Factor afterthe SASS preliminary interview status had been assigned. Due to processing delays in SASS, the final SASSweight based on the final interview status was not available.
As stated earlier, since the selection was based on the preliminary interview status in SASS, 643 of the 8,353teachers selected for TFS ended up being nonrespondents for SASS based on the final interview status, makingthem ineligible for TFS. See Table B3 for a detailed breakdown of TFS completion status by SASS final inter-view status.
Table B3: TFS final interview status, by 1999–2000 SASS final interview status: 2000–01
TFS final interview status Interview Noninterview Out-of-Scope
Interview 6,758 307 130Noninterview 929 167 32Out-of-Scope 23 5 2
SOURCE: U.S. Department of Education, National Center for Education Statistics, 1999–2000 Schools and Staffing Survey and 2000–01 Teacher Follow-up Survey.
V. Pre-Testing Activities
A. Cognitive Interviews
During December 1999 and January 2000 Census staff conducted cognitive interviews in order to refine thequestionnaires proposed for the 2000–01 TFS. All interviews were conducted by trained interviewers and taperecorded (with respondent permission). The sample was drawn from teachers in the Washington, DC and NewYork City metro areas. Respondents were offered a $30 incentive for their participation.
Summary of recommendations from cognitive interviews:
■ Include middle points and not applicable (NA) categories with scales
■ Maintain format consistency in numbering, lettering, and fonts
■ Delete redundant items
■ Reword several questions for greater clarity
For a more detailed summary of the findings and recommendations presented to NCES please refer to Pugh andZukerberg (2000).
B. Expert Review
During February 2000, an expert review of the current and former teacher questionnaires was undertaken thatfocused on content and format.
Recommendations from the expert review included:
■ Trim “unnecessary” list items
■ Use bipolar point scales where both extremes are possible
■ Change scale labels
■ Reword and reorder several questions for better clarity
For more information, see TFS 2000–01 Questionnaire Review (Nelson 2002).
SASS final interview status

56 Teacher Attrition and Mobility: Results from the Teacher Follow-up Survey, 2000–01
VI. Data Collection Procedures
A. Time Frame of the Survey
The Census Bureau collected the 2000–01 Teacher Follow-up Survey data during the 2000–01 school year. TableB4 summarizes the specific data collection activities and the time frame in which each occurred.
Table B4. TFS data collection schedule: 2000–01
Activity Date of Activity
Advance letters mailed to LEAs and state administrators August 2000Teacher status forms (TFS-1) and letters mailed to sample schools September 2000Reminder postcards mailed to sample schools September 2000Telephone follow-up of teacher status forms not returned by schools September–October 2000Initial mailing of current and former teacher questionnaires (TFS-2 and TFS-3) January 2001Second mailing of current and former teacher questionnaires (TFS-2 and TFS-3) February 2001Telephone and personal visit follow-up of mail questionnaire nonrespondents (TFS-2 and TFS-3) March–May 2001
SOURCE: U.S. Department of Education, National Center for Education Statistics.
B. Data Collection Procedures for TFS
In September 2000, the Census Bureau mailed teacher status forms (TFS-1) to sample schools that had provid-ed lists of teachers for the 1999–2000 SASS. Teacher status was needed to select the sample for TFS. The schoolswere asked to complete the form by indicating whether each teacher listed was still teaching (stayer or mover)or had left the teaching profession (leaver). One week after the TFS-1 mailout, reminder postcards were mailedto the sample schools. In September and early October, Census interviewers telephoned schools that had notreturned the TFS-1 to obtain the requested information.
The Census Bureau regional offices (ROs) were assigned nonresponse cases with no known telephone number forthe TFS-1 Teacher Status Form. The ROs were also assigned former teacher (TFS-2) cases (leavers) for whichCensus did not have a home address and cases of current teachers (stayers or movers) (TFS-3) who were notteaching in the same school as the year before and for whom Census did not have a home address. These caseswere sent directly to the ROs in early January 2001, so the ROs could attempt to locate these cases and admin-ister the appropriate TFS questionnaire.
In January 2001, the TFS questionnaires were mailed to selected teachers and former teachers. Reminder post-cards were mailed one week after the questionnaires. The Questionnaire for Former Teachers (TFS-2) was sentto sample persons reported by school administrators as having left the teaching profession. The Questionnairefor Current Teachers (TFS-3) was sent to sample persons who were reported as still teaching at the elementaryor secondary level. When home addresses were provided, the questionnaires were mailed to the home with anenclosed introductory letter that explained the purpose of the survey as well as a statement of authority andassurance of confidentiality.
In February, the Census Bureau mailed a second questionnaire to each sample person who had not returned thefirst questionnaire. Also, for those who returned the first form and indicated that it did not apply to them (theirstatus was incorrectly reported by their 1999–2000 school), the appropriate questionnaire was mailed to them.For example, if a sampled person who was teaching in another school received the questionnaire for formerteachers (TFS-2), he/she was instructed to return the questionnaire; the Census Bureau sent the correct ques-tionnaire (TFS-3 for current teachers) to the respondent during the second mailout.
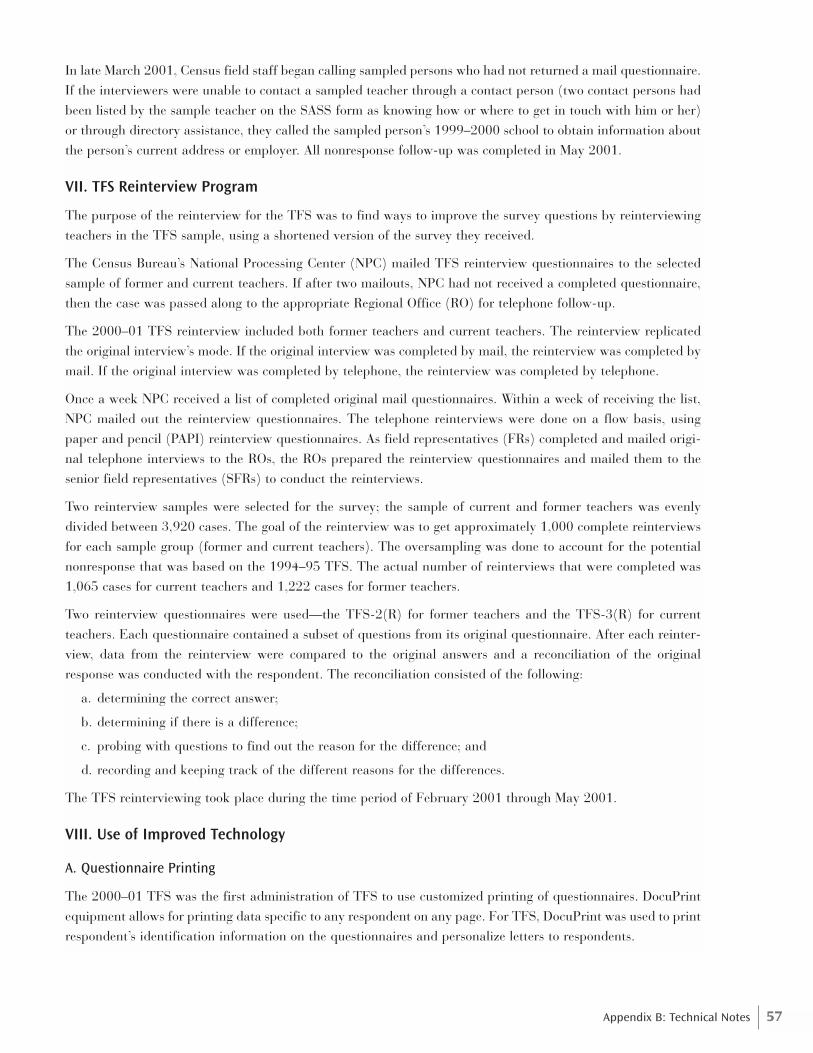
57Appendix B: Technical Notes
In late March 2001, Census field staff began calling sampled persons who had not returned a mail questionnaire.If the interviewers were unable to contact a sampled teacher through a contact person (two contact persons hadbeen listed by the sample teacher on the SASS form as knowing how or where to get in touch with him or her)or through directory assistance, they called the sampled person’s 1999–2000 school to obtain information aboutthe person’s current address or employer. All nonresponse follow-up was completed in May 2001.
VII. TFS Reinterview Program
The purpose of the reinterview for the TFS was to find ways to improve the survey questions by reinterviewingteachers in the TFS sample, using a shortened version of the survey they received.
The Census Bureau’s National Processing Center (NPC) mailed TFS reinterview questionnaires to the selectedsample of former and current teachers. If after two mailouts, NPC had not received a completed questionnaire,then the case was passed along to the appropriate Regional Office (RO) for telephone follow-up.
The 2000–01 TFS reinterview included both former teachers and current teachers. The reinterview replicatedthe original interview’s mode. If the original interview was completed by mail, the reinterview was completed bymail. If the original interview was completed by telephone, the reinterview was completed by telephone.
Once a week NPC received a list of completed original mail questionnaires. Within a week of receiving the list,NPC mailed out the reinterview questionnaires. The telephone reinterviews were done on a flow basis, usingpaper and pencil (PAPI) reinterview questionnaires. As field representatives (FRs) completed and mailed origi-nal telephone interviews to the ROs, the ROs prepared the reinterview questionnaires and mailed them to thesenior field representatives (SFRs) to conduct the reinterviews.
Two reinterview samples were selected for the survey; the sample of current and former teachers was evenlydivided between 3,920 cases. The goal of the reinterview was to get approximately 1,000 complete reinterviewsfor each sample group (former and current teachers). The oversampling was done to account for the potentialnonresponse that was based on the 1994–95 TFS. The actual number of reinterviews that were completed was1,065 cases for current teachers and 1,222 cases for former teachers.
Two reinterview questionnaires were used—the TFS-2(R) for former teachers and the TFS-3(R) for currentteachers. Each questionnaire contained a subset of questions from its original questionnaire. After each reinter-view, data from the reinterview were compared to the original answers and a reconciliation of the originalresponse was conducted with the respondent. The reconciliation consisted of the following:
a. determining the correct answer;
b. determining if there is a difference;
c. probing with questions to find out the reason for the difference; and
d. recording and keeping track of the different reasons for the differences.
The TFS reinterviewing took place during the time period of February 2001 through May 2001.
VIII. Use of Improved Technology
A. Questionnaire Printing
The 2000–01 TFS was the first administration of TFS to use customized printing of questionnaires. DocuPrintequipment allows for printing data specific to any respondent on any page. For TFS, DocuPrint was used to printrespondent’s identification information on the questionnaires and personalize letters to respondents.
58 Teacher Attrition and Mobility: Results from the Teacher Follow-up Survey, 2000–01
B. Imaging of Questionnaires
In previous administrations of TFS, Census Bureau staff keyed completed questionnaires. The 2000–01 TFSused imaging technology, and questionnaires were designed to meet the DocuPrint and imaging data capturedesign requirements for the Workflow Imaging Processing System (WIPS). All returned completed interviewswere image data captured.
The WIPS does not have an integrated system to measure data quality. Staff developed an independent qualityassurance (QA) module to evaluate and ensure the quality of the TFS imaged data—an after-the-fact estimationof the process average. If the batch failed the error tolerance, the entire batch was reprocessed and verified again.If the errors from the sample questionnaire were within acceptable tolerance, the batch was accepted and rout-ed for output. Table B5 provides a summary of the 2000–01 TFS quality assurance procedures and outcomes.
Table B5. TFS Image Data Capture Quality Assurance Summary: 2000–01
Former Teacher Former Teacher Current Teacher Current Teacher Questionnaires Imaged Questionnaire Questionnaire (Reinterview) Questionnaire Questionnaire (Reinterview)
Total batches 267 65 559 62Accepted 257 65 493 54Rejected 10 0 66 8Reject Rate 3.75% 0.00% 11.81% 12.90%CFI Field Counts 25,276 5,394 65,463 4,637CFI Errors 120 10 821 79CFI Error Rate 0.47% 0.19% 1.25% 1.70%KFI Field Counts 25,256 5,374 64,965 4,693KFI Errors 78 7 176 17KFI Error Rate 0.31% 0.12% 0.27% 0.36%
Note: “CFI” is the automated image data extraction and unrecognized fields keyed by a data operator. “KFI” is the verification process when a data operator re-keyed datafrom the sample questionnaire for comparison to the WIPS data.
SOURCE: U.S. Department of Education, National Center for Education Statistics.
C. Survey Design and Documentation System
One of the goals of the 1999–2000 SASS and 2000–01 TFS was to automate design, processing, and documen-tation activities more fully. Developing Surveys (DevSurv) software, developed by staff in the Special SurveysDivision of Statistics Canada, was used to perform many functions and activities. Specifically, the Census Bureauused DevSurv to produce Computer Assisted Telephone Interview (CATI) specifications for SASS, spreadsheetsfor testing scenarios, database structures or record layouts for the survey data files, codebooks, as well as codeto read the microdata files. The DevSurv software used information stored in a Paradox database. The informa-tion entered included such things as question text, response categories, specifications for edits, and specificationsfor derived variables. More information about the DevSurv software can be found in the 1999–2000 Schools andStaffing Survey: Data File User’s Manual (Tourkin et al. forthcoming).
IX. Response Rates
A. Survey Response Rates
Table B6 summarizes the weighted and unweighted response rates for interviews in the Teacher Follow-upSurvey (shown in percentages). Interviews include teachers who met the criteria for inclusion in the TFS andwho sufficiently completed questionnaires. Noninterviews refer to respondents who met the TFS criteria andwere included in the sample, but who did not respond to the questionnaire or did not complete items necessaryto be considered complete. Out-of-scope cases were deemed ineligible to participate in the TFS and were notincluded in the TFS sample. Reasons for an out-of-scope designation include respondents who moved out of theUnited States following the base year or who were deceased.
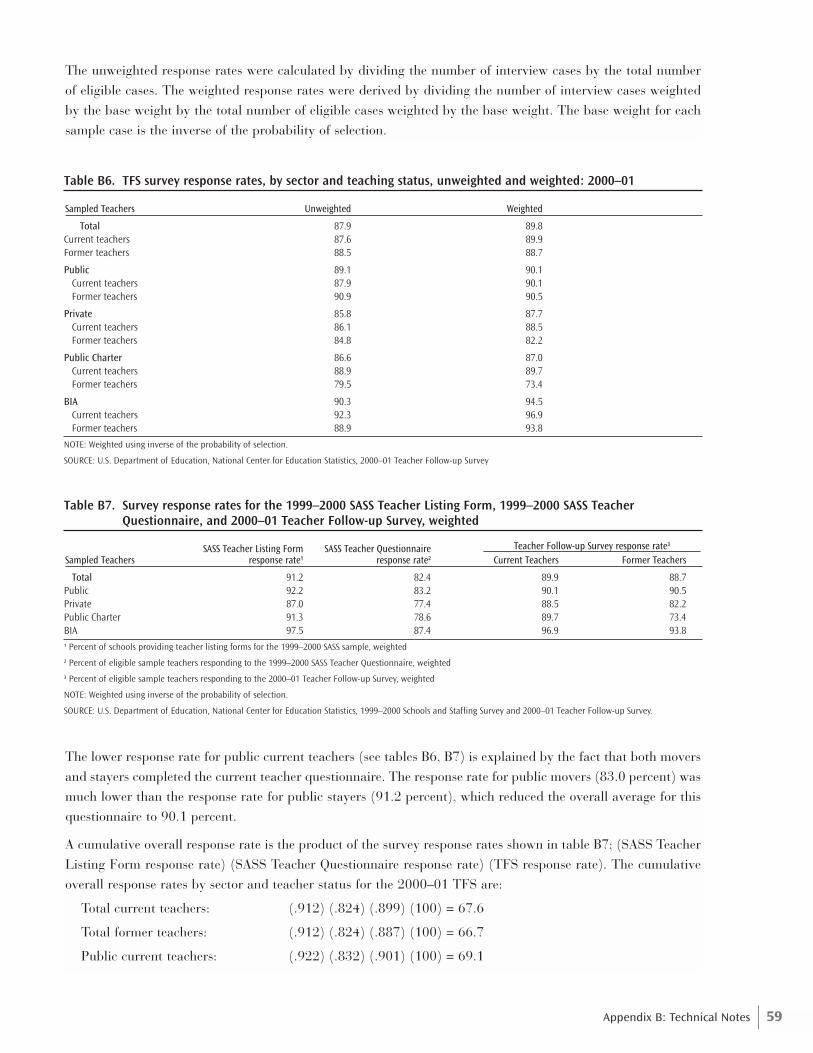
59Appendix B: Technical Notes
The unweighted response rates were calculated by dividing the number of interview cases by the total numberof eligible cases. The weighted response rates were derived by dividing the number of interview cases weightedby the base weight by the total number of eligible cases weighted by the base weight. The base weight for eachsample case is the inverse of the probability of selection.
Table B6. TFS survey response rates, by sector and teaching status, unweighted and weighted: 2000–01
Sampled Teachers Unweighted Weighted
Total 87.9 89.8Current teachers 87.6 89.9Former teachers 88.5 88.7
Public 89.1 90.1Current teachers 87.9 90.1Former teachers 90.9 90.5
Private 85.8 87.7Current teachers 86.1 88.5Former teachers 84.8 82.2
Public Charter 86.6 87.0Current teachers 88.9 89.7Former teachers 79.5 73.4
BIA 90.3 94.5Current teachers 92.3 96.9Former teachers 88.9 93.8
NOTE: Weighted using inverse of the probability of selection.
SOURCE: U.S. Department of Education, National Center for Education Statistics, 2000–01 Teacher Follow-up Survey
Table B7. Survey response rates for the 1999–2000 SASS Teacher Listing Form, 1999–2000 SASS TeacherQuestionnaire, and 2000–01 Teacher Follow-up Survey, weighted
SASS Teacher Listing Form SASS Teacher QuestionnaireSampled Teachers response rate¹ response rate² Current Teachers Former Teachers
Total 91.2 82.4 89.9 88.7Public 92.2 83.2 90.1 90.5Private 87.0 77.4 88.5 82.2Public Charter 91.3 78.6 89.7 73.4BIA 97.5 87.4 96.9 93.8
¹ Percent of schools providing teacher listing forms for the 1999–2000 SASS sample, weighted
² Percent of eligible sample teachers responding to the 1999–2000 SASS Teacher Questionnaire, weighted
³ Percent of eligible sample teachers responding to the 2000–01 Teacher Follow-up Survey, weighted
NOTE: Weighted using inverse of the probability of selection.
SOURCE: U.S. Department of Education, National Center for Education Statistics, 1999–2000 Schools and Staffing Survey and 2000–01 Teacher Follow-up Survey.
Teacher Follow-up Survey response rate³
The lower response rate for public current teachers (see tables B6, B7) is explained by the fact that both moversand stayers completed the current teacher questionnaire. The response rate for public movers (83.0 percent) wasmuch lower than the response rate for public stayers (91.2 percent), which reduced the overall average for thisquestionnaire to 90.1 percent.
A cumulative overall response rate is the product of the survey response rates shown in table B7; (SASS TeacherListing Form response rate) (SASS Teacher Questionnaire response rate) (TFS response rate). The cumulativeoverall response rates by sector and teacher status for the 2000–01 TFS are:
Total current teachers: (.912) (.824) (.899) (100) = 67.6
Total former teachers: (.912) (.824) (.887) (100) = 66.7
Public current teachers: (.922) (.832) (.901) (100) = 69.1
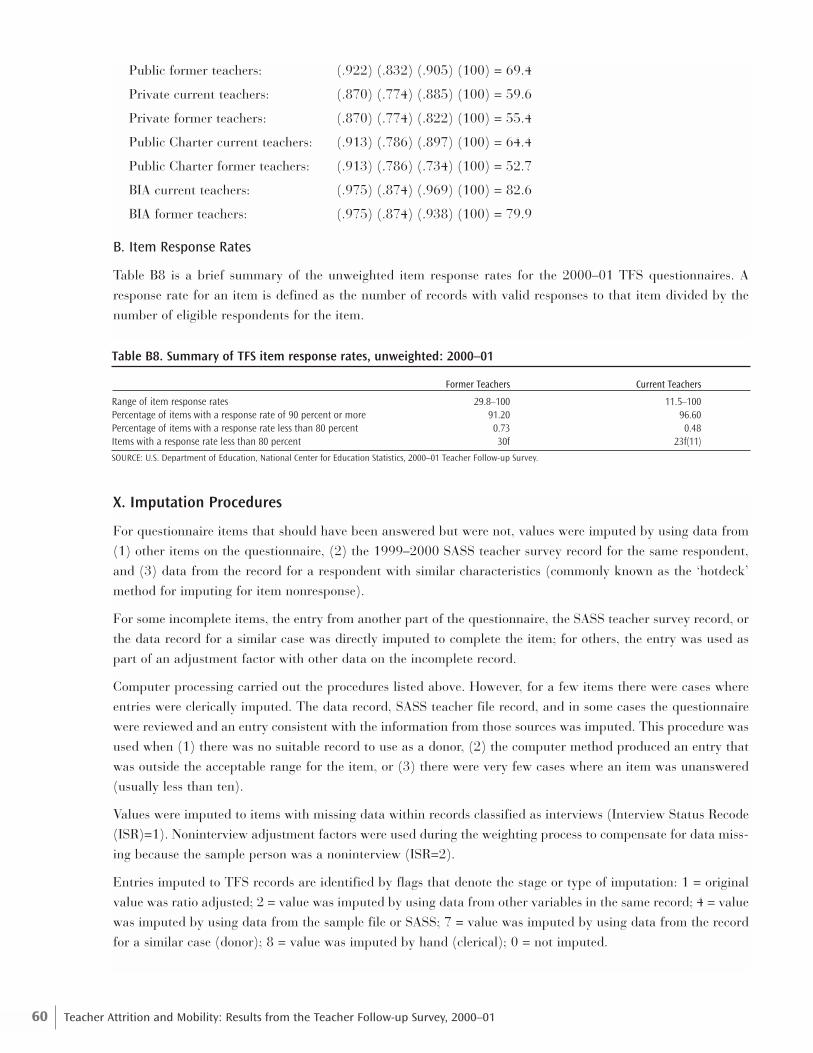
60 Teacher Attrition and Mobility: Results from the Teacher Follow-up Survey, 2000–01
Public former teachers: (.922) (.832) (.905) (100) = 69.4
Private current teachers: (.870) (.774) (.885) (100) = 59.6
Private former teachers: (.870) (.774) (.822) (100) = 55.4
Public Charter current teachers: (.913) (.786) (.897) (100) = 64.4
Public Charter former teachers: (.913) (.786) (.734) (100) = 52.7
BIA current teachers: (.975) (.874) (.969) (100) = 82.6
BIA former teachers: (.975) (.874) (.938) (100) = 79.9
B. Item Response Rates
Table B8 is a brief summary of the unweighted item response rates for the 2000–01 TFS questionnaires. Aresponse rate for an item is defined as the number of records with valid responses to that item divided by thenumber of eligible respondents for the item.
Table B8. Summary of TFS item response rates, unweighted: 2000–01
Former Teachers Current Teachers
Range of item response rates 29.8–100 11.5–100Percentage of items with a response rate of 90 percent or more 91.20 96.60Percentage of items with a response rate less than 80 percent 0.73 0.48Items with a response rate less than 80 percent 30f 23f(11)
SOURCE: U.S. Department of Education, National Center for Education Statistics, 2000–01 Teacher Follow-up Survey.
X. Imputation Procedures
For questionnaire items that should have been answered but were not, values were imputed by using data from(1) other items on the questionnaire, (2) the 1999–2000 SASS teacher survey record for the same respondent,and (3) data from the record for a respondent with similar characteristics (commonly known as the ‘hotdeck’method for imputing for item nonresponse).
For some incomplete items, the entry from another part of the questionnaire, the SASS teacher survey record, orthe data record for a similar case was directly imputed to complete the item; for others, the entry was used aspart of an adjustment factor with other data on the incomplete record.
Computer processing carried out the procedures listed above. However, for a few items there were cases whereentries were clerically imputed. The data record, SASS teacher file record, and in some cases the questionnairewere reviewed and an entry consistent with the information from those sources was imputed. This procedure wasused when (1) there was no suitable record to use as a donor, (2) the computer method produced an entry thatwas outside the acceptable range for the item, or (3) there were very few cases where an item was unanswered(usually less than ten).
Values were imputed to items with missing data within records classified as interviews (Interview Status Recode(ISR)=1). Noninterview adjustment factors were used during the weighting process to compensate for data miss-ing because the sample person was a noninterview (ISR=2).
Entries imputed to TFS records are identified by flags that denote the stage or type of imputation: 1 = originalvalue was ratio adjusted; 2 = value was imputed by using data from other variables in the same record; 4 = valuewas imputed by using data from the sample file or SASS; 7 = value was imputed by using data from the recordfor a similar case (donor); 8 = value was imputed by hand (clerical); 0 = not imputed.
61Appendix B: Technical Notes
The variable names for these flags are F_variable name, where variable name is the variable name for the dataentry, e.g., F_F0059 is the imputation flag for variable F0059 (item 6 of the former teacher questionnaire).
For more information on survey imputation, see Little and Rubin (1987), Kalton and Kasprzyk (1986), Kalton(1983), Madow, Olkin, and Rubin (1983), and Kalton and Kasprzyk (1982).
XI. Weighting
A. SASS Teacher Weights
The final weight for public, BIA, public charter, and private school teachers is the product of:
(Base Weight) and (School Sampling Adjustment Factor) and (Teacher Sampling Adjustment Factor) and(School Noninterview Adjustment Factor) and (Teacher-within-school Noninterview Adjustment Factor) and(Frame Ratio Adjustment Factor) and (Teacher Adjustment Factor)
where:
■ Base Weight is the inverse of the probability of selection of the teacher.
■ School Sampling Adjustment Factor is an adjustment that accounts for unusual circumstances thataffect the school’s probability of selection, such as a merger, split, or duplication.
■ Teacher Sampling Adjustment Factor is an adjustment that accounts for the experienced teachers fromnon-BIA/non-public charter schools that were subsampled out during mail nonresponse follow-up.Subsampling was necessary because the nonresponse follow-up workload was considerably higher thanexpected, overwhelming available interviewing resources. If a teacher that was subsampled out for follow-upreturned a questionnaire by mail, the teacher record was processed with all the other interviewed teachers.
■ School Noninterview Adjustment Factor is an adjustment that accounts for schools that did not haveteachers selected because Teacher Listing Forms were not provided by the school. It is the weighted (theproduct of the school base weight and the school sampling adjustment factor) ratio of total eligible in-scopeschools to the total in-scope schools providing teacher lists, computed within cells.
■ Teacher-within-school Noninterview Adjustment Factor is an adjustment that accounts for sampledteachers that did not respond to the survey. It is the weighted (product of all previously defined compo-nents) ratio of the total eligible teachers to the total eligible responding teachers computed within cells.
■ Frame Ratio Adjustment Factor is a factor that adjusts the sample estimates to known frame totals of num-ber of teachers. For the set of noncertainty schools, the factor is the ratio of the frame estimate of the totalnumber of teachers to the weighted (product of all previously defined components) sample estimate of thetotal number of teachers. These factors are computed within cells. The sample estimate uses the frame countof the number of teachers in the school. For public schools, the 1997–1998 CCD was used as the frame andthe teacher counts were in terms of FTEs. For private schools, the 1997–98 PSS was used as the frame andteacher counts were in terms of headcounts. Teachers from certainty schools were assigned a factor of 1.0.
■ Teacher Adjustment Factor is a factor that adjusts the inconsistency between the estimated number ofteachers from the SASS school data files and the SASS teacher sample files. It is the ratio of the weight-ed number of teachers from the school data file for a cell to the weighted number of teachers on theteacher data file for a cell. The weight is the product of all previously defined components. This factorensures that teacher estimates from the teacher file will agree with the corresponding teacher aggregatesfrom the school file (after imputation) since the teacher file counts are being adjusted to agree with theschool counts.
62 Teacher Attrition and Mobility: Results from the Teacher Follow-up Survey, 2000–01
Note: Due to timing constraints, TFS sampling used a preliminary version of the SASS final teacher weight(based on the preliminary SASS interview status recode (ISR)), which consisted of the SASS base weight, sam-pling adjustment factor, school noninterview, teacher noninterview and first stage factor, but not the teacheradjustment factor.
B. TFS Teacher Weights
The final TFS sample weight equals:
TFS base weight x SASS weighting adjustment factor x TFS noninterview adjustment x TFS ratio adjustment,where:
■ TFS Base Weight is the inverse of the probability of selecting a teacher for TFS. This weight is the prod-uct of the preliminary teacher weight from SASS (described in previous section) and the TFS subsamplingadjustment factor. The TFS subsampling adjustment factor is an adjustment that accounts for the sub-sampling of current teachers from SASS sample teachers.
■ SASS Weighting Adjustment Factor is used to adjust for the fact that preliminary SASS weights wereused in computing the TFS base weight. The weighting adjustment factor adjusts for any changes that mayhave occurred between the preliminary and final SASS weighting calculations.
■ TFS Noninterview Adjustment is the factor used to adjust for teachers who participated in SASS but didnot participate in the 2000–01 TFS.
■ TFS Ratio Adjustment is the factor used to adjust the TFS sample totals to known SASS sample totals.This adjustment ensures that the weighted number of TFS teachers (interviews, noninterviews, and out-of-scopes) will equal the weighted number of SASS teachers from 1999–2000.
XII. Reliability
TFS estimates are based on samples. The sample estimates may differ somewhat from the values obtained fromadministering a complete census using the same questionnaire, instructions, and procedures. The differenceoccurs because a sample survey estimate is subject to two types of errors: nonsampling and sampling. Estimatesof the magnitude of the TFS sampling error can be derived or calculated, but not of nonsampling error. This sec-tion describes TFS nonsampling error sources, followed by a discussion of sampling error, its estimation, and itsuse in data analysis (Jabine 1994; Kalton et al. 2000).
A. Nonsampling Variability
Nonsampling errors are attributed to many sources, including:
■ Inability to obtain information about all cases in the sample (Monaco et al. 1998; Scheuren et al. 1996)
■ Definitional difficulties
■ Differences in the interpretation of questions
■ Inability or unwillingness on the part of the respondents to provide correct information
■ Inability to recall information
■ Poorly worded or vague questions (Salvucci et al. 1997)
■ Errors made in collection (e.g., recording or coding the data)
■ Errors made in processing the data
■ Errors made in estimating values for missing data
■ Undercoverage (Hammon 2001; Lee, Burke, and Rust 2001)
63Appendix B: Technical Notes
Quality control and edit procedures were used to reduce errors made by respondents, coders, and interviewers.More detailed discussion of the existence and control of nonsampling errors in the SASS and TFS can be foundin the Quality Profile for SASS Rounds 1–3: 1987–95 (Kalton et al. 2000).
B. Sampling Variability
Standard errors indicate the magnitude of the sampling error. They also partially measure the effect of some non-sampling errors in response and enumeration, but do not measure any systematic biases in the data. The stan-dard errors mostly measure the variations that occurred by chance because a sample was surveyed rather thanthe entire population.
The sample estimate and its standard error enable one to construct confidence intervals, or ranges that wouldinclude the average result of all possible samples with a known probability. For example, if all possible sampleswere selected and surveyed under essentially the same conditions and with the same sample design, and if esti-mates and their standard errors were calculated from each sample, then—
■ Approximately 90 percent of the intervals from 1.645 standard errors below the estimate to 1.645 stan-dard errors above the estimate would include the average result of all possible samples.
■ Approximately 95 percent of the intervals from 1.960 standard errors below the estimate to 1.960 stan-dard errors above the estimate would include the average result of all possible samples.
The average estimate derived from all possible samples is or is not contained in any particular computed inter-val. However, for a particular sample, one can say with the specified confidence that the confidence intervalincludes the average estimate derived from all possible samples.
Standard errors were estimated using a bootstrap variance procedure which incorporates the design features ofthe complex survey sample design (Kaufman 2000). Information about variance estimation software for com-plex sample surveys can be obtained from http://www.fas.harvard.edu/~stats/survey-soft/survey-soft.html.
XIII. Statistical Tests
The tests of significance used in this analysis are based on Student’s t statistics. As the number of comparisonsthat are conducted at the same significance level increases, it becomes more likely that at least one of the esti-mated differences will be significant merely by chance, that is, will be erroneously identified as different fromzero. Even when there is no statistical difference between the means or percentages being compared, there is a5 percent chance of getting a significant t value of 1.96 from sampling error alone. All the differences cited inthis report are significant at the 0.05 level of significance.
XIV. Data Files
There are currently two types of data files produced for the 2000–01 TFS: restricted-use response rate files,which contain all cases in the original sample, and the restricted-use analysis files, which contain only those casesfor which interviews were obtained. The restricted-use analysis files are fully imputed and weighted. The filesused to generate the estimates in this report were the following:
Restricted-useresponse rate Restricted-use
ID Questionnaire data files analysis data files
TFS-2 Questionnaire for former teachers 9/27/2002 5/29/2003TFS-3 Questionnaire for current teachers 9/27/2002 5/29/2003

64 Teacher Attrition and Mobility: Results from the Teacher Follow-up Survey, 2000–01
Public-use files are not available at the time of this report, but will be released shortly. These files will be releasedfollowing disclosure risk analysis and review.
XV. Cautions Concerning Change Estimates
Care must be taken in estimating change over time in a TFS data element, because some of the measured changemay not be attributable to a change in the educational system. Some of the change may be due to changes in thesampling frame, to questionnaire item wording, or other changes.
The primary reasons for change include the following:
■ Questionnaires were substantially revised. Questions were reworded based on the results of cognitive test-ing. The order of questions on the questionnaires was also changed.
■ The sampling frame has changed somewhat over time. For example, the introduction of public charterschools into the educational system has affected estimates of noncharter public schools as well as publicschools overall.
■ Definitions and concepts have changed over time.
One major change to note is a change in the “community type” variable used in this report. The Common Core ofData (CCD) changed the Census Bureau’s geographic coding of public schools in metropolitan and nonmetropoli-tan areas as of school year 1998–99. The definitional change was to redefine “rural” into two codes: code 7 remainsas “rural outside a metropolitan area,” while the new code 8 is for “rural within a metropolitan area.” This recog-nizes the areas that are rural, even though the entire surrounding places may be defined as part of a metropolitanarea. At the same time, there has been more reporting and assignment of locale codes for public schools using amore precise system of physical addresses (although some public schools still are using mailing addresses). Thephysical address allows for a more precise coding than at the ZIP code level of the mailing address of a public school.The change in the method of assigning locale codes has resulted in some cases shifting from one locale code priorto the 1998–99 school year to another as of 1998–99 and subsequent years. The 3-level urbanicity variable nowincludes the code 8 rural areas in the “urban fringe/large town” category, rather than as part of the “rural/smalltown” category. This definitional and operational change may result in some comparisons of schools by communi-ty type or locale over time that do not reflect actual change, but merely a shift in the distribution of schools by com-munity type due to the difference in definition of rural areas or method of community type assignment.
XVI. Technical Notes References
Broughman, S.P. and Colaciello, L.A. (1999). Private School Universe Survey, 1997–98 (NCES 1999–319). U.S.Department of Education. Washington, DC: National Center for Education Statistics.
Bureau of Indian Affairs. (1998). Office of Indian Education Programs: Education Directory. U.S. Departmentof the Interior. Washington, DC: U.S. Government Printing Office.
Cole, C., Fondelier, S., Jackson, B., Parmer, R., Warner, T., and Weant, G. (forthcoming). 1999–2000 Schoolsand Staffing Survey: Sample Design and Estimation. U.S. Department of Education. Washington, DC:National Center for Education Statistics.
Dale, A. (Ed.). (2000). National Charter School Directory 2000 (6th ed.). Washington, DC: The Center forEducation Reform.
Hammon, T. (2001). Evaluating the Coverage of the U.S. National Center for Education Statistics PublicElementary/Secondary School Frame. In 2001 Proceedings of the Second International Conference onEstablishment Surveys (pp. 79–88). Alexandria, VA: American Statistical Association.
65Appendix B: Technical Notes
Jabine, T. (1994). A Quality Profile for SASS: Aspects of the Quality of Data in the Schools and Staffing Surveys(NCES 94–340). U.S. Department of Education. Washington, DC: National Center for Education Statistics.
Kalton, G. (1983). Compensating for Missing Survey Data. Ann Arbor, MI: Survey Research Center, Universityof Michigan.
Kalton G., Winglee, M.W., Krawchuk, S., and Levine, D. (2000). Quality Profile for SASS: Rounds 1–3:1987–1995 (NCES 2000–308). U.S. Department of Education. Washington, DC: National Center forEducation Statistics.
Kalton, G. and Kasprzyk, D. (1986). The Treatment of Missing Survey Data. Survey Methodology, 12(1): 1–16.
Kalton, G. and Kasprzyk, D. (1982). Imputing for Missing Survey Responses. In 1982 Proceedings of the Sectionon Survey Research Methods (pp. 22–31). Alexandria, VA: American Statistical Association.
Kaufman, S. (2000). A Bootstrap Variance Estimator for Systematic PPS Sampling. In Selected Papers onEducation Surveys: Papers Presented at the 1998 and 1999 ASA and 1999 AAPOR Meetings (NCES2000–04) (pp. 13–18). U.S. Department of Education. Washington, DC: National Center for EducationStatistics.
Lee, H., Burke, J., and Rust, K. (2001). Evaluating the Coverage of the U.S. National Center for EducationStatistics Public and Private School Frame Using Data from the National Assessment of Educational Progress.In 2001 Proceedings of the Second International Conference on Establishment Surveys (pp. 89–98).Alexandria, VA: American Statistical Association.
Little, R.J.A. and Rubin, D.B. (1987). Statistical Analysis with Missing Data. New York: John Wiley and Sons.
Madow, W.G., Olkin, I., and Rubin, D.B. (Eds.). (1983). Incomplete Data in Sample Surveys. New York:Academic Press.
Monaco, D., Salvucci, S., Zhang, F., and Hu, M. (1998). An Analysis of Total Nonresponse in the 1993–94Schools and Staffing Survey (NCES 98–243). U.S. Department of Education. Washington, DC: NationalCenter for Education Statistics.
Nelson, D. (2002). TFS 2000–01 Questionnaire Review. Unpublished working document, U.S. Census Bureau.
Office of Educational Research and Improvement. (2000). The State of Charter Schools 2000. Washington, DC:U.S. Department of Education.
Pugh, K.W. and Zukerberg, A.L. (2000). Preparing SASS for the Millennium: Pretesting Issues in SASS 2000.In Selected Papers on Education Surveys: Papers Presented at the 1998 and 1999 ASA and 1999 AAPORMeetings (NCES 2000–04) (pp. 59–64). U.S. Department of Education. Washington, DC: National Center forEducation Statistics.
Salvucci, S., Walter, E., Conley, V., Fink, S., and Saba, S. (1997). Measurement Error Studies at the NationalCenter for Education Statistics (NCES 97–464). U.S. Department of Education. Washington, DC: NationalCenter for Education Statistics.
Scheuren, F., Monaco, D., Zhang, F., Ikosi, G., and Chang, M. (1996). An Exploratory Analysis of Response Ratesin the 1990–91 Schools and Staffing Survey (SASS) (NCES 96–338). U.S. Department of Education.Washington, DC: National Center for Education Statistics.
Tourkin, S.C., Pugh, K.W., Fondelier, S.E., Parmer, R.J., Gruber, K.J., and Walter, E.J. (forthcoming).1999–2000 Schools and Staffing Survey: Data File User’s Manual. U.S. Department of Education.Washington, DC: National Center for Education Statistics.

66 Teacher Attrition and Mobility: Results from the Teacher Follow-up Survey, 2000–01
67Appendix C: Description of Variables
Several variables from the 1999–2000 Schools and Staffing Survey (SASS) and 2000–01 Teacher Follow-upSurvey (TFS) were used to produce the tables in this report. As all respondents who participated in the 2000–01TFS also participated in the 1999–2000 SASS, data collected from SASS are termed “base year” data becausethe SASS sample is the “base” for teachers who were selected for the Teacher Follow-up Survey.
Variables Found in More Than One Table
The rows found in tables 2, 3, 4, 6, 7, and 8 consist of selected teacher and school base year characteristics.These characteristics, reported for stayers, movers, and leavers, include the following:
■ Age: Included on the data file as “AGE_T,” a SASS created variable based on respondents’ reported yearof birth. AGE_T is a continuous variable and was created by subtracting teachers’ reported year of birthfrom the year of data collection (2000). AGE_T was recoded for this report and the following categoriesare included: less than 30 years, 30 to 39 years, 40 to 49 years, and 50 years or more. To allow for trendanalysis, categories used in table 2 include: less than 25 years, 25 to 29 years, 30 to 39 years, 40 to 49years, 50 to 59 years, 60 to 64 years, and 65 years or more.
■ Community type: Included on the data file as “URBANIC,” a SASS created variable based on the physicallocation of the school in which the respondent taught during the base year. URBANIC is a 3-level collapseof the 8-level variable SLOCPHYS, created by the Census Geography division and also included on theSASS data file. Categories include central city, urban fringe/large town, and rural/small town. “Centralcity” includes schools located in large and mid-size central cities, as defined by the Census Bureau. “Urbanfringe/large town” includes schools located in urban fringes of large and mid-size central cities, in largetowns, and in rural areas inside a metropolitan statistical area. “Rural/small town” includes schools locat-ed in small towns or rural areas outside a metropolitan statistical area.
■ Main assignment field: The 1999–2000 SASS asked respondents to report their main assignment. Mainassignment was defined as the field in which respondents taught the most classes. Categories used in thisreport include arts and music, English/language arts, general elementary, mathematics, science, socialstudies, special education, and other. The arts and music category includes teachers who reported a mainassignment in art, dance, drama/theater, or music. The English/language arts category includes teacherswho reported a main assignment in English or language arts, journalism, or reading. The general ele-mentary category includes teachers who reported a main assignment in prekindergarten, kindergarten, orelementary. The mathematics category includes teachers who reported a main assignment in mathemat-ics. The science category includes teachers who reported a main assignment in biology or life science,chemistry, earth/space science/geology, general science, physical science, physics, or other natural sci-ences. The social studies category includes teachers who reported a main assignment in social studies orsocial science (including history). The special education category includes teachers who reported a mainassignment in general special education, autism, deaf and hard-of-hearing, developmentally delayed,early childhood special education, emotionally disturbed or behavior disorders, learning disabilities, men-tally retarded, mildly/moderately disabled, orthopedically impaired, severely/profoundly disabled,speech/language impaired, traumatically brain-injured, visually impaired, or other special education. The
Appendix C: Description of Variables
68 Teacher Attrition and Mobility: Results from the Teacher Follow-up Survey, 2000–01
all others category includes teachers who reported a main assignment in American Indian/NativeAmerican studies, architecture or environmental design, basic skills or remedial education, bilingual edu-cation, computer science, English as a second language, family and consumer science, gifted, health edu-cation, military science, philosophy, physical education, religion, foreign languages, vocational-technicaleducation, or all others.
■ Minority enrollment: Included on the data file as “MINENR,” a SASS created variable based on the per-centage of enrolled minority students as reported by the respondents’ base year school. MINENR is a con-tinuous variable and was created by dividing the number of minority students enrolled in the school by thetotal number of students enrolled in the school. Minority students include American Indian or AlaskaNative; Asian or Pacific Islander; black, non-Hispanic; and Hispanic students. MINENR was recoded forthis report and the following categories are included: less than 10 percent minority enrollment, between 10percent and 34 percent minority enrollment, and more than 35 percent minority enrollment.
■ Race/ethnicity: Included on the data file as “RACETH_T,” a SASS created variable based on respon-dents’ reported race and ethnicity. Categories used in this report include White, non-Hispanic; AmericanIndian or Alaska Native; Asian or Pacific Islander; Black, non-Hispanic; and Hispanic. The TFS raceand ethnicity items differ from those used in the 1999–2000 SASS. Hispanic or Latino ethnicity is nowasked in the TFS prior to the race item. Hispanics or Latinos can be of any race. The race categories inTFS are now: White, Black or African-American, Asian, American Indian or Alaska Native, and NativeHawaiian or other Pacific Islander. For this report, race and ethnicity from the SASS, as opposed to theTFS, were used.
■ Region: Included on the data file as “REGION,” a SASS created variable based on the Census region wherethe respondent’s base year local education agency or school was located. Categories include Northeast,Midwest, South, and West. Northeast includes Connecticut, Maine, Massachusetts, New Hampshire, NewJersey, New York, Pennsylvania, Rhode Island, and Vermont. Midwest includes Illinois, Indiana, Iowa,Kansas, Michigan, Minnesota, Missouri, Nebraska, North Dakota, Ohio, South Dakota, and Wisconsin.South includes Alabama, Arkansas, Delaware, District of Columbia, Florida, Georgia, Kentucky,Louisiana, Maryland, Mississippi, North Carolina, Oklahoma, South Carolina, Tennessee, Texas, Virginia,and West Virginia. West includes Alaska, Arizona, California, Colorado, Hawaii, Idaho, Montana, Nevada,New Mexico, Oregon, Utah, Washington, Wyoming.
■ School enrollment: Included on the data file as “SCHSIZE,” a SASS created variable based on the numberof enrolled students as reported by the respondent’s base year school. Categories include 1 to 49 students,50 to 99 students, 100 to 149 students, 150 to 199 students, 200 to 349 students, 350 to 499 students,500 to 749 students, 750 to 999 students, 1000 to 1199 students, 1200 to 1499 students, 1500 to 1999students, and 2000 students or more. Categories used in this report include less than 200 students, 200 to349 students, 350 to 499 students, 500 to 749 students, and 750 students or more.
■ School level: Included on the data file as “SCHLEVEL,” a SASS created variable based on the gradesoffered by the respondents’ base year school. Categories include elementary, secondary, and combinedgrades. Elementary schools include those with any of grades K–6 and none of grades 9–12. Secondaryschools include those with any of grades 7–12 and none of grades 1–6. Combined schools include thosewith one or more of grades K–6 and one or more of grades 9–12.
■ Sex: The 1999–2000 SASS asked respondents to report whether they were male or female.
■ Teaching experience: Included on the data file as “TOTEXPER,” a SASS created variable based on therespondents’ total full-time and part-time teaching experience in public and private schools, as reported dur-ing the base year. TOTEXPER is a continuous variable and was recoded for this report into the following
69Appendix C: Description of Variables
categories: 1 to 3 years, 4 to 9 years, 10 to 19 years, and 20 years or more. To allow for trend analysis, teach-ing experience in table 2 includes only teachers’ full-time teaching experience.
■ Teaching status: The 1999–2000 SASS asked teachers to report whether they worked at their teachingposition full-time or part-time.
Table-Specific Variables
In addition to selected base year teacher and school characteristics, the tables in this report also incorporate othervariables from the 1999–2000 SASS and 2000–01 TFS “Questionnaire for Current Teachers” and“Questionnaire for Former Teachers:”
■ Table 4: The average reported base year income of stayers, movers, and leavers is included on the data fileas “EARNALL,” a SASS created variable based on teachers’ total yearly earnings. EARNALL is a contin-uous variable and includes summer school earnings, summer earnings obtained through a nonteaching jobin a school, summer earnings obtained through a nonschool job, base teaching salary, additional compen-sation earned during the school year for extracurricular activities, additional income earned during theschool year from other school sources, and additional income earned during the school year for work out-side the school system. EARNALL was recoded for this report and the following categories are included:less than $30,000, $30,000 to $39,999, and $40,000 or more.
■ Table 5: The 1999–2000 SASS asked teachers how long they planned to remain in teaching. Stayers andmovers were asked the same question one year later in the TFS “Questionnaire for Current Teachers.”Response options included: as long as I am able, until I am eligible for retirement, will probably continueunless something better comes along, definitely plan to leave teaching as soon as I can, and undecided atthis time. Table 5 reports responses for stayers, movers, and leavers during the base year and, for stayersand movers, during the TFS year.
■ Table 6: In the 2000–01 TFS “Questionnaire for Current Teachers,” movers were asked to rate the impor-tance of various reasons for moving from their base year schools. Respondents rated possible reasons on afive-point scale: not at all important, slightly important, somewhat important, very important, or extreme-ly important. Reasons that movers were asked to rate included the following: changed residence, bettersalary or benefits, higher job security, opportunity for a better teaching assignment (grade level or subjectarea), dissatisfaction with workplace conditions at previous school, dissatisfaction with support fromadministrators at previous school, dissatisfaction with changes in job description or job responsibilities, didnot feel prepared to implement new reform measures, did not agree with new reform measures, laid off orinvoluntarily transferred, did not have enough autonomy over classroom at previous school, dissatisfactionwith opportunities for professional development at previous school, and dissatisfaction with previous schoolfor other reasons. The percentage of movers who indicated that each factor was very important or extreme-ly important in their decision to move is reported in table 6. All reasons that movers were asked to rate areincluded in table 6 except “dissatisfaction with previous school for other reasons” and, for private schoolteachers, “did not have enough autonomy over classroom at previous school.” These reasons were notincluded due to page size constraints and small cell sizes and related confidentiality concerns. In table 6“did not feel prepared to implement new reform measures” and “did not agree with new reform measures”were combined into a single category.
■ Table 7: In the 2000–01 TFS “Questionnaire for Former Teachers,” leavers were asked to rate the impor-tance of various reasons for leaving the teaching profession. Respondents rated possible reasons on a five-point scale: not at all important, slightly important, somewhat important, very important, or extremely
70 Teacher Attrition and Mobility: Results from the Teacher Follow-up Survey, 2000–01
important. Reasons that leavers were asked to rate included the following: changed residence, pregnan-cy/childrearing, health, retirement, wanted to teach in a different state but my state teacher certificationwas not accepted, laid off or involuntarily transferred, to take a sabbatical or other break from teaching,better salary or benefits, to pursue another career, to take courses to improve career opportunities withinthe field of education, to take courses to improve career opportunities outside the field of education, schoolreceived little support from the community, dissatisfied with job description or responsibilities, dissatisfiedwith changes in job description or responsibilities, did not feel prepared to implement new reform mea-sures, did not agree with new reform measures, and other family or personal categories. The percentage ofleavers who indicated that each reason was very important or extremely important in their decision to leavethe teaching profession is reported in table 7. All reasons that respondents were asked to rate are includedin table 7 except the following: wanted to teach in a different state but my state teacher certification wasnot accepted, laid off or involuntarily transferred, to take a sabbatical or other break from teaching, andother family or personal reasons. These reasons were not included due to page size constraints and smallcell sizes and related confidentiality concerns. In table 7 “to take courses to improve career opportunitieswithin the field of education” and “to take courses to improve career opportunities outside the field of edu-cation” were combined into a single category. “Did not feel prepared to implement new reform measures”and “did not agree with new reform measures” were also combined in table 7.
■ Table 8: In the 2000–01 TFS “Questionnaire for Former Teachers,” leavers who were collecting a pensionfrom a teacher retirement system were asked about the importance of a series of factors in their decisionsto retire. Respondents could rate each factor along a five-point scale: not at all important, slightly impor-tant, somewhat important, very important, or extremely important. Reasons that leavers were asked to rateincluded the following: became eligible to receive full pension benefits, became eligible to accept an earlyretirement incentive, wanted to teach in a different state but my state teacher certification was not accept-ed there, dissatisfied with job description or job responsibilities, dissatisfied with changes in job descrip-tion or responsibilities, did not feel prepared to implement new reform measures, did not agree with newreform measures, dissatisfied with teaching as a career, other family or personal reasons. The percentageof leavers who indicated that each factor was very important or extremely important in their decision toretire is reported in table 8. All factors that respondents were asked to rate are included in table 8 except“wanted to teach in a different state but my state teacher certification was not accepted there.” This fac-tor was not included due to small cell sizes and related confidentiality concerns. In table 8 “did not feelprepared to implement new reform measures” and “did not agree with new reform measures” were com-bined into a single category.
■ Table 9: In the 2000–01 TFS “Questionnaire for Current Teachers” and “Questionnaire for FormerTeachers,” movers and leavers were asked whether they agreed or disagreed with various statements abouttheir former schools. Respondents could choose from among the following response options: strongly dis-agree, somewhat disagree, neither agree nor disagree, somewhat agree, or strongly agree. Movers andleavers were asked to respond to the following statements: I was satisfied with my salary; the school or dis-trict offered satisfactory benefits; I was satisfied with the level of job security at the school; the school facil-ity (buildings and grounds) was in need of significant repair; the school was located in a safe neighbor-hood; I felt safe at the school; the school’s security policies and practices were sufficient; student behaviorwas a problem; most of the students in the school were motivated to learn; the school emphasized acade-mic success; I received little support from parents; the school received little support from the community;the procedures for teacher performance evaluation were satisfactory; I was satisfied with the policies andpractices for assigning students to classes or sections for instruction; some of the classes or sections I taughtwere too large; I was satisfied with the grade(s) I was assigned to teach; I was satisfied with the subject(s)
71Appendix C: Description of Variables
I was assigned to teach; I often felt that my teaching workload was too heavy; I did not have enough influ-ence over the school’s policies and practices; I was satisfied with the amount of autonomy and control I hadover my own classroom; resources and materials/equipment for my classroom(s) were sufficiently avail-able; computers and other technology for my classroom(s) were sufficiently available; there was not enoughtime available for planning and preparation during a typical week at the school; the professional caliber ofthe faculty at the school was high; there were many opportunities to collaborate with other teachers in theschool; there was not enough uninterrupted class time available for instruction; at last year’s school, includ-ing (mainstreaming) special needs (e.g., disabled) students in regular classes made it difficult for me toteach; I was pleased with the opportunities for professional advancement (promotion) offered to teachersat the school; I was pleased with the opportunities for professional development (learning/training) offeredto teachers at the school; required professional development activities at the school usually closely matchedmy professional development goals; the school administrators’ behavior toward the staff was supportiveand encouraging; in thinking of all the factors that influenced my satisfaction with teaching in last year’sschool, overall, I was satisfied; in thinking of all the factors that influenced my satisfaction with teachingin general, overall, I was satisfied. The percentage of movers and leavers who strongly agreed or stronglydisagreed to each statement is reported in table 9.
■ Table 10: In the 2000–01 TFS “Questionnaire for Former Teachers” and “Questionnaire for CurrentTeachers,” stayers, movers, and leavers were asked to rate characteristics of their base year instructionalleaders. Leavers rated their instructional leaders along the following five-point scale: not at all effectively,somewhat effectively, quite effectively, very effectively, or extremely effectively. Movers and stayers ratedtheir instructional leaders along the following five-point scale: not at all effectively, slightly effectively,somewhat effectively, very effectively, or extremely effectively. Respondents evaluated instructional leaderperformance in the following areas: communicating respect and value of teachers; encouraging teachers tochange teaching methods if students are not doing well; working with staff to develop and attain curricu-lum standards; encouraging professional collaboration among teachers; working with teaching staff to solveschool or department problems; encouraging the teaching staff to use student evaluation results in plan-ning curriculum and instruction; developing broad agreement among the teaching staff about the school’sor department’s mission; facilitating and encouraging professional development activities of teachers. Table10 includes the percentage of stayers, movers, and leavers who responded “very effectively” or “extreme-ly effectively” to each aspect of the instructional leader.
■ Table 11: In the 2000–01 TFS “Questionnaire for Current Teachers,” stayers and movers were askedwhether they agreed or disagreed with various statements about the administrator and staff at their baseyear school. Response options included: strongly disagree, somewhat disagree, neither agree nor disagree,somewhat agree, and strongly agree. Stayers and movers were asked to respond to the following statements:the school administrators’ behavior toward the staff is supportive and encouraging; the school principalenforces school rules for student conduct and backs me up when I need it; most of my colleagues share mybeliefs and values about what the central mission of the school should be; there is a great deal of coopera-tive effort among the staff members. Table 11 includes the percentage of stayers and movers who respond-ed “strongly agree” or “strongly disagree” to each statement about their administrator.
■ Table 12: In the 2000–01 TFS “Questionnaire for Current Teachers,” movers were asked to describe themove from their former school. Response options included: moved from one public school to another publicschool in the same school district, moved from one public school district to another public school district,moved from a private school to a public school, moved from one private school to another private school,moved from a public school to a private school. In this table, average responses were reported for all movers,movers with less than 5 years of teaching experience, and movers with 5 or more years of experience.
72 Teacher Attrition and Mobility: Results from the Teacher Follow-up Survey, 2000–01
Teaching experience is included on the data file as “TOTEXPER,” a SASS created variable based on respon-dents’ total full-time and part-time teaching experience in public and private schools.
■ Table 13: In the 2000–01 TFS “Questionnaire for Former Teachers,” leavers were asked about their cur-rent main occupational status. Response options included: attending a college or university, caring for fam-ily members, disabled, retired, other, unemployed and seeking work, working in an elementary or sec-ondary school with an assignment other than teaching, working in an education occupation outside of ele-mentary or secondary education, working in an occupation outside the field of education. Response optionsfor leavers who were working included: employee of a private company, business, or individual for wages,salary, or commission; federal government employee; state government employee; local governmentemployee; self-employed in own business, professional practice, or farm; working without pay in a familybusiness or farm; working without pay in a volunteer job. Leavers who indicated that they were “a feder-al government employee” or “a state government employee” were combined into a single category in table13. Leavers who indicated that they were “working without pay in a family business or farm” or “work-ing without pay in a volunteer job” were also combined in table 13.
■ Table 14: In the 2000–01 TFS “Questionnaire for Former Teachers,” leavers who were working were askedto compare their current occupations to teaching with respect to 17 criteria: salary, benefits, job security,intellectual challenge, opportunities for professional development, professional prestige, general work con-ditions, safety of environment, manageability of workload, procedures for performance evaluation, auton-omy or control over own work, influence over workplace policies and practices, availability of resourcesand materials/equipment for doing job, recognition and support from administrators/managers, profes-sional caliber of colleagues, opportunities for professional advancement, opportunities for learning fromcolleagues. Leavers rated each criterion based on a three-point scale: better in teaching, better in currentposition, or no difference. All criteria are reported in table 14.


