Creating materials to be used in the classroom requires an understanding of thesubject. One person is usually not equipped to create a dynamic learning programfor students. The author would like to acknowledge the following persons ororganizations who have contributed to this chapter.
Objective: Students learn the causes ofearthquakes.
Teacher noteThis reader gives students a scientific background of earthquakes. The
different types of energy that are released through seismic waves are emphasized.The reader also illustrates the different types of faults that can be caused by thisenergy.
Students are asked to make a fault model and to compare different types ofmotion.
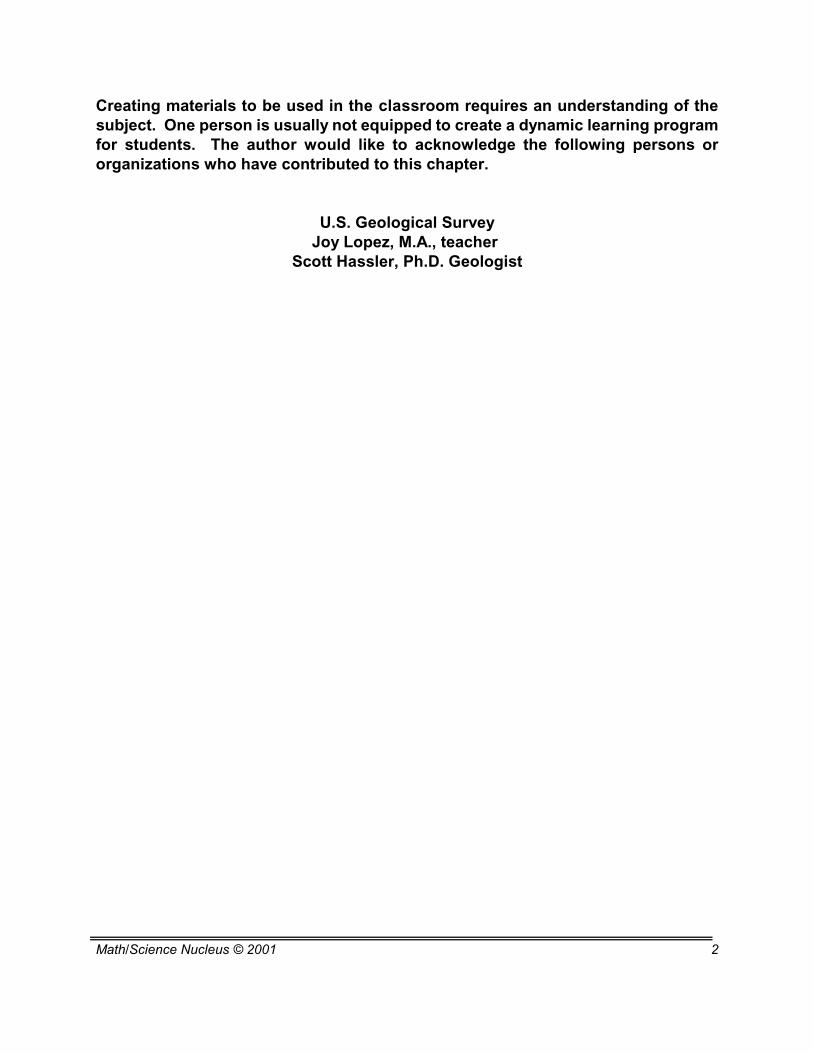
Eight story building in Caracas,Venezuela.
EARTH SCIENCES - EARTHQUAKES
Lesson 1- GENERAL EARTHQUAKE INFORMATION
MATERIALS:
reader worksheet
gluecrayonsscissors
Imagine you are lying on a couch watchingtelevision. Suddenly the television set starts to rattleback and forth. At first you think it must be a largetruck or a low flying plane. However, instead offading away, the shaking gets stronger. Books andpictures start falling off the walls. Maybe they fall onyou. You try to stand, but the shaking is so strongthat you cannot balance yourself. You end up on thefloor and you hide under a strong table. A loudroaring noise vibrates in your ears, almost deafening.The power goes out. The television falls over. Youhear dishes breaking in the kitchen. The room fillswith dust. Gradually the shaking stops, and you canstand up again. You run outside. Trees have fallenover. Power lines litter the street. A nearby buildinghas collapsed.
Experiencing an earthquake of Magnitude 7 isone of the most frightening events you may everexperience. But how can the Earth be sodestructive?
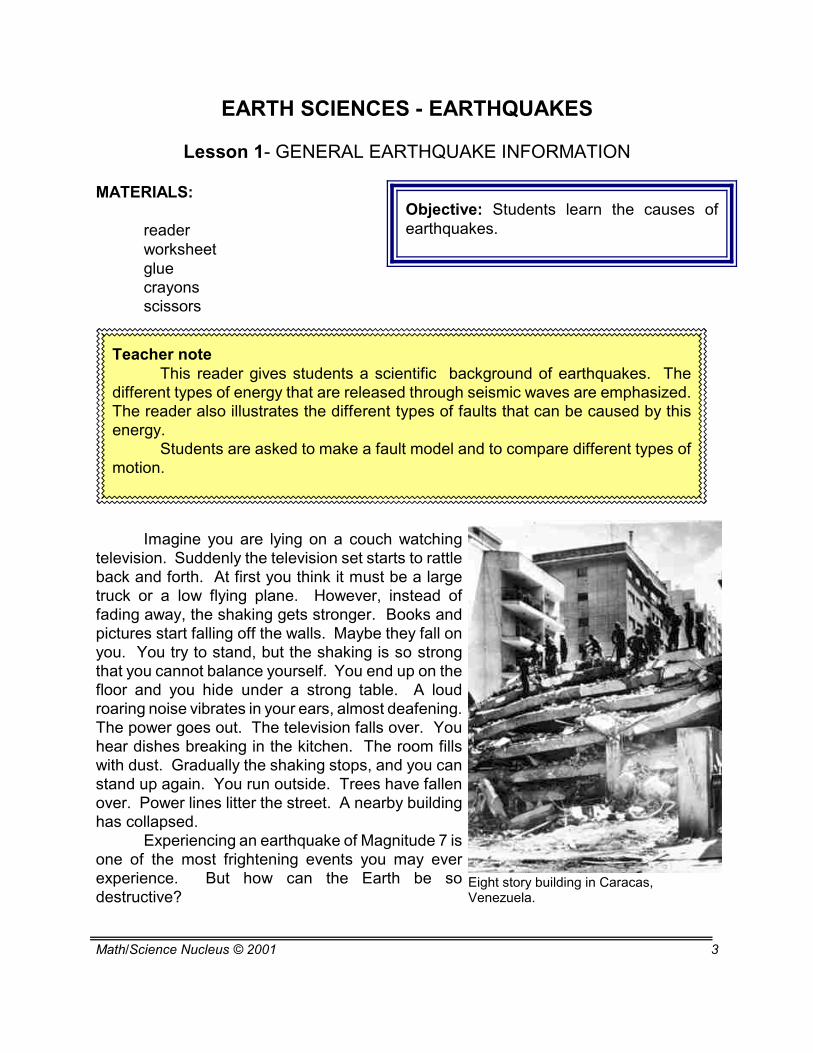
The Earth is not just a solid rock,rotating on its axis. Scientists havedetermined that the inside of the Earth iscomposed of different layers. The core,mantle, and crust. The interaction of thecrust and the mantle causes many of ourdeep earthquakes. The upper mantlecontains an area cal led theasthenosphere that is partially molten.The area above the asthenosphere iscalled the lithosphere. The lithosphere is“floating” of the asthenosphere in largeblocks which act together. These“blocks” are what scientists refer to asplates. The plates move slowly due toseveral reasons including convection, gravity, rotation, and other forces.
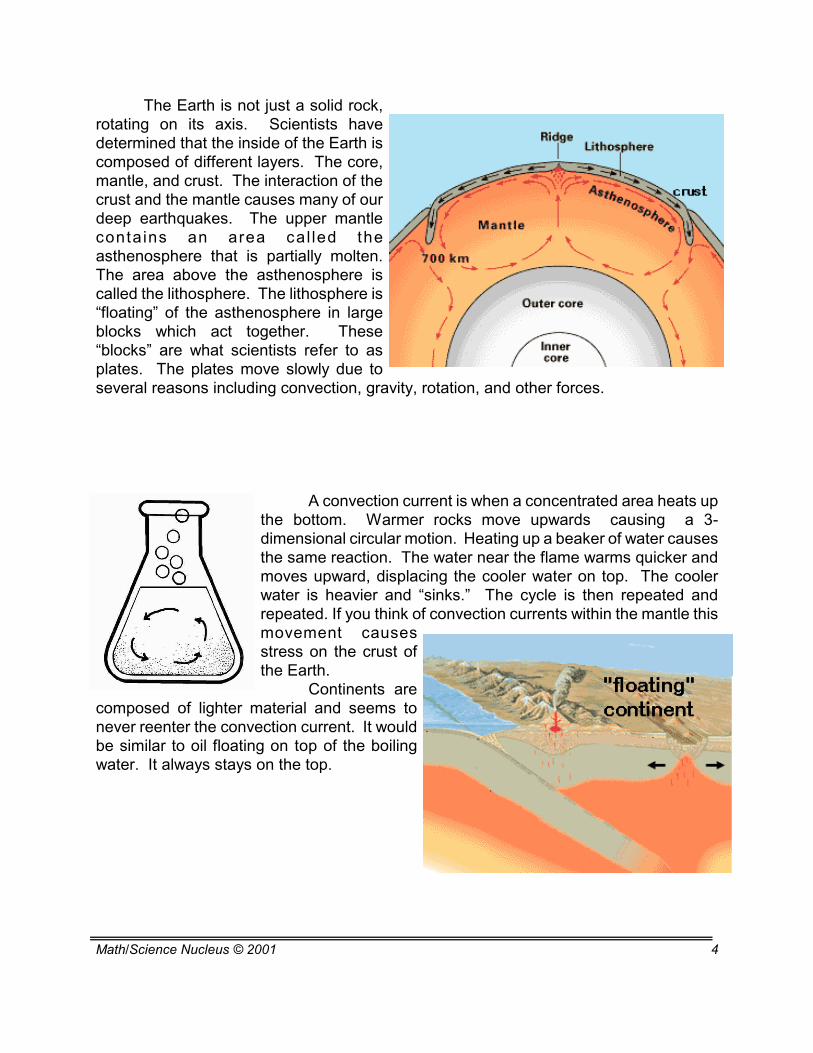
A convection current is when a concentrated area heats upthe bottom. Warmer rocks move upwards causing a 3-dimensional circular motion. Heating up a beaker of water causesthe same reaction. The water near the flame warms quicker andmoves upward, displacing the cooler water on top. The coolerwater is heavier and “sinks.” The cycle is then repeated andrepeated. If you think of convection currents within the mantle thismovement causesstress on the crust ofthe Earth.
Continents arecomposed of lighter material and seems tonever reenter the convection current. It wouldbe similar to oil floating on top of the boilingwater. It always stays on the top.
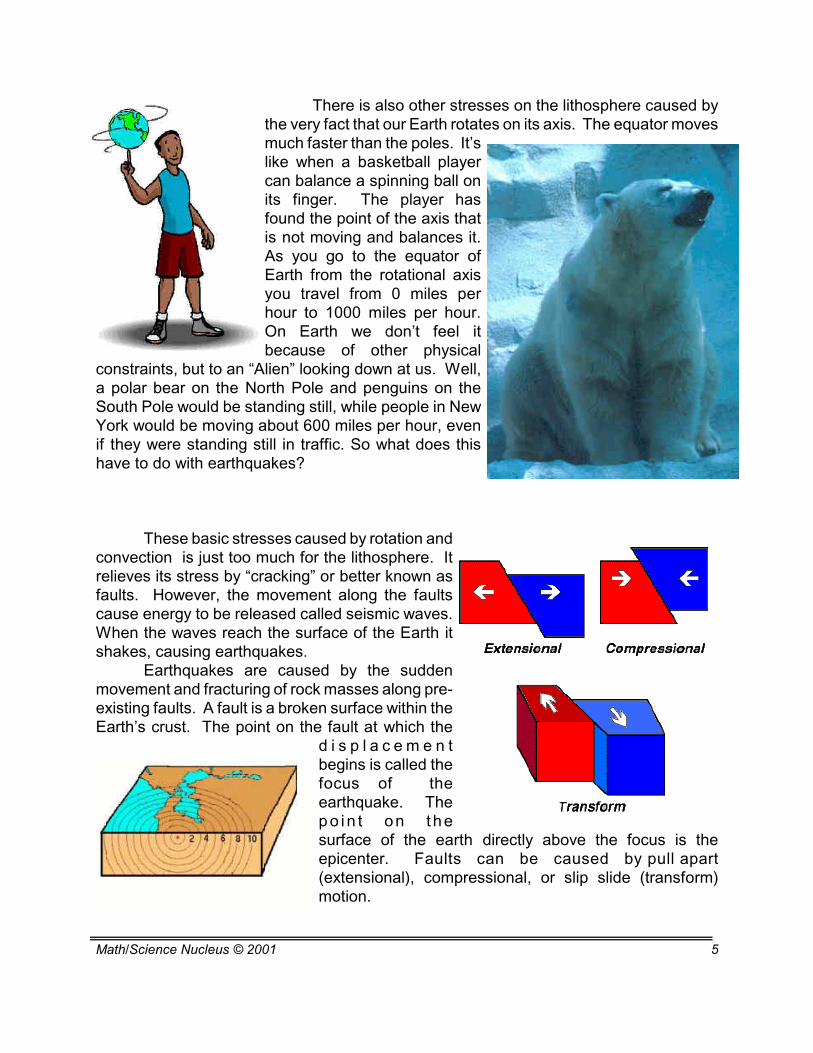
There is also other stresses on the lithosphere caused bythe very fact that our Earth rotates on its axis. The equator movesmuch faster than the poles. It’slike when a basketball playercan balance a spinning ball onits finger. The player hasfound the point of the axis thatis not moving and balances it.As you go to the equator ofEarth from the rotational axisyou travel from 0 miles perhour to 1000 miles per hour.On Earth we don’t feel itbecause of other physical
constraints, but to an “Alien” looking down at us. Well,a polar bear on the North Pole and penguins on theSouth Pole would be standing still, while people in NewYork would be moving about 600 miles per hour, evenif they were standing still in traffic. So what does thishave to do with earthquakes?
These basic stresses caused by rotation andconvection is just too much for the lithosphere. Itrelieves its stress by “cracking” or better known asfaults. However, the movement along the faultscause energy to be released called seismic waves.When the waves reach the surface of the Earth itshakes, causing earthquakes.
Earthquakes are caused by the suddenmovement and fracturing of rock masses along pre-existing faults. A fault is a broken surface within theEarth’s crust. The point on the fault at which the
d i s p l a c e m e n tbegins is called thefocus of theearthquake. Thep o in t on thesurface of the earth directly above the focus is theepicenter. Faults can be caused by pull apart(extensional), compressional, or slip slide (transform)motion.
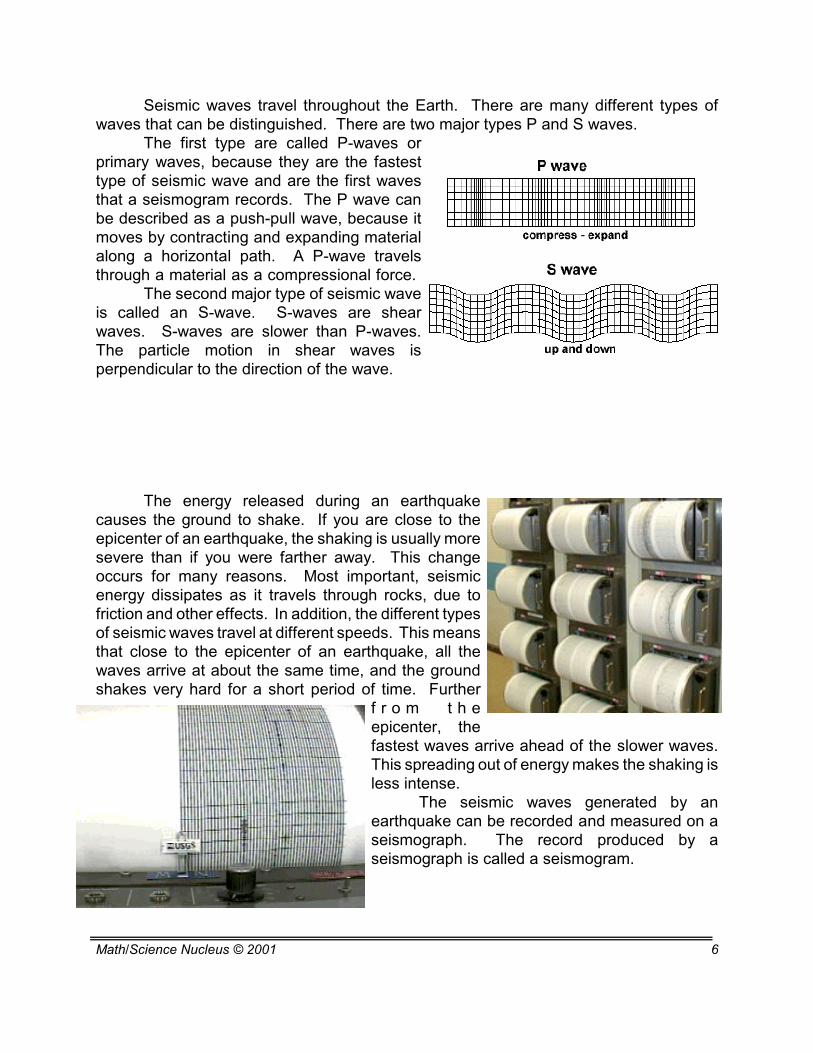
Seismic waves travel throughout the Earth. There are many different types ofwaves that can be distinguished. There are two major types P and S waves.
The first type are called P-waves orprimary waves, because they are the fastesttype of seismic wave and are the first wavesthat a seismogram records. The P wave canbe described as a push-pull wave, because itmoves by contracting and expanding materialalong a horizontal path. A P-wave travelsthrough a material as a compressional force.
The second major type of seismic waveis called an S-wave. S-waves are shearwaves. S-waves are slower than P-waves.The particle motion in shear waves isperpendicular to the direction of the wave.
The energy released during an earthquakecauses the ground to shake. If you are close to theepicenter of an earthquake, the shaking is usually moresevere than if you were farther away. This changeoccurs for many reasons. Most important, seismicenergy dissipates as it travels through rocks, due tofriction and other effects. In addition, the different typesof seismic waves travel at different speeds. This meansthat close to the epicenter of an earthquake, all thewaves arrive at about the same time, and the groundshakes very hard for a short period of time. Further
f r o m t h eepicenter, thefastest waves arrive ahead of the slower waves.This spreading out of energy makes the shaking isless intense.
The seismic waves generated by anearthquake can be recorded and measured on aseismograph. The record produced by aseismograph is called a seismogram.
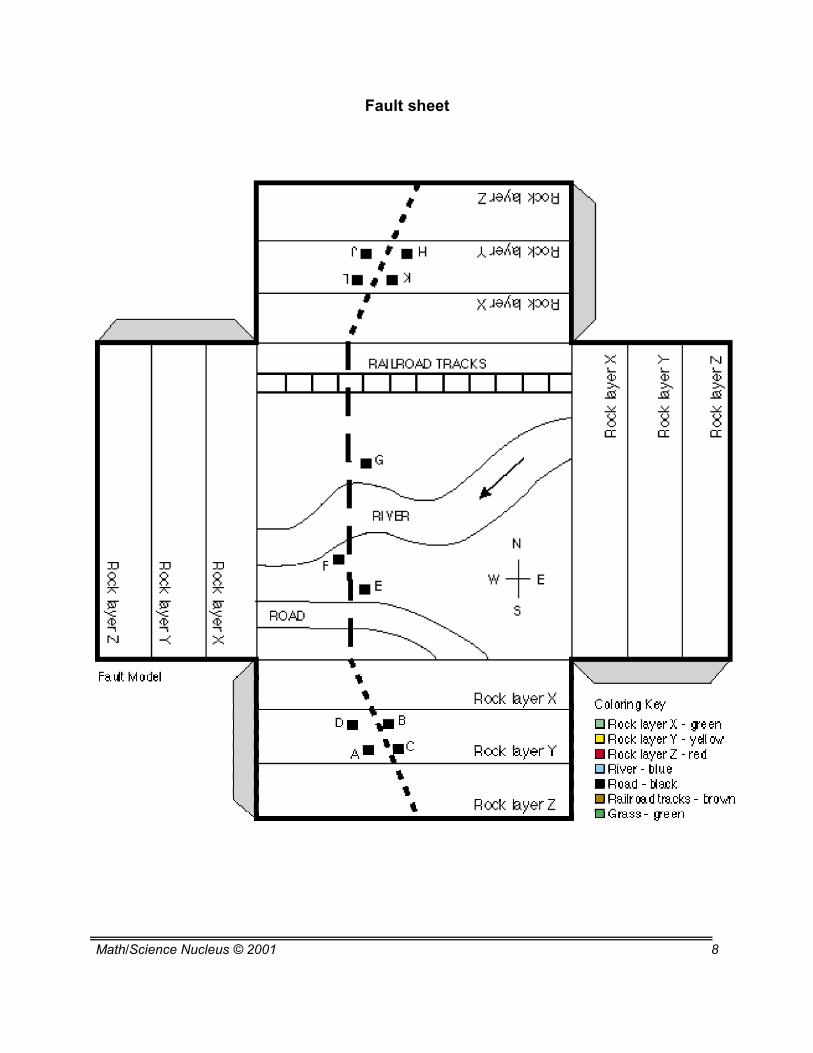
1. Color the fault model that is included according to the color key provided. 2. Paste or glue the fault model onto a piece of construction paper.
3. Cut out the fault model and fold each side down to form a box with the drawnfeatures on top. Make sure you fold all parts before you glue or tape.
4. Tape or glue the corners together. This box is a three dimensional model of thetop layers of the Earth's crust.
5. The dashed lines on your model represent a fault. Carefully cut along the dashedlines. You will end up with two pieces. You may wish to have your students tape or gluea piece of construction paper on the side of the two fault blocks along the fault face. Thiswill help with the demonstration.
II. Illustrate fault motion
This exercise has students develop a model of a normal fault. After you make thefault model from directions above, illustrate a “normal fault.”
1.Instructions to students: Locate points A and B on your model. Move point B so thatit is next to Point A. Observe your model from the side (its cross-section). You have justobserved a “normal fault.” Are there other ways faults can cause movement?
This fault model was develop by Tao Rho Alpha of the U.S. Geological Survey, MenloPark. More information on how to use the material can be found on the following website.
Objective: Students learn about the legendsand science begin earthquakes.
Teacher noteStories that are sometimes bizarre are created when information is lacking.
It was not until the last century that scientists started to understand the causes ofearthquakes. Students in this reader learn about early legends and also about whatgeologists understand about earthquakes.
You can extend these lessons easily by having students write their ownlegend of what they think an earthquake is about. Have them illustrate their legendand have students vote on which story is the most creative.
EARTH SCIENCES - EARTHQUAKES
Lesson 2 - EARTHQUAKE LEGENDS AND SCIENCE MATERIALS:
reader
Throughout the ages, the fear of earthquakes hasbeen justified. Words like “destructive” and“catastrophic” are always used to describe the energyreleased by an earthquake. However the Earth, with allits beautiful mountains and valleys, depends on theseprocesses to create the landforms that we see.
Earthquakes are a naturalway for the upper portion ofthe Earth to release energydue to stress caused bymovement internally andexternally.
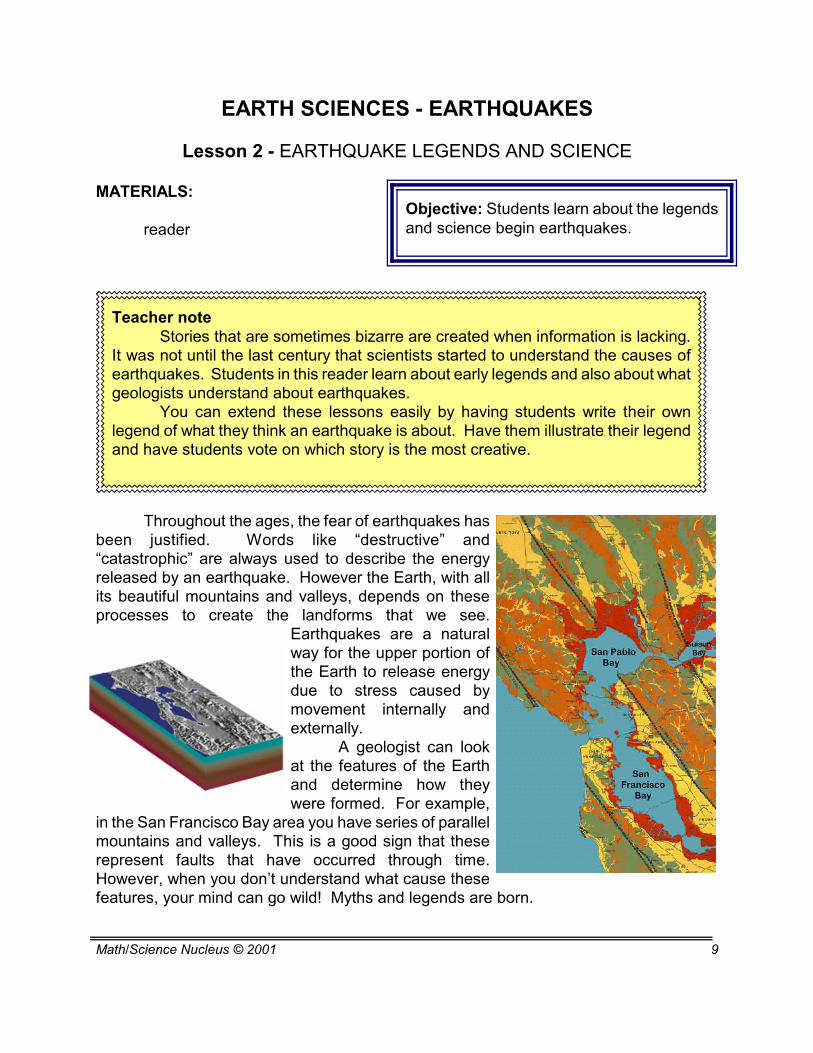
A geologist can lookat the features of the Earthand determine how theywere formed. For example,
in the San Francisco Bay area you have series of parallelmountains and valleys. This is a good sign that theserepresent faults that have occurred through time.However, when you don’t understand what cause thesefeatures, your mind can go wild! Myths and legends are born.
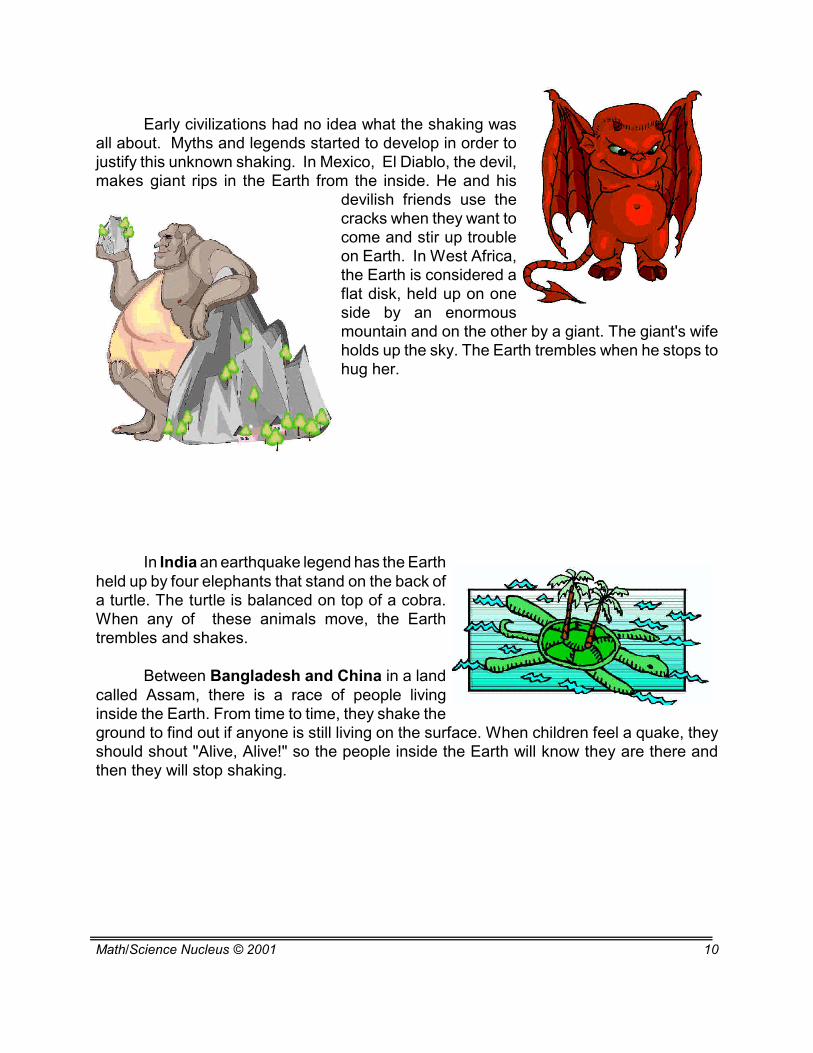
Early civilizations had no idea what the shaking wasall about. Myths and legends started to develop in order tojustify this unknown shaking. In Mexico, El Diablo, the devil,makes giant rips in the Earth from the inside. He and his
devilish friends use thecracks when they want tocome and stir up troubleon Earth. In West Africa,the Earth is considered aflat disk, held up on oneside by an enormousmountain and on the other by a giant. The giant's wifeholds up the sky. The Earth trembles when he stops tohug her.
In India an earthquake legend has the Earthheld up by four elephants that stand on the back ofa turtle. The turtle is balanced on top of a cobra.When any of these animals move, the Earthtrembles and shakes.
Between Bangladesh and China in a landcalled Assam, there is a race of people livinginside the Earth. From time to time, they shake theground to find out if anyone is still living on the surface. When children feel a quake, theyshould shout "Alive, Alive!" so the people inside the Earth will know they are there andthen they will stop shaking.
Early people from Mozambique claimed the Earth is a living creature. The Earthhas the same kinds of problems people have. Sometimes, it gets sick with fever and chillsand we can feel its shaking.
Once a Chickasaw chief (American Indian) was in love with a Choctaw princess.He was young and handsome, but he had a twisted foot, so his people called himReelfoot. When the princess' father refused to give Reelfoot his daughter's hand, the chief
and his friends kidnapped her andbegan to celebrate their marriage.The Great Spirit was angry andstomped his foot. The shockcaused the Mississippi River tooverflow its banks and drown theentire wedding party.
The god Loki fromScandinavia is being punished for
the murder of his brother, Baldur. He is tied to a rock in an underground cave. Above hisface is a serpent dripping poison, which Loki's sister catches in a bowl. From time to time,she has to go away to empty the bowl. Then the poison falls on Loki's face. He twists andwiggles to avoid it, and the ground shakes up above him.
Early people from New Zealand saw Mother Earth with a child in her womb, theyoung god Ru. When he stretches and kicks as babies do, he causes earthquakes.
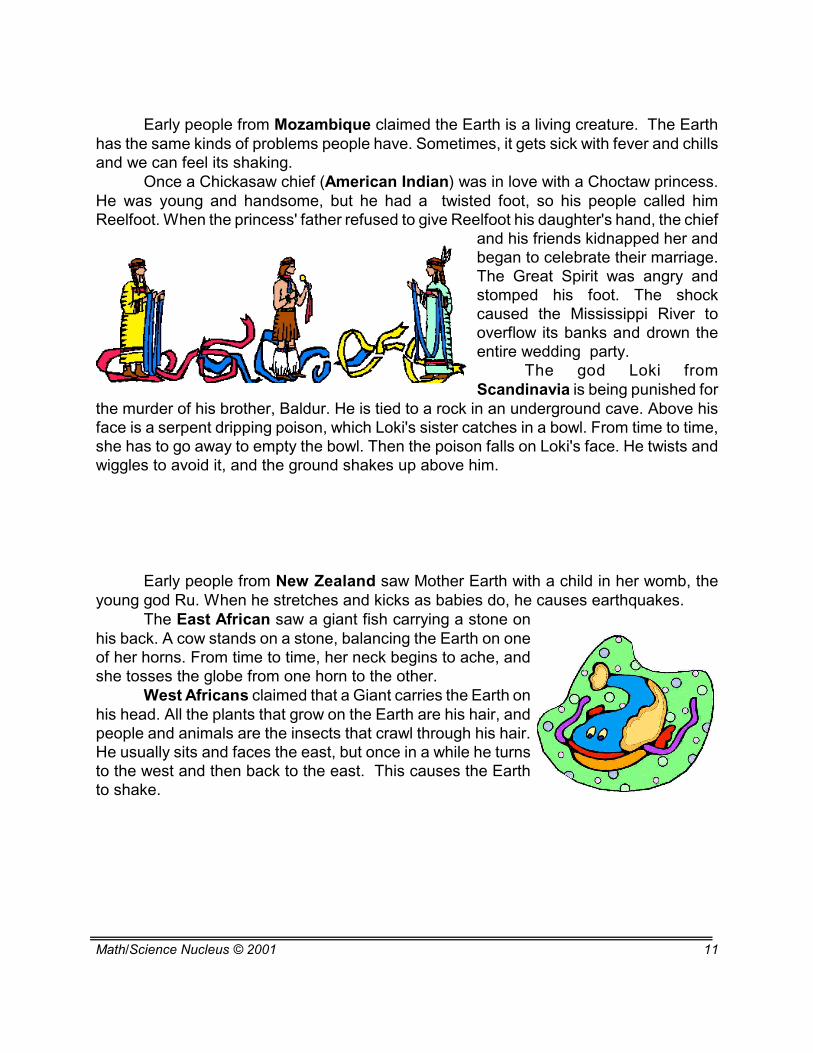
The East African saw a giant fish carrying a stone onhis back. A cow stands on a stone, balancing the Earth on oneof her horns. From time to time, her neck begins to ache, andshe tosses the globe from one horn to the other.
West Africans claimed that a Giant carries the Earth onhis head. All the plants that grow on the Earth are his hair, andpeople and animals are the insects that crawl through his hair.He usually sits and faces the east, but once in a while he turnsto the west and then back to the east. This causes the Earthto shake.
Talk to several adults who may not understand the science behind earthquakes. Recordtheir information. Try to weave a “myth” from their discussions. Remember a myth can bebased on some truth, but can also be entirely fictional. Draw a picture in the spaceprovided.
Objective: Students interpret earthquakemagnitude and intensity.
Teacher noteStudents learn the difference between intensity and magnitude of an
earthquake. The intensity is the severity of ground motion at a specific location.We use the modified Mercalli Scale to measure the intensity using Roman numeralsfrom I-XII. The magnitude of an earthquake is a mathematical measurement of theamount of energy released. A revised form of the Richter scale is used today anduses numbers from 1-10. An earthquake has many intensities depending on wherethe earthquake is located. However, an earthquake has only one magnitude.
The U.S. Geological Survey (USGS) provides scientific information onearthquakes to teachers, community, and students. The USGS is the agencyinvolved with understanding the science of earthquake (seismology) and collectsdata throughout the world. In the reader below students are asked to look at theUSGS website (http://earthquake.usgs.gov) to look for earthquakes that haveoccurred recently. You may want them to identify 5 to 10 different earthquakes andlist the magnitude found on the website. Make sure they record the date and place.
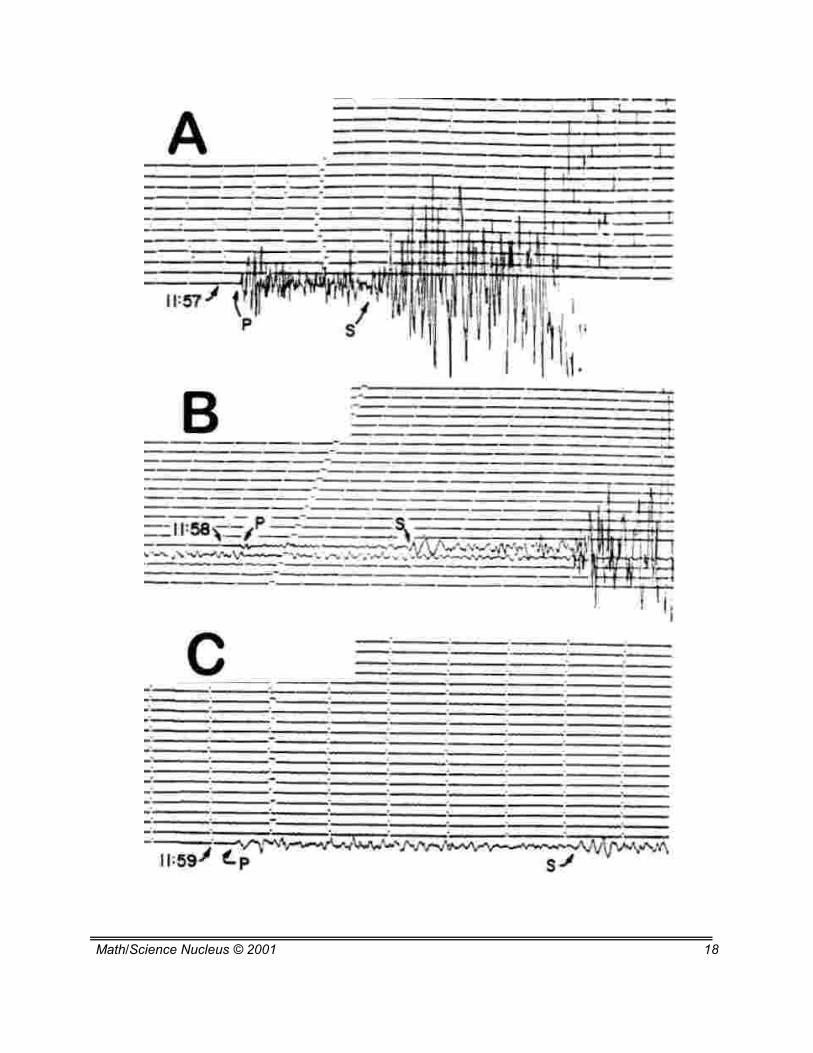
Also included is a classic worksheet on determining position of earthquakesby reading a seismogram. All seismograms are labeled in units that representGreenwich time. It avoids the confusion of local dates and times. Each dot and longdash represent one minute. This will be used to determine the arrival of P and Swaves. Provide students with a compass to help make it easy to measure the radiusto construct a circle from the given locations.
ANSWERS: Prince Rupert, British Columbia; C (A) time lab: 3 min, 50 sec;km: 230 sec x 8= 1840 km; New Orleans, Louisiana (B) time lab: 3 min 40 sec; km:300 sec x 8 km = 2400 km; Honolulu, Hawaii (C) time lab: 5 min, 40 sec; km 340 secx 8 km = 2720 km. The epicenter is somewhere in central California.
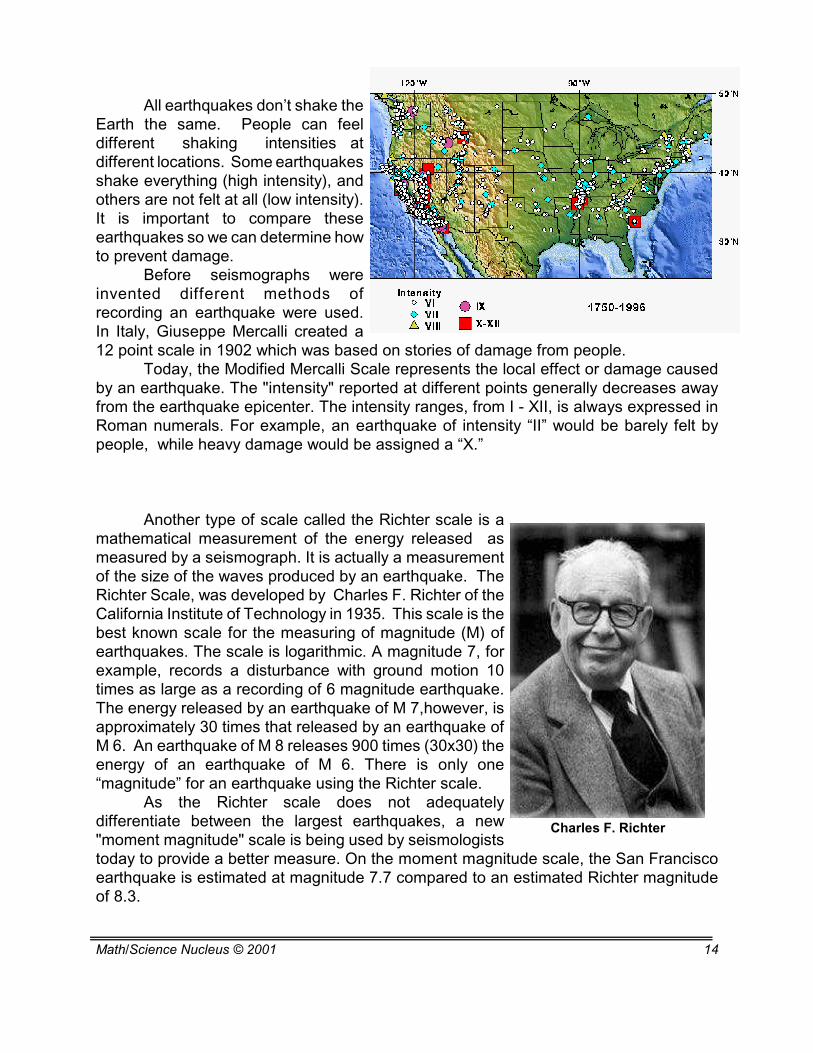
All earthquakes don’t shake theEarth the same. People can feeldifferent shaking intensities atdifferent locations. Some earthquakesshake everything (high intensity), andothers are not felt at all (low intensity).It is important to compare theseearthquakes so we can determine howto prevent damage.
Before seismographs wereinvented different methods ofrecording an earthquake were used.In Italy, Giuseppe Mercalli created a12 point scale in 1902 which was based on stories of damage from people.
Today, the Modified Mercalli Scale represents the local effect or damage causedby an earthquake. The "intensity" reported at different points generally decreases awayfrom the earthquake epicenter. The intensity ranges, from I - XII, is always expressed inRoman numerals. For example, an earthquake of intensity “II” would be barely felt bypeople, while heavy damage would be assigned a “X.”
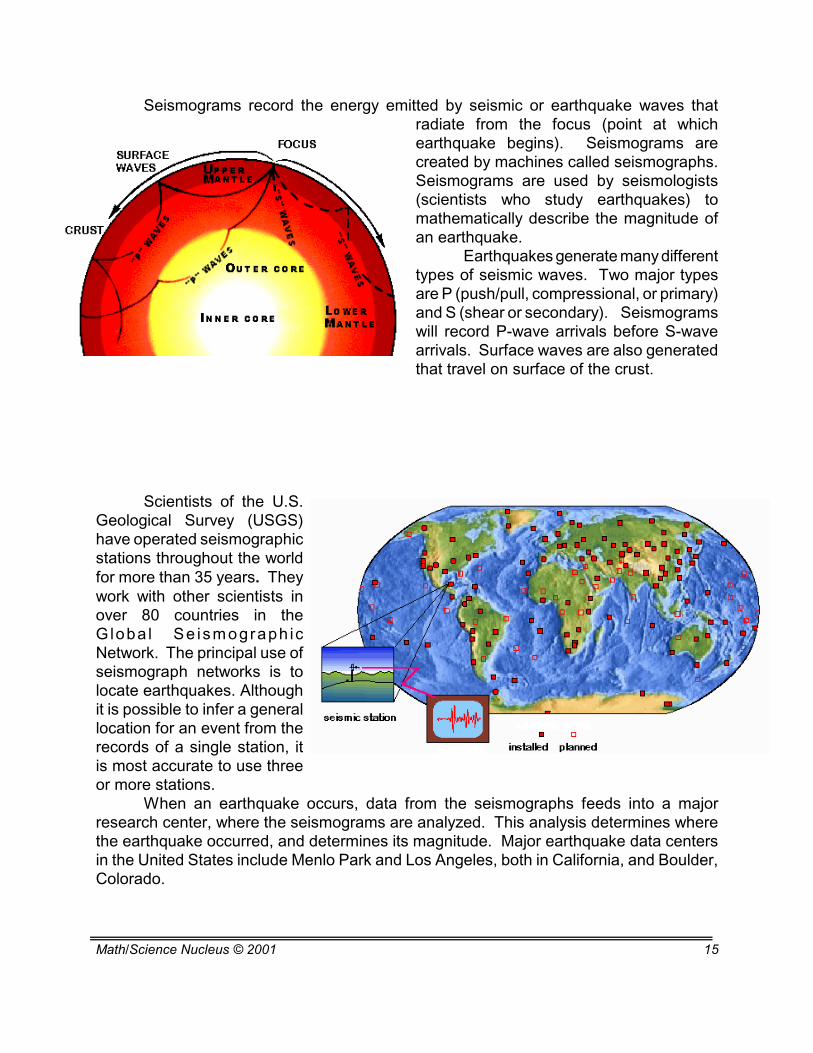
Another type of scale called the Richter scale is amathematical measurement of the energy released asmeasured by a seismograph. It is actually a measurementof the size of the waves produced by an earthquake. TheRichter Scale, was developed by Charles F. Richter of theCalifornia Institute of Technology in 1935. This scale is thebest known scale for the measuring of magnitude (M) ofearthquakes. The scale is logarithmic. A magnitude 7, forexample, records a disturbance with ground motion 10times as large as a recording of 6 magnitude earthquake.The energy released by an earthquake of M 7,however, isapproximately 30 times that released by an earthquake ofM 6. An earthquake of M 8 releases 900 times (30x30) theenergy of an earthquake of M 6. There is only one“magnitude” for an earthquake using the Richter scale.
As the Richter scale does not adequatelydifferentiate between the largest earthquakes, a new"moment magnitude" scale is being used by seismologiststoday to provide a better measure. On the moment magnitude scale, the San Franciscoearthquake is estimated at magnitude 7.7 compared to an estimated Richter magnitudeof 8.3.
Seismograms record the energy emitted by seismic or earthquake waves thatradiate from the focus (point at whichearthquake begins). Seismograms arecreated by machines called seismographs.Seismograms are used by seismologists(scientists who study earthquakes) tomathematically describe the magnitude ofan earthquake.
Earthquakes generate many differenttypes of seismic waves. Two major typesare P (push/pull, compressional, or primary)and S (shear or secondary). Seismogramswill record P-wave arrivals before S-wavearrivals. Surface waves are also generatedthat travel on surface of the crust.
Scientists of the U.S.Geological Survey (USGS)have operated seismographicstations throughout the worldfor more than 35 years. Theywork with other scientists inover 80 countries in theGloba l Se ismograph icNetwork. The principal use ofseismograph networks is tolocate earthquakes. Althoughit is possible to infer a generallocation for an event from therecords of a single station, itis most accurate to use threeor more stations.
When an earthquake occurs, data from the seismographs feeds into a majorresearch center, where the seismograms are analyzed. This analysis determines wherethe earthquake occurred, and determines its magnitude. Major earthquake data centersin the United States include Menlo Park and Los Angeles, both in California, and Boulder,Colorado.
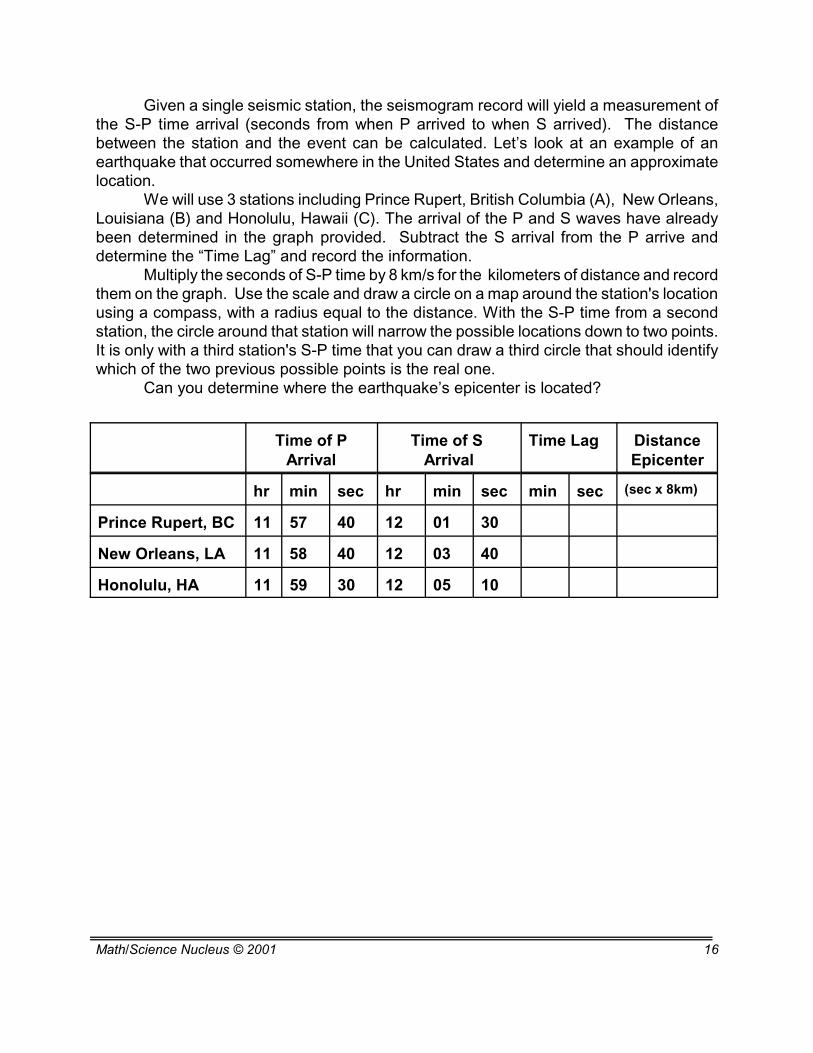
Given a single seismic station, the seismogram record will yield a measurement ofthe S-P time arrival (seconds from when P arrived to when S arrived). The distancebetween the station and the event can be calculated. Let’s look at an example of anearthquake that occurred somewhere in the United States and determine an approximatelocation.
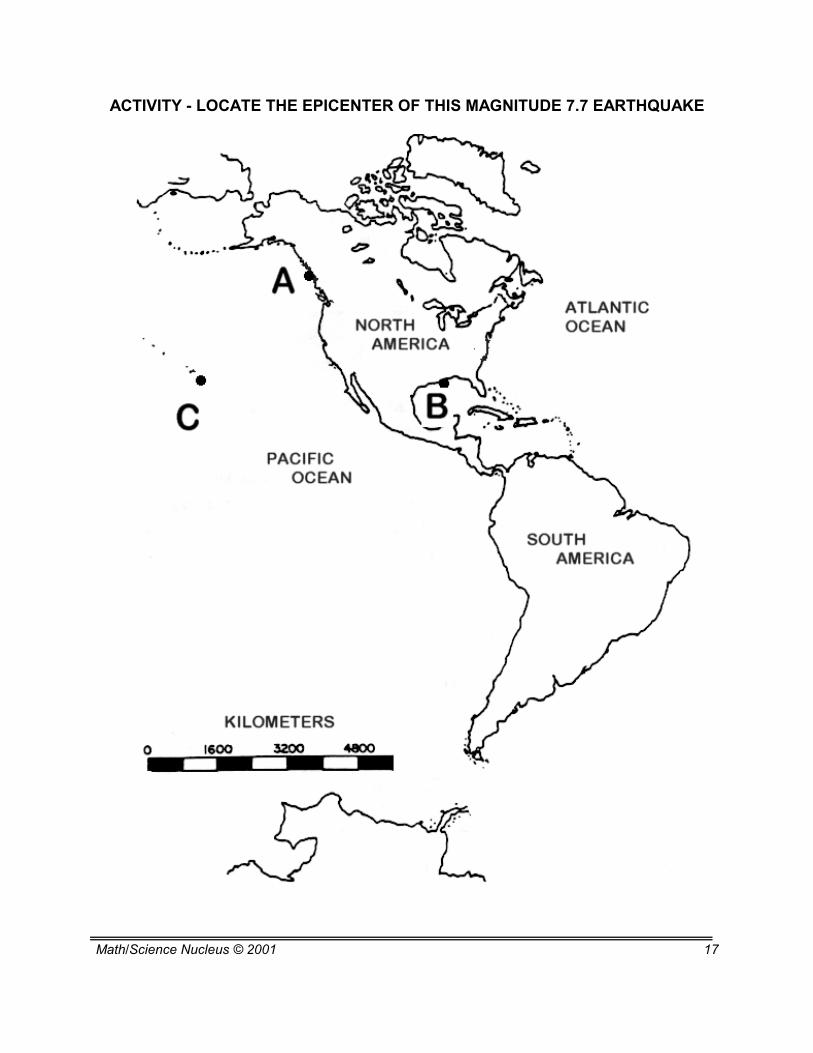
We will use 3 stations including Prince Rupert, British Columbia (A), New Orleans,Louisiana (B) and Honolulu, Hawaii (C). The arrival of the P and S waves have alreadybeen determined in the graph provided. Subtract the S arrival from the P arrive anddetermine the “Time Lag” and record the information.
Multiply the seconds of S-P time by 8 km/s for the kilometers of distance and recordthem on the graph. Use the scale and draw a circle on a map around the station's locationusing a compass, with a radius equal to the distance. With the S-P time from a secondstation, the circle around that station will narrow the possible locations down to two points.It is only with a third station's S-P time that you can draw a third circle that should identifywhich of the two previous possible points is the real one.
Can you determine where the earthquake’s epicenter is located?
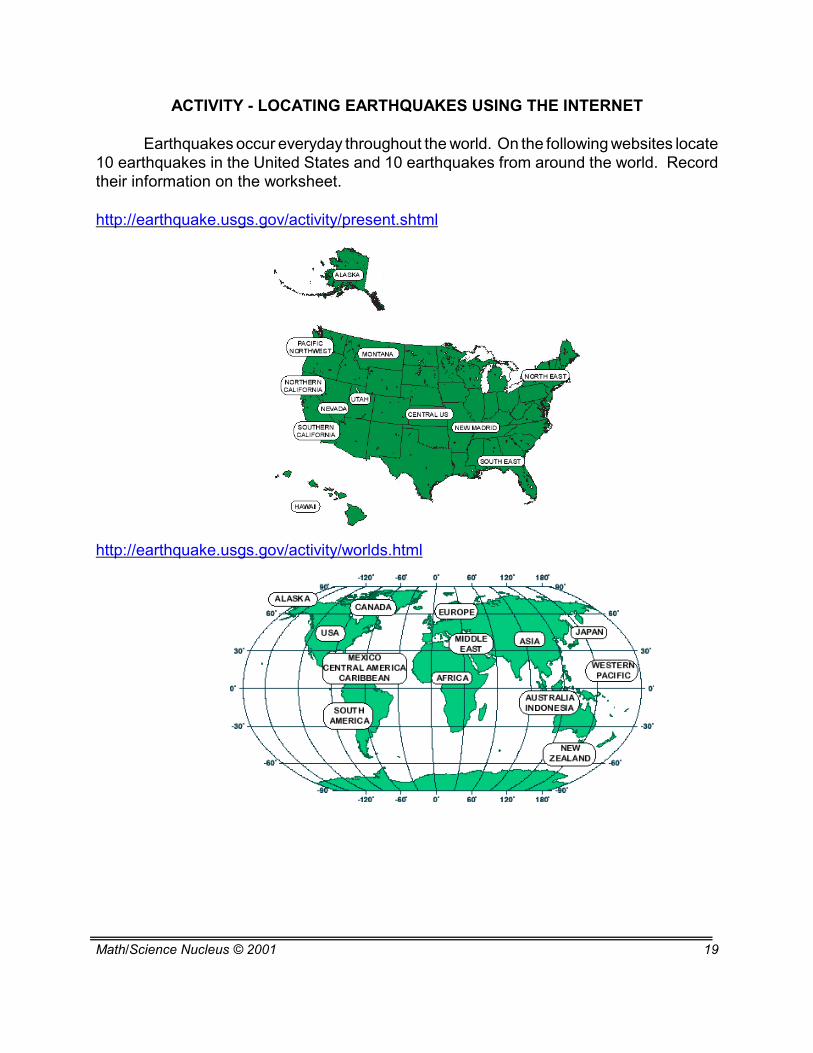
ACTIVITY - LOCATING EARTHQUAKES USING THE INTERNET
Earthquakes occur everyday throughout the world. On the following websites locate10 earthquakes in the United States and 10 earthquakes from around the world. Recordtheir information on the worksheet.
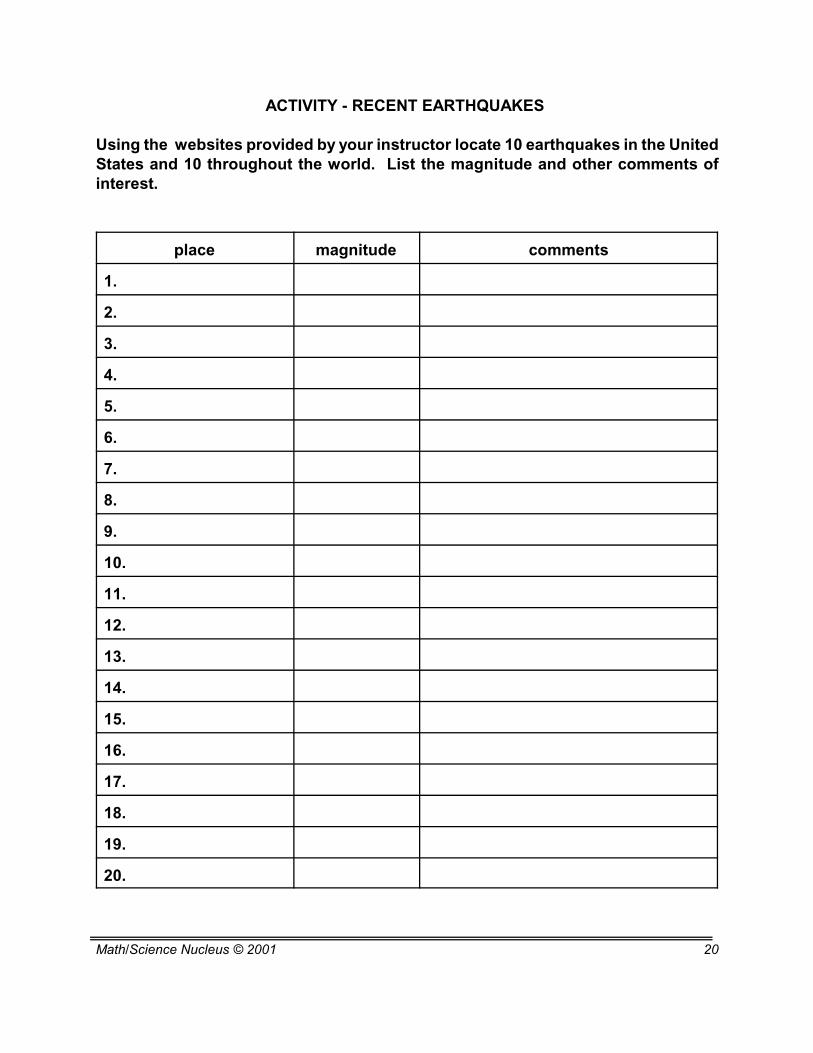
Using the websites provided by your instructor locate 10 earthquakes in the UnitedStates and 10 throughout the world. List the magnitude and other comments ofinterest.
Objective: Students explore anhistorical earthquake.
Teacher noteThe New Madrid Fault Zone is not considered to be in “earthquake country.”
However, the earthquakes of 1811-12 caused many geologists to think about thecauses of earthquake. This area in the midwestern part of the United States is noton a plate boundary nor near volcanic activity. It lies on a suture of an ancient plate.Ancient faults that have been buried through the ages are still zones of weaknessand are still capable of producing dangerous earthquakes.
Instruct students to read the information and then have a discussion aboutwhat it would be like to experience a shaking that you have no idea what caused it.Students should transport their “thoughts” to early pioneers living in the area.
For more information on the New Madrid Fault Zone we recommend thefollowing sites:
http://www.uky.edu/ArtsSciences/Geology/webdogs/virtky/index.html/ - an excellentdescription of the New Madrid Fault Zone -its history, current activity, and futurehazards.
http://hsv.com/genlintr/newmadrd/ - another good New Madrid Link
http://www.rootsweb.com/~armissi2/earthquk.htm - the full text of the letter writtenby Eliza Bryan.
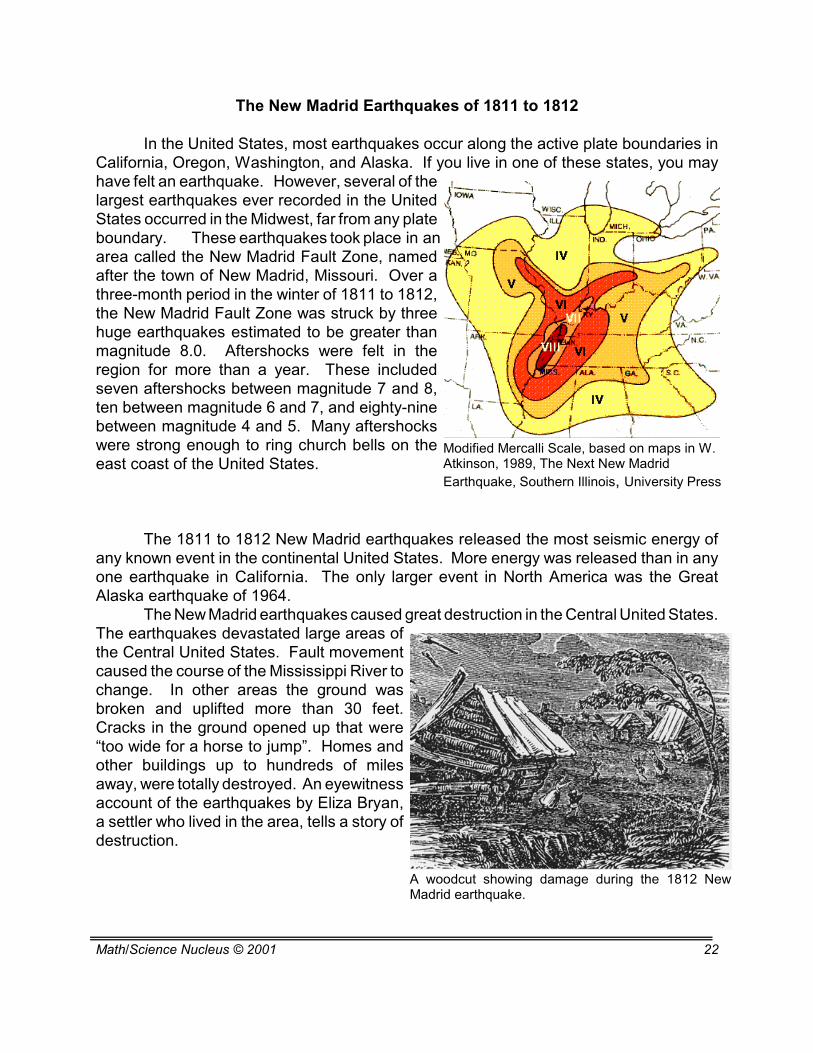
Modified Mercalli Scale, based on maps in W.Atkinson, 1989, The Next New MadridEarthquake, Southern Illinois, University Press
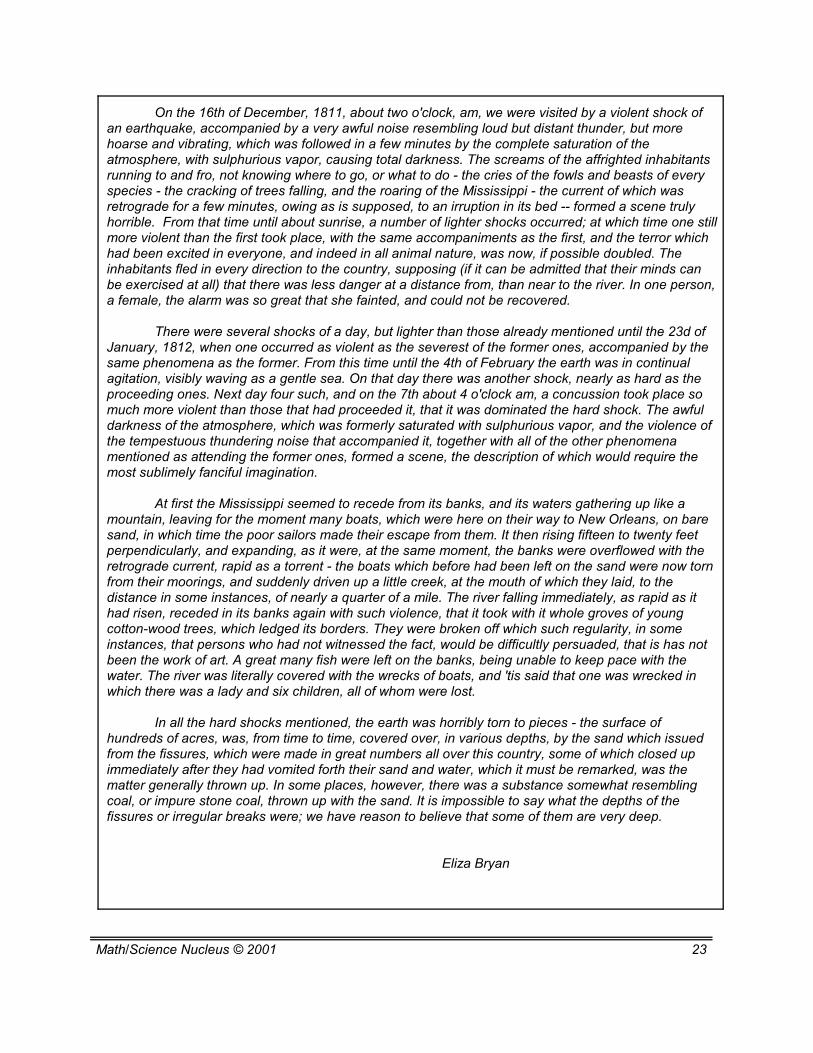
A woodcut showing damage during the 1812 NewMadrid earthquake.
The New Madrid Earthquakes of 1811 to 1812
In the United States, most earthquakes occur along the active plate boundaries inCalifornia, Oregon, Washington, and Alaska. If you live in one of these states, you mayhave felt an earthquake. However, several of thelargest earthquakes ever recorded in the UnitedStates occurred in the Midwest, far from any plateboundary. These earthquakes took place in anarea called the New Madrid Fault Zone, namedafter the town of New Madrid, Missouri. Over athree-month period in the winter of 1811 to 1812,the New Madrid Fault Zone was struck by threehuge earthquakes estimated to be greater thanmagnitude 8.0. Aftershocks were felt in theregion for more than a year. These includedseven aftershocks between magnitude 7 and 8,ten between magnitude 6 and 7, and eighty-ninebetween magnitude 4 and 5. Many aftershockswere strong enough to ring church bells on theeast coast of the United States.
The 1811 to 1812 New Madrid earthquakes released the most seismic energy ofany known event in the continental United States. More energy was released than in anyone earthquake in California. The only larger event in North America was the GreatAlaska earthquake of 1964.
The New Madrid earthquakes caused great destruction in the Central United States.The earthquakes devastated large areas ofthe Central United States. Fault movementcaused the course of the Mississippi River tochange. In other areas the ground wasbroken and uplifted more than 30 feet.Cracks in the ground opened up that were“too wide for a horse to jump”. Homes andother buildings up to hundreds of milesaway, were totally destroyed. An eyewitnessaccount of the earthquakes by Eliza Bryan,a settler who lived in the area, tells a story ofdestruction.
On the 16th of December, 1811, about two o'clock, am, we were visited by a violent shock ofan earthquake, accompanied by a very awful noise resembling loud but distant thunder, but morehoarse and vibrating, which was followed in a few minutes by the complete saturation of theatmosphere, with sulphurious vapor, causing total darkness. The screams of the affrighted inhabitantsrunning to and fro, not knowing where to go, or what to do - the cries of the fowls and beasts of everyspecies - the cracking of trees falling, and the roaring of the Mississippi - the current of which wasretrograde for a few minutes, owing as is supposed, to an irruption in its bed -- formed a scene trulyhorrible. From that time until about sunrise, a number of lighter shocks occurred; at which time one stillmore violent than the first took place, with the same accompaniments as the first, and the terror whichhad been excited in everyone, and indeed in all animal nature, was now, if possible doubled. Theinhabitants fled in every direction to the country, supposing (if it can be admitted that their minds canbe exercised at all) that there was less danger at a distance from, than near to the river. In one person,a female, the alarm was so great that she fainted, and could not be recovered.
There were several shocks of a day, but lighter than those already mentioned until the 23d ofJanuary, 1812, when one occurred as violent as the severest of the former ones, accompanied by thesame phenomena as the former. From this time until the 4th of February the earth was in continualagitation, visibly waving as a gentle sea. On that day there was another shock, nearly as hard as theproceeding ones. Next day four such, and on the 7th about 4 o'clock am, a concussion took place somuch more violent than those that had proceeded it, that it was dominated the hard shock. The awfuldarkness of the atmosphere, which was formerly saturated with sulphurious vapor, and the violence ofthe tempestuous thundering noise that accompanied it, together with all of the other phenomenamentioned as attending the former ones, formed a scene, the description of which would require themost sublimely fanciful imagination.
At first the Mississippi seemed to recede from its banks, and its waters gathering up like amountain, leaving for the moment many boats, which were here on their way to New Orleans, on baresand, in which time the poor sailors made their escape from them. It then rising fifteen to twenty feetperpendicularly, and expanding, as it were, at the same moment, the banks were overflowed with theretrograde current, rapid as a torrent - the boats which before had been left on the sand were now tornfrom their moorings, and suddenly driven up a little creek, at the mouth of which they laid, to thedistance in some instances, of nearly a quarter of a mile. The river falling immediately, as rapid as ithad risen, receded in its banks again with such violence, that it took with it whole groves of youngcotton-wood trees, which ledged its borders. They were broken off which such regularity, in someinstances, that persons who had not witnessed the fact, would be difficultly persuaded, that is has notbeen the work of art. A great many fish were left on the banks, being unable to keep pace with thewater. The river was literally covered with the wrecks of boats, and 'tis said that one was wrecked inwhich there was a lady and six children, all of whom were lost.
In all the hard shocks mentioned, the earth was horribly torn to pieces - the surface ofhundreds of acres, was, from time to time, covered over, in various depths, by the sand which issuedfrom the fissures, which were made in great numbers all over this country, some of which closed upimmediately after they had vomited forth their sand and water, which it must be remarked, was thematter generally thrown up. In some places, however, there was a substance somewhat resemblingcoal, or impure stone coal, thrown up with the sand. It is impossible to say what the depths of thefissures or irregular breaks were; we have reason to believe that some of them are very deep.
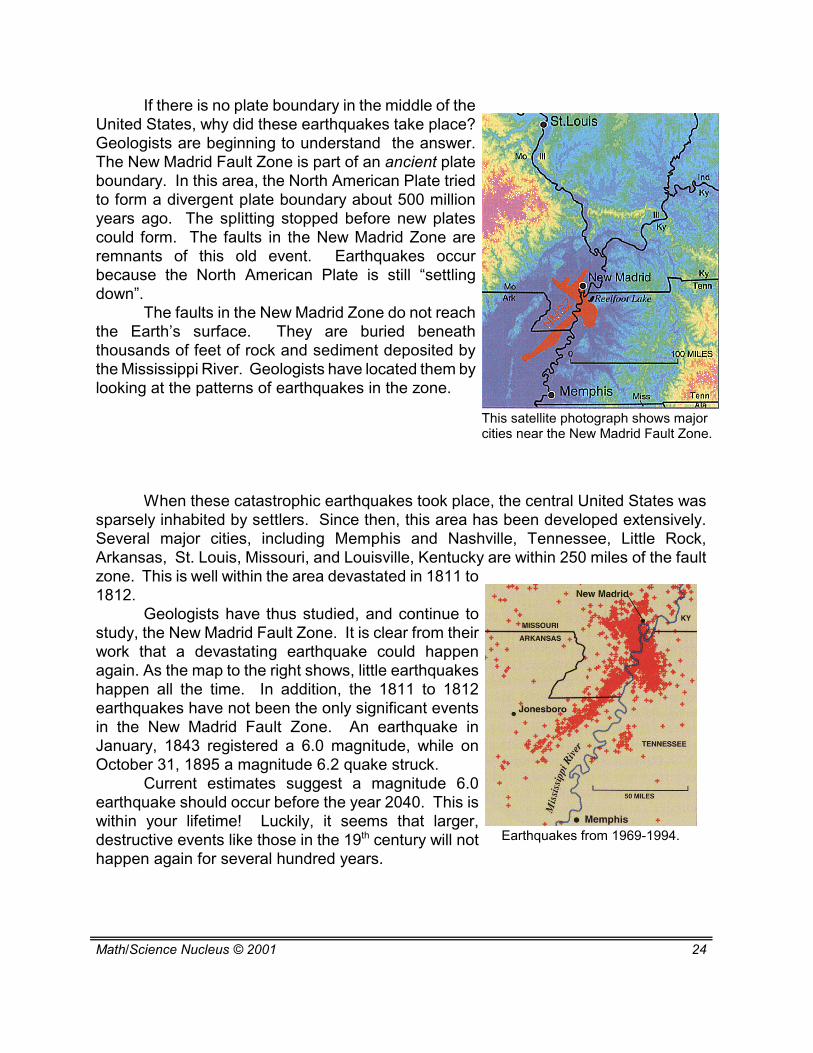
This satellite photograph shows majorcities near the New Madrid Fault Zone.
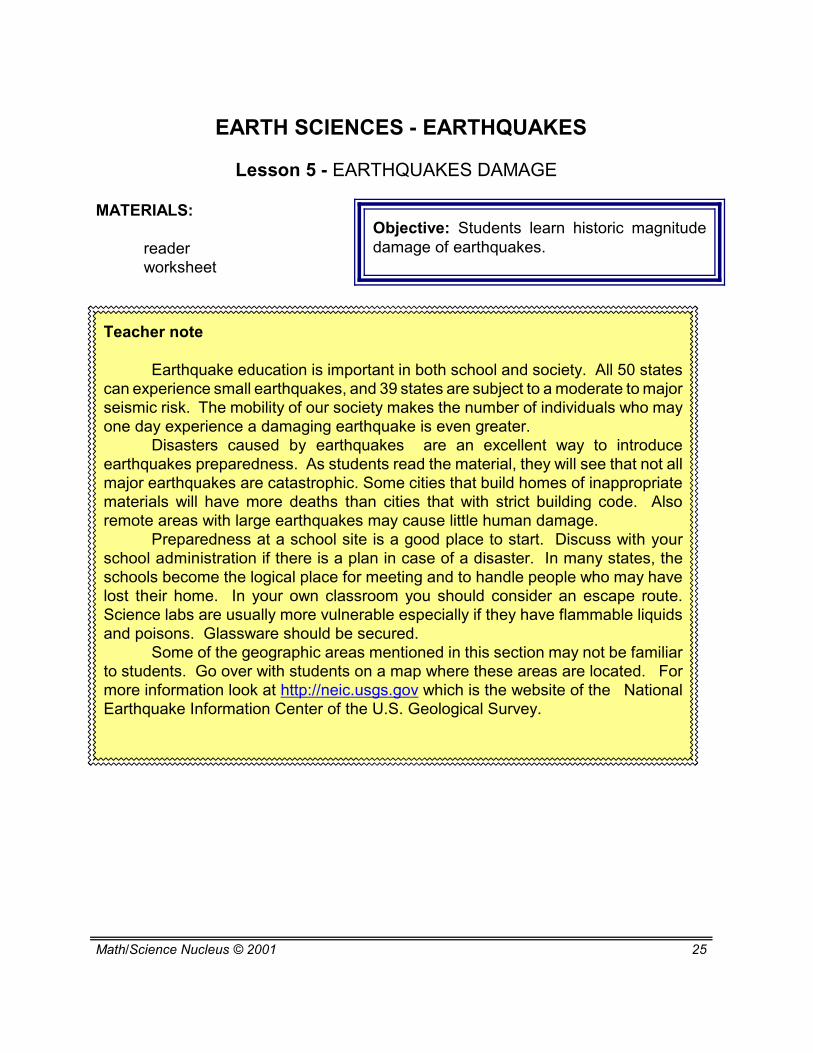
Earthquakes from 1969-1994.
If there is no plate boundary in the middle of theUnited States, why did these earthquakes take place?Geologists are beginning to understand the answer.The New Madrid Fault Zone is part of an ancient plateboundary. In this area, the North American Plate triedto form a divergent plate boundary about 500 millionyears ago. The splitting stopped before new platescould form. The faults in the New Madrid Zone areremnants of this old event. Earthquakes occurbecause the North American Plate is still “settlingdown”.
The faults in the New Madrid Zone do not reachthe Earth’s surface. They are buried beneaththousands of feet of rock and sediment deposited bythe Mississippi River. Geologists have located them bylooking at the patterns of earthquakes in the zone.
When these catastrophic earthquakes took place, the central United States wassparsely inhabited by settlers. Since then, this area has been developed extensively.Several major cities, including Memphis and Nashville, Tennessee, Little Rock,Arkansas, St. Louis, Missouri, and Louisville, Kentucky are within 250 miles of the faultzone. This is well within the area devastated in 1811 to1812.
Geologists have thus studied, and continue tostudy, the New Madrid Fault Zone. It is clear from theirwork that a devastating earthquake could happenagain. As the map to the right shows, little earthquakeshappen all the time. In addition, the 1811 to 1812earthquakes have not been the only significant eventsin the New Madrid Fault Zone. An earthquake inJanuary, 1843 registered a 6.0 magnitude, while onOctober 31, 1895 a magnitude 6.2 quake struck.
Current estimates suggest a magnitude 6.0earthquake should occur before the year 2040. This iswithin your lifetime! Luckily, it seems that larger,destructive events like those in the 19th century will nothappen again for several hundred years.
Objective: Students learn historic magnitudedamage of earthquakes.
Teacher note
Earthquake education is important in both school and society. All 50 statescan experience small earthquakes, and 39 states are subject to a moderate to majorseismic risk. The mobility of our society makes the number of individuals who mayone day experience a damaging earthquake is even greater.
Disasters caused by earthquakes are an excellent way to introduceearthquakes preparedness. As students read the material, they will see that not allmajor earthquakes are catastrophic. Some cities that build homes of inappropriatematerials will have more deaths than cities that with strict building code. Alsoremote areas with large earthquakes may cause little human damage.
Preparedness at a school site is a good place to start. Discuss with yourschool administration if there is a plan in case of a disaster. In many states, theschools become the logical place for meeting and to handle people who may havelost their home. In your own classroom you should consider an escape route.Science labs are usually more vulnerable especially if they have flammable liquidsand poisons. Glassware should be secured.
Some of the geographic areas mentioned in this section may not be familiarto students. Go over with students on a map where these areas are located. Formore information look at http://neic.usgs.gov which is the website of the NationalEarthquake Information Center of the U.S. Geological Survey.
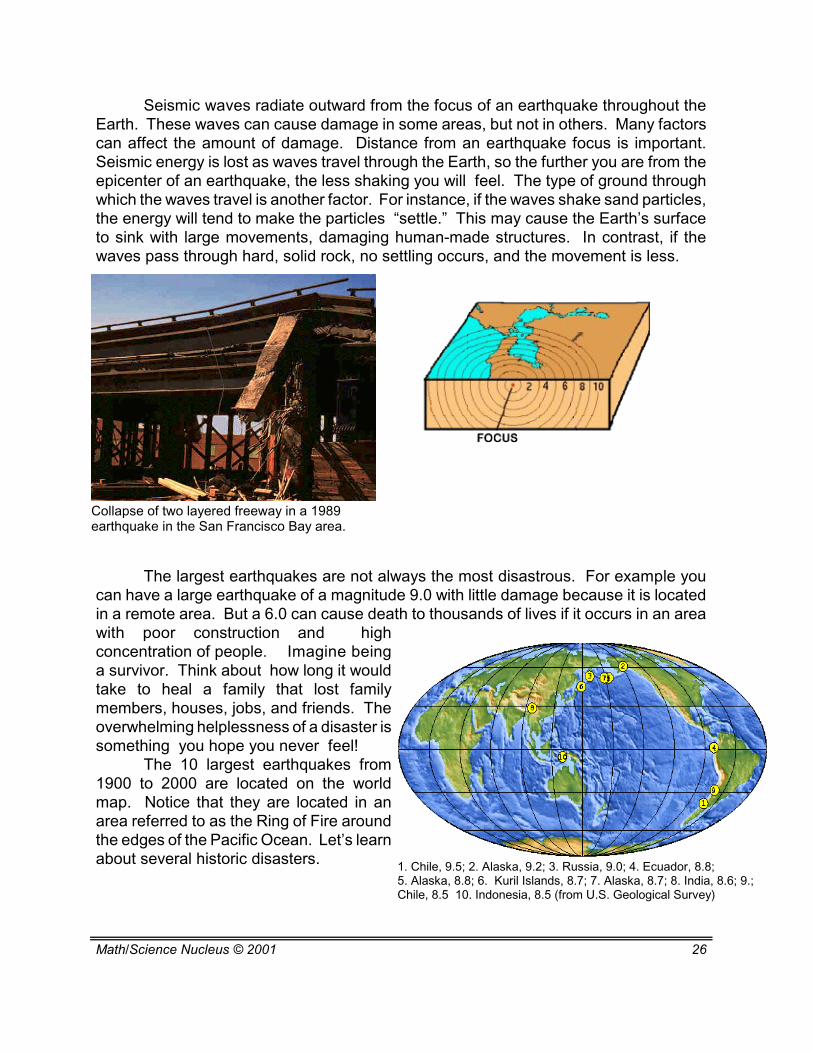
Seismic waves radiate outward from the focus of an earthquake throughout theEarth. These waves can cause damage in some areas, but not in others. Many factorscan affect the amount of damage. Distance from an earthquake focus is important.Seismic energy is lost as waves travel through the Earth, so the further you are from theepicenter of an earthquake, the less shaking you will feel. The type of ground throughwhich the waves travel is another factor. For instance, if the waves shake sand particles,the energy will tend to make the particles “settle.” This may cause the Earth’s surfaceto sink with large movements, damaging human-made structures. In contrast, if thewaves pass through hard, solid rock, no settling occurs, and the movement is less.
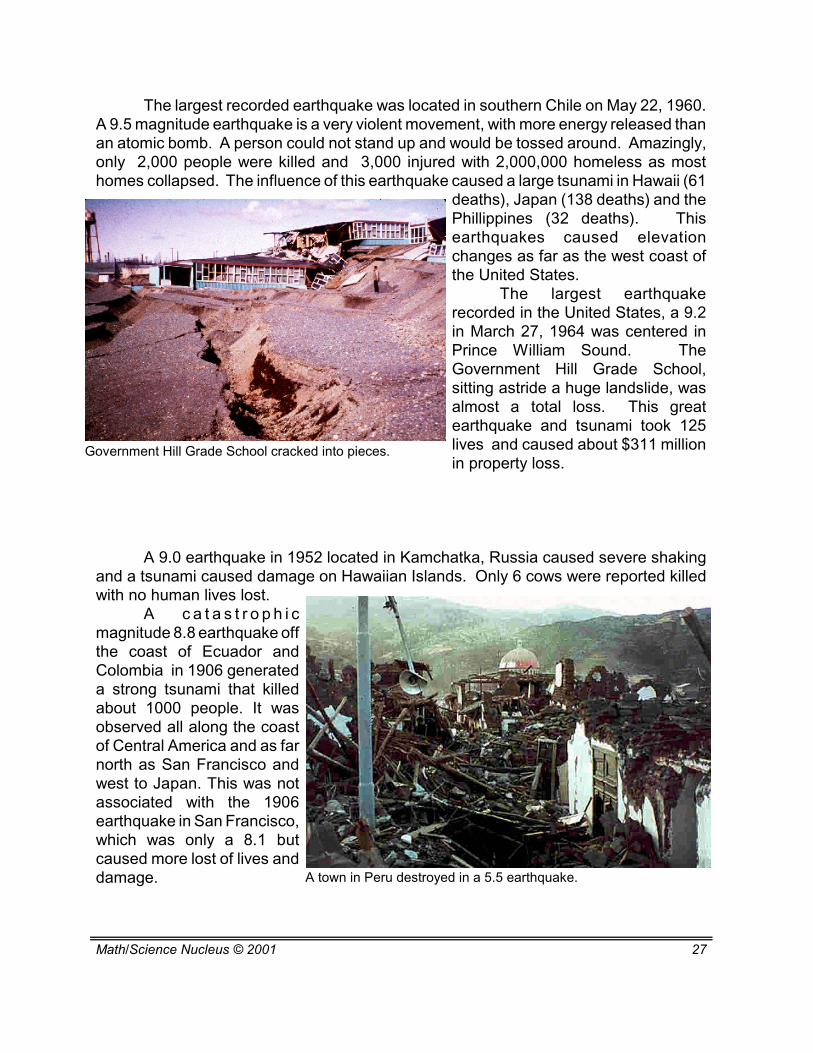
The largest earthquakes are not always the most disastrous. For example youcan have a large earthquake of a magnitude 9.0 with little damage because it is locatedin a remote area. But a 6.0 can cause death to thousands of lives if it occurs in an areawith poor construction and highconcentration of people. Imagine beinga survivor. Think about how long it wouldtake to heal a family that lost familymembers, houses, jobs, and friends. Theoverwhelming helplessness of a disaster issomething you hope you never feel!
The 10 largest earthquakes from1900 to 2000 are located on the worldmap. Notice that they are located in anarea referred to as the Ring of Fire aroundthe edges of the Pacific Ocean. Let’s learnabout several historic disasters.
The largest recorded earthquake was located in southern Chile on May 22, 1960.A 9.5 magnitude earthquake is a very violent movement, with more energy released thanan atomic bomb. A person could not stand up and would be tossed around. Amazingly,only 2,000 people were killed and 3,000 injured with 2,000,000 homeless as mosthomes collapsed. The influence of this earthquake caused a large tsunami in Hawaii (61
deaths), Japan (138 deaths) and thePhillippines (32 deaths). Thisearthquakes caused elevationchanges as far as the west coast ofthe United States.
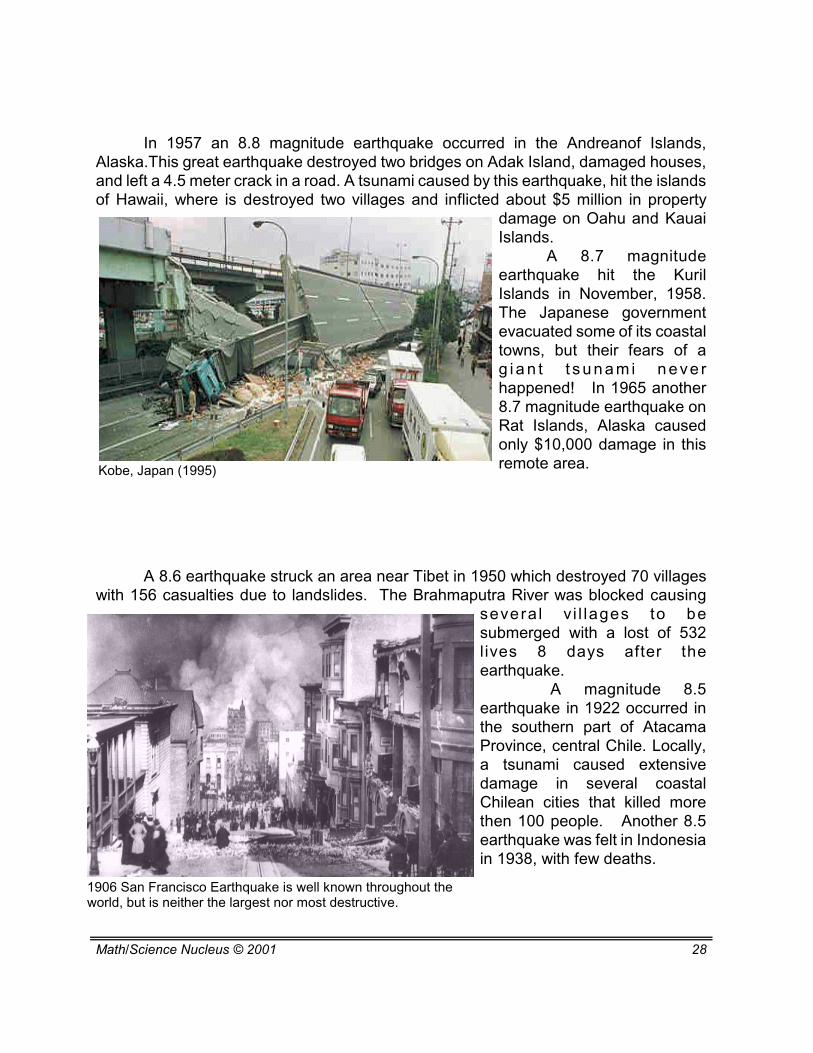
The largest earthquakerecorded in the United States, a 9.2in March 27, 1964 was centered inPrince William Sound. TheGovernment Hill Grade School,sitting astride a huge landslide, wasalmost a total loss. This greatearthquake and tsunami took 125lives and caused about $311 millionin property loss.
A 9.0 earthquake in 1952 located in Kamchatka, Russia caused severe shakingand a tsunami caused damage on Hawaiian Islands. Only 6 cows were reported killedwith no human lives lost.
A c a t a s t r o p h i cmagnitude 8.8 earthquake offthe coast of Ecuador andColombia in 1906 generateda strong tsunami that killedabout 1000 people. It wasobserved all along the coastof Central America and as farnorth as San Francisco andwest to Japan. This was notassociated with the 1906earthquake in San Francisco,which was only a 8.1 butcaused more lost of lives anddamage.
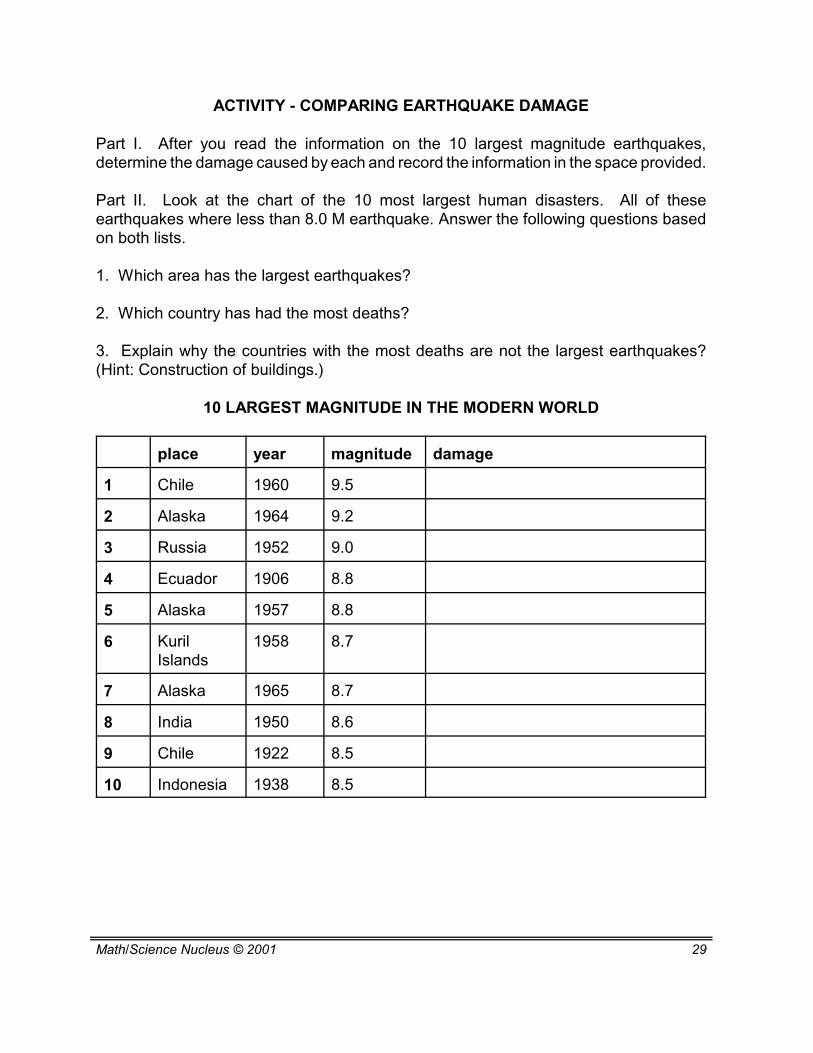
1906 San Francisco Earthquake is well known throughout theworld, but is neither the largest nor most destructive.
In 1957 an 8.8 magnitude earthquake occurred in the Andreanof Islands,Alaska.This great earthquake destroyed two bridges on Adak Island, damaged houses,and left a 4.5 meter crack in a road. A tsunami caused by this earthquake, hit the islandsof Hawaii, where is destroyed two villages and inflicted about $5 million in property
damage on Oahu and KauaiIslands.
A 8.7 magnitudeearthquake hit the KurilIslands in November, 1958.The Japanese governmentevacuated some of its coastaltowns, but their fears of ag i a n t t s u n a m i n e ve rhappened! In 1965 another8.7 magnitude earthquake onRat Islands, Alaska causedonly $10,000 damage in thisremote area.
A 8.6 earthquake struck an area near Tibet in 1950 which destroyed 70 villageswith 156 casualties due to landslides. The Brahmaputra River was blocked causing
severa l v i l lages to besubmerged with a lost of 532lives 8 days after theearthquake.
A magnitude 8.5earthquake in 1922 occurred inthe southern part of AtacamaProvince, central Chile. Locally,a tsunami caused extensivedamage in several coastalChilean cities that killed morethen 100 people. Another 8.5earthquake was felt in Indonesiain 1938, with few deaths.
Part I. After you read the information on the 10 largest magnitude earthquakes,determine the damage caused by each and record the information in the space provided.
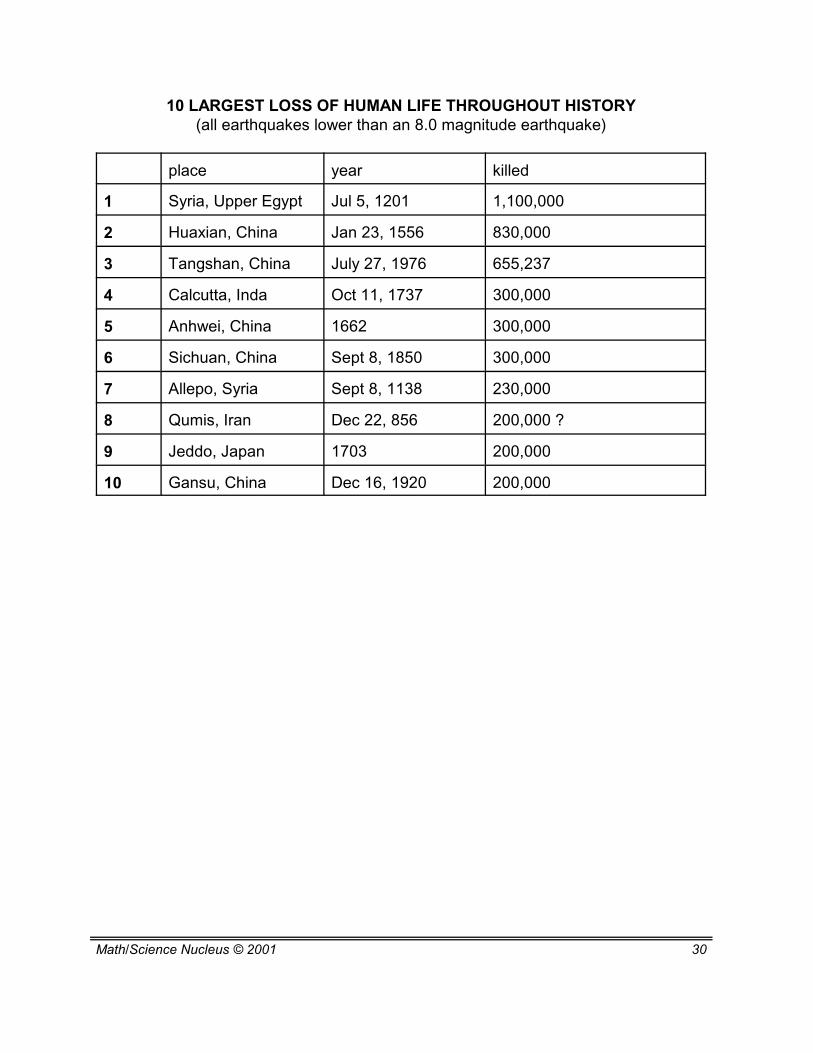
Part II. Look at the chart of the 10 most largest human disasters. All of theseearthquakes where less than 8.0 M earthquake. Answer the following questions basedon both lists.
1. Which area has the largest earthquakes?
2. Which country has had the most deaths?
3. Explain why the countries with the most deaths are not the largest earthquakes?(Hint: Construction of buildings.)