19
Teacher: Jeff Stellitano Intended Audience: Conceptual Chemistry (Sophomores) Timeline: One Double Lab Period
| Date post: | 28-Jul-2018 |
| Category: |
Documents |
| Upload: | truongkhanh |
| View: | 217 times |
| Download: | 0 times |

Teacher: Jeff StellitanoIntended Audience: Conceptual Chemistry (Sophomores)
Timeline: One Double Lab Period
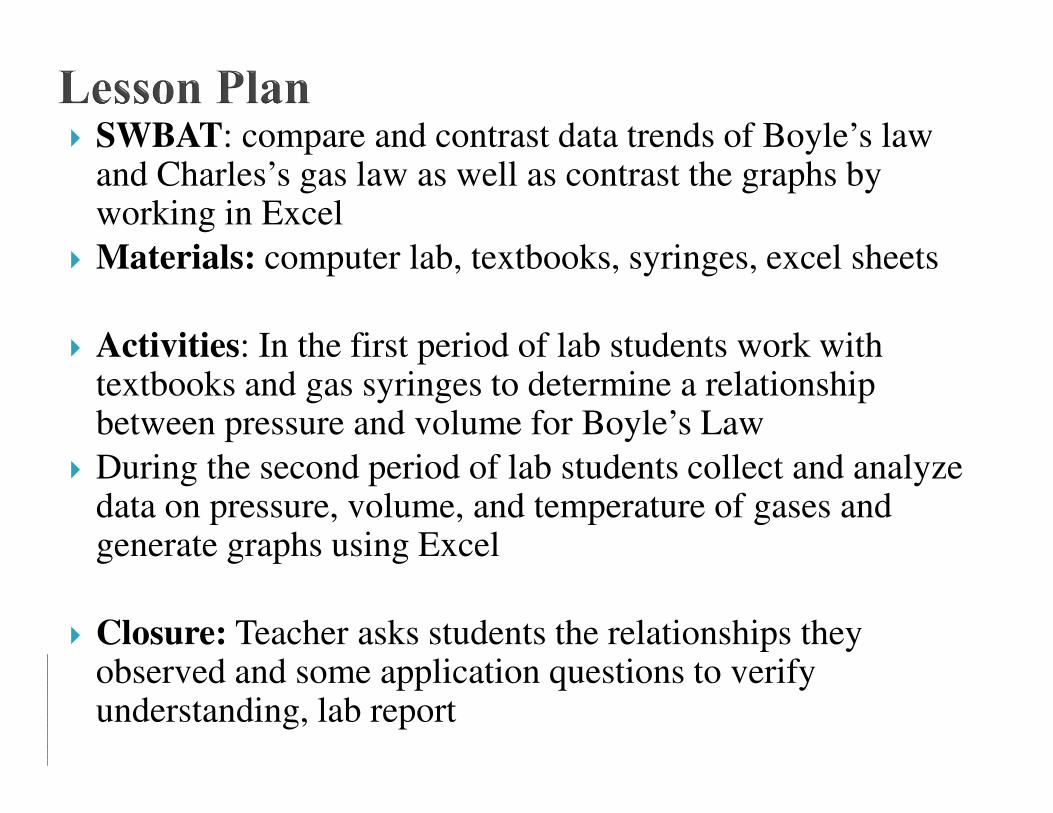
� SWBAT: compare and contrast data trends of Boyle’s law and Charles’s gas law as well as contrast the graphs by working in Excel
� Materials: computer lab, textbooks, syringes, excel sheets
� Activities: In the first period of lab students work with textbooks and gas syringes to determine a relationship between pressure and volume for Boyle’s Law
� During the second period of lab students collect and analyze data on pressure, volume, and temperature of gases and generate graphs using Excel
� Closure: Teacher asks students the relationships they observed and some application questions to verify understanding, lab report
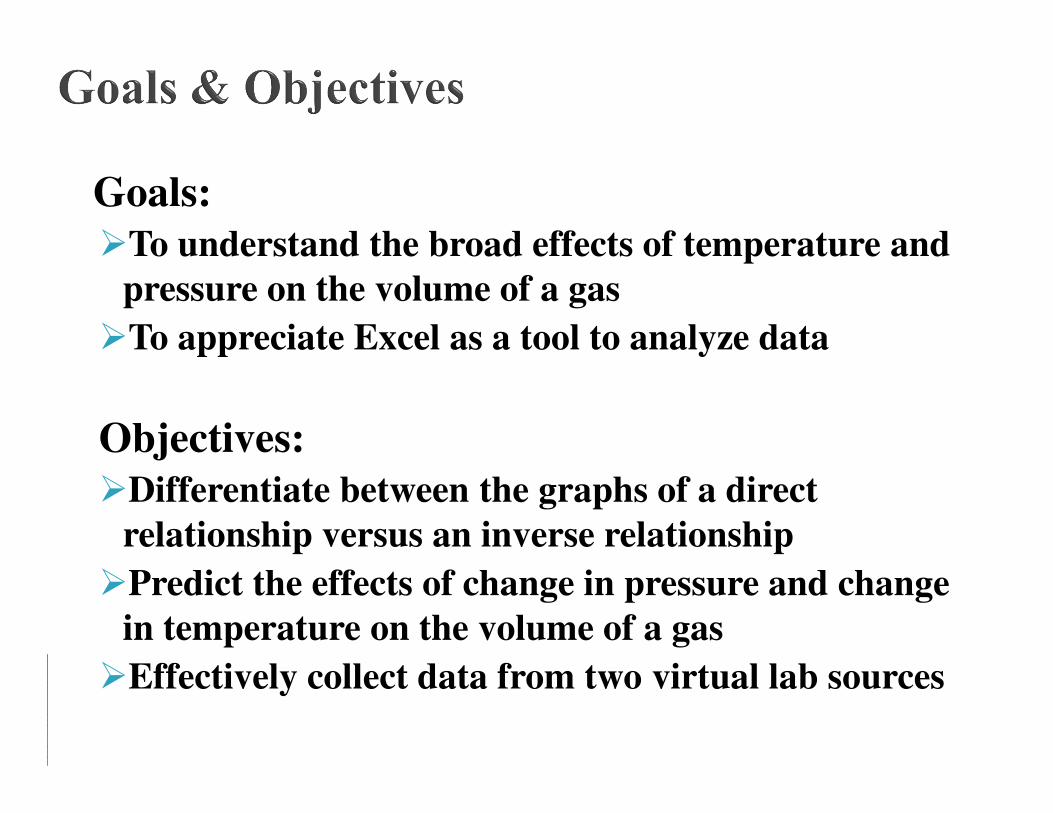
Goals:
�To understand the broad effects of temperature and
pressure on the volume of a gas
�To appreciate Excel as a tool to analyze data
Objectives:
�Differentiate between the graphs of a direct
relationship versus an inverse relationship
�Predict the effects of change in pressure and change
in temperature on the volume of a gas
�Effectively collect data from two virtual lab sources
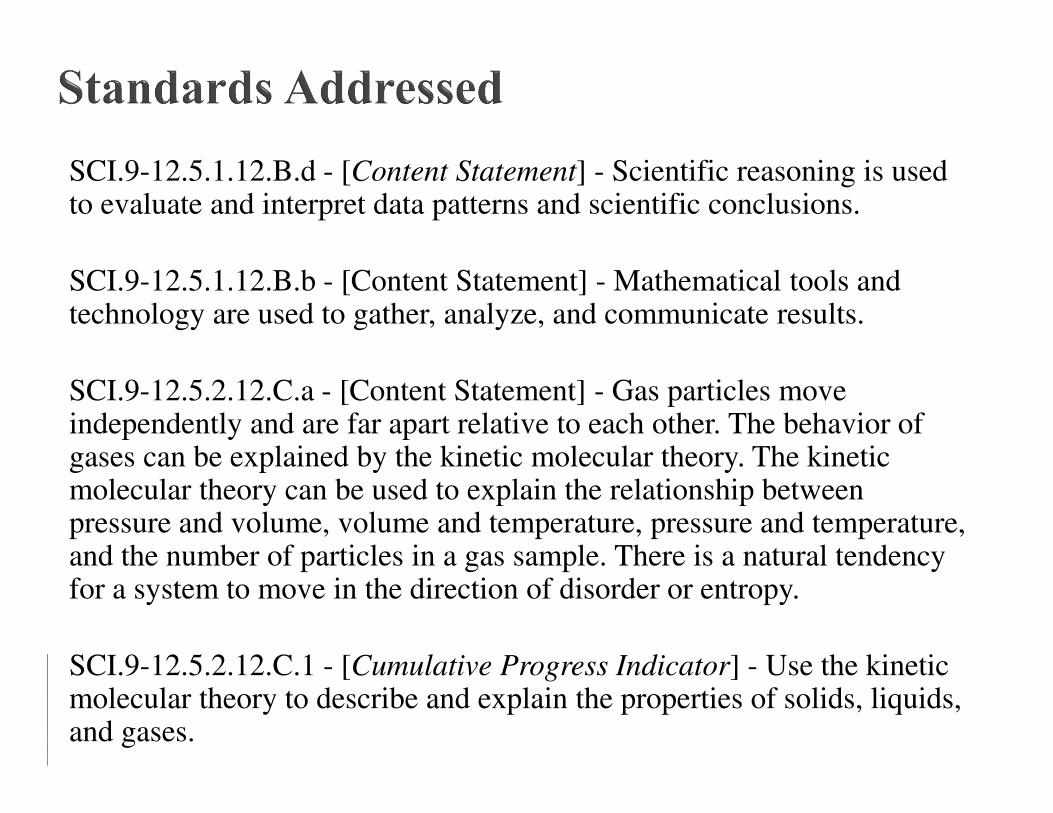
SCI.9-12.5.1.12.B.d - [Content Statement] - Scientific reasoning is used to evaluate and interpret data patterns and scientific conclusions.
SCI.9-12.5.1.12.B.b - [Content Statement] - Mathematical tools and technology are used to gather, analyze, and communicate results.
SCI.9-12.5.2.12.C.a - [Content Statement] - Gas particles move independently and are far apart relative to each other. The behavior of gases can be explained by the kinetic molecular theory. The kinetic molecular theory can be used to explain the relationship between pressure and volume, volume and temperature, pressure and temperature, and the number of particles in a gas sample. There is a natural tendency for a system to move in the direction of disorder or entropy.
SCI.9-12.5.2.12.C.1 - [Cumulative Progress Indicator] - Use the kinetic molecular theory to describe and explain the properties of solids, liquids, and gases.
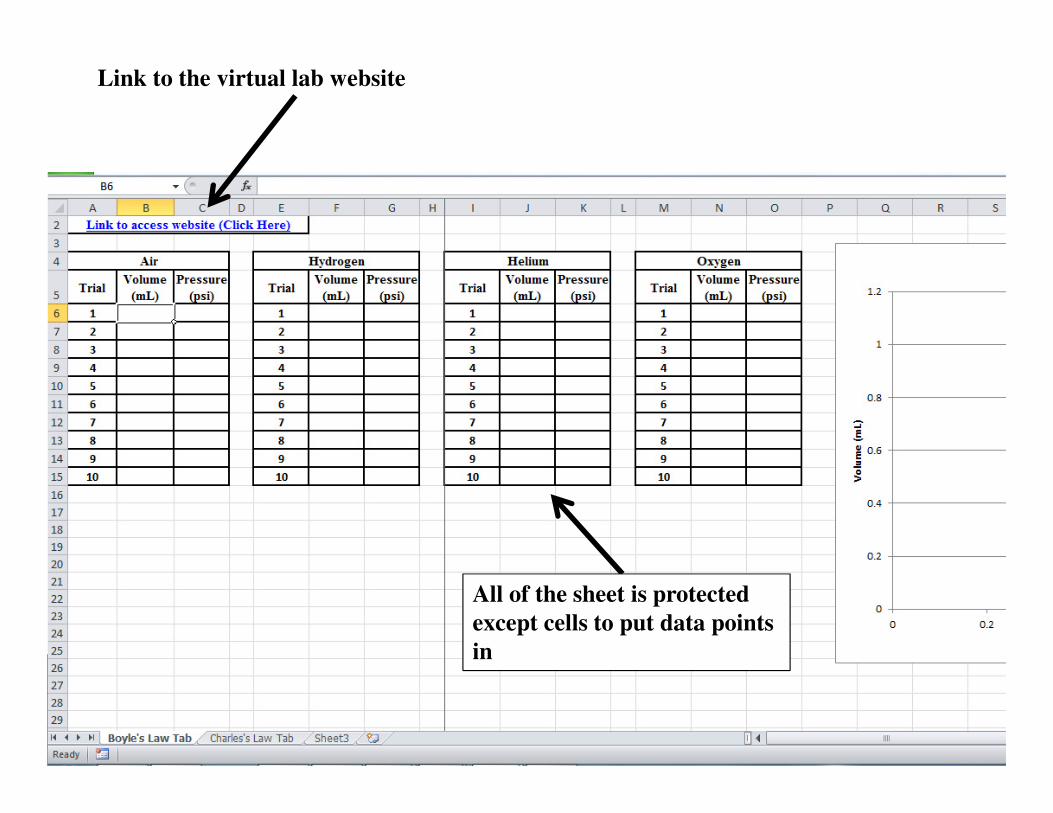
Link to the virtual lab website
All of the sheet is protected
except cells to put data points
in

Data to be placed in
Excel Doc
Syringe for students to
apply pressure
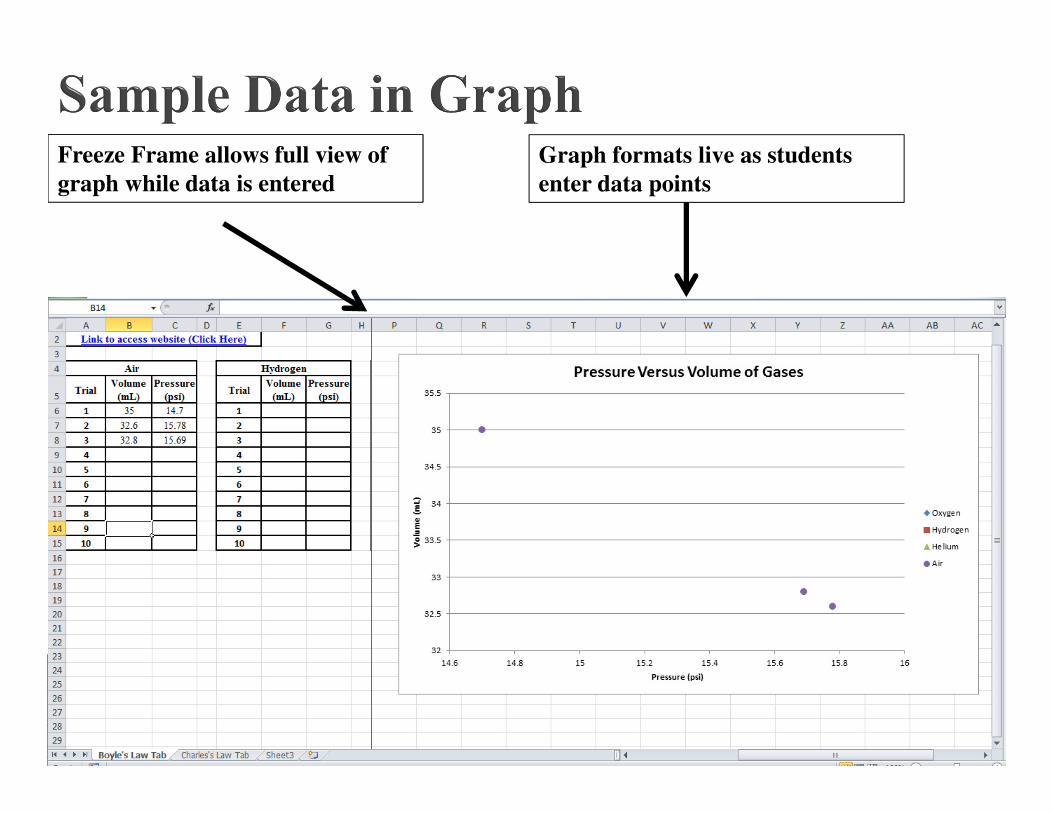
Freeze Frame allows full view of
graph while data is entered
Graph formats live as students
enter data points
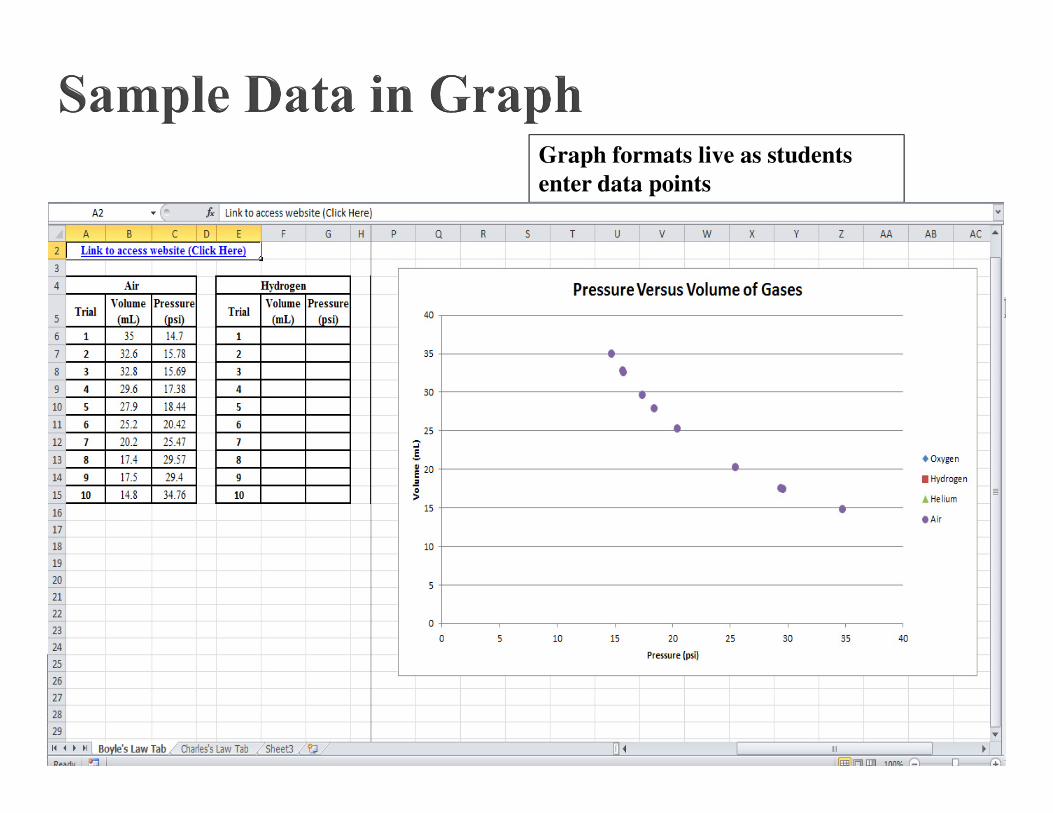
Graph formats live as students
enter data points

Different color points indicate different
gases. Better view of trend
Frame has been unfrozen to observe
graph with other data tables
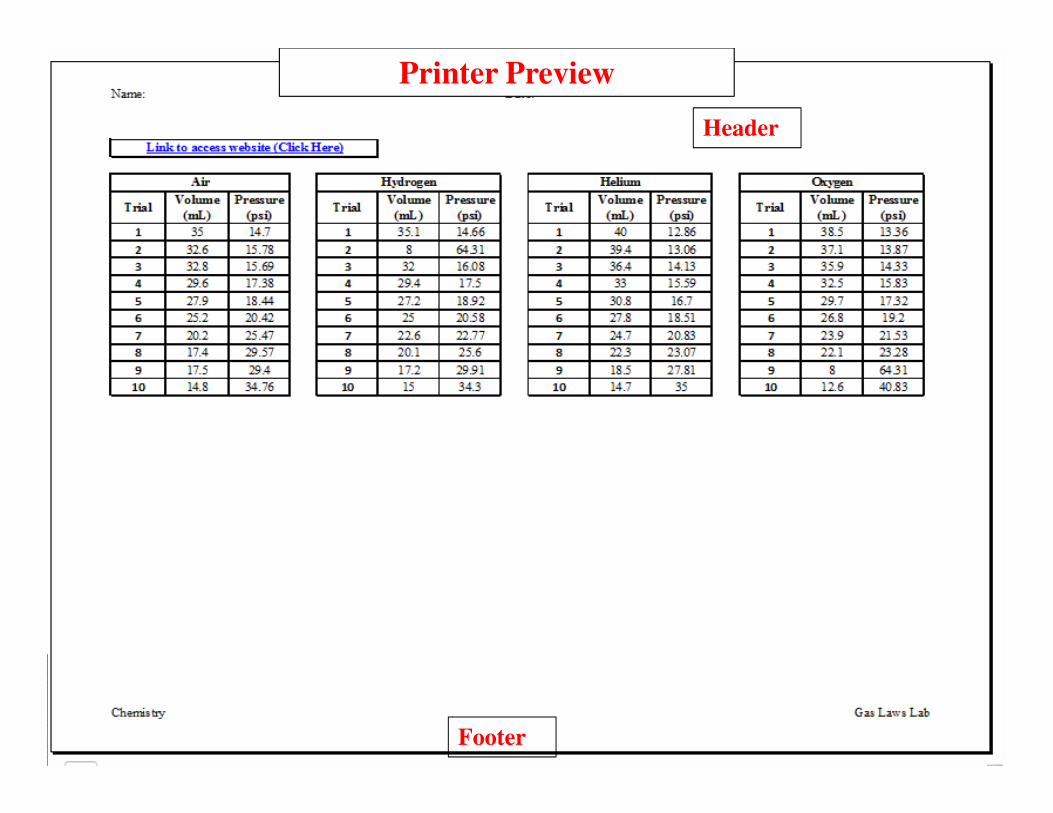
Printer Preview
Header
Footer
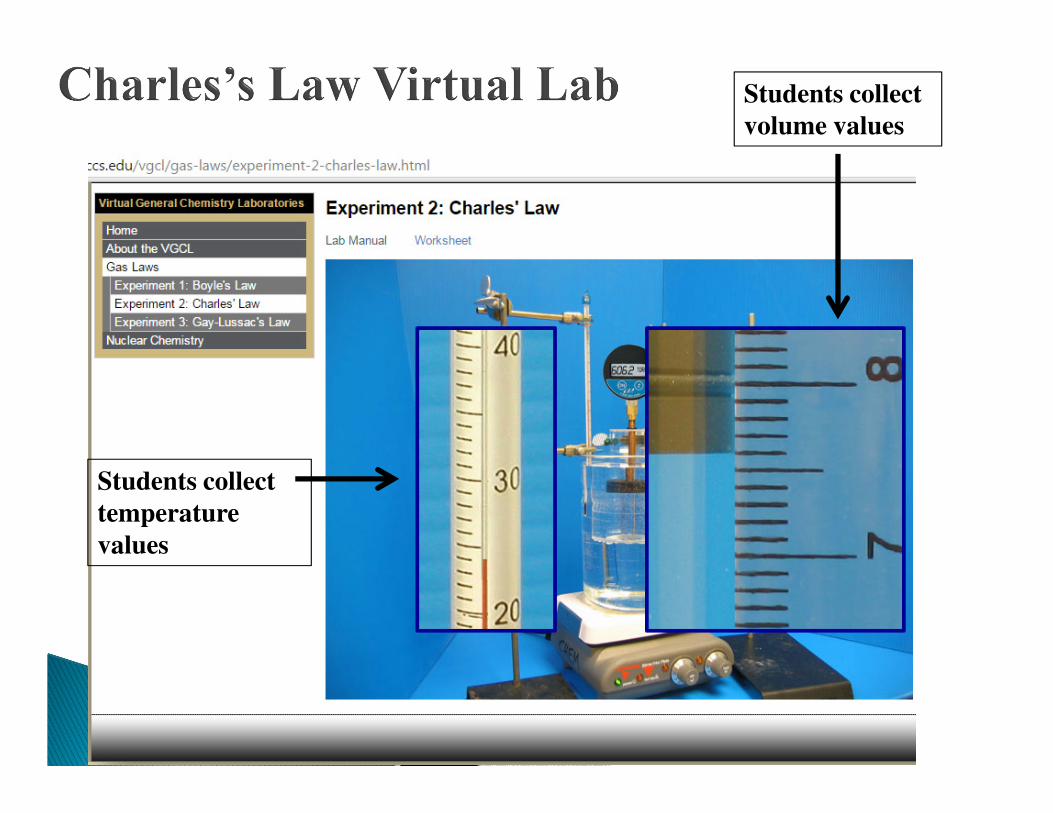
Students collect
temperature
values
Students collect
volume values
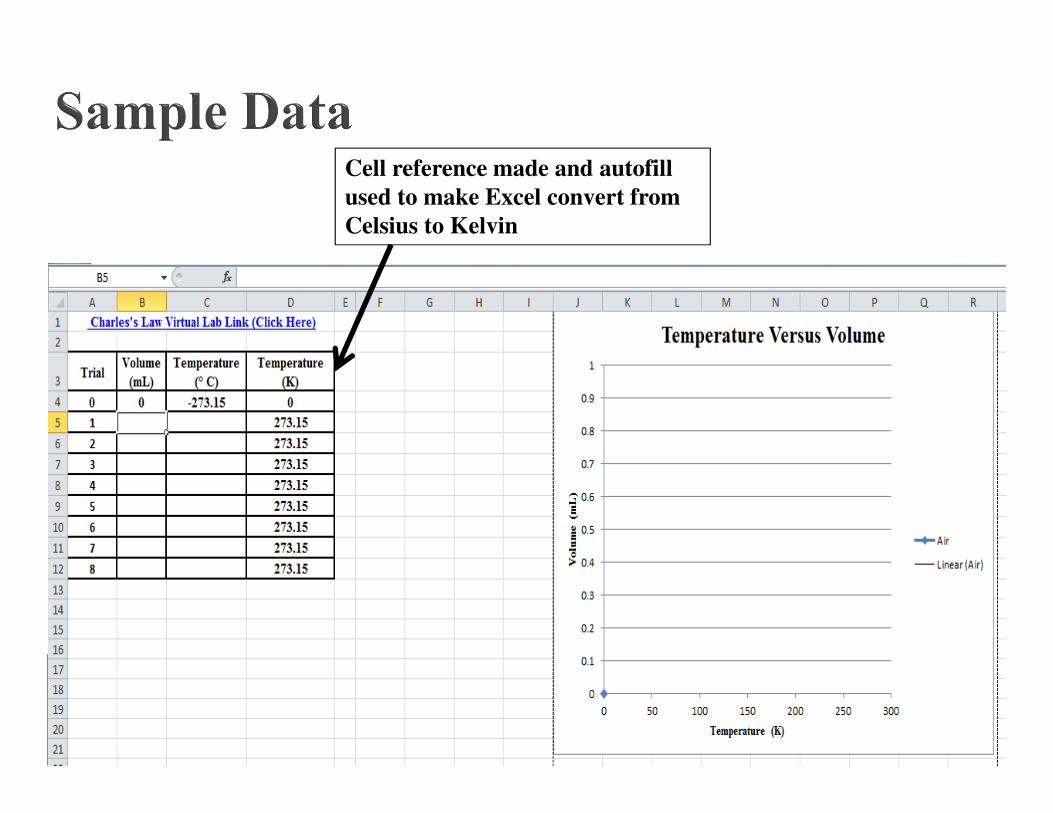
Cell reference made and autofill
used to make Excel convert from
Celsius to Kelvin
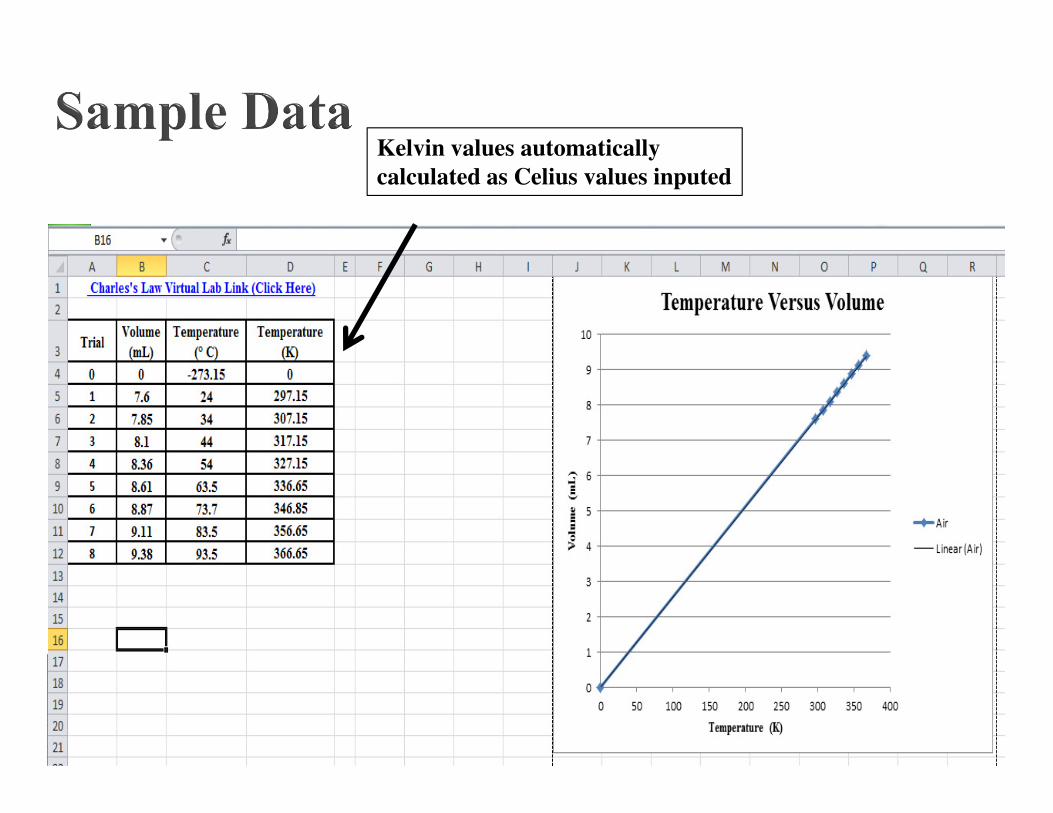
Kelvin values automatically
calculated as Celius values inputed
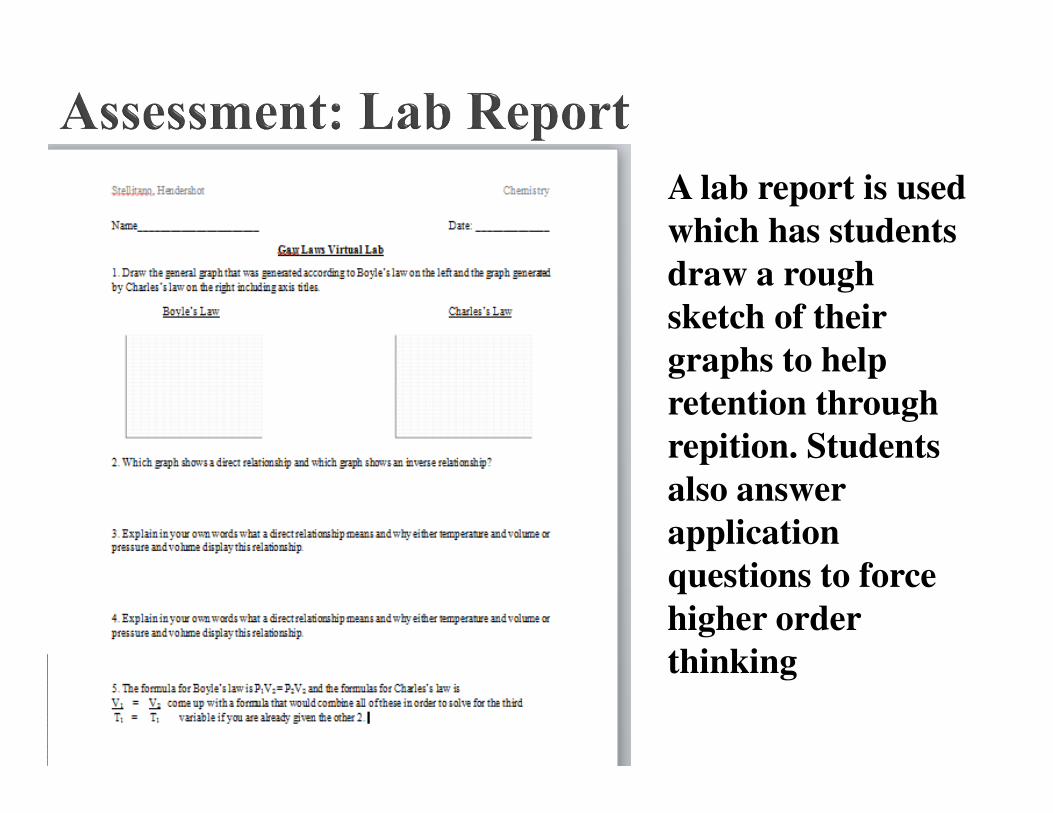
A lab report is used
which has students
draw a rough
sketch of their
graphs to help
retention through
repition. Students
also answer
application
questions to force
higher order
thinking
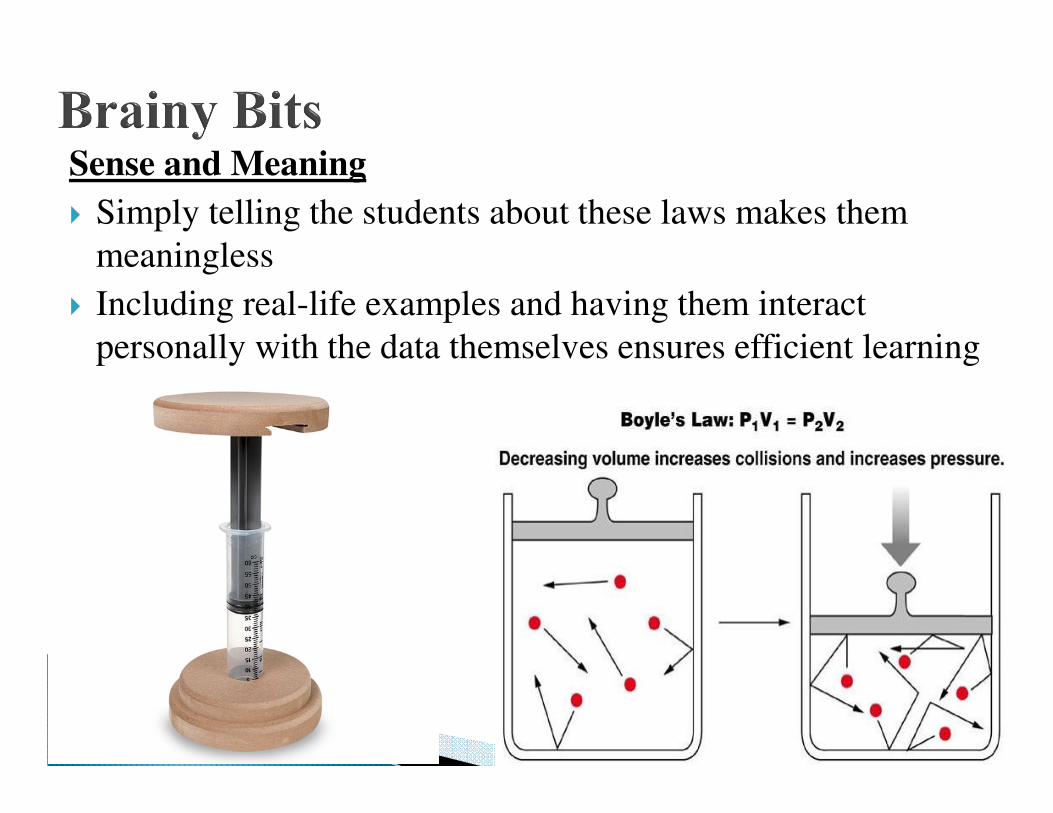
Sense and Meaning
� Simply telling the students about these laws makes them
meaningless
� Including real-life examples and having them interact
personally with the data themselves ensures efficient learning
Chunking
� The material is chunked to initially only introduce
students to the gas laws themselves and not yet perform
calculations
� Its important that the students first grasp the general
relationship shown by temperature and volume as well
as pressure and volume
� This particular student population needs the material at
this pacing
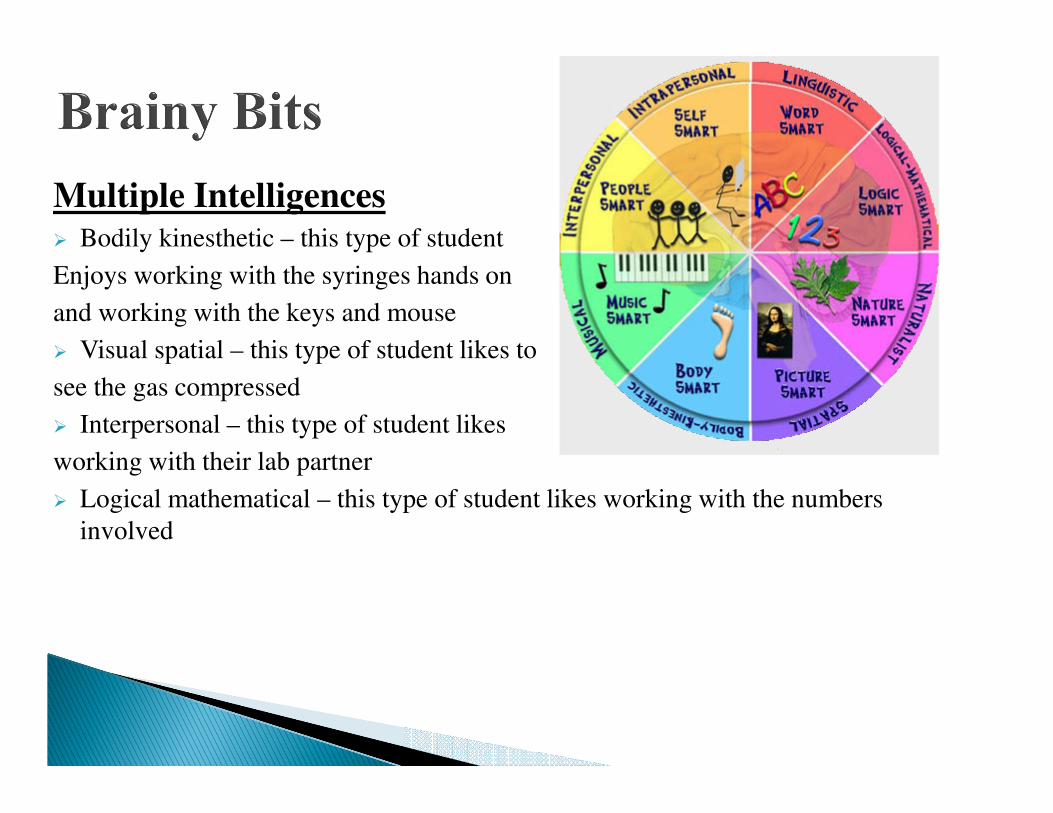
Multiple Intelligences� Bodily kinesthetic – this type of student
Enjoys working with the syringes hands on
and working with the keys and mouse
� Visual spatial – this type of student likes to
see the gas compressed
� Interpersonal – this type of student likes
working with their lab partner
� Logical mathematical – this type of student likes working with the numbers
involved
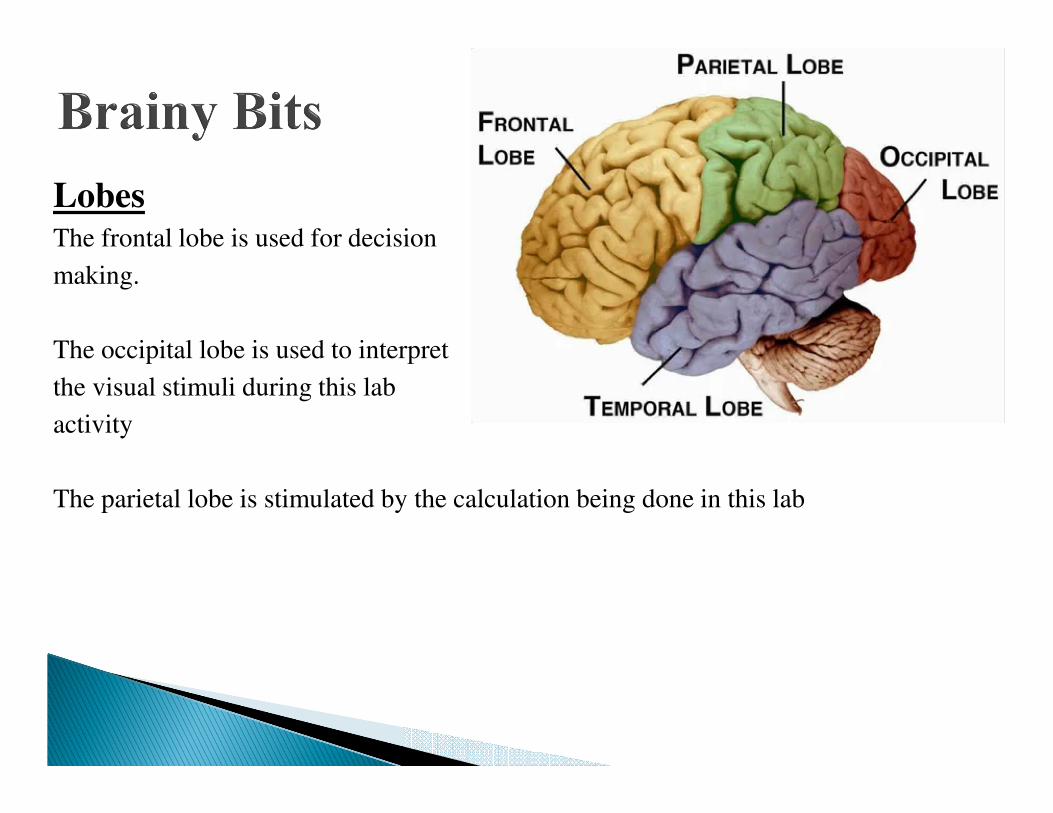
LobesThe frontal lobe is used for decision
making.
The occipital lobe is used to interpret
the visual stimuli during this lab
activity
The parietal lobe is stimulated by the calculation being done in this lab

� Iowa State University Department of Chemistry
� http://group.chem.iastate.edu/Greenbowe/sections/proje
ctfolder/flashfiles/gaslaw/boyles_law_graph.html
� University of Colorado
� http://www.uccs.edu/vgcl/gas-laws/experiment-2-
charles-law.html
� Microsoft Excel


