1 Teacher Page 2, FGIS Preparation Introduction During this session you will create a geographic information system (GIS) for your school forest area using a free, simplified software – ForestryGIS (FGIS). You will use the program to create “county-scale” GIS data files (map layers) for your school forest area. The files will be clipped from larger “state-scale” GIS data files. This will make the data easier to work with and allow the FGIS program to run faster. Once all the layers have been clipped, you will create three map print-outs for use in future lessons. You will leave the session today with the FGIS software, a project containing statewide data sets (WisconsinSF.ttkgp), and a project containing data sets for your school forest area. Learning Objectives Upon completion of this session, participants will be able to: Define GIS and describe its common uses Identify and define 3 types of GIS files Create an FGIS project Format the layout view of FGIS data files Add a data layer to an FGIS project Create and print a map layout using FGIS and Microsoft Word. What is a Geographic Information System (GIS)? According to ESRI , a global leader in the development of GIS software, GIS is “a collection of computer hardware, software, and geographic data for capturing, managing, analyzing, and displaying all forms of geographically referenced information.” With a GIS, you can link information (attributes) to location data, such as people to addresses, forests to parcels, or streets within a network. You can then layer that information to give you a better understanding of how it all works together. You choose the layers to combine based on the questions you need to answer. GIS Terms ( from the ESRI on-line GIS Dictionary) Feature – A representation of a real-world object on a map. Attribute – The non-spatial information about a geographic feature in a GIS. For example, attributes of a river might include its name, length, and sediment load at a gauging station Vector Data – A coordinate-based data model that represents geographic features as points, lines, and polygons. o Polygon – On a map, a closed shape defined by a connected sequence of x,y coordinate pairs, where the first and last coordinate pair are the same and all other pairs are unique. o Shapefile – A vector data file format for storing the location, shape, and attributes of geographic features. Raster Data - A spatial data model that defines space as an array of equally sized cells (pixels) arranged in rows and columns. Each cell contains an attribute value and location coordinates. Groups of
Transcript
1
Teacher Page 2, FGIS Preparation
Introduction During this session you will create a geographic information system (GIS) for your school forest area using a free, simplified software – ForestryGIS (FGIS). You will use the program to create “county-scale” GIS data files (map layers) for your school forest area. The files will be clipped from larger “state-scale” GIS data files. This will make the data easier to work with and allow the FGIS program to run faster. Once all the layers have been clipped, you will create three map print-outs for use in future lessons. You will leave the session today with the FGIS software, a project containing statewide data sets (WisconsinSF.ttkgp), and a project containing data sets for your school forest area. Learning Objectives Upon completion of this session, participants will be able to:
Define GIS and describe its common uses
Identify and define 3 types of GIS files
Create an FGIS project
Format the layout view of FGIS data files
Add a data layer to an FGIS project
Create and print a map layout using FGIS and Microsoft Word. What is a Geographic Information System (GIS)? According to ESRI, a global leader in the development of GIS software, GIS is “a collection of computer hardware, software, and geographic data for capturing, managing, analyzing, and displaying all forms of geographically referenced information.” With a GIS, you can link information (attributes) to location data, such as people to addresses, forests to parcels, or streets within a network. You can then layer that information to give you a better understanding of how it all works together. You choose the layers to combine based on the questions you need to answer. GIS Terms ( from the ESRI on-line GIS Dictionary)
Feature – A representation of a real-world object on a map.
Attribute – The non-spatial information about a geographic feature in a GIS. For example, attributes of a river might include its name, length, and sediment load at a gauging station
Vector Data – A coordinate-based data model that represents geographic features as points, lines, and polygons.
o Polygon – On a map, a closed shape defined by a connected
sequence of x,y coordinate pairs, where the first and last coordinate pair are the same and all other pairs are unique.
o Shapefile – A vector data file format for storing the location, shape, and attributes of geographic features.
Raster Data - A spatial data model that defines space as an array of equally sized cells (pixels) arranged in rows and columns. Each cell contains an attribute value and location coordinates. Groups of
cells that share the same value represent the same type of geographic feature.
o Image - Data produced by scanning a surface with an optical or electronic device. Common examples include scanned documents, remotely sensed data (for example, satellite images), and aerial photographs. An image is stored as a raster dataset of binary or integer values that represent the intensity of reflected light, heat, or other range of values on the electromagnetic spectrum.
o Digital Raster Graphic (DRG) - A raster image of a scanned USGS standard series topographic map. Source maps are georeferenced to the surface of the earth, fit to the universal transverse Mercator (UTM) projection, and scanned at a minimum resolution of 250 dpi.
o Orthophotograph - An aerial photograph from which distortions owing to camera tilt and ground relief have been removed. An orthophotograph has the same scale throughout and can be used as a map.
o Digital Elevation Model (DEM) – A raster representation of continuous elevation values over a topographic surface. DEMs are typically used to represent terrain relief.
Projected Coordinate System – A reference system used to locate x, y, and z positions of point, line, and area features in two or three dimensions. A projected coordinate system is defined by a geographic coordinate system, a map projection, any parameters needed by the map projection, and a linear unit of measure.
FGIS Overview FGIS, or forestry GIS, is a simplified GIS program designed and used by forestry professionals in the Wisconsin Department of Natural Resources. It is a compact shapefile editing program, digitizer and GIS data query tool for Windows®. Designed for operational field managers like foresters and wildlife biologists, FGIS has essential tools tailored for precision mapping on a desktop computer. Use FGIS to customize layered views including aerial photos and other imagery, draw map objects, query and search spatial data, annotate maps for printing, and much more. The standalone program is unlimited, producing shapefiles and geo-referenced images compatible with commercial software in an enterprise GIS framework. Effective User Strategies
1. BE PATIENT! Let the program run. Do not hit buttons or click on icons while the program is running. Some data sets are very large and take time to process. Starting multiple tasks will only make the program run slower.
2. Keep your project file (.ttkgp) and all of your data files in the same folder. The folder
and project file should have the same name.
3. Do not delete files that you don’t recognize. All data sets have multiple files associated with them. The files contain attribute and other information necessary for the data to display properly in an FGIS project.
STEP-BY-STEP FGIS PREPARATION Guiding Questions What meaningful questions can GIS help us answer? FGIS Project Preparation
Introduction To prepare FGIS for use with your class, you will prepare the FGIS project file “Your school forest name”.ttkgp. Your students will be able to use this project to create, print, and analyze maps of your school forest region. The FGIS project file must be exported from the Source.ttkgp project file. The steps below will guide you through completing this process. * The FGIS software and Source.ttkgp project file with metadata
are available for free during the training course “Forests and Forestry in a Landscape Context: A Community-Based School Forest Curriculum.” They will also be offered in more specific training courses offered by LEAF and WFREA.
Getting to know FGIS
Step 1: Log on to your computer
Step 2: Open the WisconsinSF.ttkgp project
Navigate to the folder fGIS. You will see two folders: FGIS Program, and FGIS Projects. Open the FGIS Program folder and double click the FGIS Icon
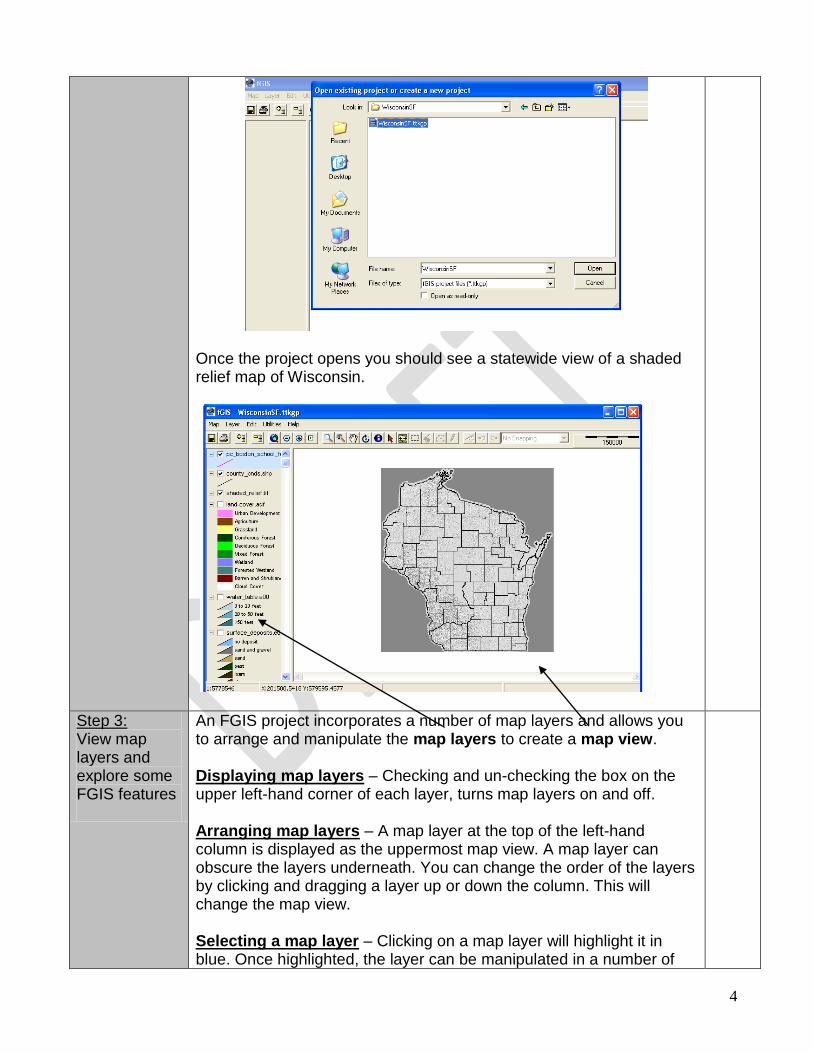
Navigate to the FGIS Projects folder and open the WisconsinSF folder inside. Click on the FGIS project WisconsinSF.ttkgp and click open.
4
Once the project opens you should see a statewide view of a shaded relief map of Wisconsin.
Step 3: View map layers and explore some FGIS features
An FGIS project incorporates a number of map layers and allows you to arrange and manipulate the map layers to create a map view. Displaying map layers – Checking and un-checking the box on the upper left-hand corner of each layer, turns map layers on and off. Arranging map layers – A map layer at the top of the left-hand column is displayed as the uppermost map view. A map layer can obscure the layers underneath. You can change the order of the layers by clicking and dragging a layer up or down the column. This will change the map view. Selecting a map layer – Clicking on a map layer will highlight it in blue. Once highlighted, the layer can be manipulated in a number of
5
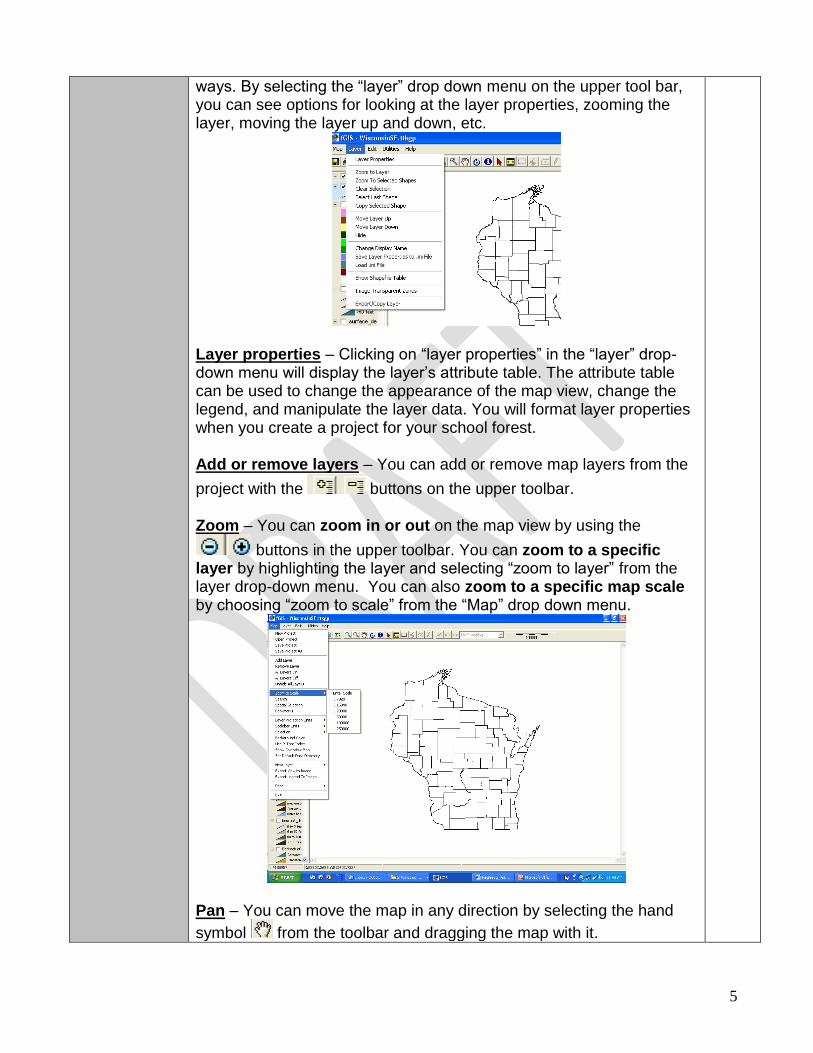
ways. By selecting the “layer” drop down menu on the upper tool bar, you can see options for looking at the layer properties, zooming the layer, moving the layer up and down, etc.
Layer properties – Clicking on “layer properties” in the “layer” drop-down menu will display the layer’s attribute table. The attribute table can be used to change the appearance of the map view, change the legend, and manipulate the layer data. You will format layer properties when you create a project for your school forest. Add or remove layers – You can add or remove map layers from the
project with the buttons on the upper toolbar.
Zoom – You can zoom in or out on the map view by using the
buttons in the upper toolbar. You can zoom to a specific layer by highlighting the layer and selecting “zoom to layer” from the layer drop-down menu. You can also zoom to a specific map scale by choosing “zoom to scale” from the “Map” drop down menu.
Pan – You can move the map in any direction by selecting the hand
symbol from the toolbar and dragging the map with it.
6
Step 5: Print a map view using FGIS and Microsoft Word.
In this step, you will print a statewide map showing 1) Shaded Relief, 2) County Boundaries, and 3) Surface Deposits. Map Layout
Activate the layers that you want to appear on your map and place them in order to show the desired map features.
Set the scale so the screen view of the map area represents the map that you want to print
Be sure that all lines, colors, and text in the map area are clear and legible. If they are not, you will need to edit them in the layer properties.
Legend Layout
Hide all of the layers that you do not want visible in you map printout.
Edit the display names of each layer in the legend so that they are clear, concise, and accurately describe the map layer.
Make sure the graphical representation of each map element in the legend is present and correct.
Use you cursor to expand the legend area so that all of the text is clearly visible.
Print – Send Map to Word
Select “Send Map to Word” in the Map drop-down menu
Locate and name output map image. The name should reflect the features of the map. The location should be convenient to remember and access (e.g., the WisconsinSF project folder).
Set a map scale that is a rounded number similar to the map scale on the screen (e.g. 1:3,500,000)
Click “Create Map.” A Microsoft Word document will appear with the map image exported into it.
Export Legend to Image
Select “Export Legend to Image” from the Map drop-down box.
Name the file and locate it in the
7
same folder as the map image (i.e., the WisconsinSF project folder)
Open the image, copy it, and paste it into the word document. Format Word Document
The map should have the following information: Title, Map, Legend, Scale, North Arrow, Author, and Date.
Save the map in the WisconsinSF project folder and print it.
Create an FGIS Project for Your School Forest
Step 5: Create a data folder and FGIS project file (.ttkgp) for your school forest
Navigate to the folder FGIS Projects and create a new folder for your school forest. Right click in the window and choose “New” then “Folder.” Name the folder after your school forest. You will save all of the data files pertaining to your school forest in this folder.
Start FGIS by clicking on the FGIS Icon in the FGIS Program folder. In the window that opens, navigate to the school forest folder that you just created. Name the project after your school forest and click Open.
A blank FGIS project window will open. At the end of this activity, you will add and format map layers that show county boundaries, rivers, roads, and much more. At the end of the workshop you will receive a DVD copy of the files and FGIS project that you create. Close the project before beginning the next step.
Step 6: Open the Source.ttkgp project file
In the folder FGIS Program locate and double-click the FGIS software icon. Navigate to the Source folder in the FGIS Projects folder. Open the existing project Source.ttkgp. It may take a few minutes for the project to load. Please be patient! Once the project loads, you should see a statewide Wisconsin map showing county boundaries. You will use the FGIS program to export “clipped” layers from this project to your school forest folder. The layers will be clipped to include
8
only the data for the region surrounding your school forest. This decreases the file size and allows the program to run faster.
Step 7: Export clipped shapefiles (.shp) to your school forest folder
Zoom and pan to the general location of your school forest. Center you school forest location in the screen view. Set the map scale at 1:500,000 to export the county layer. You may need to re-center your map.
Once the scale is set, be sure that the county boundaries layers is checked and highlighted in blue in the legend. Then click on the “Export/Copy Layer” function in the “Layer” drop-down menu.
When the tool window opens, click on “clipped by visible extent” and make sure that “Any supported shape” is selected and the “Selected Shapes Only” is not checked. Then click “OK.”
9
Navigate to your school forest folder. Name the layer “counties” and click save.
Use Windows Explorer to navigate to Your School Forest folder. You should see the following three files: counties.dbf, counties.shp, and counties.shx. Repeat the same procedure for the following layers:
watersheds.shp
roads.shp
open-water.shp
rivers.shp
township_range.shp
40acre_grid.shp
fire_occurance.shp
managed_forest_law.shp
forest_crop_law.shp
WDNR_managed_land.shp Leave the Source.ttkgp project file open and proceed to the next step.
Step 8: Open your school forest project and add map layers
Open the FGIS Program and open your school forest project that you saved in Your School Forest folder. Once the project opens, set default data directory by choosing “Set Default Data Directory” in the Map dropdown box and navigating to Your School Forest folder.
10
Add all of the shapefile (.shp) layers from Your School Forest folder
by using the Add Layer button in the upper toolbar. Once the add layer window is open, hold down the Ctrl button on you keyboard to highlight all of the layers in your folder. Then click Open.
When the layers are successfully added to your project, arrange the layers in the following order:
counties
township_range
40acre_grid
roads
watersheds
rivers
open_water
fire_occurance
managed_forest_law
forest_crop_law
WDNR_managed_lands
11
Save the project, but do not close it.
Step 9: Add the digital aerial photo(s) (orthophoto) for your school forest area.
Digitized and rectified aerial photos, known as orthophotos, are very large files. You will need to find and download the county orthophoto(s) that correspond to your school forest area from a DVD. On the DVD for your school forest region you will see folders for individual counties. Choose the county of your school forest. In the county folder find the folder ortho and open it. Left click on the folder naip_2005_wtm and click copy. MAKE SURE YOU COPY THE FOLDER “_wtm.”
Paste the folder into Your School Forest folder. You can now return to your fGIS project and add the layer “yourcounty05_NAIP.” Move the layer to the bottom of the legend and activate it. You should see a county-wide aerial photo. Save the project, but do not close it
Step 10: Formatting layers with uniform features
Once all of the layers are added to your project, you will need to format the layer properties so that the legend and map features are visible, legible, and easy to interpret. The properties include display names, colors, and line widths. Most of the layers in this project have map features with a uniform display. Meaning they consist of features that do not need to be distinguished from one another (e.g. we want all of the rivers to be blue). The only layer that has multiple display features is the WDNR_managed_lands layer. In that map layer, we need to distinguish between the different types of managed land. We will format that layer in the next step.
12
------ Just like any picture, a map layer can be formatted to have a solid or transparent background, a variety of background colors, outline types and thicknesses, and colors. The properties you give the map layer are determined by the way you wish to use it in the map display. For each layer, you will need to determine how it will be used before you format the properties. Open the your school forest project and look at the legend on the left hand side. Activate the counties layer. How will the counties layer be used in the school forest map?
Should it have a solid or transparent background?
Should the counties be labeled with names?
What color should the county lines be? Once you have answered these questions, double-click on the counties layer in the legend. The layer properties window will open. You will format the layer properties using the tools in this window. You can see layer information, display labels for features, format the colors and fill patterns for polygon areas, and format polygon outlines.
The window should open with the Area Tab activated. In this view you will be able to format the polygon areas and outlines and include the layer information in the legend. Area color and fill With polygon shapefiles, the area and fill pattern of the polygons can be formatted. In the counties layer the outline is the most important part of the polygon, since the layer will be used as an overlay to give geographic context to other features. For this reason the area should be set as transparent.
13
By choosing the Color box, you can choose a basic color or expand the choices by defining a custom color for the polygon area. In this case, since the area is transparent, you may just want to choose white. Highlight the white square and click “OK” and white will become the area color.
Outline color and style (include in legend and apply) By clicking the Outline tab, you can format the outline properties of the polygons in the counties layer. Set the outline of the polygon as solid, with a 0.1pt width, and black color. Check the “Include in Legend” box and then click “Apply.” You should see the changes you made to the counties layer and also see a black diagonal line appear under the counties label in the left-hand legend column.
Labels Features in the map can display labels, such as the names of roads,
14
lakes, and counties. In the counties layer, each county is a distinct polygon, and each polygon has attribute information associated with it (e.g. the area of the county, the length of the perimeter, the county name, etc.). You can use the layer properties window to choose which attribute to display. Click on the Label tab. Click the down arrow to expose the Field drop-down box. In the field you will see all of the attributes associated with the layer. Choose “CTY_NAME” to display the name for each county.
Select white as the color and then click on the Font display box. Leave the font as Arial, Regular 8pt Black font.
Click on the Position tab. These controls allow you to set how the label is displayed. Most of the properties are fine left in the default selection, but be sure that the “include in legend” box is unchecked and the “visible” box is checked.
Click “OK.” The county name should be displayed in the middle of each county on the map.
15
------ Use the steps above to format all of the shapefile (.shp) layers in your school forest project. You may wish to make the layers look the same as those in the Source.ttkgp file. But, feel free to format the layers in a way that makes sense to you. Once the layers are formatted, save the project but do not close it.
Step 11: Formatting layers with multiple map features
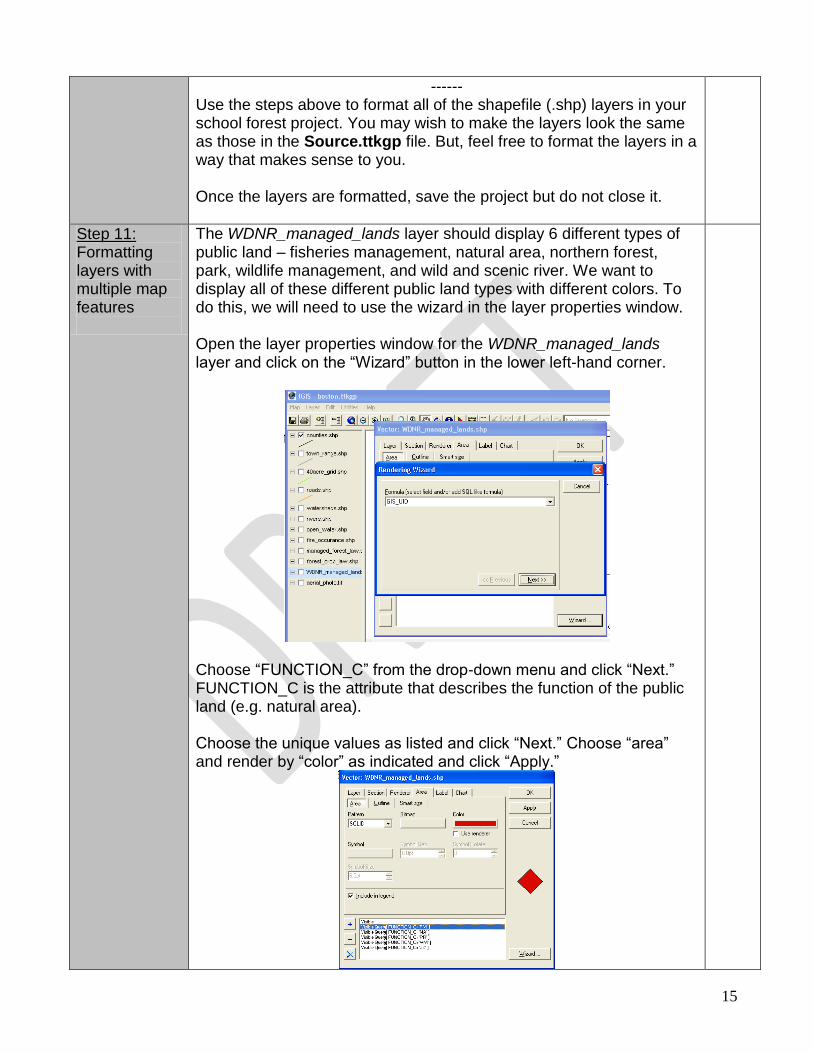
The WDNR_managed_lands layer should display 6 different types of public land – fisheries management, natural area, northern forest, park, wildlife management, and wild and scenic river. We want to display all of these different public land types with different colors. To do this, we will need to use the wizard in the layer properties window. Open the layer properties window for the WDNR_managed_lands layer and click on the “Wizard” button in the lower left-hand corner.
Choose “FUNCTION_C” from the drop-down menu and click “Next.” FUNCTION_C is the attribute that describes the function of the public land (e.g. natural area). Choose the unique values as listed and click “Next.” Choose “area” and render by “color” as indicated and click “Apply.”
16
The wizard divides the WDNR_Managed_Lands layer into different features based on whether the land is a natural area, fisheries area, etc. (the number of features depends on how many different types of DNR land are in your school forest area). It also assigned each feature a different color. Click on each function to see the color assigned. To see the map view, click “OK.” The layer properties window will close. Activate the map layer. You should see a legend which displays the colors and initials of each land type. You should also see colored boxes in the map area showing where each of the areas are. Re-open the layer properties window to improve the format of the legend names and colors. Click on the “Section” tab and spell out the name of the management area in the “Legend” box (FM = fisheries management, NA = natural area, NF = northern forest, PR = Park and Recreation, WM = wildlife management, and ZZ = wild and scenic river).
You can change each category by highlighting the function in blue and typing the full name in the legend box. Click “Apply” and you should see the changes appear in the map legend. Next, click on the “Area” tab and change the colors to better match the function of the land (e.g. fisheries management = blue).
17
Once you are done, click “OK.” Save the project but do not close it.
Create Map Layers in Your School Forest Project
Step 12: Create a shapefile (.shp) of your school forest boundary
Up until now, we have been adding existing data files to our project and formatting them to display in our map view. Now you are going to create a shapefile layer that represents the boundary of your school forest. You will then generate random points in the layer that will serve as the location of research plots. Use the aerial photo, county boundaries, roads, rivers, or other layers to pan and zoom to your school forest area. Once you have found the area, go to the Map Drop-down Menu and select “New Layer -> New Polygon Layer.”
Name the layer after your school forest and be sure that it is saved in your school forest project folder. Click Save. Once you return to the project view, a red bar should appear across the bottom of the screen. This means that you are in editing mode. Go to the Edit Drop-down Menu and choose “New Shape.” This will activate the shape drawing tool that you will use to draw the school forest boundary with your curser.
18
Use the cursor to mark the corners of your school forest boundary moving in a clockwise motion. As you mark point, the program should connect each point with a line until you have made a closed polygon. You can fix corners by clicking them and dragging them into a different place.
Once the boundary is complete go to the Edit Drop-down Menu and click “Save Edits.” Go back to the Edit Drop-down Menu and click “Stop Editing.” You can then format the properties of the layer. Make the area transparent and the outline pink or some color that shows up well over the aerial photo. Save the project but do not close it
Step 13: Generate “cruise points” for your school forest area
De-select all of the other map layers except the school forest boundary. It should be the only layer visible on the screen. It should also be highlighted in blue in the legend column.
Select the Pick Tool from the upper tool bar. Use the cursor to click on the shape of the school forest boundary in the map view. When selected, the boundary will be highlighted in yellow. It may take a few tries.
19
Once the boundary is highlighted, select the “Generate Cruise Points” utility from the Utility Drop-down Menu.
The Generate Cruise Points Window will open. Select your school forest boundary as the Input Polygon Layer if it is not already selected. Select Random and type in “10” as the # of Points to Generate. Click on Output Shapefile, name the layer “research_plots” and save it in Your School Forest folder. Then click OK.
20
Ten red squares should be visible inside the yellow highlighted school forest boundary. A new layer with the name “research_plots” should also be visible in the legend. Deselect the school forest boundary layer by choosing “Clear Selection” in the Layer Drop-down Menu. The colors of the layers should return to normal.
Step 14: Format the research plots layer
Open the Layer Properties window from the research plots layer. Change the color of the marker to a pale yellow and click Include in Legend.
Click on the Label tab and change the background color to a pale yellow. Choose “ID” from the drop-down box in the Field menu. This will identify each of the plots with a number. Click OK.
21
Each of the research plots should be marked by a yellow square with a number identifier.
Step 15: Review your map presentation
Once all of your layers are created and formatted, review the map for the following characteristics:
1) All legend titles are correctly spelled, uniform, visible and show proper symbols
2) Layer are in a logical and convenient order 3) The colors and labels of map layers make features easy to see
and interpret Once you have reviewed your project, save it but don’t close it.
Step 16: Create a map and legend image that your students
Hide all of the map layers in the legend column except for the following layers: research plots, SF boundary, and 40 acre grid. Be sure that the legend names are fully visible and that all of the layers are activated and visible in the map view.
22
can use to create a map of the school forest research plots.
Choose “Send Map to Word” from the Print Option in the Map Drop-down Menu. Select New Word Doc. Set the Output Scale to “1 in. = 400 ft.” And save the Output Map Image as “Research Plot Map” in Your School Forest folder. Then click Create Map.
A Word Document will open with the map view and scale inserted. Minimize the document and return to the FGIS Project. You still need to export an image of the legend. Choose “Export Legend to Image” from the Map Drop-down Menu. Save the legend as “Research Plot Legend” in Your School Forest folder. You will need to add this to your map in Microsoft Word as part of the following assignment. Save and close the FGIS project.
Assignments: Print a Map of Your School Forest Research Plots
1) Create and print a school forest map from you
Create and print a map of your school forest region. The map should show an aerial photo of the school forest area, your school forest boundary, a 40 acre grid overlay, and the school forest research plots.
23
school forest project
The map should include the following:
Title (School Forest Research Plots)
Legend
Map Scale (1 in: 400 ft)
North Arrow
Author
Date
2) Add your school forest boundary to the WisconsinSF.ttkgp project.
Copy all data files relevant to your school forest boundary and research plots from Your School Forest folder and paste them into the WisconsinSF folder. Open the WisconsinSF.ttkgp project. Add the school forest boundary and research plots layer. Zoom to the layer. Format the layer properties if needed. Save and close the project.