University of Central Florida University of Central Florida STARS STARS Electronic Theses and Dissertations, 2004-2019 2008 Teacher Perceptions Of The Achievement Of Students With Teacher Perceptions Of The Achievement Of Students With Learning Disabilities On Statewide Assessments Learning Disabilities On Statewide Assessments Maryann Gromoll University of Central Florida Part of the Curriculum and Instruction Commons Find similar works at: https://stars.library.ucf.edu/etd University of Central Florida Libraries http://library.ucf.edu This Doctoral Dissertation (Open Access) is brought to you for free and open access by STARS. It has been accepted for inclusion in Electronic Theses and Dissertations, 2004-2019 by an authorized administrator of STARS. For more information, please contact [email protected]. STARS Citation STARS Citation Gromoll, Maryann, "Teacher Perceptions Of The Achievement Of Students With Learning Disabilities On Statewide Assessments" (2008). Electronic Theses and Dissertations, 2004-2019. 3536. https://stars.library.ucf.edu/etd/3536
Transcript
University of Central Florida University of Central Florida
STARS STARS
Electronic Theses and Dissertations, 2004-2019
2008
Teacher Perceptions Of The Achievement Of Students With Teacher Perceptions Of The Achievement Of Students With
Learning Disabilities On Statewide Assessments Learning Disabilities On Statewide Assessments
Maryann Gromoll University of Central Florida
Part of the Curriculum and Instruction Commons
Find similar works at: https://stars.library.ucf.edu/etd
University of Central Florida Libraries http://library.ucf.edu
This Doctoral Dissertation (Open Access) is brought to you for free and open access by STARS. It has been accepted
for inclusion in Electronic Theses and Dissertations, 2004-2019 by an authorized administrator of STARS. For more
STARS Citation STARS Citation Gromoll, Maryann, "Teacher Perceptions Of The Achievement Of Students With Learning Disabilities On Statewide Assessments" (2008). Electronic Theses and Dissertations, 2004-2019. 3536. https://stars.library.ucf.edu/etd/3536
Teacher effectiveness is difficult to measure and consequently is being inferred from
students’ performance (Berk, 2005). Berk has found numerous difficulties when isolating
teaching as the sole explanation for student productivity. Jordan and Stanovich (2001) have
found that measurement of academic achievement and achievement gains are a challenge to
researchers as students with disabilities are difficult to compare based on differing achievement
levels.
This study examined current legislation and formulated an instrument to measure teacher
characteristics, perceptions and beliefs that could impact student performance outcomes. The
focus of Chapter Three is to describe the methodology used to conduct this study and determine
the characteristics, perceptions, and beliefs associated with teachers who were successful in
attaining positive student achievement from their students with learning disabilities.
48
CHAPTER THREE: METHODOLOGY
Introduction
The central purpose of the study was to investigate whether special education teachers’
perceptions and beliefs were related to their students’ FCAT achievement. The researcher was
attempting to identify beliefs and perceptions that were found among teachers who were
successful in having their third grade students with learning disabilities pass the reading portion
of the 2007 FCAT. A second purpose of the study was to explore group and individual
differences, specifically in perceptions and beliefs toward students with learning disabilities and
statewide assessment. The third purpose was to investigate whether special education teachers’
professional development and service delivery models were related to their students’ FCAT
achievement. The researcher was attempting to identify what professional development and
service delivery models were present among special education teachers who were successful in
having their third grade students with learning disabilities pass the reading portion of the 2007
FCAT. Specific hypothesis related to the researcher’s purposes are presented below.
Research Hypothesis
The first hypothesis was related to the first and second purpose and addresses the
question What differences in teacher perceptions and beliefs toward statewide assessments are
present among teachers of students with learning disabilities?
49
Hypothesis 1:
The mean for special education teachers who had the majority of SWLD pass the FCAT
will differ significantly and positively (at the .05 level) in teacher perceptions and beliefs toward
statewide assessment from the mean for special education teachers who did not have the majority
of SWLD pass the FCAT.
The second and third hypotheses were related to the third and final purpose and addresses
the question What differences in professional development and service delivery models are
present in these settings in which there were differences in teacher perceptions and beliefs
toward statewide assessments?
Hypothesis 2:
The mean score for special education teachers who had the majority of SWLD pass the
FCAT will differ significantly and positively (at the .05 level) in the amount of professional
development received from the mean score for special education teachers who did not have the
majority of SWLD pass the FCAT.
Hypothesis 3:
. The mean score for special education teachers who had the majority of SWLD pass the
FCAT will differ significantly (at the .05 level) in the type of service delivery received from the
mean score for special education teachers who did not have the majority of SWLD pass the
FCAT.
Design
A quasi-experimental design was used to answer the research question since the
participants in this study were not randomly assigned to groups. Assignment to groups was
50
dependent on student achievement outcomes. Group size could not be equal based on the 2007
FCAT results.
This study investigated special education teachers’ perceptions, backgrounds, and beliefs
in teaching third grade classrooms of students with learning disabilities who passed the reading
portion of the Florida Comprehensive Assessment Test (FCAT) (FDOE, 2005). Ideology,
demography, beliefs and perceptions of special education teachers were surveyed and data were
collected. The comparative descriptive research design was used to identify how and why
something is happening and how it affects other variables in the study (Creswell, 2002).
Quantitative data collection procedures were used. A survey instrument was developed
(Appendix A) to include information on teachers’ background, experience, and perceptions
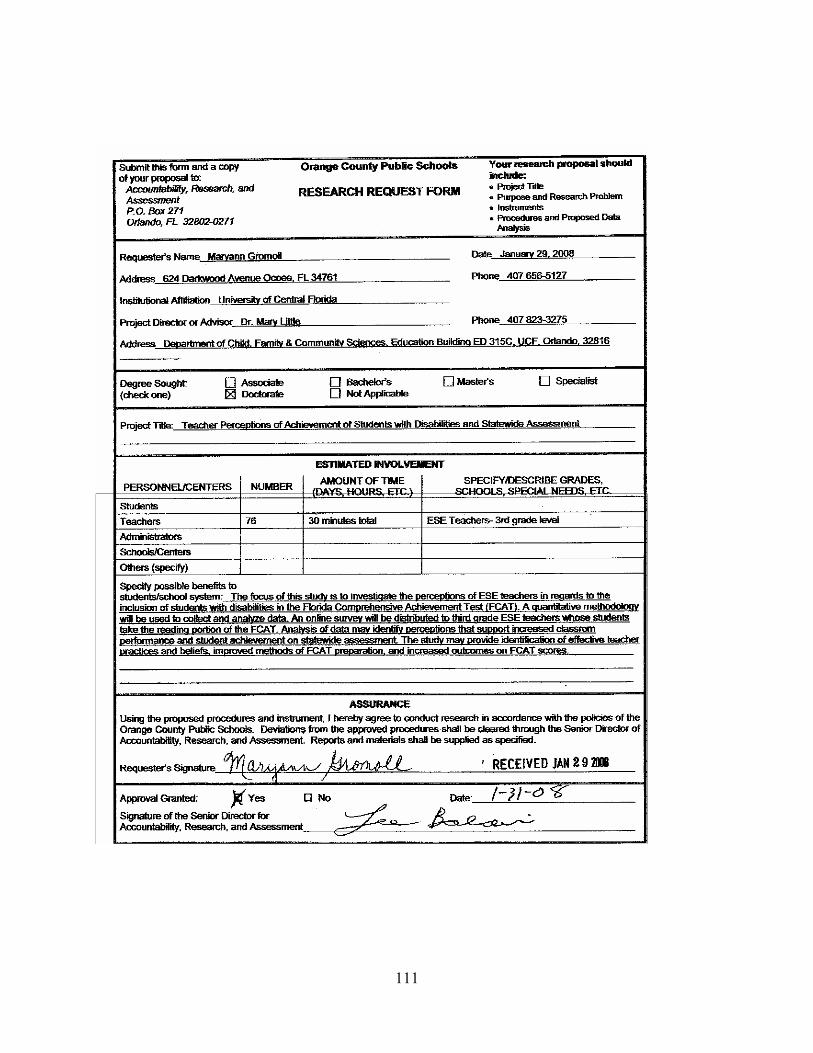
toward statewide assessments. Approval from the Internal Review Board and school district was
obtained (Appendix B and C). After selection of the participants and IRB approval the researcher
began examination of the teacher survey instrument through a Delphi Study (Appendix D and E)
to form revisions.
Setting and Population
The setting for the proposed study was in elementary classrooms in a school district in
central Florida. Participation in this study was reliant on the agreement of the principals
(Appendix F) and teachers (Appendix G) of 76 elementary schools. Principals from elementary
schools in a school district in central Florida were contacted online prior to the online teacher
survey disbursement. If principals were in agreement, the ESE teachers in those schools were
contacted.
51
The results of FCAT 2007 reading scores were obtained from the Florida Department of
Education website. Based on this information a group of ten teachers in a central Florida school
district were identified as having the majority of students with learning disabilities (57% or
more) pass the reading portion of the 2007 FCAT. The special education teachers in this group
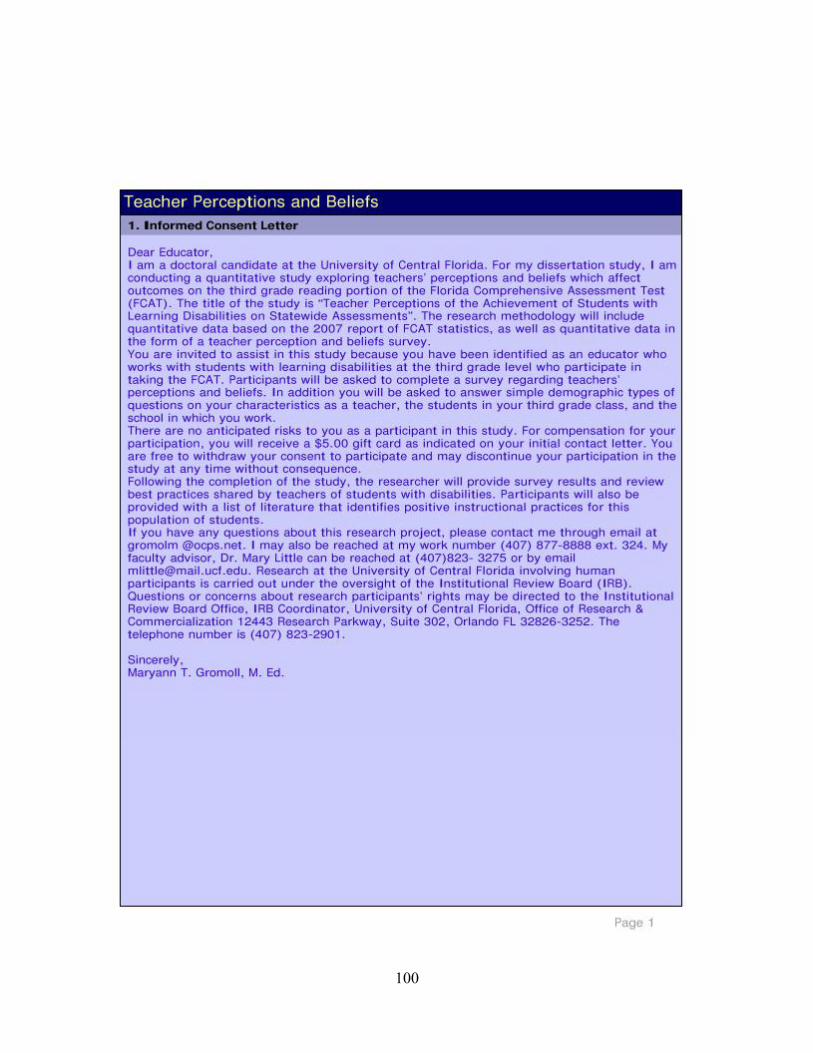
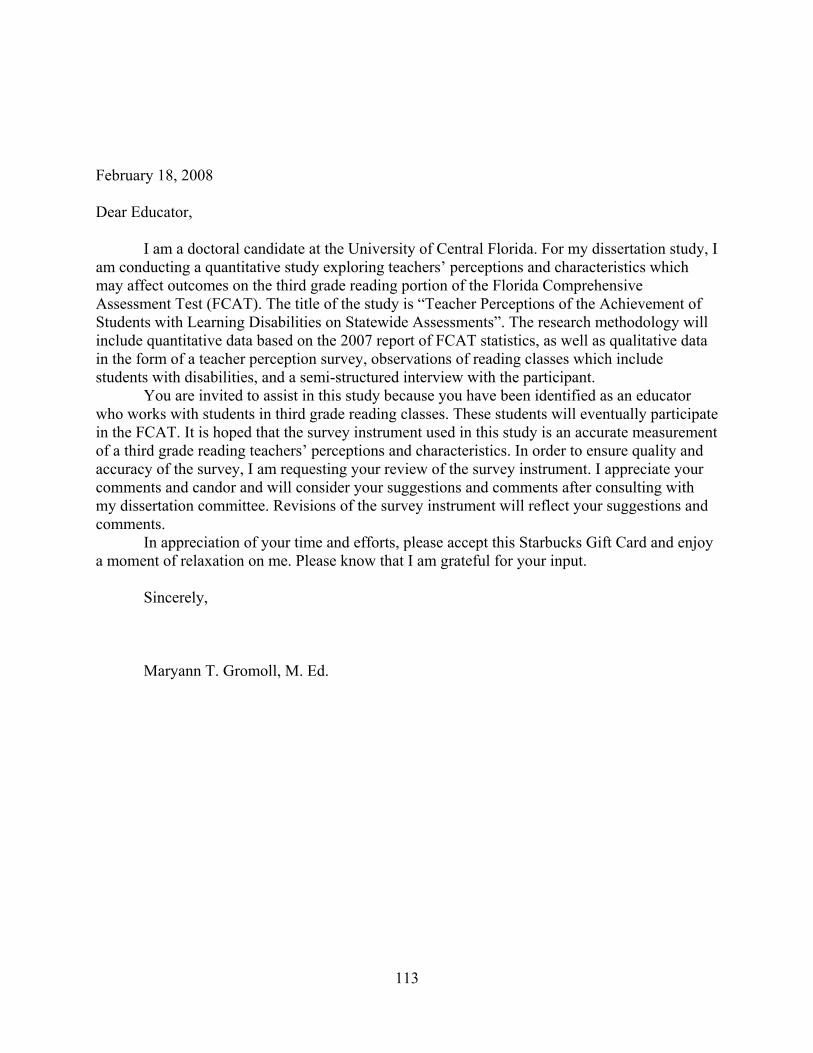
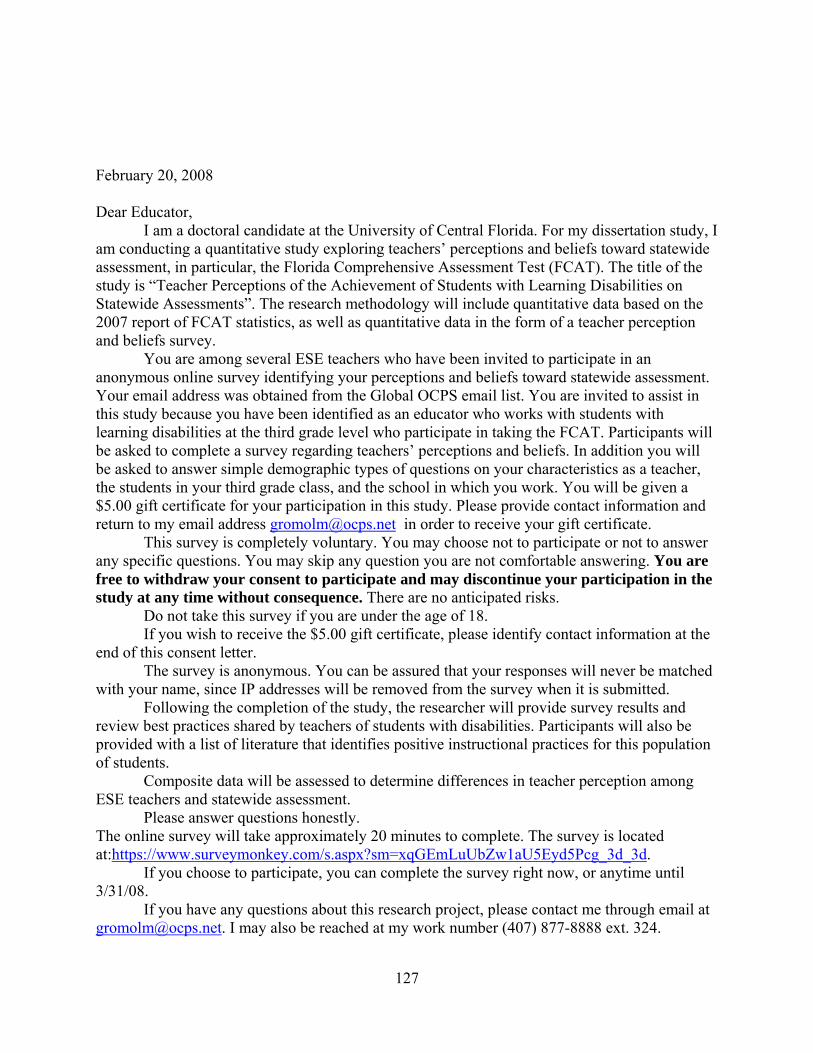
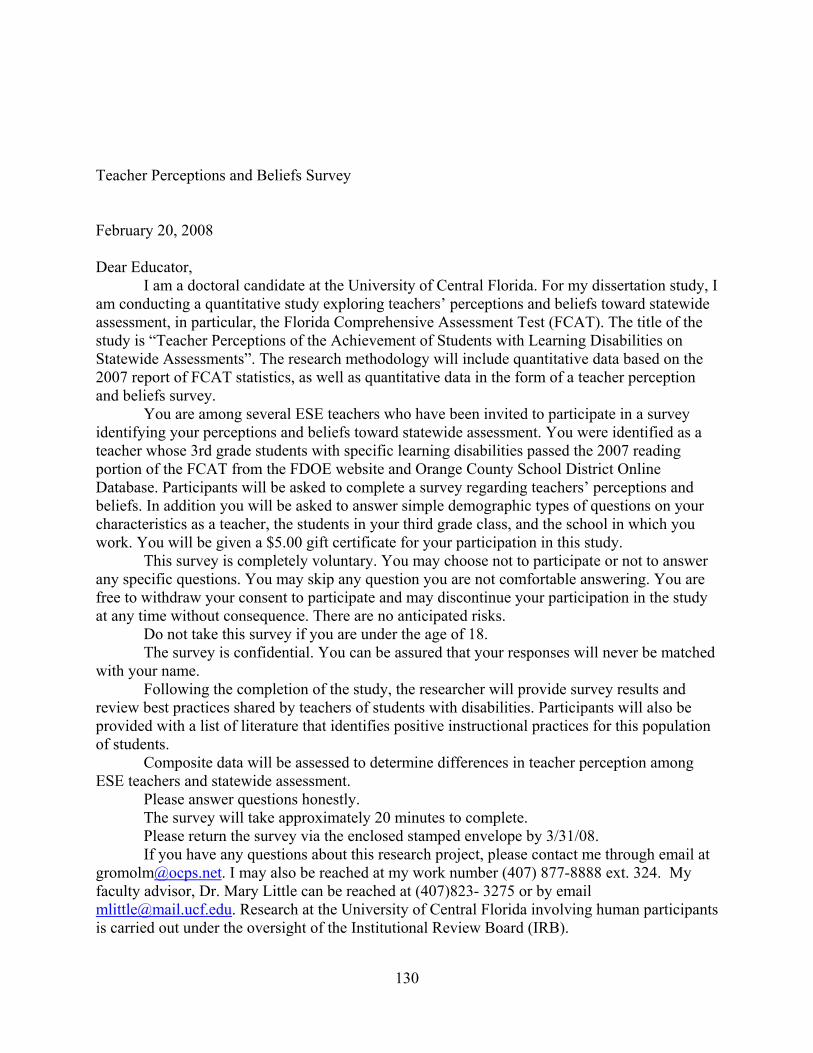
(Group A) were contacted by mail and were given an informed consent letter (Appendix H) and
the revised Teacher Perceptions and Beliefs Survey. The special education teachers (Group B)
in the remaining sixty-six schools were contacted online, provided with an informed consent
letter, and the revised Teacher Perceptions and Beliefs Survey. Fifty-four teachers from Group B
agreed to participate in the online survey. These special education teachers did not have the
majority (39% or less) of their SWLD pass the reading portion of the FCAT. Principals from
both groups of special education teachers were contacted online using the school district email
system. Permission for conducting the survey was requested and information detailing the survey
was given. Some principals responded via email identifying the teachers; others just gave
permission so the researcher used the school email system to obtain their identity.
The sample for this study was special education teachers of students with disabilities
from third grade classrooms located in one central Florida school district who agreed to
participate in the study. The special education teachers were teaching in general education
classrooms, self contained classrooms, and resource rooms. The third grade students with
learning disabilities in these classrooms are required to take the FCAT. The third grade level was
selected because of the implications of retention at that grade level should the student not pass
the FCAT. Students are required to achieve a Level 2 in order to “pass” the FCAT and move on
to the next grade level.
52
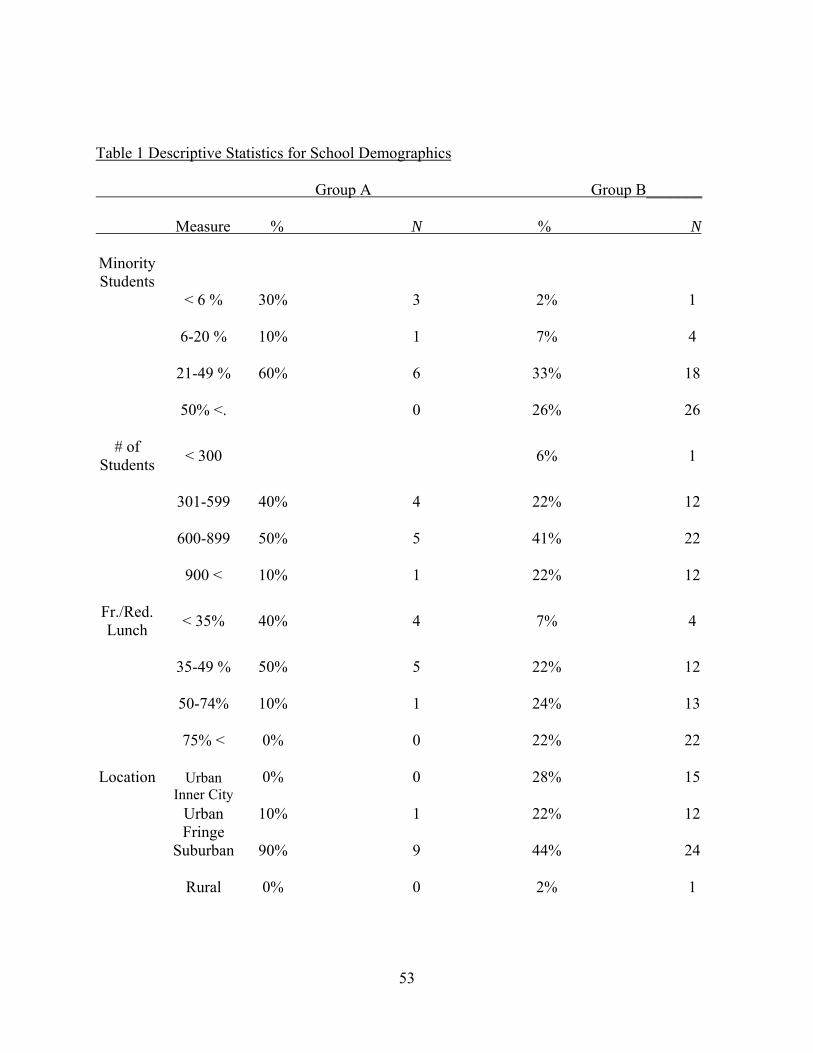
Schools in this study were located in urban inner city, urban fringe, rural, and suburban
settings. Additional information on school demographics are included on school size, number of
minority students, and free and reduced lunch recipients. Descriptive Statistics for nominal
values are contained in Table 1.
53
Table 1 Descriptive Statistics for School Demographics
Group A Group B_______
Measure % N % N
Minority Students
< 6 % 30% 3 2% 1
6-20 % 10% 1 7% 4
21-49 % 60% 6 33% 18
50% <. 0 26% 26
# of Students < 300 6% 1
301-599 40% 4 22% 12
600-899 50% 5 41% 22
900 < 10% 1 22% 12
Fr./Red. Lunch < 35% 40% 4 7% 4
35-49 % 50% 5 22% 12
50-74% 10% 1 24% 13
75% < 0% 0 22% 22
Location Urban Inner City
0% 0 28% 15
Urban Fringe
10% 1 22% 12
Suburban 90% 9 44% 24
Rural 0% 0 2% 1
54
Seventy-six elementary schools were contacted for participation in the study. Sixty-four
teachers from these schools agreed to participate. This level of participation resulted in an 84%
response rate. Teachers from these groups are representative of special education teachers who
teach third grade students with learning disabilities in central Florida. Additional descriptive
statistics of teachers are represented in Table 2. Teachers in both groups A and B taught students
with learning disabilities. Students with learning disabilities (SWLD) are a heterogeneous group
of psychological processing disorders manifested by significant difficulties in the acquisition and
use of language, reading, writing, or mathematics (FDOE, 2001). More descriptive statistics of
teachers are reported in Table 3.
55
Table 2 Descriptive Statistics for Nominal Variables-Teachers Group A and Group B
Measure % N % N__
Measure % N % N
Gender
Female 100% 10 94% 50
Male 0% 0 6% 3
Ethnicity Afric.Am. 10% 1 4% 2
Asian Is. 0% 0 0% 0
Pacific Is. 0% 0 0% 0
Hisp. 0% 0 10% 5
White 90% 0 81% 42
Multi. 0% 0 6% 3
Degree Bachelor 70% 7 62% 33
Masters 30% 3 34% 18
Specialist 0% 0 0% 0
Doctorate 0% 0 4% 2
Cert. 4 year College-
Educ.
89% 8 80% 41
Alternative. Cert. Course
0% 0 10% 5
Certif. Test 10% 1 10% 5
56
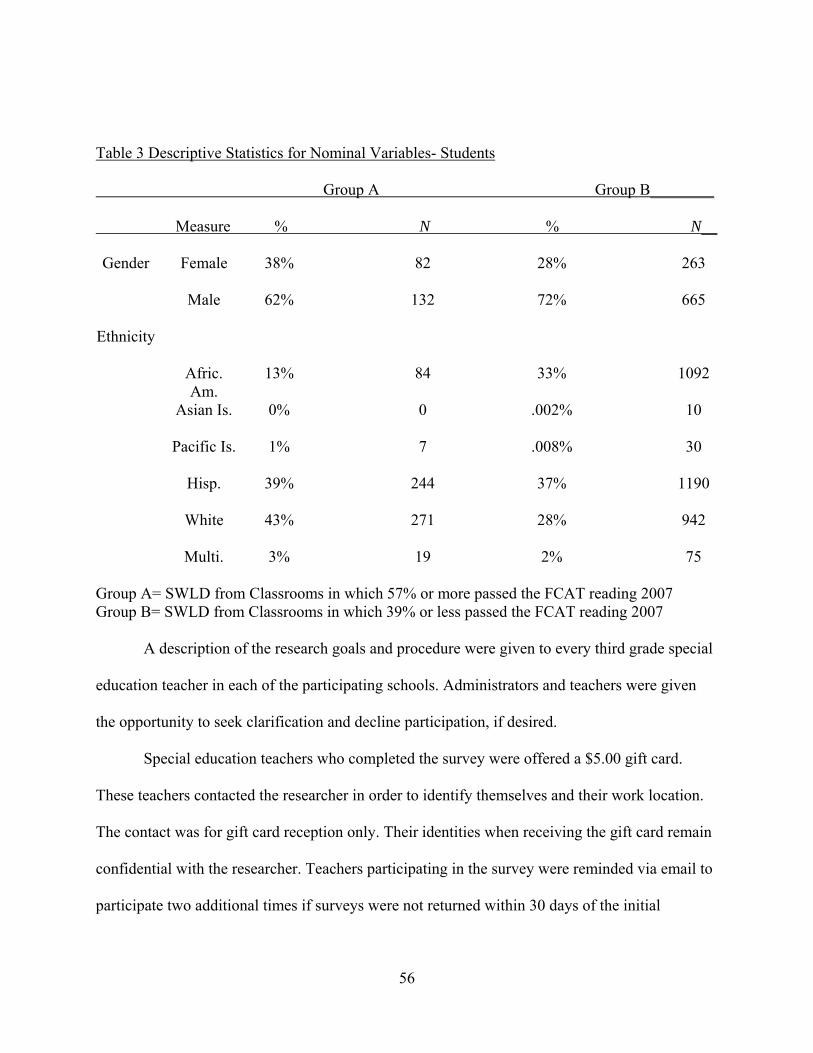
Table 3 Descriptive Statistics for Nominal Variables- Students
Group A Group B________
Measure % N % N__
Gender Female 38% 82 28% 263
Male 62% 132 72% 665
Ethnicity
Afric. Am.
13% 84 33% 1092
Asian Is. 0% 0 .002% 10
Pacific Is. 1% 7 .008% 30
Hisp. 39% 244 37% 1190
White 43% 271 28% 942
Multi. 3% 19 2% 75
Group A= SWLD from Classrooms in which 57% or more passed the FCAT reading 2007 Group B= SWLD from Classrooms in which 39% or less passed the FCAT reading 2007
A description of the research goals and procedure were given to every third grade special
education teacher in each of the participating schools. Administrators and teachers were given
the opportunity to seek clarification and decline participation, if desired.
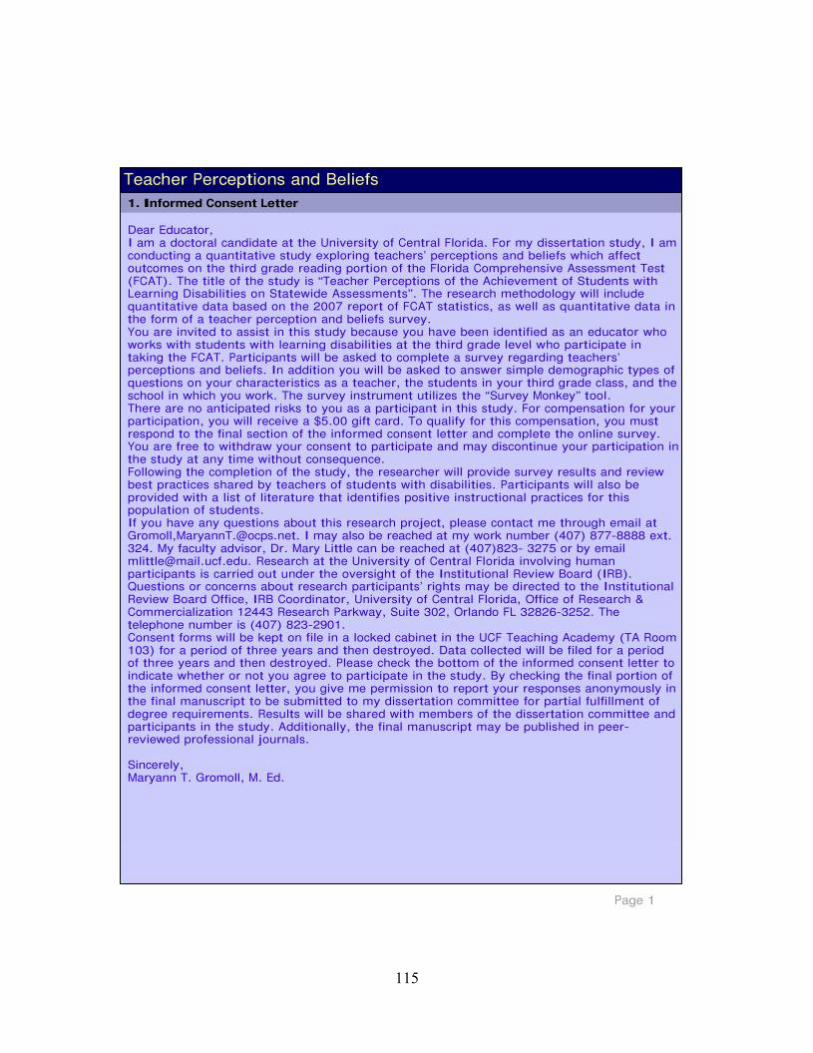
Special education teachers who completed the survey were offered a $5.00 gift card.
These teachers contacted the researcher in order to identify themselves and their work location.
The contact was for gift card reception only. Their identities when receiving the gift card remain
confidential with the researcher. Teachers participating in the survey were reminded via email to
participate two additional times if surveys were not returned within 30 days of the initial
57
distribution. Teachers were given the gift cards based on the honor system as the researcher did
not have a specific way for determining who had actually completed the survey.
Table 4 Descriptive Statistics Group A and B
Group N FCAT passing Contact_______
Group A 10 57% or more Mail
Group B 54 39% or less Online
After selection of participants and approval of the Internal Review Board process at the
university and school district, the researcher distributed the survey instrument and obtained
information regarding teacher perceptions and teacher, student and school demographics. The
researcher developed and revised the Teacher Perception and Beliefs Survey. Summated scales
for each of the four independent variables (teacher demographics, school demographics, student
demographics, and teacher perception and beliefs of student achievement on statewide
assessments) were developed. Overall descriptive statistics: mean and calculated distribution was
calculated for each scale. A descriptive comparison research design was used when collecting
data for the survey (National Research Council, 2002). A design matrix was constructed to
organize and report data (Lomax, 2001; Shavelson, 1996) for differences in teacher
demographics, school demographics, student demographics and perceptions of student
achievement between the two categories of teachers. Validity for the survey was formed based
on the Delphi study conducted prior to final survey distribution.
58
Instrumentation
The proposed survey was designed to determine teachers’ background, school
demographics, student demographics, and teacher perceptions and beliefs toward students with
learning disabilities, and statewide assessments. The survey was divided into four sections. The
first section consisted of questions regarding teacher background, i.e. race, gender, certification,
educational background and teaching experiences. The second section consisted of school
demographics, such as school location, school size, students receiving free and reduced lunch,
and minority students. The third section consisted of student demographics, including gender,
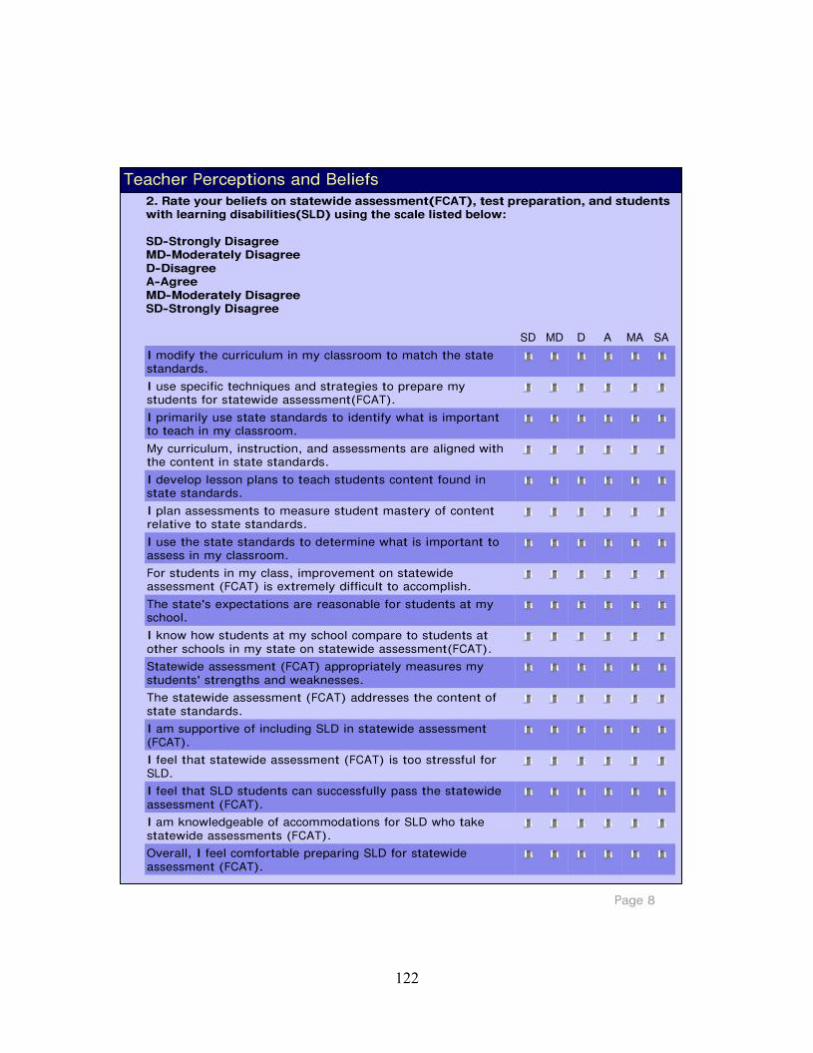
ethnicity, transient students, and types of disabilities.. The fourth section was a rating scale of
teacher perceptions and beliefs toward statewide assessment. The fourth section also included
test preparation for the FCAT. A six-point Likert rating scale was used. A neutral category was
not used so as to avoid eliciting a scaled response. Since the neutral category will provide
respondents an excuse not to answer a question, it will be of little value in this instrument (Gay
& Airasian, 2003).
The survey was developed in the following manner:
1. Based on the literature review of effective approaches in reading along with teacher
perceptions of student achievement, a preliminary copy of the instrument was drafted.
2. A Delphi study was conducted with a purposive sampling of teachers. The preliminary copy
of the survey was reviewed by nine teacher educators in reading education at the third grade
level. With their suggestions the instrument was revised. This survey was distributed to these
educators once IRB and district approval was obtained. Internal Review Board approval is
59
required as human subjects participated in this study. District approval was obtained to maintain
accountability for the study.
3. The survey was modified based on feedback from Delphi study participants. The Delphi study
participants were active reading teachers in the field of education who were currently teaching
reading in an elementary school in the school district whose students had taken the FCAT in
2007.
The Delphi methodology was used in this survey research as it reflected the systematic
solicitation of opinions from an expert panel concerning a particular topic (Dinnebell,
McInerney, & Hale, 2006). Participants in a Delphi panel are generally recruited based on their
expertise in a given topic. Delphi studies are conducted in successive rounds during which
members rate items, summarize the items, and then review the revised items for further rating
(Dinnebell, McInerney, & Hale, 2006).
A Delphi study was conducted with a purposive sampling of third grade teachers who
prepared students for statewide assessment (FCAT). These teachers were contacted (Appendix
D) and agreed to participate in the study. These teachers received an initial draft of the Teacher
Perceptions and Beliefs Survey (Appendix E). The team was composed of a nine member
teaching team which was successful in having students achieve adequate yearly progress based
on state standards from previous years of statewide assessment. The third grade teachers
responded to questions from an initial construction of the Teacher Perceptions and Beliefs
Survey (Appendix E). This initial survey (Appendix E) was first reviewed by the Internal
Review Board and school district prior to distribution to the Delphi study participants. Changes
60
were made to the survey based on the responses and comments from the third grade teacher
participants. Table 5 includes specific information of the Delphi study participants.
Teacher 1 Sch.1/3rd Female White 2 years Bachelors Elementary
Teacher 2 Sch.1/3rd Female White 13 years Bachelors Elementary
Teacher 3 Sch.1/3rd Female White 17 years Masters Elementary
Teacher 4 Sch.1/3rd Female White 5 years Bachelors Elementary
Teacher 5 Sch.1/3rd Female Hispanic 5 years Masters Elementaty/ESOL
Teacher 6 Sch.1/3rd Female Multi. 10 years Masters Elementary/ESE
Teacher 7 Sch.1/3rd Female White 15 years Bachelors Elementary/Hist.
Teacher 8 Sch.1/3rd Female White 7 years Bachelors Elementary
Teacher 9 Sch.1/3rd Female White 10 years Bachelors Elementary
Selection of these teachers was based on their current placement in an elementary third
grade classroom setting, their role as general education instructors providing preparation for the
FCAT, and a student population which includes students with learning disabilities. The
construction of the survey was based on literature of statewide assessment studies (DeSimone &
Parmar, 2006; Woodfolk & Hoy, 1990). Questions from the survey were derived from some of
the questions used in a prior study analyzing teachers’ beliefs about inclusion in middle school
math. Frankel and Wallen (2003) state that a way to check validity is to use a second instrument
to measure the same variable. Judgment of knowledgeable persons serves as a second
61
instrument. A Delphi study was used in this study as this form of survey research systematically
solicits opinions from an expert panel on a particular topic (Dinnebeil, McInerney, & Hale,
2006). The Delphi study enabled the researcher to determine common and divergent
perspectives among the nine teachers who participated in the study. The purpose of the Delphi
study was to understand how representatives teaching reading to third grade students perceived
the teacher perceptions and beliefs involved in statewide assessment and students with learning
disabilities and determine if these perceptions were accurately contained in the survey.
The Delphi study analysis indicated minor changes in syntax, spelling, and grammatical
errors. Reactions to the survey’s effectiveness yielded positive feedback for content, format, and
presentation. The final version of the Teachers Perceptions and Beliefs Survey (Appendix A)
was formulated based on the comments and responses from the teachers in the Delphi study.
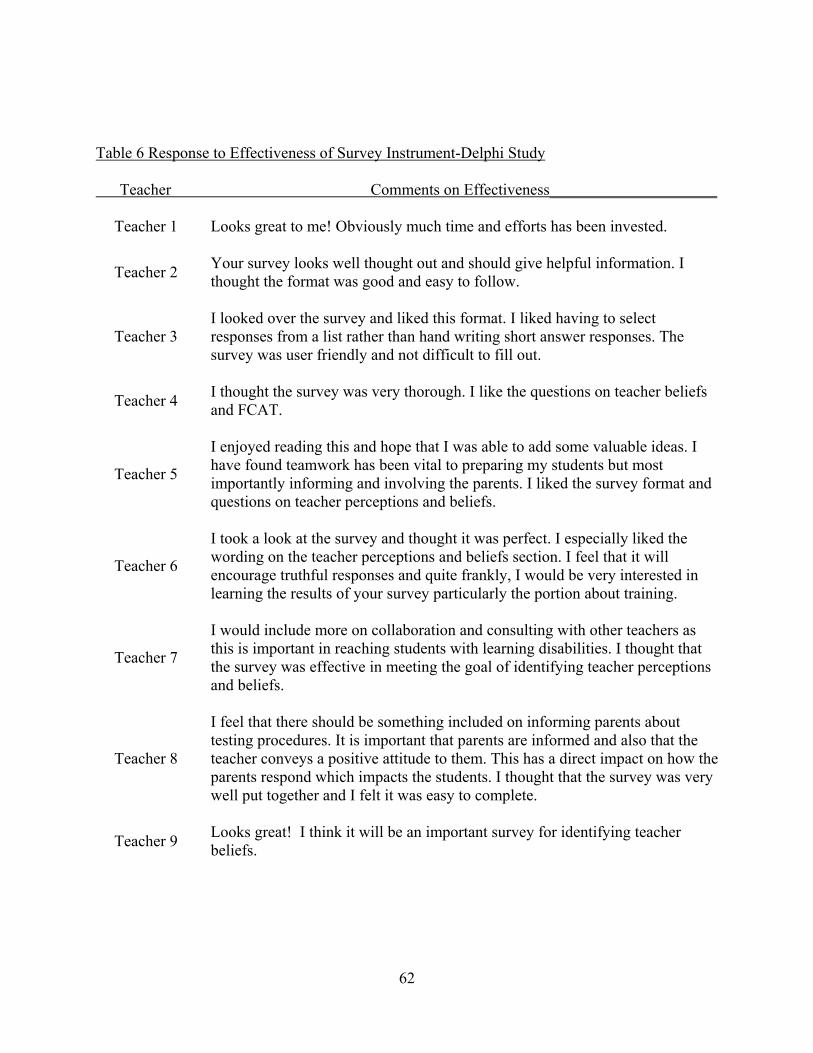
Delphi participant responses and overview of the Teachers Perceptions and Beliefs Survey were
indicated in Table 6.
62
Table 6 Response to Effectiveness of Survey Instrument-Delphi Study
Teacher Comments on Effectiveness_____________________
Teacher 1 Looks great to me! Obviously much time and efforts has been invested.
Teacher 2 Your survey looks well thought out and should give helpful information. I thought the format was good and easy to follow.
Teacher 3 I looked over the survey and liked this format. I liked having to select responses from a list rather than hand writing short answer responses. The survey was user friendly and not difficult to fill out.
Teacher 4 I thought the survey was very thorough. I like the questions on teacher beliefs and FCAT.
Teacher 5
I enjoyed reading this and hope that I was able to add some valuable ideas. I have found teamwork has been vital to preparing my students but most importantly informing and involving the parents. I liked the survey format and questions on teacher perceptions and beliefs.
Teacher 6
I took a look at the survey and thought it was perfect. I especially liked the wording on the teacher perceptions and beliefs section. I feel that it will encourage truthful responses and quite frankly, I would be very interested in learning the results of your survey particularly the portion about training.
Teacher 7
I would include more on collaboration and consulting with other teachers as this is important in reaching students with learning disabilities. I thought that the survey was effective in meeting the goal of identifying teacher perceptions and beliefs.
Teacher 8
I feel that there should be something included on informing parents about testing procedures. It is important that parents are informed and also that the teacher conveys a positive attitude to them. This has a direct impact on how the parents respond which impacts the students. I thought that the survey was very well put together and I felt it was easy to complete.
Teacher 9 Looks great! I think it will be an important survey for identifying teacher beliefs.
63
Responses from the Delphi study indicated that nine teachers felt that the survey was an
effective inquiry of teacher perceptions and beliefs. Delphi study participants indicated minor
syntax changes as described in Chapter 3. Changes were made prior to final survey distribution,
as demonstrated in comparing Appendix A and Appendix E. The study researcher chose not to
act upon the suggestion of parental inquiry as it is felt that this additional inquiry would need an
entire study devoted to parental involvement and FCAT.
The Delphi study participants are recruited for their expertise related to a particular topic
to ensure validity for items contained in the study. In this study, teachers were chosen based on
their expertise in facilitating the FCAT to third grade students, including students with learning
disabilities. The first distribution of the Delphi survey was provided to Delphi participants. The
participants were asked to rate the contents of the survey within 2 weeks. Responses and
comments were collected and participants were asked to rate items in each section of the survey
(Perceptions and Beliefs, Teacher Demographics, School Demographics, Students
Demographics). Consistency in ratings was defined as having 80% or more panelists rating each
subsection the same. Delphi panelists required two iterations to attain the desired level of
consensus.
Perceptions and Beliefs
The teachers’ perception and beliefs section of the Teacher Perception and Beliefs Survey
was developed from a literature review and was modified based on the responses from Delphi
study participants. Questions on this section of the survey are scored on a 6-point Likert scale
that ranged from strongly disagree to strongly agree. Twelve questions in the survey specifically
addressed beliefs and perceptions of special education teachers toward students with learning
64
disabilities. The following 17 questions addressed the beliefs and perceptions of special
education teachers toward students with learning disabilities and statewide assessment.
DeSimone and Parmar (2006) included statements on beliefs about inclusion and students with
learning disabilities. Woolfork and Hoy (1990) examined the structure and meaning of teacher
efficacy related to beliefs about motivation. Teacher efficacy was thought to have a positive
effect on student achievement.
DeSimone and Parmer (2006) developed the Survey on Teaching Mathematics to
Students with Learning Disabilities in Middle School. A sample item from this study was
“Students with learning disabilities should be afforded every opportunity to learn math with
general ed students.” A sample item from the Teacher Perception and Beliefs Survey was
restated as “Students with learning disabilities should be given every opportunity to learn reading
with general ed students.” The sample item was changed to accommodate the focus and
direction of the study. In the study by Woolfork and Hoy (1990) the sample given was “When a
student is having difficulty with a classroom assignment, I am usually able to adjust it to match
his/her ability level.” A related sample question from the Teachers Perceptions and Beliefs
survey was “I modify the curriculum in my classroom to match state standards.” The change
occurred to focus on adherence to state standards. Internal consistency for the scores of the
Perceptions and Beliefs section of the survey was determined by Cronbach’s alpha (12 items,
alpha= .71) for Group A and (12 items, alpha=.59) for Group B in the Beliefs toward students
with learning disabilities subsection. In the statewide assessment subsection internal consistency
as determined by Cronbach’s alpha was (17 items, alpha=.76) for Group A and (17 items,
alpha=.59) for Group B.
65
Teacher Demographics
The first three sections of the survey instrument include information on teacher, school,
and student information. Teacher demographics questions were developed from meetings with
participants in the Delphi study and review of surveys used to obtain teacher demographics.
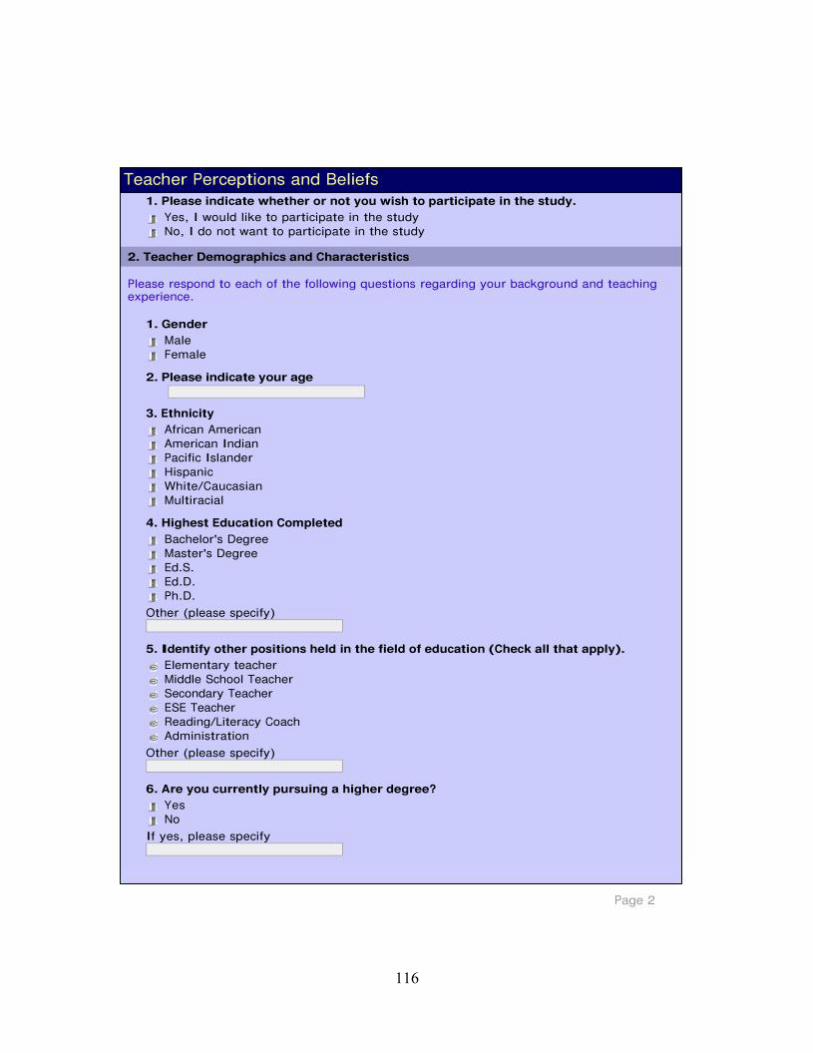
Questions used in this part of the survey included questions on age, gender, ethnicity, years in
teaching, years teaching special education, years teaching in their present position, degree
earned, positions in education, teaching in field, and continuing education. Responses to these
questions were intended to be easy to answer.
A sample of the questions used in this subsection of the survey “Are you currently
pursuing a higher degree?” was an example of the researcher’s interest in educational plans for
teachers participating in the Teacher Perceptions and Beliefs Survey. Other sample questions of
interest for the researcher were the education completed by the teachers, “Highest Education
Completed” and numbers of years employed in an instructional position. The study researcher
was interested in finding out what type of background the special education teacher participants
had and whether education, experience, age, or former jobs had on student achievement.
Specific to need for special education teacher, the researcher wanted to investigate whether a
teacher’s background or education level was a factor in the outcome for student achievement.
A reliability analysis for the Teacher Demographics subscale for the Teacher Perceptions and
Beliefs survey was Group A special education teachers (12 items, alpha=.73) and for Group B
special education teachers (12 items, alpha =.68).
66
School Demographics
In the school demographics section, information on school size, school location,
percentage of minority students, students who receive free and reduced lunch, school staff,
service delivery models, professional development in co-teaching and collaboration, and reading
programs were investigated. There were eight questions in this section in the form of multiple
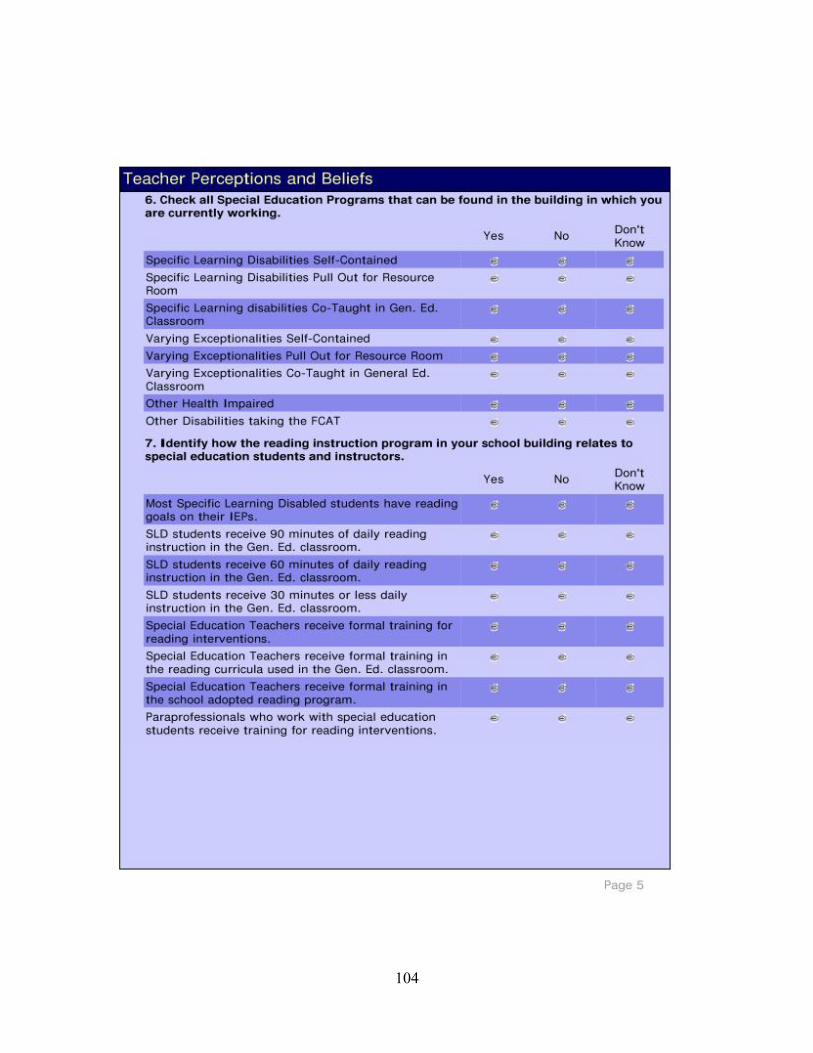
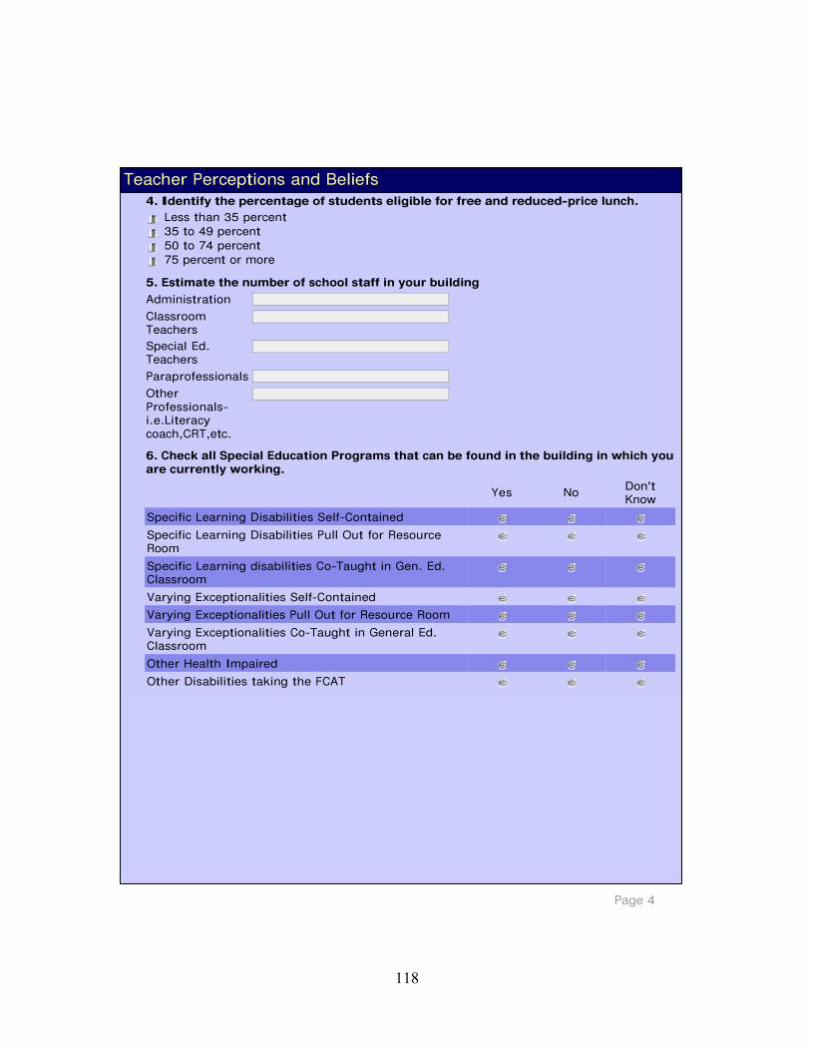
choice and short numeric answer. Service delivery models were a focus in the study as the
frequency with which students with learning disabilities are educated alongside their non
disabled peers in general education classrooms has increased considerably (Cook, Cameron, &
Tankersley, 2007). A sample of questions related to service delivery models included “Check all
Special Education Programs that can be found in the building in which you are currently
working.” Responses to these questions included choices for the type of classrooms found in
elementary schools, such as resource room/ pull out programs, self-contained programs, and co-
taught classrooms.
The study researcher was interested in whether the type and amount of professional
development makes a difference in student achievement. Professional development of special
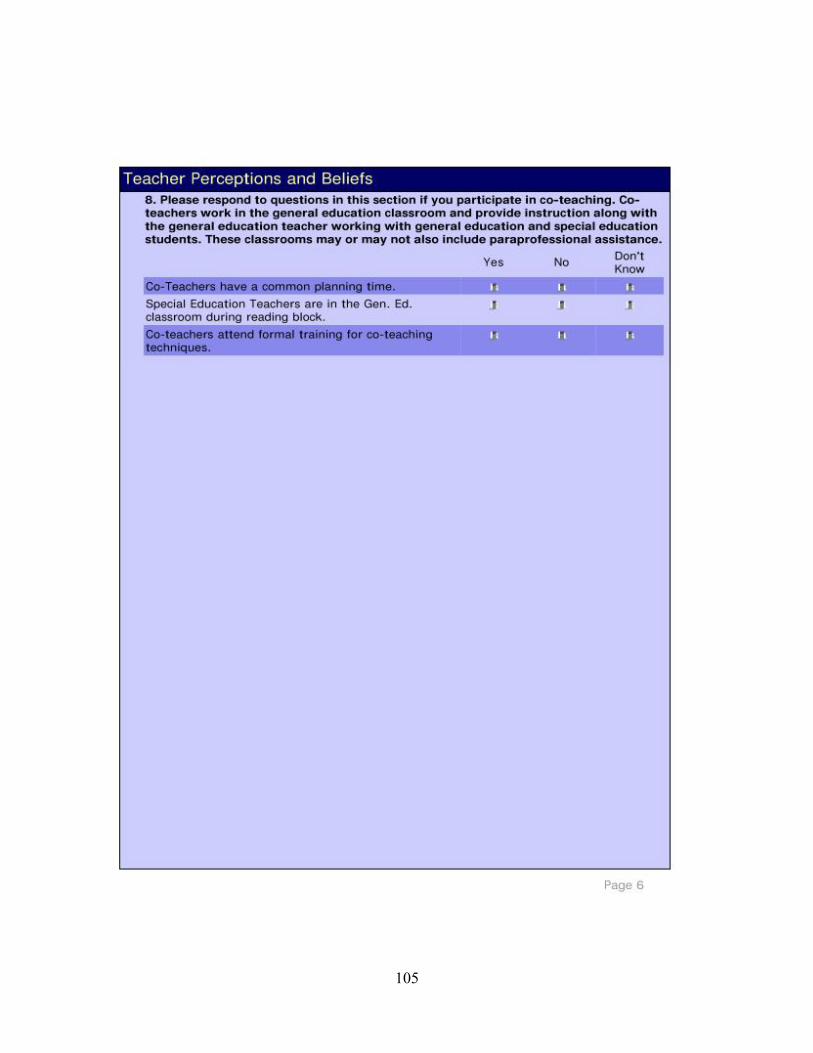
education teachers was specifically addressed in questions on co-teaching and collaboration. A
sample of an item in the School Demographics subsection on co-teaching and collaboration was
“Co-teachers work in the general education classroom and provide instruction along with the
general education teacher working with general education and special education students.”
“Do co-teachers attend formal training for co-teaching preparation?” School characteristics in the areas of school location, school size, minority enrollment,
and free and reduced lunch were categorized using data percentages from the National Center for
67
educational Studies, 2001. The researcher was interested in the demographics of these groups
and whether or not differences in school location, minority students, and free and reduced lunch
were related to student achievement. Internal consistency for the scores of the School
Demographics section of the survey was determined by Cronbach’s alpha (3 items, alpha= .84)
for Group A and (3 items, alpha=.78) for Group B for school location, free and reduced lunch,
minority students. For the remaining variables, school staff, special education programs,
professional development, Cronbach’s alpha for Group A (5 items, alpha =.89) and for Group B
(5 items= .84).
Student Demographics
Student Demographics included student gender, percentage of ethnicity, transient
students, and type of disabilities. There were four questions all involving short answer numeric
reporting. The questions were developed based on the researcher’s experience with students in
exceptional education and identifying categories of students with disabilities.
A sample of questions in the Student demographics subsection includes questions on
gender, “Indicate the number of children (male and female) currently in your classroom”, and
transient students, “Identify the number of children in your class who have recently changed
schools”. Questions in the Student Demographics section focused on the type of students who
comprised the special education teacher classrooms, their disabilities, and students who are
transient. The researcher wanted to identify differences in these variables that may indicate areas
that impact the outcome for student achievement. Consensus for the Teacher Demographics
subscale was 80% in the Delphi study. Internal consistency for the scores of the Perceptions and
Beliefs subsection of the survey was determined by Cronbach’s alpha in subsection on gender
68
and and ethnicity (2 items, alpha= .89) for Group A and (4 items, alpha=.72) for Group B.
Cronbach’s alpha for Group A (2 items, alpha=.78) and Group B (2 items, .74) for subsection on
transient students and disabilities.
Results of Survey Instrument Development
The Teachers Perceptions and Beliefs Survey was developed based on literature
(DeSimone & Parmar, 2006; Woodfolk & Hoy, 1990) from prior surveys which investigated
teacher perceptions and beliefs and also included variables for school demographics, student
demographics, and teacher demographics. The initial three sections of the survey addressed
demographics of teachers, schools, and students and were comprised of questions in the form of
multiple choice, short answer, and open ended responses. The final two sections of the survey
involved teacher perceptions and beliefs of students with learning disabilities and statewide
assessment. These two sections used a Likert Scale to measure responses. The scale consisted of:
Disagree, and SA-Strongly Agree. Results in the form of Response Percents were collected. To
obtain reliability and validity for the survey instrument a Delphi study was conducted. Specific
changes, eliminations and additions were collected and summarized in Table 6.
69
Teacher 1 Page 1 Spacing Initial Question On participation “Currently” in Initial
statement page 7
Teacher 2 Typo page 8 (Society)
Initial Statement on participation
None
Teacher 3 Typo page 8 (Society)
None None
Teacher 4 Typo page 8 (society)
None None
Teacher 5 Page 1 Format/Spacing
None “Currently” in Initial statement page 7
Teacher 6 Typo page 8 (society)
None None
Teacher 7 Typo page 8 (society)
Initial Statement on participation “Currently” in Initial
statement page 7
Teacher 8 None None “Currently” in Initial statement page 7
Teacher 9 Typo page 8 (society)
Initial Statement on participation None
Changes were made based on the content and formatting as indicated from the teacher
input. Comments were made as to the reaction to the questions in the survey and will be
reviewed in detail in Chapter 4. The specific changes to the questions are addressed in Table 7.
Table 7 Delphi Study Feedback
Teacher Changes Eliminations Additions _________
70
Table 8 Delphi Study Question Summation
Question Delphi Study Final Revision
Page 2 Question 1
Please indicate whether or not to participate in the study
__Yes __No
Question was deleted
Page 7 1st Direction Statement
The following questions are about the students in your classroom.
The following questions are about the students currently in your classroom.
Page 8 Question 1
SLD will have a better chance in sociey learning reading in inclusive classrooms than resource rooms.
SLD will have a better chance in society learning reading in inclusive classrooms than resource rooms.
Data Collection
Quantitative data were gathered in this study. Data collected in quantitative research are
in the form of numbers and measurements (Fraenkel & Wallen, 2003). The first sources of data
collection was obtained from the Florida Department of Education’s website indicating the
results of the reading section of third grade students with learning disabilities from the Florida
Comprehensive Achievement Test (FCAT) of 2007. Test results were comparative descriptive
statistics used to describe test scores (Gay & Airasian, 1995). Seventy-six elementary schools in
a school district in central Florida were invited to take part in the study.
The next source of data collection was an online survey distributed to the special
education teachers from the sixty-six remaining elementary schools invited to take part in this
study. The survey was composed of four sections: teacher demographics, school demographics,
student demographics, and teacher perceptions and beliefs toward statewide assessments. A
descriptive comparison of results identified possible differences in demographics and perceptions
71
of special education teachers and the outcomes of the students with disabilities on the reading
portion of the FCAT. The results of these questions was analyzed and categorized by: teacher
perceptions and beliefs toward statewide assessment, teachers’ demographics, school
demographics, and student demographics.
Data were collected from two sources:
1. The Florida Department of Education (FDOE) website reporting on 2007 FCAT
reading test results of third grade students with learning disabilities from an urban school district
in central Florida. The ESE teachers were categorized based on the outcomes of the students
with disabilities test scores on the 2007 FCAT. Student outcomes refer to whether or not the
student was able to pass the reading portion of the FCAT by achieving a level 2 or higher.
2. The teacher perceptions and beliefs survey given to special education teachers
including teacher, school, and student demographics, and teacher perceptions and beliefs of
student achievement on statewide assessments.
Data Analysis
This study involved two stages of data analysis: data collected from the Florida
Department of Education website and distribution and analysis of a survey instrument. Results of
the survey instrument were analyzed to determine differences in the present educational settings.
FCAT
Data from the Florida Department of Education (FDOE) 2007 website were analyzed to
determine special education classrooms of students with learning disabilities who passed the
reading portion of the FCAT. The 2007 reading FCAT scores of third grade students with
72
learning disabilities were obtained. The reliability and validity was determined by researching
FCAT reading scores as reported on the FDOE website.
Data from the FCAT website (FDOE, 2006) were analyzed from the previous year for
reliability and validity. Reliability for the FCAT is measured by different methods. The higher
index value, the greater the test reliability. Reliability indices were above .90 which indicates
that the tests are reliable (FDOE, 2006). The FCAT test has content validity (FDOE, 2006).
According to the FDOE, the content validity is determined by those who are most acquainted
with student expectations at the given level. The FDOE (2006) also states that there is evidence
of concurrent validity as the FCAT is correlated with other tests that measures students in the
same content area.
Seventy-six elementary schools in a district in central Florida were invited to take part in
the study. In order to determine passing levels of the Reading FCAT-SSS, the mean FCAT- SSS
for third grade standard curriculum students (non-ESE students) was identified, based on the
information obtained from the Florida Department of Education website for test results of the
2007 reading FCAT. Florida Department of Education reported the standard error of
measurement (SEM) for the function of Reading FCAT-SSS scores.
Table 9 is an example of the group demographic categories that allows retrieval of
information from the Florida Department of Education website (FDOE, 2007). Elementary
Schools from a school district in central Florida were selected and FCAT results were analyzed.
Students with learning disabilities were identified from each school and a percentage that passed
the FCAT was indicated.
73
Table 9 FDOE School Demographics
Elementary School in central Florida 3 133 1543 340 10 26 86 White 102 1589 348 5 22 91 Black 18 1361 310 22 33 67 Hispanic 8 * * * * * Asian/Pacific Islander 3 * * * * * Multiracial/Ethnic 2 * * * * * Female 67 1522 337 9 30 87 Male 66 1565 344 11 21 85 Free/Reduced Lunch 23 1266 294 26 39 61 Not Free/Reduced Lunch 110 1601 350 6 23 91 All ESE Other Than Gifted 37 1339 306 11 35 73 Not ESE Plus Gifted 96 1622 353 9 22 91 Speech Impaired (F) 3 * * * * * Emotionally Handicapped (J) 1 * * * * * Specific Learning Disabled(K) 31 1320 303 13 29 68** Gifted (L) 19 1977 412 0 0 100 Autistic (P) 2 * * * * *
**The last column across from the Specific Learning Disabilities category indicates the percentage of students who were successful in passing the FCAT in 2007 from this particular school district in central Florida.
Teachers’ Perceptions and Beliefs Questionnaire
Data were analyzed using the t test and comparison of means to determine if two means
were significantly different at a selected (less than .05) probability level (Gay & Airasian, 2003).
Gay and Airasian (2003) stated that the t test makes adjustments for small sample size when
determining significance. As the sample size was relatively small and the research questions
addressed differences, the researcher felt it was appropriate to use the t test to identify significant
difference among the two groups of teachers in the Teachers Perceptions and Beliefs section of
the Survey.
The t test for independent samples was selected as members of one sample were not
related to the other sample in any systematic way other than being selected from the same
population (Gay & Airasian, 2003). The t tests for independent samples were used to determine
significant difference between the two means of two independent samples (Gay & Airasian,
74
2003). SPSS 14.0 was used to compare means in the t test for independent samples. The
independent variables from the survey are the teacher perceptions and beliefs. The behavior in
this study is the dependent variable or statewide assessment outcomes. Dependent variables are
the change in behavior that occurs as a result of the independent variable, also referred to as the
outcome (Gay & Airasian, 2003). Statistically significant differences of the independent
variables of teacher perceptions and beliefs are reviewed from this analysis in Chapter 4 of this
study. Demographics data were analyzed using comparison of means and nominal statistics.
Pearson Chi Square rests were performed on categorical data in the demographics sections of the
survey to determine statistically significant differences among the teacher participants in the
study. Results of the Pearson Chi Square tests were presented in Chapter 4 as a supplemental
analysis.
Assumptions were made as the effect size was .33 which produces a relatively small
effect. The effect size was determine by calculating the absolute value of the mean difference
between Group A and Group B for the mean scale score for the 2007 FCAT divided by the
standard deviation for district scores for all students with learning disabilities. In a study on the
Tennessee Class size experiment provide the most compelling evidence on the effects of class
size on student achievement (Nye, Hedges, and Konstantopoulos, 1999). Students from grades
K-3 spent time in either small (13-17 students or large classes (22-26 students). Follow up data
from this study made it possible to measure performance in reading, mathematics, and science
and made it possible to measure when these K-3 students were in grades 4. 6. and 8. “the average
effect of small classes was statistically significant and positive for both mathematics and reading
achievement at every grade level, ranging from 0.11 to 0.20 standard deviation units. The small
75
class effect was positive for science achievement at all grades (ranging from 0.10 to 0.17
standard deviation units) and statistically significant for both Grades 6 and 8..………. there was
no evidence that small effects varied across schools” (p. 132).
Orlich (2003) conducted a longitudinal study to examine the effect on Washington
Assessment of Student Learning (WASL) on Student Achievement. Scale scores were compared
in 1998 and 2001 showing a small effect size. However, over a four year period a small effect
size does emerge. As a result of these findings a program was initiated in 2001 called the
“School Improvement Specialist” program. As of 2003, no independent evaluation of the effects
of this multi-million dollar program had yet been conducted (Orlich).
Cohen (1988) stated that .2 is the threshold for the smallest standardized difference in a
mean. Sample size required that one of the groups consist of only ten members as this was the
maximum identified participants in the group of special education teachers that were able to meet
the criteria of successful test outcomes on the FCAT. A power analysis was performed based on
FCAT 2007 results from the means scale scores collected for the schools and participants in the
study. Differences in the means for each were calculated and effect size was determined. Power
analysis on test was determined to be .70 when effect size, one-tailed significance and sample
size were considered.
76
CHAPTER FOUR: RESULTS
Overview of Data Analysis
The purpose of the study was to investigate whether special education teachers’
perceptions and beliefs were related to their students’ FCAT achievement. In following research
questions guided the inquiry for the study:
1. What differences in teacher perceptions and beliefs toward statewide
assessments are present among teachers of students with learning disabilities?
2. What differences in professional development and service delivery models are present
in these settings in which there were differences in teacher perceptions and beliefs toward
statewide assessments?
To investigate the difference between special education teachers whose students with
learning disabilities were and were not able to pass the reading portion of the 2007 FCAT,
variables in teacher demographics (Appendix I), school demographics (Appendix J), student
demographics (Appendix K), teacher perceptions and beliefs of beliefs toward students with
learning disabilities(Appendix L), and teacher perceptions and beliefs toward statewide
assessment (Appendix M) were analyzed. This chapter represents the results of these analyses for
the sample of teachers (Group A) of students with learning disabilities whose students passed the
FCAT (57% or more), and then extend the sample to teachers (Group B) of students with
learning disabilities whose students did not pass the FCAT (39% or less) and determine whether
special education teachers’ perceptions and beliefs were related to their students’ FCAT
achievement.
77
Descriptive Statistics
Descriptive Statistics for demographic variables were reported in Table 2 in the previous
chapter for teacher study participants (Group A and Group B). The sample was typical for
elementary school teachers: predominantly white and female, with a small percentage of
minority representation in African American, Multiracial, and Hispanic ethnicity. Descriptive
Statistics for demographic variables were reported in Table 3 for students who are in the
classrooms of these participants. Once special education teachers were intentionally divided into
groups based on criteria derived from FCAT results, differences in demographic variables and
teacher perceptions and beliefs emerged. Means and standard deviations by group for Group A
and Group B special education teachers in subsections: Professional Development (Table 11) and
Service Delivery Models (Table 11), Participant Demographics (Table 10), and Student
Demographics (Table 12) are reported. T tests, means, standard deviation, and statistically
significant differences are reported in Table 13 for Perceptions and Beliefs toward students with
learning disabilities and statewide assessment. The study researcher’s intent was to focus on
teacher perceptions and beliefs when students with learning disabilities are included in statewide
assessment; however, differences in demographic variables among the groups emerged. To
address these differences, the study researcher performed supplemental analysis to test for
statistically significant differences using Pearson Chi square tests for categorical variables and t
tests for ratio variables.
Supplemental Analysis
A supplemental analysis was conducted to look at possible differences in beliefs due to
demographic variables. Independent samples t tests were conducted on ratio values, such as,
78
age, years of experience in teacher demographics, to determine statistically significance
differences. Chi square tests were conducted to investigate group differences in categorical
variables, such as, ethnicity and location. Specific variables are described in the following
sections for teacher participant, student, and school demographics.
Teacher Participant Demographics
Teacher participants for the study consisted of a total of 64 special education teachers, ten
from Group A and fifty four from Group B, who worked with and prepared third grade students
with specific learning disabilities for the 2007 FCAT. The ten teachers in Group A were
identified from the FDOE Website. The teachers in Group A had a majority of students (57% or
more) score a Level 2 or above on the reading portion of the FCAT. Response percents were
collected and analyzed (Appendix I). Group A consisted of ten female teachers (100%). Ninety
percent of the teachers were White/Caucasian and 10% were African American. The mean age in
Group A was 37 years. Ninety three percent of the teachers were teaching in field (in the field of
special education) and 89% received their education certification at a 4 year college. Group B
consisted of fifty four special education who participated in the survey. Group B consisted of
fifty three females (94%) and one male (6%). Eighty-six percent of the participants were
White/Caucasian, 10% were Hispanic, and 4% were African American. The mean age in Group
B was 40 years. Ninety percent of teachers in Group B were teaching in field (in the field of
special education) and 83% received their education certification at a 4 year college. Seventy
nine percent (Group B) worked under the title of Varying Exceptionalities Teacher.
Seventy-six schools were contacted and asked to participate. Special education teachers
in sixty-four schools agreed to participate in the study. The rate of return was 84% as sixty-four
79
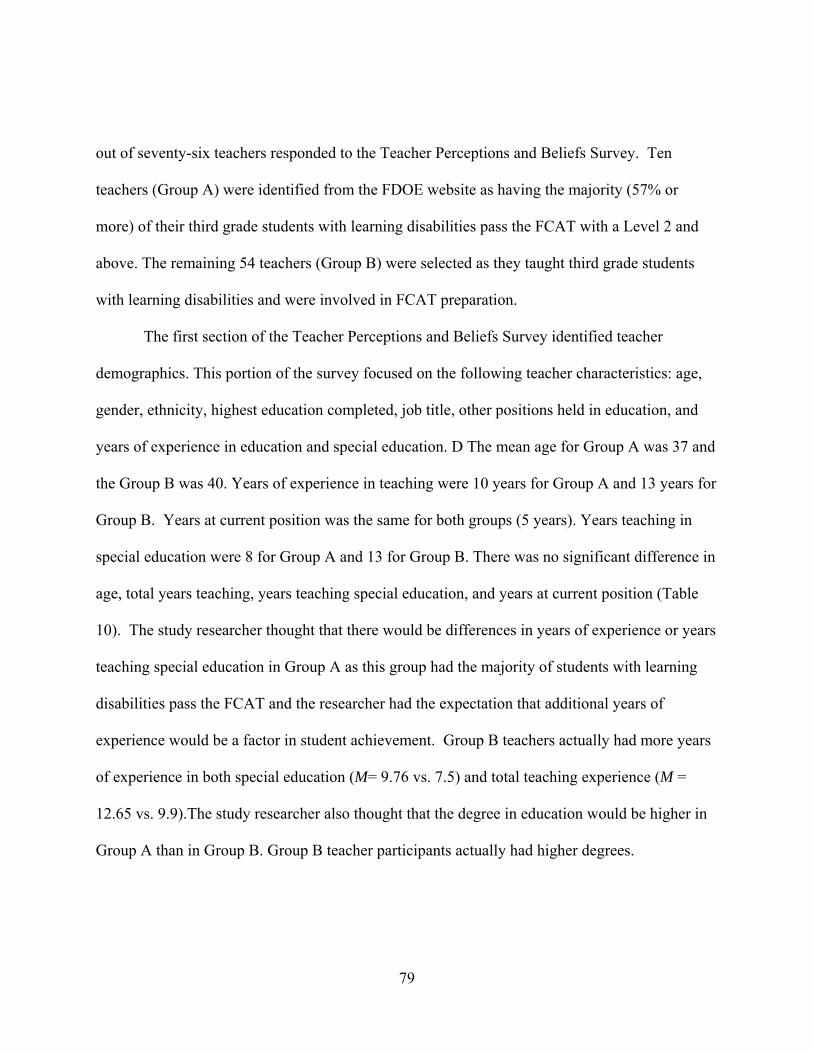
out of seventy-six teachers responded to the Teacher Perceptions and Beliefs Survey. Ten
teachers (Group A) were identified from the FDOE website as having the majority (57% or
more) of their third grade students with learning disabilities pass the FCAT with a Level 2 and
above. The remaining 54 teachers (Group B) were selected as they taught third grade students
with learning disabilities and were involved in FCAT preparation.
The first section of the Teacher Perceptions and Beliefs Survey identified teacher
demographics. This portion of the survey focused on the following teacher characteristics: age,
gender, ethnicity, highest education completed, job title, other positions held in education, and
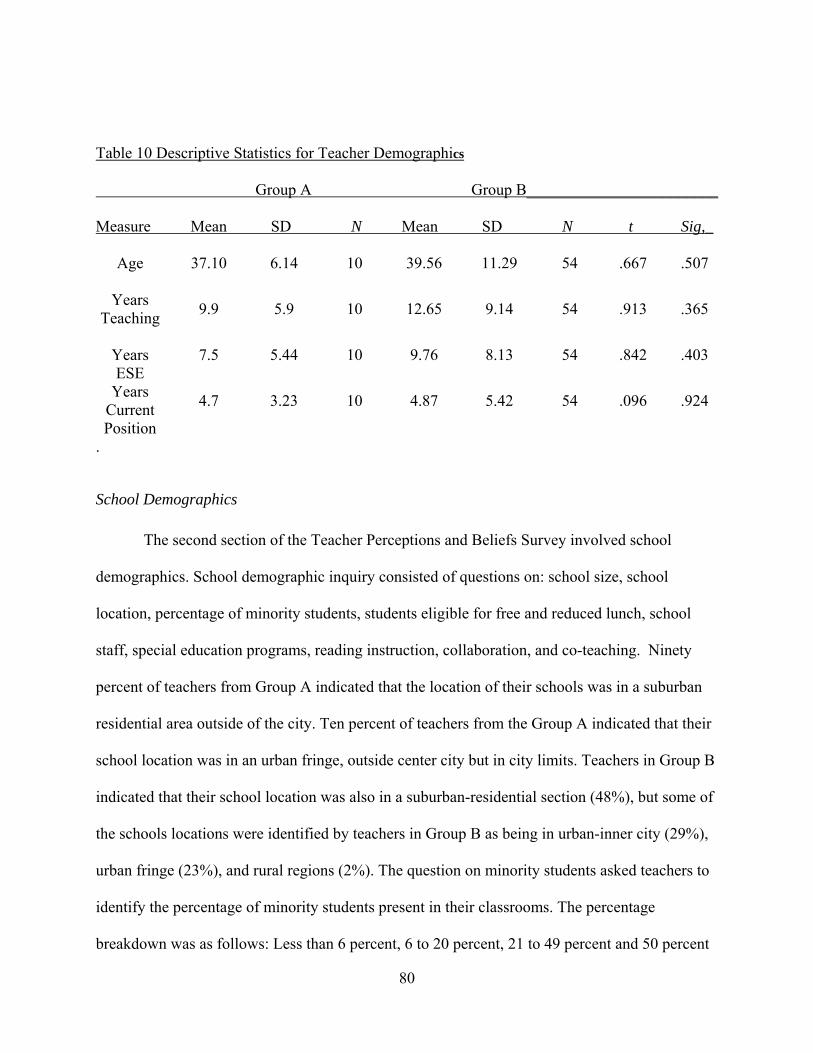
years of experience in education and special education. D The mean age for Group A was 37 and
the Group B was 40. Years of experience in teaching were 10 years for Group A and 13 years for
Group B. Years at current position was the same for both groups (5 years). Years teaching in
special education were 8 for Group A and 13 for Group B. There was no significant difference in
age, total years teaching, years teaching special education, and years at current position (Table
10). The study researcher thought that there would be differences in years of experience or years
teaching special education in Group A as this group had the majority of students with learning
disabilities pass the FCAT and the researcher had the expectation that additional years of
experience would be a factor in student achievement. Group B teachers actually had more years
of experience in both special education (M= 9.76 vs. 7.5) and total teaching experience (M =
12.65 vs. 9.9).The study researcher also thought that the degree in education would be higher in
Group A than in Group B. Group B teacher participants actually had higher degrees.
80
.
School Demographics
The second section of the Teacher Perceptions and Beliefs Survey involved school
demographics. School demographic inquiry consisted of questions on: school size, school
location, percentage of minority students, students eligible for free and reduced lunch, school
staff, special education programs, reading instruction, collaboration, and co-teaching. Ninety
percent of teachers from Group A indicated that the location of their schools was in a suburban
residential area outside of the city. Ten percent of teachers from the Group A indicated that their
school location was in an urban fringe, outside center city but in city limits. Teachers in Group B
indicated that their school location was also in a suburban-residential section (48%), but some of
the schools locations were identified by teachers in Group B as being in urban-inner city (29%),
urban fringe (23%), and rural regions (2%). The question on minority students asked teachers to
identify the percentage of minority students present in their classrooms. The percentage
breakdown was as follows: Less than 6 percent, 6 to 20 percent, 21 to 49 percent and 50 percent
Table 10 Descriptive Statistics for Teacher Demographics
Group A Group B________________________
Measure Mean SD N Mean SD N t Sig,_
Age 37.10 6.14 10 39.56 11.29 54 .667 .507
Years Teaching 9.9 5.9 10 12.65 9.14 54 .913 .365
Years ESE
7.5 5.44 10 9.76 8.13 54 .842 .403
Years Current Position
4.7 3.23 10 4.87 5.42 54 .096 .924
81
or more. Fifty percent of schools in Group B indicated that they had 50% or more minority
students in their classrooms while Group A teachers indicated that they had 10% in that same
category. A Pearson Chi square test was conducted on free and reduced lunch recipients
indicating significant group differences χ 2 (3, N=61) =13.88, p=.003. The question asked in the
survey was: “Identify the percentage of students eligible for free and reduced-price lunch in your
school”. The categories of percentages were: Less than 35 percent, 35 to 47 percent, 50 to 74
percent, and 75 percent or more. Teacher from Group B identified 45% of students were in the
75% or more category for free and reduced lunch reception, while teachers in Group A students
identified 0% of students in that same category (Appendix J).
The researcher was interested in two other demographic variables in the section on school
demographics. The researcher expected a larger number of minority students in Group B. A
Person Chi square test was conducted χ 2 (3, N=59) =16.02, p=.001 indicating significant group
differences. Group B had a greater amount of minority students particularly in the category of
50% or more minority students per classroom as 26 teachers in Group B chose this category
compared to none of the teachers in Group A.
82
Table 11 Descriptive Statistics for School Demographics
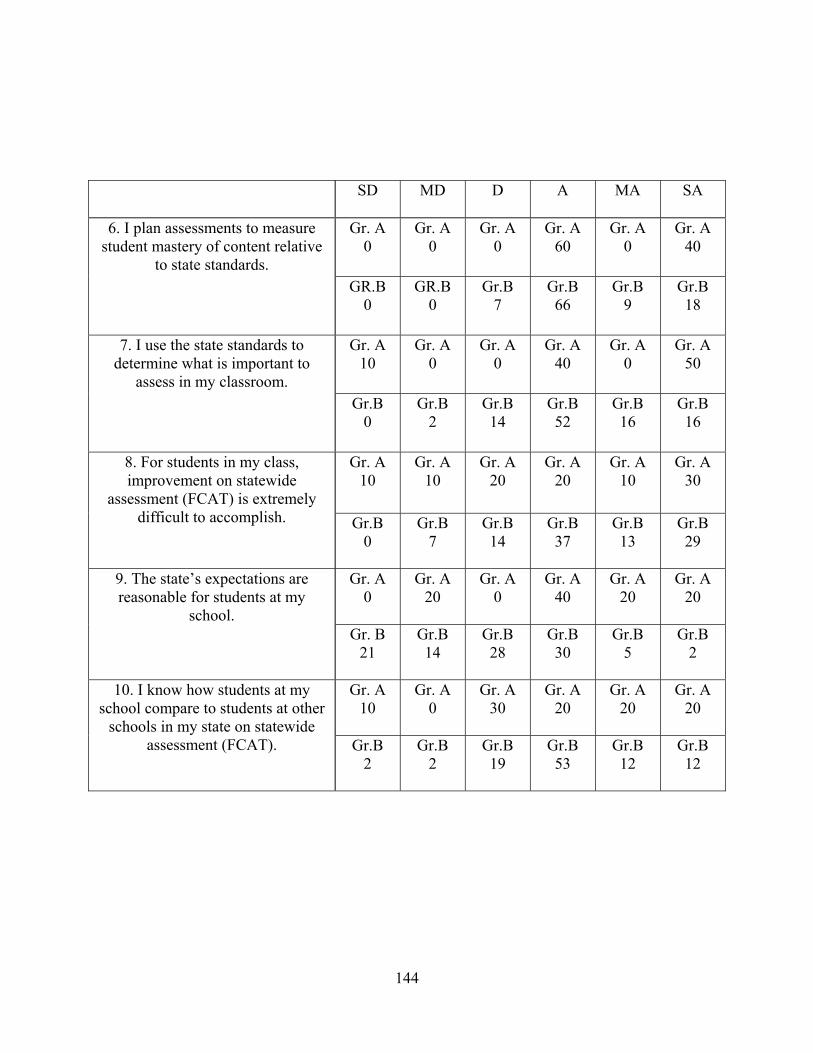
______________________________________________________________________________Beliefs =Special Education Teachers Beliefs toward students with learning disabilities SWAS =Special Education Teacher Beliefs toward Statewide Assessment Independent samples t tests were conducted on the Perception and Beliefs subsection on
statewide assessment to check for significant group differences among special education teachers
in Group A and Group B. Group A was hypothesized to differ significantly and positively with
mean responses in perceptions and beliefs as these teachers were successful in having the
majority of their students with learning disabilities pass the FCAT. Group A had a higher mean
SWAS score (3.40 vs. 2.71). The null hypothesis of no differences in perceptions and beliefs of
statewide assessments between groups was rejected. Means were shown to have significant
differences in the responses between Group A and Group B in perceptions and beliefs for the
subsection on teacher beliefs in statewide assessment and students with learning disabilities t
(62) =2.09, p = .0205. The effect size of .79 was in the expected direction. This represents a
large effect size according to Cohen’s criteria. Therefore, participants in Group A responded in a
more positive manner to achievement of students with learning disabilities on statewide
assessment than did participants in Group B.
86
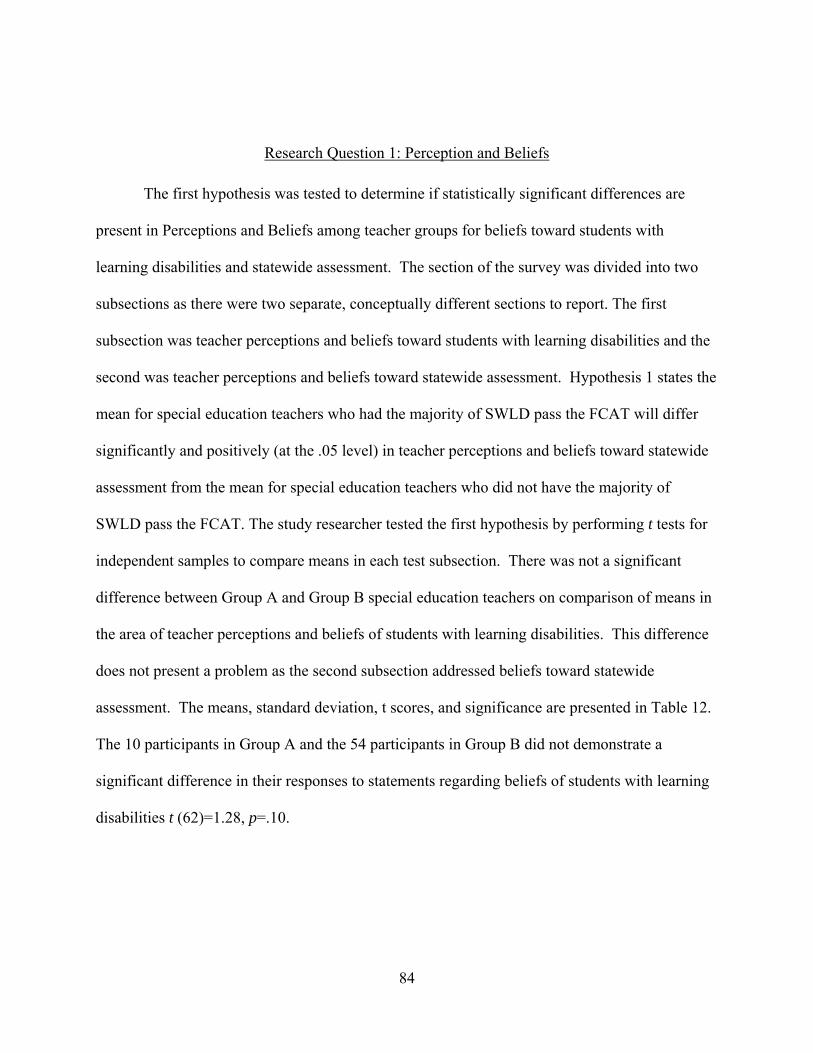
Research Question 2: Professional Development and Service Delivery Model
The second hypothesis states that the mean score for special education teachers who had
the majority of SWLD pass the FCAT will differ significantly and positively (at the .05 level) in
the amount of professional development received from the mean score for special education
teachers who did not have the majority of SWLD pass the FCAT. The study researcher tested the
hypothesis for Question 2 by performing a supplemental analysis to look at possible differences
in beliefs due to demographic values for hypothesis 2 and 3. For Hypothesis 2, the study
researcher expected that professional development in Group A were different and positive in
regards to the amount of professional development received. A Pearson Chi-Square test was
conducted χ 2 (2, N=44) =6.35, p=.021. The effect size of .35 was in the expected direction.
According to Cohen’s criteria, the size of .35 can be considered a medium effect. The Pearson
Chi square test determined that there were both positive and significant differences among the
two groups of special education teacher for professional development in the areas of
collaboration and co-teaching with more of the teacher participants in Group A receiving training
in these areas.
Hypothesis 3 stated that the mean score for special education teachers who had the
majority of SWLD pass the FCAT will differ significantly (at the .05 level) in the type of service
delivery received from the mean score for special education teachers who did not have the
majority of SWLD pass the FCAT. For Hypothesis 3, the study researcher expected that the
service delivery model would be different among the two groups of teachers. The researcher
expected to have an increased amount of time in the general education classroom for teachers
who were successful in having their students with learning disabilities pass the reading portion of
87
the FCAT. A Pearson Chi-Square test was conducted χ 2 (1, N=60) =4.74, p=.014. An effect size
of .30 was determined. According to Cohen’s criteria, the size of .30 can be considered a
medium effect. Service delivery models differed in the areas of SLD Resource Room/Pull out
programs. The other service delivery models: self contained classrooms, co-taught classrooms,
and resource rooms were also tested for statistically significant differences. The only type of
service delivery model that differed significantly was the SLD Resource Room. The
identification of the SLD Resource Room service delivery model was expected but additional
models were expected such as VE Resource Rooms and co-taught classrooms. The study
researcher expected that an increased amount of time would be spent in general education
classrooms for students with learning disabilities for Group A as exposure to the general
education curriculum in reading would allow students an increased awareness of the type of
questions and information that is tested by the FCAT.
Summary of Research Findings
Hypothesis 1 stated that mean scores on the Teacher Perception and Beliefs Survey
would differ positively and significantly toward statewide assessment among special education
teachers. An independent samples t test was conducted to determine statistically significant
difference. T test results indicated that there were statistically significant differences among the
groups of special education teachers. Therefore, Hypothesis 1 addressing the relation between
special education teachers’ beliefs toward statewide assessment and student achievement was
supported.
Hypothesis 2 stated that mean scores would differ positively and significantly in the
amount of professional development received among the two groups of special education
88
teachers. A supplemental analysis was performed to determine possible differences in beliefs
due to demographic variables. A Pearson Chi square test was conducted to determine statistically
significant difference in professional development in the areas of collaboration and co-teaching.
The test results indicated that there were statistically significant differences among the groups of
special education teachers in professional development. Therefore, Hypothesis 2 addressing the
relation between special education teachers’ beliefs and the amount of professional development
received was supported.
Hypothesis 3 stated that the mean scores would differ in service delivery models among
the two groups of teachers who participated in the study. A supplemental analysis was again
performed to determine possible differences in beliefs due to demographic variables. A Pearson
Chi square test was also conducted to determine statistically significant difference in service
delivery models. The test results indicated that there were statistically significant differences
among the groups of special education teachers in service delivery models in the area of SLD
was supported. In addition, chi square tests were performed on percentages of minority students
and students who received free and reduced lunch and were shown to have statistically
significant difference among the two groups of teachers in the study. Implications of these
results will be discussed further in Chapter 5.
89
CHAPTER FIVE: CONCLUSION
Summary
The focus of this dissertation study was to examine teacher perceptions and beliefs of
student achievement on statewide assessment through current research on teacher beliefs toward
educational policy and standards reform. As reviewed in Chapter Two, a substantial research
base indicated that teacher perceptions and beliefs affected the outcome of statewide testing,
particularly with students who have learning disabilities (Cimbricz, 2002; Crawford & Tindal,
2006: Ysseldyke et al., 2004).With the recent emphasis placed on accountability and school
performance, especially for students with learning disabilities, research on teacher beliefs and
practices is needed for students to improve their performance was crucial. The first section of
this chapter includes the results of the survey on special education teachers’ perceptions and
beliefs toward statewide assessment. The next section describes the findings related to
professional development in the area of service delivery of instruction (resource room and co-
teaching). A supplemental analysis was performed on professional development and service
delivery model to determine significance between groups of teachers who did and did not have
students with learning disabilities successfully pass the reading portion of the FCAT. Previous
reviewed research indicated that teachers in co-taught classrooms benefited from professional
development on collaboration and providing instruction for students with learning disabilities.
The next section included service delivery models and their effect on educational outcomes.
Previous research indicated that students taught in inclusive classrooms had improved grades and
achievement scores on standardized testing.
90
Teacher Perceptions and Beliefs Survey
Statewide Assessment
The first research question investigated the differences in teacher perceptions and beliefs
toward statewide assessments present among special education teachers of students with learning
disabilities. The hypothesis tested to answer this question was supported. Special education
teachers in Group A (teachers who had the majority of their students with learning disabilities
pass the reading portion of the FCAT) had a higher mean score on the Teacher Perceptions and
Beliefs Survey regarding teacher perceptions and beliefs toward statewide assessments than
teachers in Group B (teachers who did not have the majority of their students with learning
disabilities pass the reading portion of the FCAT). This research supports the hypothesis that the
special education teachers in Group A had expectations that their students with learning
disabilities could pass the FCAT when compared to the responses of teachers in the Group B.
Thus, this study provided clear evidence that special education teachers whose students passed
the FCAT had greater positive responses to questions regarding the inclusion of students with
learning disabilities on statewide assessment.
The findings in this section indicated that teacher perceptions and beliefs do impact
student achievement. Many factors need to be considered with regard to accountability and
student achievement. This was true for all students, but specifically for students with learning
disabilities. Special education teachers are the direct support for these students and their beliefs
in student success on state assessments are vital. Students with learning disabilities respond to
teacher expectations and in this section of the study, teacher beliefs reflected the expectation that
their students could pass the FCAT. It is important that teachers who work with students with
91
learning disabilities realize the importance of their beliefs in the educational outcome of
individual students. As special education changes and becomes integrated in the general
education classroom, teachers in both special and general education need to realize and reflect on
how their beliefs impact student achievement. An excellent venue to discuss these concepts
would be in professional development programs for teachers in both special education and
general education.
Professional Development and Service Delivery Model
The second research question investigated the differences in professional development
and service delivery models present in these settings in which there were differences in teacher
perceptions and beliefs toward statewide assessments. Both hypotheses tested to answer this
question were supported. First, special education teachers in Group A who had the majority of
their students with learning disabilities pass the reading portion of the FCAT had a higher mean
score on the Teacher Perceptions and Beliefs Survey in regards to professional development.
This research question was concerned with individual questions from the Teacher Perceptions
and Beliefs Survey. To address this question, a supplemental analysis was conducted for
demographic variables for both hypotheses. The need for continued professional development
was identified in survey responses in the following sections of the survey: teacher demographics.
Thus, this study provided clear evidence that special education teachers whose students passed
the FCAT had greater positive responses to questions regarding additional time spent in
professional development. Second, special education teachers in Group A who had the majority
of their students with learning disabilities pass the reading portion of the FCAT had higher
scores on the Teacher Perceptions and Beliefs Survey in regards to service delivery model.
92
Professional development in the study was related to improved outcomes in student
achievement through collaboration and co-teaching in the general education classroom. As
education continues to change and evolve, particularly in the area of special education, teachers
need to maintain awareness in the areas of: ESE legislation, effective instruction, and teacher
beliefs toward educational outcomes. Educators need to see their role as active and involved.
Special education teachers need to spend time in and learn the general education curriculum.
They can no longer be enclosed in their own classrooms. Special education teachers need to
become involved in the school curriculum, instruction, and assessment to better meet the
academic needs of students with disabilities.
In addition, general education teachers need to realize that they are responsible for the
achievement of students with learning disabilities within their classrooms. As state
accountability systems continue to stress the importance of including students with learning
disabilities in statewide assessments, schools will need to address how service delivery models
can improve test outcomes by increasing the amount of time students with learning disabilities
spend in the general education classroom.
Limitations of the Study
An imbalanced sampling of group participants caused limited validity of response
results. The size of the sampling yielded many results that were not statistically significant. It is
believed that increasing the size of the sample would prove statistical significance in
demographics and teacher perceptions and beliefs toward students with learning disabilities.
Qualitative methodology would provide insight into teacher attitudes and beliefs. A few of the
teachers who took part in this study stated that they wanted to elaborate on their responses to the
93
statements made in the teacher perception and beliefs section of the survey. Teachers emailed
the researcher to state that they felt that there were two levels of students with learning
disabilities (higher performing and lower performing). The teachers went on to say that it was a
disservice to group both levels of learning disabilities together when taking the FCAT. One of
the limitations to this study was in its present format, only one instrument of acquiring
information about teacher perceptions was available. Future research would need to include
qualitative, as well as quantitative, research.
Implications for Practice
The findings of this survey have implications for special education teachers and their
perceptions and beliefs for students with learning disabilities. Recommendations were compiled
through the responses provided by special education teachers. These recommendations included
implications for teachers and administrators in areas that would increase the educational
outcomes for students with learning disabilities.
Recommendations for Teachers
Current research in teacher beliefs and student achievement indicated that teachers’
beliefs influence the educational experience of students with learning disabilities (Kagen, 1992).
Professional development in scientifically based instructional practices greatly impacts
educational outcomes (Ysseldyke et al., 1995). Teachers need to embrace scientifically
researched interventions and incorporate in instruction.
Recommendations for special education teachers are in the areas of professional
development and access to the general education curriculum. Responses to the survey indicated
94
a need to increase involvement in the general education curriculum and collaboration with the
general education staff. Results showed that professional development in the areas of co-
teaching and collaboration between special education and general education teachers would
provide improved awareness of the general education curriculum and increase the students’
knowledge of state standards.
Current research indicated that inclusion in general education classrooms increased
student achievement and classroom performance. Classrooms and service delivery models are
assigned to teachers; however, advocacy for the students with learning disabilities is essential.
Open communication with administration would allow teachers to discuss what types of
planning, supports, and resources are needed to make the instructional time more effective.
Recommendations for Administration
Based on the findings from the Teachers Perceptions and Beliefs Survey indications for
future professional development in the areas of co-teaching, general and special education
collaboration, and awareness of accommodations for statewide assessment would prove
beneficial for student achievement. Data from the study indicated that collaboration and
increased access to the general education curriculum provided opportunities for students with
learning disabilities to increase test scores on statewide assessment. Current research indicated
that incorporating principles of response to intervention into the classroom allowed students with
disabilities to have interventions while in the general education classroom and increase access to
the general education curriculum.
95
Further Direction for Research
Three major areas of future research emerged from this study: (a) teacher perceptions and
beliefs, (b) professional development in co-teaching and collaboration, and (c) service delivery
models.
Teacher Perceptions and Beliefs
Evidence of the impact of teacher beliefs was indicated by the response of teachers in the
select group that stated that students could pass the reading portion of the FCAT. These teachers
were aware that the majority of their students were able to pass the FCAT and this was reflected
through their responses to the Teacher Perception and Beliefs Survey. This poses the question as
to the impact their expectations had on the outcome of student achievement on statewide
assessment. Carnine and Granzin (2001) discuss the quality of educational outcomes and the
importance of setting learning expectations for students served under IDEA. Teacher
perceptions and beliefs that students with learning disabilities can pass the FCAT is a variable
that should continue to be examined and researched for future studies.
Evidence of teacher beliefs and their influence on student achievement has been an
ongoing theme throughout this study. Teachers’ beliefs are a cornerstone in all classrooms, but
especially in classrooms where reading development plays such a central role for indicating
student progress. It is the firm belief of the study researcher that teachers’ beliefs and quality of
instruction directly impacts a child’s progress. Aligning these beliefs with established known
principles under instructional interventions would prove to be a powerful link.
96
Professional Development in Co-teaching and Collaboration
Many schools implemented professional development as part of reform efforts to
improve teacher education and professional practice (Kraayenood, 2003; Voltz, 2001). The role
of special education is currently being examined as to how it relates to school context and
professional development in conjunction with the general education curriculum (Voltz, 2001).
The results of this study indicated that further research is necessary in the area of collaboration
between special education and general education teachers. Collaboration is needed regardless of
the service delivery model. Special education teachers who have resource room/pull out models
are also in need of collaboration with general education teachers so as to familiarize themselves
with curriculum and materials used in general education classrooms. Professional development
in co-teaching is important but it is just as important to follow through with information provide
in workshops by collaborating once the information is attained.
Professional development is a vital tool in keeping current with educational practices.
Although in some schools, professional development is not viewed as necessary, research from
this study supports previous findings that professional development is a necessary component for
understanding what influences student achievement. Teachers need to see themselves as lifelong
learners. Education is an ever changing profession and if teachers are interested in maintaining a
professional status they need to be willing to incorporate time into their schedules for
professional development.
Service Delivery Models
This study found that special education teachers who were successful in having their
students pass the reading portion of the FCAT were all from either co-taught or resource
97
room/pull out classrooms. Based on this outcome, a focus on the delivery of services for
students with learning disabilities was needed. Students with learning disabilities would benefit
from optimal application of service delivery (Glover & DiPerna, 2007). Delivery of interventions
within the general education curriculum is currently being researched as it relates to the
effectiveness of these interventions to selection and application of assessment tools (Glover &
DiPerna, 2007). As students with learning disabilities are increasingly served in general
education classrooms, service delivery models require attention. Resource room programs are
commonly found in elementary classrooms due to funding and scheduling. Inclusive classrooms
were shown much more effective, based on the research in this study.
The study researcher has experienced the difference in resource room programs and co-
taught classrooms. Even with the required certification tests and years of experience in teaching,
nothing compares to working in tandem with general education teachers in a general classroom
setting. Special education teachers at the elementary level should continue to pursue access to
general education teachers’ classrooms and at the very least collaborate with the general
education teacher to familiarize themselves with current curriculum and interventions.
Conclusion
Results of this study indicate that teacher perceptions and beliefs are significant in
student achievement. However, the data contained in the FDOE website identified that only a
limited number of students with learning disabilities were able to pass the reading portion of the
FCAT. Demographic variables did influence some of these outcomes but questions still arise
about the reality of including students with disabilities in statewide assessment and the
implications of this decision. Passing the FCAT determines student graduation, retention,
98
entrance into the military and colleges. Focus of future research may need to include alternative
assessment for students with learning disabilities.
For now, results from this study encourage continued development of concepts of teacher
beliefs and their impact on student achievement. As professionals in education, teachers need to
continue to develop a working knowledge of current research in legislation, accountability,
reading instruction, and teacher beliefs. This study developed sound reasons for teachers to
examine their beliefs toward statewide assessment, encouraging teachers to change their
perceptions and beliefs are not easy. It is hoped that the findings in this study may promote
thinking about teacher beliefs and the impact these beliefs have on student achievement.
99
APPENDIX A: TEACHER PERCEPTION AND BELIEFS SURVEY FINAL REVISION
100
101
102
103
104
105
106
107
108
APPENDIX B: IRB APPROVAL LETTER
109
110
APPENDIX C: DISTRICT APPROVAL LETTER
111
112
APPENDIX D: LETTER FOR DELPHI STUDY
113
February 18, 2008 Dear Educator, I am a doctoral candidate at the University of Central Florida. For my dissertation study, I am conducting a quantitative study exploring teachers’ perceptions and characteristics which may affect outcomes on the third grade reading portion of the Florida Comprehensive Assessment Test (FCAT). The title of the study is “Teacher Perceptions of the Achievement of Students with Learning Disabilities on Statewide Assessments”. The research methodology will include quantitative data based on the 2007 report of FCAT statistics, as well as qualitative data in the form of a teacher perception survey, observations of reading classes which include students with disabilities, and a semi-structured interview with the participant. You are invited to assist in this study because you have been identified as an educator who works with students in third grade reading classes. These students will eventually participate in the FCAT. It is hoped that the survey instrument used in this study is an accurate measurement of a third grade reading teachers’ perceptions and characteristics. In order to ensure quality and accuracy of the survey, I am requesting your review of the survey instrument. I appreciate your comments and candor and will consider your suggestions and comments after consulting with my dissertation committee. Revisions of the survey instrument will reflect your suggestions and comments. In appreciation of your time and efforts, please accept this Starbucks Gift Card and enjoy a moment of relaxation on me. Please know that I am grateful for your input. Sincerely, Maryann T. Gromoll, M. Ed.
114
APPENDIX E: TEACHER PERCEPTION AND BELIEFS SURVEY DELPHI STUDY
115
116
117
118
119
120
121
122
123
APPENDIX F: INFORMED CONSENT LETTER PRINCIPALS
124
February 18, 2008 Dear Educator, I am a doctoral candidate at the University of Central Florida. For my dissertation study, I am conducting a quantitative study exploring teachers’ perceptions and beliefs toward statewide assessment, in particular, the Florida Comprehensive Assessment Test (FCAT). The title of the study is “Teacher Perceptions of the Achievement of Students with Learning Disabilities on Statewide Assessments”. The research methodology will include quantitative data based on the 2007 report of FCAT statistics, as well as quantitative data in the form of a teacher perception and beliefs survey. I am veteran ESE teacher who is currently working as a Behavior Specialist at Lake Whitney Elementary School in the West Learning Community. I have been teaching for over 25 years and have spent 8 of those years working in the Orange County School District. I have received both OCPS and IRB approval for this study. I will attach these letters of approval as well as my survey to this letter. I am interested in sending the survey Teacher Perceptions and Beliefs Survey to the 3rd grade ESE teachers in your building. ESE teachers have been invited to participate in an anonymous online survey identifying their perceptions and beliefs toward statewide assessment. Your email address was obtained from the Global OCPS email list. The teachers are invited to assist in this study because they have been identified as educators who work with students with learning disabilities at the third grade level participating in the FCAT. Participants will be asked to complete a survey regarding teachers’ perceptions and beliefs. In addition they will be asked to answer simple demographic types of questions on their characteristics as teachers, the students in their third grade class, and the school in which they work. They will be given a $5.00 gift certificate for their participation in this study. They will be asked to provide contact information and return to my email address [email protected] in order to receive their gift certificate. This survey is completely voluntary. They may choose not to participate or not to answer any specific questions. They may skip any question you are not comfortable answering. They are free to withdraw their consent to participate and may discontinue their participation in the study at any time without consequence. There are no anticipated risks. They may not take this survey if they are under the age of 18. If they wish to receive the $5.00 gift certificate, they will identify contact information at the end of their consent letter. The survey is anonymous. They can be assured that their responses will never be matched with their name, since IP addresses will be removed from the survey when it is submitted. Following the completion of the study, the researcher will provide survey results and review best practices shared by teachers of students with disabilities. Participants will also be provided with a list of literature that identifies positive instructional practices for this population of students. Composite data will be assessed to determine differences in teacher perception among ESE teachers and statewide assessment. They will be asked to: Please answer questions honestly. The online survey will take approximately 20 minutes to complete.
125
The survey is located at: H105HUhttps://www.surveymonkey.com/s.aspx?sm=xqGEmLuUbZw1aU5Eyd5Pcg_3d_3dUH. If they choose to participate, they can complete the survey right now, or anytime until 3/31/08. If you have any questions about this research project, please contact me through email at [email protected]. I may also be reached at my work number (407) 877-8888 ext. 324. My faculty advisor, Dr. Mary Little can be reached at (407)823- 3275 or by email [email protected] UH. Research at the University of Central Florida involving human participants is carried out under the oversight of the Institutional Review Board (IRB). Questions or concerns about research participants’ rights may be directed to the Institutional Review Board Office, IRB Coordinator, University of Central Florida, Office of Research & Commercialization 12443 Research Parkway, Suite 302, Orlando FL 32826-3252. The telephone number is (407) 823-2901. The office is open from 8:00 am to 5 pm Monday through Friday except on UCF holidays. The results of this study may be published. However, the data obtained from you will be combined with data from others in the publication. The published results will not include your name or any other information that would personally identify you in any way. To complete the survey online, the teachers will go to: H108HUhttps://www.surveymonkey.com/s.aspx?sm=xqGEmLuUbZw1aU5Eyd5Pcg_3d_3dU I am asking your permission to send this survey to your teachers. Please respond to this email so that I can distribute the survey to your 3rd grade ESE teachers. Also, please identify the teachers in your building who are teachers of students with disabilities whose students participate in the FCAT. Their names will be kept confidential and their responses to the survey will be anonymous. Sincerely, Maryann Gromoll, M.Ed. Curriculum & Instruction Doctoral Candidate University of Central Florida The 3rd grade ESE teacher(s) in my building: _____________________________
126
APPENDIX G: INFORMED LETTER OF CONSENT TEACHERS
127
February 20, 2008 Dear Educator, I am a doctoral candidate at the University of Central Florida. For my dissertation study, I am conducting a quantitative study exploring teachers’ perceptions and beliefs toward statewide assessment, in particular, the Florida Comprehensive Assessment Test (FCAT). The title of the study is “Teacher Perceptions of the Achievement of Students with Learning Disabilities on Statewide Assessments”. The research methodology will include quantitative data based on the 2007 report of FCAT statistics, as well as quantitative data in the form of a teacher perception and beliefs survey. You are among several ESE teachers who have been invited to participate in an anonymous online survey identifying your perceptions and beliefs toward statewide assessment. Your email address was obtained from the Global OCPS email list. You are invited to assist in this study because you have been identified as an educator who works with students with learning disabilities at the third grade level who participate in taking the FCAT. Participants will be asked to complete a survey regarding teachers’ perceptions and beliefs. In addition you will be asked to answer simple demographic types of questions on your characteristics as a teacher, the students in your third grade class, and the school in which you work. You will be given a $5.00 gift certificate for your participation in this study. Please provide contact information and return to my email address [email protected] in order to receive your gift certificate. This survey is completely voluntary. You may choose not to participate or not to answer any specific questions. You may skip any question you are not comfortable answering. You are free to withdraw your consent to participate and may discontinue your participation in the study at any time without consequence. There are no anticipated risks. Do not take this survey if you are under the age of 18. If you wish to receive the $5.00 gift certificate, please identify contact information at the end of this consent letter. The survey is anonymous. You can be assured that your responses will never be matched with your name, since IP addresses will be removed from the survey when it is submitted. Following the completion of the study, the researcher will provide survey results and review best practices shared by teachers of students with disabilities. Participants will also be provided with a list of literature that identifies positive instructional practices for this population of students. Composite data will be assessed to determine differences in teacher perception among ESE teachers and statewide assessment. Please answer questions honestly. The online survey will take approximately 20 minutes to complete. The survey is located at:H110HUhttps://www.surveymonkey.com/s.aspx?sm=xqGEmLuUbZw1aU5Eyd5Pcg_3d_3dUH. If you choose to participate, you can complete the survey right now, or anytime until 3/31/08. If you have any questions about this research project, please contact me through email at [email protected]. I may also be reached at my work number (407) 877-8888 ext. 324.
128
My faculty advisor, Dr. Mary Little can be reached at (407)823- 3275 or by email [email protected] UH. Research at the University of Central Florida involving human participants is carried out under the oversight of the Institutional Review Board (IRB). Questions or concerns about research participants’ rights may be directed to the Institutional Review Board Office, IRB Coordinator, University of Central Florida, Office of Research & Commercialization 12443 Research Parkway, Suite 302, Orlando FL 32826-3252. The telephone number is (407) 823-2901. The office is open from 8:00 am to 5 pm Monday through Friday except on UCF holidays. The results of this study may be published. However, the data obtained from you will be combined with data from others in the publication. The published results will not include your name or any other information that would personally identify you in any way. Again, to complete the survey online, go to: H113HUhttps://www.surveymonkey.com/s.aspx?sm=xqGEmLuUbZw1aU5Eyd5Pcg_3d_3dU Thank you for taking the time and thought to complete this survey. I sincerely appreciate your participation. Your time and effort in helping gather information is greatly appreciated and will ultimately help professionals in education when preparing students for statewide assessment. Sincerely, Maryann Gromoll Curriculum & Instruction Doctoral Candidate University of Central Florida In order to receive your $5.00 gift certificate, please indicate the following: Name__________________________________________ Address________________________________________ _______________________________________________ Send to: [email protected]
129
APPENDIX H: INFORMED LETTER OF CONSENT -SELECT GROUP TEACHERS
130
Teacher Perceptions and Beliefs Survey
February 20, 2008 Dear Educator, I am a doctoral candidate at the University of Central Florida. For my dissertation study, I am conducting a quantitative study exploring teachers’ perceptions and beliefs toward statewide assessment, in particular, the Florida Comprehensive Assessment Test (FCAT). The title of the study is “Teacher Perceptions of the Achievement of Students with Learning Disabilities on Statewide Assessments”. The research methodology will include quantitative data based on the 2007 report of FCAT statistics, as well as quantitative data in the form of a teacher perception and beliefs survey. You are among several ESE teachers who have been invited to participate in a survey identifying your perceptions and beliefs toward statewide assessment. You were identified as a teacher whose 3rd grade students with specific learning disabilities passed the 2007 reading portion of the FCAT from the FDOE website and Orange County School District Online Database. Participants will be asked to complete a survey regarding teachers’ perceptions and beliefs. In addition you will be asked to answer simple demographic types of questions on your characteristics as a teacher, the students in your third grade class, and the school in which you work. You will be given a $5.00 gift certificate for your participation in this study. This survey is completely voluntary. You may choose not to participate or not to answer any specific questions. You may skip any question you are not comfortable answering. You are free to withdraw your consent to participate and may discontinue your participation in the study at any time without consequence. There are no anticipated risks. Do not take this survey if you are under the age of 18. The survey is confidential. You can be assured that your responses will never be matched with your name. Following the completion of the study, the researcher will provide survey results and review best practices shared by teachers of students with disabilities. Participants will also be provided with a list of literature that identifies positive instructional practices for this population of students. Composite data will be assessed to determine differences in teacher perception among ESE teachers and statewide assessment. Please answer questions honestly. The survey will take approximately 20 minutes to complete. Please return the survey via the enclosed stamped envelope by 3/31/08. If you have any questions about this research project, please contact me through email at [email protected]. I may also be reached at my work number (407) 877-8888 ext. 324. My faculty advisor, Dr. Mary Little can be reached at (407)823- 3275 or by email [email protected] UH. Research at the University of Central Florida involving human participants is carried out under the oversight of the Institutional Review Board (IRB).
131
Questions or concerns about research participants’ rights may be directed to the Institutional Review Board Office, IRB Coordinator, University of Central Florida, Office of Research & Commercialization 12443 Research Parkway, Suite 302, Orlando FL 32826-3252. The telephone number is (407) 823-2901. The office is open from 8:00 am to 5 pm Monday through Friday except on UCF holidays. The results of this study may be published. However, the data obtained from you will be combined with data from others in the publication. The published results will not include your name or any other information that would personally identify you in any way. Thank you for taking the time and thought to complete this survey. I sincerely appreciate your participation. Your time and effort in helping gather information is greatly appreciated and will ultimately help professionals in education when preparing students for statewide assessment. Sincerely, Maryann Gromoll Curriculum & Instruction Doctoral Candidate University of Central Florida [email protected][email protected] Your $5.00 gift card is enclosed. Please enjoy with my compliments.
Groups Gender Ethnicity High.Ed.Comp. Tch. In Field
Group A Female 100 W/C 90
A.Amer. 10
B.Degree 70
M.Degree 30
Yes 93
No 7
Group B Female 94
Male 6
W/C 86
Hisp. 10
A. Amer. 4
B.Deg. 62
M.Deg. 34
Ed.D. 2
Ph.D. 2
Yes 90
No 10
Groups Certification Job Title Other Pos. Held High. Deg.
Group A 4 yr. 89
C. Test 11
VE 50
Elem. 20
SLD 20
R.R. 10
Elem. 20
ESE 80
Yes 10
No 90
Group B 4 yr. 83
Alt. C. C. 11
Cert. Test 6
VE 79
Elem. 6
SLD 6
R.R. 15
Elem. 15
ESE 24
Adm. 3
Elem/ESE 30
El/S/M/ESE 6
Rdg. Coach 2
Yes 27
No 73
134
APPENDIX J: RESPONSE PERCENT-SCHOOL DEMOGRAPHICS
135
Groups Size Location Min. Students Free/Red. Lunch
Group A 300-599 40
600-899 50
> 900 10
Urban Fr. 10
Suburb. 90
< 6 % 30
6-20 % 10
21-49% 50
>50 % 10
< 35 % 40
35-49 % 50
50-74% 10
Group B < 300 6
300- 599 27
600-899 45
> 900 25
Urban In. 29
Urban Fr. 21
Suburb. 48
Rural 2
< 6 % 2
6-20 %. 6
21-49 % 38
>50 % 50
< 35 % 10
35-49 % . 20
50-74 % . 27
>75 % 45
136
APPENDIX K: RESPONSE PERCENT STUDENT DEMOGRAPHICS
137
Groups Gender Ethnicity Tran. Students Disabilities
Group A Male 62
Female 38
A. Amer. 11
Hisp. 35
Wh./ Cau. 44
P.I. 7
Mult. 3
1.6%
Autism 1
Asperger’s 1
EMH 5
TMH 1
SLD 87
Orth.Imp. 2
PI 1
OHI 1
Other 1
Group B Male 72
Female 28
A.Amer. 33
Hisp. 35
Wh.Cau. 28
P.I. 1
Mult. 1
2.8%
Autism 3
Asperger’s 1
EMH 9
TMH 1
SLD 70
Orth.Imp. 1%
PI 1%
OHI 6%
Other 8%
138
APPENDIX L: SUMMARY OF RESPONSE PERCENT BELIEFS ABOUT STUDENT WITH LEARNING DISABILITIES
139
Beliefs about Students with Learning Disabilities
SD MD D A MA SA
Gr.A 30
Gr.A 10
Gr.A 20
Gr.A 10
Gr.A 10
Gr.A 20
1. SLD will have a better chance in society learning reading in inclusive
classroom rather than resource rooms. Gr.B
0 Gr.B 21
Gr.B 23
Gr.B 20.5
Gr.B 23
Gr.B 14
Gr.A 10
Gr.A 10
Gr.A 0
Gr.A 20
Gr.A 0
Gr.A 60
2. SLD should be given every opportunity to learn reading with
general education students. Gr.B
0 Gr.B 10
Gr.B 5
Gr.B 41
Gr.B 11
Gr.B 39
Gr.A 0
Gr.A 10
Gr.A 0
Gr.A 40
Gr.A 10
Gr.A 40
3. SLD are capable of performing reading activities with
accommodations. Gr.B
0 Gr.B
7 Gr.B
2 Gr.B 48
Gr.B 11
Gr.B 32
Gr.A 20
Gr.A 0
Gr.A 20
Gr.A 30
Gr.A 30
Gr.A 0
4. SLD are best taught in an inclusive classroom.
Gr.B 0
Gr.B 19
Gr.B 26
Gr.B 19
Gr.B 26
Gr.B 12
Gr.A 10
Gr.A 0
Gr.A 0
Gr.A 40
Gr.A 40
Gr.A 10
5. Resource rooms are effective in meeting the needs of SLD.
Gr.B 4
Gr.B 0
Gr.B 16
Gr.B 32
Gr.B 32
Gr.B 16
140
Beliefs about Students with Learning Disabilities
SD MD D A MA SA
Gr.A 50
Gr.A 10
Gr.A 10
Gr.A 20
Gr.A 0
Gr.A 10
6. SLD cause the most behavior problems.
Gr.B 42
Gr.B 21
Gr.B 5
Gr.B 0
Gr.B 0%
Gr.B 0
Gr.A 50
Gr.A 10
Gr.A 40
Gr.A 0
Gr.A 0
Gr.A 0
7. Having SLD in my classroom has negative consequences for the other
students. Gr.B 57
Gr.B 20
Gr.B 18
Gr.B 5
Gr.B 0
Gr.B 0
Gr.A 40
Gr.A 10
Gr.A 20
Gr.A 20
Gr.A 0
Gr.A 10
8. For SLD to succeed I have to take instruction time away from my
other students. Gr.B 34
Gr.B 18
Gr.B 30
Gr.B 16
Gr.B 2
Gr.B 0
Gr. A 10
Gr.A 20
Gr.A 0
Gr.A 30
Gr.A 10
Gr.A 30
9. Special Education teachers are responsible for ensuring that SLD
are successful. Gr.B 11
Gr.B 5
Gr.B 30
Gr.B 28
Gr.B 23
Gr.B 16
Gr.A 0
Gr.A 10
Gr.A 10
Gr.A 40
Gr.A 20
Gr.A 20
10. General Education teachers are responsible for ensuring SLD are
successful. Gr.B
9 Gr.B
7 Gr.Bl
23 Gr.B 25
Gr.B 23
Gr.B 14
Gr.A 10
Gr.A 30
Gr.A 10
Gr.A 20
Gr.A 20
Gr.A 10
11. Teachers feel capable of meeting the individual needs of
SLD. Gr.B
5 Gr.B 23
Gr.B 27
Gr.B 34
Gr.B 7
Gr.B 5
141
Beliefs about Students with Learning Disabilities
SD MD D A MA SA
Gr. A 30
Gr.A 10
Gr.A 30
Gr.A 20
Gr.A 10
Gr.A 0
12. Teachers understand how to differentiate curriculum for SLD.
Gr.B 21
Gr.B 11
Gr.B 32
Gr.B 27
Gr.B 5
Gr.B 5
SD=Strongly Disagree MD=Moderately Disagree D=Disagree A=Agree MA=Moderately Agree SA=Strongly Agree SLD= Specific Learning Disabled * The number of respondents varied because of missing data.
142
APPENDIX M: SUMMARY OF RESPONSE PERCENTS BELIEFS ABOUT STATEWIDE ASSESSMENTS
143
Beliefs about Statewide Assessments
SD MD D A MA SA
Gr. A 0
Gr. A 0
Gr. A 0
Gr. A 50
Gr. A 20
Gr. A 30
1. I modify the curriculum in my classroom to match the state
standards. Gr.B
0 Gr.B
0 Gr.B 10
Gr.B 51
Gr.B 16
Gr.B 23
Gr. A 0
Gr. A 0
Gr. A 0
Gr. A 40
Gr. A 0
Gr. A
60
2. I use specific techniques and strategies to prepare my students for
statewide assessments (FCAT).
Gr.B 0
Gr.B 0
Gr.B 2
Gr.B 52
Gr.B 21
GR.B 25
Gr. A 0
Gr. A 10
Gr. A 10
Gr. A 40
Gr. A 20
Gr. A 20
3. I primarily use state standards to identify what is important to teach
in my classroom. Gr.B
0 Gr.B
2 Gr.B 14
Gr.Bl 52
Gr.B 16
Gr.B 16
Gr. A 0
Gr. A 0
Gr. A 0
Gr. A 70
Gr. A 0
Gr. A 30
4. My curriculum, instruction, and assessments are aligned with
content found in state standards. GR.B
0 Gr, B
0 Gr.B
5 Gr.B 57
Gr.B 18
Gr.B 20
Gr. A 0
Gr. A 0
Gr. A 0
Gr. A 50
Gr. A 10
Gr. A 40
5. I develop lesson plans to teach students’ content found in state
standards.
Gr.B 0
Gr.B 0
Gr.B 3
Gr.B 60
Gr.B 17
Ger.B 21
144
SD MD D A MA SA
Gr. A 0
Gr. A 0
Gr. A 0
Gr. A 60
Gr. A 0
Gr. A 40
6. I plan assessments to measure student mastery of content relative
to state standards. GR.B
0 GR.B
0 Gr.B
7 Gr.B 66
Gr.B 9
Gr.B 18
Gr. A 10
Gr. A 0
Gr. A 0
Gr. A 40
Gr. A 0
Gr. A 50
7. I use the state standards to determine what is important to
assess in my classroom. Gr.B
0 Gr.B
2 Gr.B 14
Gr.B 52
Gr.B 16
Gr.B 16
Gr. A 10
Gr. A 10
Gr. A 20
Gr. A 20
Gr. A 10
Gr. A 30
8. For students in my class, improvement on statewide
assessment (FCAT) is extremely difficult to accomplish. Gr.B
0 Gr.B
7 Gr.B 14
Gr.B 37
Gr.B 13
Gr.B 29
Gr. A 0
Gr. A 20
Gr. A 0
Gr. A 40
Gr. A 20
Gr. A 20
9. The state’s expectations are reasonable for students at my
school. Gr. B
21 Gr.B 14
Gr.B 28
Gr.B 30
Gr.B 5
Gr.B 2
Gr. A 10
Gr. A 0
Gr. A 30
Gr. A 20
Gr. A 20
Gr. A 20
10. I know how students at my school compare to students at other
schools in my state on statewide assessment (FCAT). Gr.B
2 Gr.B
2 Gr.B 19
Gr.B 53
Gr.B 12
Gr.B 12
145
SD MD D A MA SA
Gr. A 40
Gr. A 10
Gr. A 30
Gr. A 10
Gr. A 0
Gr. A 10
11. Statewide assessment (FCAT) appropriately measures my
students’ strengths and weaknesses. Gr.B 47
Gr.B 16
Gr.B 23
Gr.B 9
Gr.B 5
Gr.B 0
Gr. A 0
Gr. A 10
Gr. A 20
Gr. A 40
Gr. A 10
Gr. A 20
12. The statewide assessment (FCAT) addresses the content of
state standards.
Gr.B 0
Gr.B 5
Gr.B 13
Gr.B 64
Gr.B 11
Gr.B 7
Gr. A 11
Gr. A 0
Gr. A 44
Gr. A 33
Gr. A 0
Gr. A 11
13. I am supportive of including SLD in statewide assessment
(FCAT). Gr.B
18 Gr.B 154
Gr.B 21
Gr.B 30
Gr.B 11
Gr. B 5
Gr. A 10
Gr. A 0
Gr. A 0
Gr. A 40
Gr. A 10
Gr. A 40
14. I feel that statewide assessments (FCAT) is too stressful for SLD.
Gr.B 2
Gr.B 11
Gr.B 16
Gr.B 25
Gr.B 21
Gr.B 25
Gr. A 0
Gr. A 10
Gr. A 10
Gr. A 40
Gr. A 0
Gr. A 40
15. I feel that SLD students can successfully pass the statewide
assessment (FCAT). Gr.B 14
Gr.B 9
Gr.B 37
Gr.B 27
Gr. B 9
Gr.B 5
Gr. A 0
Gr. A 0
Gr. A 0
Gr. A 10
Gr. A 20
Gr. A 70
16. I am knowledgeable of accommodations for SLD who take
statewide assessments (FCAT). Gr.B
0 Gr.B
0 Gr. B
0 Gr.B 20
Gr.B 20
Gr.B 60
146
SD MD D A MA SA
Gr. A 10
Gr. A 0
Gr. A 10
Gr. A 40
Gr. A 10
Gr. A 30
17. Overall, I feel comfortable preparing SLD for statewide
assessment. Gr. B
5 Gr. B
9 Gr. B
22 Gr. B
37 Gr. B
13 Gr. B
4
SD=Strongly Disagree MD=Moderately Disagree D=Disagree A=Agree MA=Moderately Agree SA=Strongly Agree SLD=Specific Learning Disabled * The number of respondents varied because of missing data.
147
LIST OF REFERENCES
Abrahms, L.M., Pedulla, J.J., & Madaus, G.F. (2003). Views from the classroom: Opinions of
statewide testing programs, Theory Into Practice, 42 (1), 19-29.
Albus, D., Shyyan, V., & Thurlow, M. (2006). Online survey on instructional strategies for
English language learners with disabilities (ELLs with Disabilities Report 13).
Minneapolis, MN. University of Minnesota, National Center Educational Outcomes
Retrieved September 18, 2006 from H119HUhttp://education.umn.edu/NCEO/OnlinePubs/U
ELLsDisReport13.html
Andrews, J., Carnine, D., Coutinho, M., Edgar, E., Forness,S., Fuchs, L., Jordan, D.,
Kauffman,J., Patterson, J., Paul, J., Rosell,J., Rueda, R., Schiller, E., Skrtic, T., & Wong,
J. (2000). Bridging the special education divide, Remedial and Special Education, 21 (5),
258-260.
Atkinson, T.S., Wilhite, K.L., Frey, L.M., & Williams, S.C. (2002). Reading instruction for the
struggling reader: Implications for teachers of students with learning disabilities or
emotional/behavioral disorders, Preventing School Failure, 46(4), 158-162.
Austin, V.A. (2003). Teacher beliefs about co-teaching, Remedial and Special Education, 22(4),
245-255.
148
Begeny, J.C., & Martens, B.K. (2006). Assisting low-performing readers with a group-based
reading fluency intervention, School Psychology Review, 35(1), 91-107.
Benz, C.R., Bradley, L., Alderman, M.K., & Flowers, M.A. (1992). Personal teaching efficacy
Developmental relationships in education, Journal of Educational Research, 85(5),
274-285.
Berk, R.A. (2005). Survey of 12 strategies to measure teaching effectiveness, International
Journal of Teaching and Learning in Higher Education, 17 (1), 48-62.
Berninger, V.W., Abbott, R.D., Vermeulen, K., Fulton, C.M. (2006). Paths to reading
comprehension in at risk second-grade readers, Journal of Learning Disabilities, 39
(4), 334-351.
Blanton, L.P., Sindelar, P.T., & Correa, V. I. (2006). Models and measures of beginning teacher
quality, The Journal of Special Education, 40 (2), 115-127.
Boardman, A.G., Arguelles, M.E., Vaughn, S., Hughes, M.T., & Klingner, J. (2005). Special
education teachers’ views of research-based practices, The Journal of Special Education,
39 (3), 168-180.
Boe, E.E., & Cook, L.H. (2006). The chronic and increasing shortage of fully certified teachers
in special and general education, Exceptional Children, 72 (4), 443-460.
Bowen, S.K., & Rude, H.A. (2006). Assessment and students with disabilities: Issues and
challenges with educational reform, Rural Special Education Quarterly, 25 (3), 24-30.
149
Brownell, M.T., Adams, A., Dindelar, P., Waldron, N., and Vanhover, S. (2006). Learning from
collaboration: The role of teacher qualities, Exceptional Children, 72 (2), 169-185.
Burnett, P.C. & Meacham, D. (2002). Measuring the quality of teaching in elementary school
classrooms, Asia-Pacific Journal of Teacher Education, 30(2), 141-143.
Bursuck, W.D., Smith, T., Munk, D., Damer, M., Mehlig,L., & Perry, J. (2004). Evaluating the
impact of a prevention-based model of reading on children who are at risk, Remedial and
Special Education, 25(5), 303-313.
Bussis, A., Chittenden,E., & Amarel, M. (1976). Beyond the surface curriculum: An interview
study on teachers’ understandings. Boulder, CO:Westview Press.
Carnine, D., & Granzin, A. (2001). Setting learning expectations for students with disabilities,
School Psychology Review, 30 (4), 466-472.
Center for Evaluation & Education Policy, (2006). Closing the Achievement Gap Series: Part III
What is the Impact of NCLB on the Inclusion of Students with Disabilities? Retrieved