112

Page 2
CONTENTS List of tables 4 List of figures 4 List of abbreviations 5 EXECUTIVE SUMMARY 6 1. INTRODUCTION 20
1.1 Background 20 1.2 Methodology 22 1.3 Limitations of the methodology 23
2. CONTEXT OF THE NATIONAL EDUCATION SYSTEM 25 2.1 Education achievements since 1994 26 2.2 The post-apartheid education structure 27 2.3 The legislative framework 29 2.4 Enrolment patterns 31 2.5 Curriculum 36
2.6 Financing education 37 2.7 Other factors affecting the provision of quality education 38 3. COMPOSITION OF THE TEACHING STOCK: IMPACT ON TEACHER SUPPLY AND DEMAND 39 3.1 Teacher numbers 39 3.2 Gender distribution 42 3.3 Age distribution 45 3.4 Geographic distribution 46 3.5 Teacher qualifications 46 3.6 Professional development to address qualitative shortages 48 3.7 New recruitment 49

Page 3
4. TEACHER RETENTION 54 4.1 The nature and magnitude of attrition 54 4.2 Factors influencing attrition 58 4.3 Teaching and learning conditions 58
4.4 Teacher job satisfaction and morale 62 4.5 Remuneration and other material incentives 63
5. IMPLICATIONS OF HIV/AIDS FOR TEACHER SUPPLY AND DEMAND 64 6. IMPROVING TEACHER SUPPLY 66 6.1 Teacher candidates 67 6.2 Student teacher enrolment 68 6.3 Initial teacher education 69 6.4 Recruitment and retention strategies 72 7. CONCLUSIONS, CHALLENGES AND DEPARTMENTAL ACTIONS 79 7.1 Concluding Summary 79 7.2 Addressing the Challenges 88 8. BIBLIOGRAPHY 92 9. APPENDICES 96 Appendix 1: The ILO Framework 96 Appendix 2: Definition of teacher-related concepts 98 Appendix 3: Governance, administration, and public statutory support 100 Appendix 4: Social dialogue and participatory decision-making in Education 104 Appendix 5: Financing education – targeting schools on the basis of need 106 Appendix 6: Causes of teacher attrition 110

Page 4
List of tables Table 2.1 National Qualifications Framework (NQF) Table 2.2 Number of learners by provincial distribution in ordinary public and ordinary independent schools Table 3.1 Grade 12 learner study preferences for Higher Education Table 3.2 First-year headcount enrolment, by study area and field, 2002 Table 4.1 Learner-educator ratios by province Table 6.1 Decline in teacher education enrolment, 1994 to 2000 Table 6.2 National educator appointment rates based on new appointments List of figures Fig. 2.1 Percentage of learners in the South African school system by category Fig. 2.2 Percentage of learners in the South African school system by school level Fig. 2.3 Educator trends between 1999 and 2003 Fig. 2.4 Learner trends between 1999 and 2003 Fig. 3.1 Educator numbers over a 6-year period from 1999-2004 Fig. 3.2 Numbers of teachers in the ordinary independent school system Fig. 3.3 Numbers of teachers in the “other” education institutions/centres Fig. 3.4 Percentage gender distribution of teachers by province Fig. 3.5 Gender representation within different official rankings Fig. 3.6 Number and distribution of educators by age group Fig. 3.7 Distribution of educators by REQV level Fig. 3.8 Future plans of newly-qualified teachers Fig. 3.9 Subjects/learning areas of specialization of newly-qualified teachers Fig. 3.10 Sample representation of newly-qualified teachers by population grouping

Page 5
List of abbreviations ABET Adult Basic Education and Training CEM The Council of Education Ministers CEPD Centre for Education Policy Development, Evaluation and Management CHE Council on Higher Education COLTS The Culture of Learning, Teaching and Service Campaign CTP Committee of Technikon Principals DoE Department of Education DoL Department of Labour ECD Early Childhood Development ELSEN Education for Learners with Special Educational Needs GET General Education and Training FET Further Education and Training FTE Full-Time Equivalent HEDCOM The Heads of Education Departments Committee HEIs Higher Education Institutions HEQC Higher Education Quality Committee HRD Human Resources Development INSET In-service Education and Training ILO International Labour Organisation IQMS Integrated Quality Management System MECs Members of (provincial) Executive Councils MST Maths, Science and Technology MTEF Medium Term Expenditure Framework NER Net Enrolment Ratio OBE Outcomes-based Education PEDs Provincial Education Departments PRESET Pre-service Education and Training NAPTOSA National Professional Teachers’ Organisation of South Africa NIS National Innovation System NSE Norms and Standards for Educators NQF National Qualifications Framework NSFAS National Student Financial Aid Scheme REQV Relative Education Qualification Value SABC South African Broadcasting Corporation SACE South African Council of Educators SADTU South African Democratic Teachers’ Union SAOU Suid-Afrikaanse Onderwysers Unie SAQA South African Qualifications Authority SASA South African Schools Act 84 of 1996 SCEs Senior Certificate Examinations SET Science, Engineering and Technology SETAs Sectoral Education and Training Authorities SGBs School Governing Bodies UNESCO United Nations Educational, Scientific and Cultural Organisation

Page 6
Executive Summary
The responsibility of the Department of Education (DoE) to commit to the Dakar Framework for Action includes the following measures to ensure that by 2015 South Africa has:
A comprehensive early childhood and development programme in place, an ECD programme that will be available to all communities, particularly vulnerable and disadvantaged children That all children have free and compulsory quality primary education That learning needs of all young people and adults are met That there is an improved adult literacy rate That no gender disparities in the participation of learners at primary and secondary
levels are evident That the quality of education is improved especially numeracy, literacy and life skills.
Since 1994, legislative and policy interventions have resulted in the following achievements for the education system:
1. Teachers
The DoE has a dedicated National Teacher Development strategy, which is consolidating gains made after the transition. Since 1994, the DoE has been able to achieve a 30% increase in the proportion of qualified teachers in South Africa. School Improvement and National Teaching Awards are presented annually to acknowledge excellence in the education system. Furthermore, more than 4 000 maths and science teachers have received formal qualifications in the last four years. Finally, a partnership with the Canada-South Africa Teacher Development Project has helped to improve the quality of education by strengthening teacher professional development and support.
2. Rewarding good performance.
A new performance related appraisal system linked to the IQMS has been established. The system will reward teachers that perform well within the public sector whilst keeping them in schools.
3. Near-universal compulsory education.
Education interventions have resulted in the sustained participation of over 95% in schooling since the mid to late 1990s and sustained increases in enrolment in all age groups at education institutions. These participation rates are comparable to those in the most industrialized countries.
Page 7
4. Girls are performing well.
In the Grade 12 Senior Certificate Examination and assessments, girls seem to be doing better at key competency tests. More girls participate in higher education. At higher education institutions, the female share of enrolment has increased over the years from 44.1% in 1993 to 51% in 1999 to about 54% 3.5% in 2001.
5. Participation in mathematics, science and technology for female learners is improving, as is participation in higher education of female learners. This augurs well for the creation of knowledge, skills development, research and development envisaged in the Human Resource Development Strategy.
6. Early Childhood Development programme has had a 12% growth in participation in the reception Grade year since 2000, signifying the expansion of access to quality foundation for education by 5 year-olds countrywide.
7. Fewer out of school youth. The DoE has been able to attract more youth back to the school. The number of out of school youth who should be in compulsory schooling has nearly halved since 1996 from 945 000 to 581 000 for 7 - 15 years old, and available data shows that between 1998 and 2000, between 1998 and 2000, the proportion of African students in FET colleges grew from 71% to 76%.
8. Dealing with poverty. The DoE has started a National School Nutrition Programme in our primary schools to provide a meal to children from poor communities. The programme enables participation and enhances learner achievement. The National School Nutrition Programme is projected to be funded to the tune of over R838 million in 2004/5 from an amount of R460 million in 1999. We have established a national financial aid scheme for tertiary education. Students receive financial aid through the NSFAS as bursaries or loans. The average annual increase in higher education enrolment has been just over 12 000 per year since the mid-1990s while the average annual increase in the number of awards made by the financial aid scheme was almost 4 000 (a third of this average annual increase in enrolment). Between 1996 and 2001, the scheme disbursed over R 2,6 billion to almost half a million students in higher education institutions.
9. Curriculum reform and skills development. The government recognizes that the curriculum influences the quality of education outcomes. The curriculum has therefore been modernised to make it more relevant to the needs of citizens of a developing country aiming to achieve sustainable economic and development growth.
10. The development of scarce skills has been a major area of focus for us; Mathematics, Science and Technology have been identified as key development drivers for the country. The Department of Education’s contribution is to improve participation rates in these subjects. Dedicated schools of Mathematics, Science and Technology called Dinaledi schools have been established as part of a National Strategy for Mathematics, Science and Technology aimed at 1) - raising the participation and performance of Black learners (especially females) in Mathematics and Science at Senior Certificate level; 2) providing high-quality education in the three subjects to all learners and 3) increasing and improving human resource capacity to deliver education in the three subjects. Schools of focused

Page 8
learning in the areas of Performing and Visual Arts and Sports have also been established in some provinces. In addition to the Dinaledi schools a White Paper in e-Education and an implementation strategy have been developed to consolidate these interventions in the system, and to create a corps of learners and educators who are fully ‘e’ competent.
11. Dealing with HIV/AIDS in Education. As part of the curriculum, HIV/AIDS education is responsible for the greater awareness on the this subject The DoE has developed and produced HIV and AIDS resource guides that will be used by schools to prepare an action plan to respond to the pandemic. A study is being completed now to identify the factors affecting the supply and demand of educators including the impact of HIV/AIDS.
12. Values in education. The focus of the values in education initiative will be on familiarising learners with Constitutional values and symbols. The revised National Curriculum, completed in 2003, places emphasis on the principles of Social Justice, a Healthy Environment, and Human Rights and Inclusivity. The important role of History in encouraging respect for heritage and diversity in the broader population (in addition to learners) is also recognized. The Revised National Curriculum enhances multilingualism, diversity and respect for different language traditions in a national context and provincial departments of education are obliged to make the necessary arrangements to ensure that the language requirements of learners are met at local level.
Infrastructure in education remains a concern, and the context in which learners learn will receive attention in the coming years.
The challenges facing developing countries such as South Africa are depressingly common and threaten to overwhelm our goals of quality education for all:
• Socio-economic conditions, poverty and unemployment rates in many of our countries encourage dropping out, low achievement and exclusion, particularly for the poor.
• Lack of modern curricula in the right place at the right time. This is particularly true where teacher development and quality are a critical concern.
• Lack of learning opportunities for young people and adults as means to enter the labour market or progress to higher education.
• Lack of maturity of systems of implementation, monitoring, evaluation especially in terms of resource allocation and administrative.
• The problems of coordination of various skills development agencies as well as Government in ensuring coherent quality programmes in Early Childhood, Adult Basic Education and vocational education.
• The drain of teaching skills away from the continent. • The impact of HIV/AIDS on society and how these impact on education and training. • The low levels of development support in African countries especially support which is
not tied with trade. • Challenges of infrastructure degradation and maintenance which play themselves out in
many of our rural communities, and the transport and travel of learners to and from rural schools
• Post-primary secondary enrolment, particularly for girls.

Page 9
Strengthening the participation in, and completion of, programmes in scarce skills areas such as Maths, Science and Technology, South Africa still under performs when compared to other developing countries in the world. The DoE is confident that there is tremendous progress being made in the plans to meet the targets the department has set for itself in achieving the EFA goals.
This report analyses the current stock of teachers, examines factors likely to influence future supply and demand patterns, identifies the challenges relating to ensuring that the education sector is able to develop and sustain a corps of qualified and competent teachers to achieve the EFA goals of access and quality, and finally describes the efforts of the Department of Education in addressing these challenges.
Composition of the Teaching Stock
Recent research on teacher demand and supply has indicated no quantitative shortages at the present time. However, these same studies project quantitative shortages based on the anticipated effects of:
• the impact of HIV and Aids on educators; • fewer candidates entering the teaching profession; • attrition rates among educators as a result of factors other than HIV and AIDS; and • trends in learner enrolments.
However, given the large stock of unemployed or under-employed people who have been trained as educators, and of qualified teachers currently employed in sectors outside of education, there would appear to exist the capacity to ease the urgent pressure to train new educators. It is, however, important to note that while there are teachers who have left the profession but who could become available should there be an immediate shortage, low levels of job satisfaction might impact negatively on the ready supply of these and other potential educators. Gender Distribution Women dominate the teaching profession with over 70 percent of teachers being female. While the number of female teachers has been rising overall, it has not been increasing, to any significant degree, in secondary specialist areas such as Science and Mathematics. This presents a challenge to education authorities either to encourage more female educators to specialize in these learning areas or to design strategies to attract more males into taking these subjects in the teaching profession. Given the current qualitative shortages and projected shortfalls in these areas, both strategies will probably be necessary.

Page 10
Despite the increasing feminisation of the teaching profession, women are still under-represented in management positions in schools in the majority of provinces. Only pre-primary schools and primary schools are largely under the managerial responsibility of women. Age Distribution Recent studies by the HSRC show that the educator workforce is generally older than the formal sector workforce. Twenty nine per cent of educators are 45 and older, compared to only 21 per cent of the general workforce in the formal sector. However, while overall, South Africa’s teaching workforce has aged, it has not done so evenly. Important differences exist in age structure by gender, region, school sector and school level. For example, teachers aged 55 and over form a lower proportion of the teaching workforce than do employees aged 55 and over of the overall national workforce. Thus, while within the teaching workforce, the share of older teachers has increased over the past thirty years, this increase appears to be concentrated in the 45–55 year age group. However, a substantial proportion of the teaching workforce will be eligible to retire on age grounds within the next 5–10 years, a fact which has attracted considerable policy concern. As far as supply issues are concerned, the age profile issue appears to be of greater significance for certain areas of teaching. Given the relatively higher proportion of males in the older age bands, recruitment difficulties may be exacerbated in subject fields dominated by male teachers. This has been identified as a significant policy issue in relation to the quality of teaching, and hence of student learning. While older teachers may be highly experienced and confident in their teaching role, there is also a need for updated curriculum knowledge and pedagogical procedures, as well as for rethinking the structure of a teaching career. Innovative policies may be needed to create opportunities for professional learning for older, highly experienced teachers. Nevertheless, if an increased number of younger candidates do not enter the teaching profession, and remain in it for an extended period, there will be inadequate numbers to replace those who leave the profession due to age. To avert an imminent shortage, government must embark on an intense drive to interest younger people into the profession.
Geographic distribution The distribution of educators is uneven. Rural areas experience both qualitative and quantitative shortages. Teacher Qualifications
The DoE has introduced initiatives to reduce levels of under-qualification in its teacher workforce, mainly through offering an interim in-service, site-based upgrading qualification, the National Professional Diploma in Education (NPDE). As a result of these initiatives, the total

Page 11
number of unqualified and under-qualified educators has been reduced significantly since 1994, when as much as 36 per cent of the workforce fell into this category, having increased consistently during the previous two decades. By 2001, the proportion of unqualified and under-qualified educators had fallen to 18 per cent. According to an ELRC/HSRC study by 2004, the cohort of unqualified or under-qualified educators seems to have further declined to 8.3 per cent. Qualification and REQV levels do not, however, tell the whole story. For instance, there appears to be a lack of educators with adequate training in Outcomes-Based Education (OBE), and in the new school curriculum (RNCS). New Teachers Data is severely lacking on the nature of outputs from the teacher education system. However, a sample study conducted in one province, KwaZulu-Natal provides an interesting profile of newly qualified teachers. First, it suggests that cohorts of new recruits into teaching are unlikely to alter significantly the gender profile of the profession as a whole. They may, on the contrary, even increase the gender imbalance. The study showed also, amongst secondary teachers, that the subjects/learning areas that most teachers are qualified to teach are English, Mathematics, Natural Science, Life Orientation and Technology. These figures correlate with the subjects identified by the DoE as ‘scarce’ subjects, so it appears that institutions are attempting to address these needs. The high proportion of students coming from urban areas would presuppose that they would be less willing to teach in rural areas, were posts in rural areas to be offered them at some stage. It is probable too that these are the majority of students that would have a better grasp of subjects and learning areas like Mathematics, Science and Technology. If this sample were to be taken as a representative sample of the teacher graduate population, then the country would seem to be headed for a serious shortage of teachers in the rural areas, and even more so teachers in the scarce subjects. Teacher Retention The nature and magnitude of attrition The teacher attrition rate is currently estimated at between 5 and 5.5 per cent nationally. In relative terms this is not out of line with international trends but in absolute terms this translates to between 17,000 and 20,000 teachers lost to the system each year. A recent study reported that 54 per cent of educators had considered leaving the education profession. Two-thirds of the educators stating their intentions to quit fell in the technology, natural sciences, economics and management fields. High predictors for leaving the teaching profession were low job satisfaction (in particular: lack of career advancement and recognition, teaching conditions in terms of working hours/load/policies, and lack of discipline and respect), a changed career choice after three years of teaching, high job stress (in particular: problems with teaching methods and administration and problems with the educational system), being white, coloured or Indian/Asian, five to 19 years’ teaching experience and the urban location of the school. Medium predictors were being male, low morale at school and high violence experienced

Page 12
at the school in the past 12 months. Low predictors were low educator support and high educational qualification, and high annual income. In summary, the findings imply that South Africa may experience shortages at two levels. Firstly, there is likely to be increased shortages of teachers in rural schools due to difficulty in recruitment of educators willing to work in rural contexts. Secondly, there is likely to be a shortage in urban schools with urban teachers leaving to explore other career opportunities. Available data provide four broad categories of reasons for termination that are increasing: resignations, retirements, medical incapacity and death. Factors influencing attrition A survey of teachers conducted as part of the study identified the following factors:
• Disintegration of discipline (thus causing unfavourable working conditions). • Lack of facilities for teaching – especially subjects such as Science and technology. • Severe overcrowding of schools and classrooms – this in spite of a generally acceptable
national average learner-teacher ratio. • Lack of adequate incentives. • Poor parental participation at all levels: school governance and the disciplining of
children. • Policy overload, leading to dissatisfaction with time allocation, and making working
conditions unbearable through the increase in administrative work. • Role conflict. Teachers claim they have to adapt and adopt a multitude of roles depending
on circumstances presented at school. These roles include attention to counseling, teaching, acting as locus-in-parentis, doubling as security personnel and sometimes even performing as midwives.
• Blatant favouritism and nepotism at school governance levels. Other factors that could influence attrition are: lack of safety at schools, low teacher job satisfaction and morale, and inadequate remuneration and other material incentives.
Implications of HIV and AIDS for Teacher Supply and Demand A recent HSRC study suggested that the proportion of HIV-positive educators with a CD cell count of 22 per cent is higher than that reported in other studies conducted in sub-Saharan Africa. The study also suggests that HIV prevalence among educators was higher for those aged 25 – 34 years (21 per cent). In addition, the study found that Africans had a prevalence of 16.3 per cent, compared to less than 1 per cent amongst Whites, Coloureds and Indians. Educators who had a low socio-economic status had a higher prevalence. The study also found that educators residing in rural areas and those working in rural schools had higher HIV prevalence than educators residing in urban areas and teaching in urban schools. It also revealed that educators employed in KwaZulu-Natal and Mpumalanga had the highest HIV prevalence among all the provinces.

Page 13
Research reports project that AIDS will soon become the leading cause of deaths among teachers. Up to 3.5 per cent of teachers could die annually from AIDS by 2010.
These high levels of AIDS-related illness and death among employees will have a significant impact on the education sector. Performance of remote schools or those with small staff complements, such as farm schools, will be particularly vulnerable, as will institutions with high workloads and less reserve capacity to spread loads.
Improving Teacher Supply Improving teacher supply is one way of mitigating the effects of the losses described in the preceding sections. South Africa faces challenges with its pool of available educators. One of these challenges is that of attracting new educators into the teaching profession and another is the challenge of how to retain those already in the system. At present the country is not producing enough teachers to balance out the effects of annual attrition. There has been a decline in students taking the Initial Professional Education of Teachers (IPET) qualifications, namely the undergraduate Bachelor of Education (BEd) and the Postgraduate Certificate in Education (PGCE). Self-reported data from the Deans’ Forum in 2004 indicated that education institutions are producing at best approximately 9 000 graduates of whom at least about 3 000 may already be practising educators. The decline in enrolment is significant among black Africans. Improved career opportunities for black applicants have not only reduced the number of applicants who enter the education sector, but have also had an impact on the supply of educators because even the small pool of education graduates may not necessarily end up teaching. They are likely to seek employment in other fields where their teaching skills are valued, such as in training-related careers or marketing. It was also found that the older patterns of oversupply in urban schools and undersupply in rural schools have persisted and newly trained educators have difficulty in finding posts (even in rural schools). Another supply-side challenge is the increasing pattern in the international migration of teachers. Teacher Candidates The present demographic profile of students who take teaching is a cause for concern, with serious implications for the provision of new teachers in traditionally disadvantaged reaches of the schooling system. The profile of existing teacher candidates reveals that students intending to go into teaching are most likely to be female, young, to be studying the humanities rather than science or engineering, are white, and tend to prefer the primary rather than the secondary school sector. There are relatively few black student teachers particularly in the Foundation phase. Student Teacher Enrolment The number of students enrolled in initial teacher education programmes sustains the flow of new entrants into the profession. According to recent research on trends in the period 1999-
Page 14
2003, there has been an overall decline in student-educator enrolment by approximately 24.3 per cent. In 1997 there were 142 169 students enrolled for teacher preparation programmes in South Africa. Enrolment dropped to 130 000 in 1998; and of the 107 000 students enrolled at universities in 2001, only 20 321 were enrolled as full-time students. The number of education graduates peaked at 35 628 in 1999 and drastically declined to 22 958 in 2002, although it increased slightly to 25 308 in 2003. Initial Teacher Education Key issues highlighted in the report in this regard relate to the impact on supply (especially in the rural areas) of reforms in teacher training (colleges of education vs. universities), the equity issues relating to cost of study at the universities as opposed to the former colleges of education and the higher admission requirements at the universities. Recruitment and Retention Strategies With regard to vacancies, the preliminary findings of a study being conducted by the DoE reveal that virtually all of the districts surveyed indicated that they are currently having difficulty recruiting and employing new teachers. Of the 372,689 teaching posts reported by the Department of Education, some 14 000 posts remain unfilled. Despite improved appointment rates, filling of vacancies is still a challenge the Department of Education is faced with. A further analysis of posts which are not being filled, reasons, and geographic distribution of such vacancy posts is necessary. Leaving these vacancies unfilled impacts on the quality of education, because it leads to these posts being filled by unqualified teachers. If that is not the case, then other educators would be overloaded with teaching as they have to share the workload of the vacant post. This causes problems especially when these teachers then have to teach outside of their areas of specialization.
Recruiting and retaining teachers in rural areas Recruiting educators for rural schools is one of the challenges facing the provincial education departments. The teaching profession in rural areas is characterised by a critical shortage of qualified educators particularly in physical science and mathematics. Morale is low because of poor conditions of service and the dire teaching environment in many schools. The report suggests a number of measures to improve recruitment and retention of rural teachers.
Improving conditions of Employment for Educators Improved conditions of service are key to retaining educators in the profession. From the moment the educator begins teaching, employment conditions must be in place to ensure that they grow into the profession. Among the issues analysed in the report in this regard are the following: induction; career pathing; remuneration/material incentives; post and salary structure; pay progression and performance management; and professional assessment.

Page 15
ADDRESSING THE CHALLENGES This section identifies first some of the teacher-related challenges facing the Department of Education. Second, it describes how the DoE is already addressing several of these challenges. The challenges relate broadly to:
• Education Policy and Planning;
• Teacher Education and Professional Development;
• Teacher Recruitment and Retention;
• Teacher Remuneration and Material Incentives; and
• Teaching and Learning Conditions
Challenges
Education Policy and Planning
• Provincial education departments (PEDs) will need to develop or refine comprehensive data systems that provide information on teacher supply, teacher quality and teacher mobility. This information must be analysed, documented and relayed to the Department of Education to assist with policy formulation.
• To develop effective data systems, a high degree of co-operation among key players is
critical. All necessary parties will have to participate in the data development and collection effort, and ministers and legislature MEC’s must be supportive.
• Policies for recruitment will have to be balanced by policies for retention. These must
include the Department of Education developing a national plan in partnership with educator and labour representatives, parents and other stakeholders. It is important to listen to the teachers and address their concerns.
• Aligning recruitment policies and practices with the interests and expectations of
prospective teachers will be crucial.
Teacher Education and Professional Development
• The Department of Education and Provincial Education Departments need to ensure accessibility to teacher education through appropriate means of financial assistance, such as contract bursaries.
• Every new teacher should be required to participate in a formal induction and/or
mentoring programme, to be developed at the local district level or school site to provide extensive and intensive professional development for all new teachers.

Page 16
• The final year of initial teacher education could be used as a period of site based teacher
development through a “practical internship”.
Teacher Recruitment and Retention
• Recent research has suggested that, to ensure that there are adequate numbers of educators to serve the system, there has to be an immediate increase in the number of students recruited into teacher training.
• The Department of Education needs to assess the supply of educators in rural areas. It
must take into account gender equity and consider the current shortages of trained educators in key learning areas and how recruitment and retraining of unemployed educators can alleviate existing and potential shortages.
• The Department of Education needs to engage in a recruitment drive amongst rural
communities, and provide financial incentives for rural candidates to enter the teaching profession. Strategies to attract black teacher candidates particularly to specialize in Foundation phase teaching must be put in place to ensure a continual supply of these teachers.
• A countrywide advisory group should be appointed to plan and advocate for policies and
strategies to help school districts succeed in recruiting and retaining well-qualified teachers in difficult-to-fill teaching fields.
Teacher Remuneration and Material Incentives
• Salary increases are the most direct and powerful way to demonstrate the value accorded to the education profession. A lack of financial progress following entry into the profession could encourage attrition after a few years and needs to be addressed.
• Teachers need to be released from administrative tasks and other activities that increase
their workload and distract attention from their fundamental responsibilities.
• Teachers need more steps on their career ladders across their entire career path. The promotion structure should allow for career advancement opportunities that do not remove educators from the classroom.
• There is a need to create financial incentives to recruit and retain teachers in hard-to-fill
teaching positions. Shortage areas will be defined for this purpose at the level of districts. Incentives might include salary increments, bonuses for continuing in teaching positions, and support for professional development.

Page 17
• Financial incentives offered by employers, such as scholarships, arrangements to pay specialist teachers’ accumulated Higher Education contribution scheme (HECS) debt, and assurances of employment (often in specified rural areas), have proved successful in drawing an expanded cohort of suitable people to teaching.
Teaching and Learning Conditions
• The NFTE report suggested interventions that are necessary to sustain the recruitment of candidates into teaching, for example, a campaign for the renewed status of teachers. Media campaigns need to be waged to enhance the image of the profession.
• Public awareness and appreciation of teaching as a profession have to be raised.
• There needs to be carefully designed and effective solutions for the problems relating to
school and classroom discipline. Teachers need to be provided with a workable alternative to corporal punishment and punitive discipline in the classroom, so that learners who want to can do so in an environment conducive to learning.
Departmental Actions
The DoE has taken the following steps to revitalize the teaching profession, and make teaching a “first choice” career.
1. Designed a new teacher career path structure that has been exceptionally well received by the profession. School-based posts of senior teacher and education specialist have been created, which will allow for much greater promotion opportunities. In addition, an entirely new career path in “learning and teaching” will allow a teacher to progress to the most senior levels, equivalent to a school principal, without ever leaving the classroom, and the next step would be into the subject advisory services. Such teachers would however play a mentoring role in the induction of new recruits, and in supporting other teachers of the subject.
2. The Minister of Finance allocated R4.2 billion over the next three years to improve the service conditions of teachers. The money are distributed to
recruiting scarce skills into the profession, such as the appointment of 400 new maths and science teachers in the specialised dinaledi schools, ensure well-qualified teachers in some of our poorer urban and rural schools pay additional rewards for our top-performing teachers, over and above the current 1%
payable for “satisfactory” service provide career path benefits to ordinary teachers by creating a longer salary scale, up to
level 9 of the public service. This will allow a classroom teacher to progress to higher salary levels, where they would be able to earn up to R155 000 per annum.
3. The department has allocated and ring-fenced a substantial portion of the National Student Financial Aid Scheme that has supported a number of trainee teachers. Regrettably,
Page 18
this amount (R50 million per year) has not been fully utilised, and there is an acknowledged need to review this approach to the funding of student teachers.
One option that is promoted and increasingly being used is the payment of “full-cost” bursaries to trainee teachers by a provincial education department in return for a service contract for an equivalent period. This enables a department to target its support to students in particular fields, like maths and science, and to safely plan for the future. As needs arise, provinces will increase the number of bursaries to meet the demands.
4. Learnerships are also being pursued in the education sector, with the ETDP SETA supporting some 880 “learner teachers”, of whom the first cohort will be graduating at the end of this year. These “learner teachers” are currently studying through a university, while employed in a school at rates determined by the minister of labour. This is a flexible and cost effective approach to teacher education, and can be used to address urgent needs, but the difficulties of quality assurance in this new mode of delivery require ongoing attention.

Page 19

Page 20
1. INTRODUCTION 1.1 Background 1.2 Methodology 1.3 Limitations of the Methodology 1.1 Background The 1990 Jomtien (Thailand) Conference gave meaningful realization to the assertion in the Universal Declaration of Human Rights that “everyone has a right to education”. This conference resulted in the “World Declaration on Education for All (EFA): Meeting Basic Learning Needs”. A regional meeting held in Dakar (Senegal) in 2000 provided further impetus and a renewed commitment by African governments to meeting the targets of the EFA drive by 2015. In the Dakar Declaration, the following six goals were re-affirmed1:
(i) expanding and improving comprehensive early childhood care and education, especially for the most vulnerable and disadvantaged children;
(ii) ensuring that by 2015 all children, particularly girls, children in difficult
circumstances and those belonging to ethnic minorities, have access to and complete free and compulsory primary education of good quality;
(iii) ensuring that the learning needs of all young people and adults are met through
equitable access to appropriate learning and life skills programmes; (iv) achieving a 50 per cent improvement in levels of adult literacy by 2015, especially
for women, and equitable access to basic and continuing education for all adults; (v) eliminating gender disparities in primary and secondary education by 2005, and
achieving gender equality in education by 2015, with a focus on ensuring girls' full and equal access to and achievement in basic education of good quality; and
(vi) improving all aspects of the quality of education and ensuring excellence so that
recognized and measurable learning outcomes are achieved by all, especially in literacy, numeracy and essential life skills.
The Constitution of the Republic of South Africa commits the South African government to the progressive realization of these goals, as they are aligned also with the mandate espoused by the Millennium Development Goals (MDGs) adopted in September 2000 by the General Assembly of the United Nations. The South African constitution expresses a commitment to the right to basic education, unqualified by the availability of resources - or at least a progressive realization of this right. 1 DoE, 2002. “EDUCATION FOR ALL Status Report: South Africa”
Page 21
Eleven years into South Africa’s transition to democracy, few areas of education have remained untouched by the drive to overcome the legacy of apartheid. During this time a range of initiatives was introduced, aimed at improving access, equity and quality. To promote these initiatives, education expenditure was oriented to the achievement of equity and ceased to be determined on a racial basis. Improving the quality of education at all levels is probably the biggest challenge facing policy makers after slightly more than a decade of democracy. Teachers are a key enabling factor in improving the quality of education2. Without adequate numbers of high quality, motivated teachers, it is impossible to achieve improved quality education for all. To meet its commitment of quality education for all by 2015, the South African government must be able to:
• attract young and able people into the teaching profession; • provide adequate and appropriate teacher education; and • retain qualified teachers in the profession.
A recent study by the Human Sciences Research Council (HSRC)3 has suggested that there are conflicting views about the educator supply and demand situation in South Africa. In the early to mid-1990s it was generally accepted that there was an oversupply of educators in the country. This standpoint later changed, with most recent commentators pointing to a shortage of educators, especially in under-serviced areas. Under-service includes disparities in both geographical distribution and in the supply of teachers for specialized curricular needs. Observations by different researchers, including the HSRC, do indeed build a strong case for the assertion that there will soon be a major shortfall in the number of teachers available if factors affecting teacher supply are not adequately addressed. In a situation of serious skills shortages nationally, teaching now has to compete more vigorously with other career options for talented new recruits.
This report follows the suggested International Labour Organization (ILO) framework for analyzing teacher demand and supply. This framework is provided in detail in Appendix 1. In summary, however, the ILO framework seeks to achieve the following:
1. investigate the context of the national education system; 2. determine the composition of the teaching stock; 3. explore teacher candidates, recruitment, education and professional development; 4. examine the employment, careers, teaching and learning conditions; 5. investigate mechanisms of social dialogue and participatory decision-making in
education; and 6. make policy recommendations.
2 Education For All Global Monitoring Report, 2005 3 HSRC “The Health of our Educators” report, (2005)

Page 22
This section introduces the objectives of the report, the methodologies employed to obtain data for the report, and the limitations associated with the study. Section 2 explores how South Africa’s national education policy framework and system are aimed at improving access to and provision of quality education and in turn how these efforts contribute to the fulfilment of the EFA goals and targets for 2015. Section 3 provides a detailed look at the demographics that of the teaching stock. The section examines issues such as the gender imbalance, and identifies trends and projections based on historical data from South African research, as well as the implications for EFA 2015 campaign. Section 4 on Teacher Retention, provides an analysis of the major factors affecting the current retention rates in the teacher profession. The analysis also deals with some of factors influencing the attrition rate. The analysis leads to recommendations for strategies to retain teachers in the system under conditions conducive to willing service. Section 5 on the implications of HIV/AIDS for Teacher Supply and Demand, looks at studies undertaken on the rate of infection, on demographic trends, and on the scale of the problem as it applies to educators and the implications for the education system. Section 6 on Teacher Supply, investigates approaches to improving the number of suitable entrants into teacher training. It looks at the entrance requirements of Higher Education Institutions (HEIs), and the factors that mitigate against admission and success in the case of many candidates for the profession. The section discusses also the responsiveness of the HEI sector towards addressing the problems of candidates and their choices of specialisation, taking into account the needs in scarce subject areas. Section 7 concludes with a summary and a set of recommendations. 1.2. Methodology This research attempts a detailed analysis of the factors affecting, and the implications of, teacher shortages. It explores the ramifications for the system of present policies. Finally, it makes recommendations designed to enable the country attain the desired EFA goals by 2015, particularly by ensuring an adequate supply and distribution of quality teachers during the decade leading to this target date. A two-pronged approach has been employed: desktop research (a literature review of existing data), and empirical research. The desktop literature review was conducted to acquaint the research team with current and comparable research in the country. A survey was undertaken of government policy frameworks and other related documents to help understand the government’s response to the perceived threat of teacher shortages. Gaps in the required information base identified through the literature review were managed by using a triangulated approach comprising in-depth one-on-one interviews of educators, focus group interviews and administered questionnaires.

Page 23
The focus groups were located, and interviews conducted in 20 education districts, two of which were used as pilot sites. In the 20 focus groups, an average of 22 people attended the sessions. The focus groups used seven main themes for discussion. The educators were allowed to select any of the discussion topics at random and provide their insight and opinion on the topics and how the issues affect them. These themes were extracted from the terms of reference of the ILO. They are:
• professional development • professional assessment • recruitment and induction • careers and development • remuneration and material incentives • conditions of teaching and learning • reasons for and levels of teacher dis-satisfaction/ satisfaction.
The issues that were raised in each focus group were then captured under the themes that evoked their response. The focus groups were not meant to be representative of the entire spectrum of the teaching profession – hence the small numbers. Rather their composition was designed to capture the essence of individual South African educators’ experience, views and opinions, and to augment discussion of these themes by supplementing findings derived from the research data. Questionnaires were also developed for both teachers and management personnel in the offices of all Provincial Education Departments (PEDs). Nine hundred questionnaires were distributed, and the on-time return rate was 27%. The responses have been used to provide an indication of opinions and attitudes relating to the selected themes, from the perspectives of both the teacher corps and management at provincial level.
1.3. Limitations of the methodology First, the study is cognisant of the limitations and complexities associated with accurate modelling of teacher supply and demand requiring statistical information that has generally not been readily available in South Africa4. However, it must be pointed out that different studies conducted over the last three years, have been characterised by an improvement in the level and quality of the data, to the extent that inferential and statistical modelling becomes feasible. Secondly, data used in this study are based predominantly on the Department of Education’s (DoE) Education Management Information Systems (EMIS) annual publication of education statistics, primarily the most recent available report for 2003. Other data used are based on PERSAL (Personnel Salary System), which includes only educators employed by PEDs in the public sector. A data shortcoming relates to the unavailability of information on educators employed by (public) School Governing bodies (SGBs) and independent schools, except from the Annual School Survey conducted by the DoE EMIS directorate. 4 Hall, 2002

Page 24
Thirdly, during the conduct of this study, data from the Annual School Survey regarding educator information was not available from several provinces. Finally, the study also experienced limitations with regard to questionnaire returns. The disappointing 27 per cent return rate (out of 900 questionnaires distributed) may be attributed in part to a lack of co-operation by provincial office personnel.
Page 25
2. CONTEXT OF THE NATIONAL EDUCATION SYSTEM
2.1 Education Achievements since 1994 2.2 The Post-Apartheid Education Structure 2.3 The Legislative Framework 2.4 Enrolment Patterns 2.5 Curriculum 2.6 Financing Education 2.6 Other Factors influencing the Quality of Education
The first post-apartheid government inherited an education system that was characterized by racial and regional inequalities, inter alia, in the distribution of education resources and education outcomes. Although ongoing attempts to address quantitative inequalities are in place, there are still significant qualitative disparities. Nevertheless, access to education for all children has improved significantly since 1994 and the system can now account for more than 95% of children of school-going age. The government has made great efforts to ensure that the country is well placed towards meeting the EFA 2015 target of ensuring that every learner, especially those in the foundation phase of schooling, will have access to free education of acceptable quality. Policies for the redistributive allocation of resources also mean that the poorest learners are receiving a disproportionately larger share of the non-personnel budget than was the case in 19945. This is significant in that it represents a major step towards ensuring that all children in South Africa will have access to schooling irrespective of their household’s socio-economic status. The current education system itself is divided into three main bands: General Education (encompassing the Foundation, Intermediate and Senior school phases – Grades 1-9, and Adult Basic Education and Training), Further Education (Grades 10-12, leading to the school-leaving National Senior Certificate), and Higher Education. Each band is regarded for administrative purposes as a distinct area of operation, enabling the authorities to gauge learner performance, resourcing and the general health of the education sector. Transformation within the system has seen some blurring between the previously distinct elements of each phase. Some of this has been because of policy requirements such as that of life-long learning, which by its very nature requires a virtually seamless integration and overlap of the different bands. 5 Department of Education, 1994

Page 26
2.1. Education achievements since 1994 Over the past decade the DoE has made significant headway in its attempts to ensure increased access to and improved quality of education. Most of the achievements are in alignment with the EFA goals. They include: • Access to primary and secondary schooling has improved, with near universal enrolment in
primary schooling and an 86 per cent gross enrolment ratio in secondary schooling achieved by 2002. The participation rate among girls is also among the highest in the world.
• Access to school education was further enhanced by exempting poor learners from paying school fees and outlawing discrimination against, and exclusion of, learners who cannot afford school fees. A plan of action to progressively increase access to free education for all was made public in June 2003 and implementation for the poorest households commenced in 2005.
• Enhancing access to Higher Education institutions through the establishment of the National Student Financial Aid Scheme (NSFAS) in 1996. The Scheme disbursed over R2,6 billion to almost half-a-million students in HE institutions between 1996 and 2001.
• There has been an improvement in the performance of learners throughout the schooling system. This is noticeable in the Grade 12 Senior Certificate examination results where the pass rate improved from 53 per cent in 1999 to 68 per cent in 2002, and improved further to 73 per cent in 2004. A combination of factors, such as closer monitoring of poorly-performing schools, and directed professional development programmes aimed at improving educators’ skills capacity and teaching methodologies, have contributed to the improvement.
• There has been a general improvement in the qualifications of educators, with the previously large proportion of un- and under-qualified educators being reduced by means of in-service upgrading programmes. In 2000, 76 839 (22%) educators were considered unqualified or under-qualified, significantly down from 122 459 (36%) in 1994. In 2004, based on the School Educator Survey, the percentage of unqualified or under-qualified educators further declined to 8.3%.
• More equitable learner: educator ratios have been established. The ratios in secondary schools were reduced from an average of 43:1 in 1996 to 35:1 in 2000, through redeployment and post-provisioning strategies geared to favour areas of greatest need. This contributes to improved teaching and learning conditions.
• Per-capita expenditure on learners was increased from R2 222 in 1994 to R3 253 in 2000, while achieving greater inter-provincial equity.
• The Further Education and Training, and Higher Education sub-systems have been restructured to make their programmes more relevant to the needs of students and the economy and to reconfigure their institutional landscapes from an apartheid structure to a rationalized one that eliminates unnecessary duplication and promotes growth, rejuvenation and cooperation
Page 27
• The growth of democracy, and the promotion of values and moral regeneration, is being nurtured through the establishment of the South African History Project and the Values in Education Initiative. The Manifesto on Values, Education and Democracy, produced in 2001, laid the basis for a comprehensive and ongoing advocacy campaign, and provided a practical framework for instilling and reinforcing the values of the new South Africa in learners and promoting the concepts of democracy, national pride and identity in the classroom.
• A national strategy for mathematics, science and technology education was established in 2001. The strategy identifies 102 schools with a specific mandate to promote study in these fields, especially among girls, who were previously marginalized.
• Illiteracy is being reduced and literacy among the population as a whole improved through the establishment of the South African National Literacy Institute (SANLI), the reading advocacy project Masifunde-Sonke and Adult Basic Education and Training (ABET) programmes.
These achievements have made a direct contribution to the efforts of government to ensure increased access to and improved quality of education for all by 2015. The South African government has not only focussed on the achievement of the EFA goal of basic education for all, but has gone beyond that to include policy and operational regulations for other education sectors as well.
2.2. The post-apartheid education structure A major achievement of the government post-1994 was the dismantling of the race-segregated, unequally resourced educational structures, and their replacement by a single, cohesive national education system, which is organised and managed by the DoE in conjunction with nine PEDs. With the Constitution of South Africa as the supreme authority, structures and mechanisms were put in place throughout government to ensure that the principles of basic human rights and fundamental human dignity were restored to state operations. These principles tie in well with the values espoused by EFA and the MDGs, and reflect the concerted efforts being made to honour internationally-agreed aims in education. One of the these principles informed the establishment of a qualifications structure designed to enable learning paths to be charted throughout life, by means of effective articulation between programmes ranging from basic education to the most advanced levels of higher education. Formal education in South Africa is categorized according to the three bands and eight levels of the National Qualifications Framework (NQF) formulated by the South Africa Qualifications Authority (SAQA). The NQF is illustrated in Table 2.1.

Page 28
Table 2.1 National Qualifications Framework (NQF)
NQF Level Band Qualification Type
8
7
6
5
Higher Education and Training
• Post-doctoral research degrees • Doctorates • Masters degrees • Professional Qualifications • Honours degrees • First degrees • Higher diplomas • National diplomas • National certificates
Further Education and Training Certificate (FETC) – recently designated the National Senior Certificate (NSC) 4
3
2
Further Education and Training
Grade 12 National certificates
General Education and Training Certificate (GETC) 1 General Education
and Training
Grade 9 | ABET Level 4
National certificates Source: SAQA (South African Qualifications Authority)
• The General Education and Training (GET) band consists of the Reception Year (Grade R) and Grades 1-9 of formal schooling leading to an exit-level GET-Certificate, as well as an equivalent Adult Basic Education and Training (ABET) qualification.
• The Further Education and Training (FET) band consists of all education and training offered on NQF levels 2 to 4 (equivalent to Grades 10-12 in the ordinary school sector) and the National Technical Certificate levels 1 to 3 in FET colleges. The FET-Certificate is normally the minimum requirement for admission to Higher Education.
• The Higher Education (HE) band consists of a range of certificates, diplomas and degrees, up to and including post-doctoral degrees.
These levels are integrated within the NQF, as provided for by the SAQA Act (No. 58 of 1995). The main purpose of the NQF is to provide a standard framework for approving, assessing and evaluating qualifications, with the intention to establish quality within learning programmes and equity between those programmes offered on the same level. The NQF is an outcomes-based indicator of educational standards. Bench-marks for assessment of outcomes are intended to translate directly into qualitative enhancement of teaching and learning, and this has important implications for the supply of skilled and knowledgeable teachers for the formal school system.
Page 29
2.3. The legislative framework In South Africa, there is no separate EFA plan, distinct from national education priorities. Education development and education reform initiatives are integrated into national strategic plans, policies and programmes.6 All policies and education legislation introduced by the Ministry of Education since 1994 are aimed at transforming the national system of education and training. Although not developed with EFA goals as their starting points, the same policies are entirely compatible with the achievement of EFA targets. The DoE declares its vision as being:
A South Africa in which all its people have equal access to lifelong education and training opportunities, which will contribute towards improving their quality of life and building a peaceful, prosperous and democratic society.
The National Department of Education Policy and educational law apply this vision as a first principle. South African education policy is informed by the following legislation7:
• The Constitution of the Republic of South Africa, Act 108 of 1996, which guarantees the right of all South Africans to a basic education.
• The South African Schools Act of 1996 (SASA) forms the legal foundation for schools in the country. Compulsory education is the cornerstone of any modern, democratic society that aims to give all citizens a fair start in life and equal opportunities as adults. Government is, moreover, bound by the Constitution to progressively improve access to further education and training (FET: Grades 10 to 12 in schools). SASA promotes access, quality and democratic governance in the schooling system. It aims to ensure that all learners have access to quality education without discrimination and makes schooling compulsory for children aged seven to 15, or until the completion of the ninth grade, whichever occurs first. It provides for public and independent schools. Provision for democratic school governance through school governing bodies (SGBs) is in place in public schools country-wide. The school-funding norms outlined in the Act priorities redress in the pattern of education financing.
• The National Education Policy Act 27 of 1996 is designed to identify the policy and legislative powers, and the monitoring responsibilities, of the Minister of Education, and to formalize relations between national and provincial authorities. The Act established the Council of Education Ministers (CEM) and the Heads of Education Departments Committee (HEDCOM) as inter-governmental forums to collaborate in developing the education system. It also provides for the determination of national policies in General and Further Education and Training (GET and FET), including curriculum assessment, language policy and quality assurance. The Act embodies the principle of co-operative governance.
• The Further Education and Training Act (1998) and the Education White Paper 4 on FET provide the basis for developing a nationally co-ordinated system, comprising the senior-
6 DoE, 2002: “EDUCATION FOR ALL: Status Report, South Africa” 7 These legislative and policy frameworks are accessible in the open domain. URL. http://www.gov.za; DoE 2001, EDUCATION IN SOUTH AFRICA: Achievements since 1994

Page 30
secondary component of schooling and the former technical colleges. It requires that FET institutions, created in terms of the new legislation, develop institutional plans, and provides for programme-based funding and a national curriculum for learning and teaching.
• The Higher Education Act (1997) makes provision for a unified and nationally planned system of Higher Education and creates the statutory Council on Higher Education (CHE), which advises the Minister and is responsible for quality assurance and promotion. This Act and the National Plan for Higher Education form the basis for the transformation of the Higher Education sector. The Higher Education Amendment Act (2002) clarifies and brings legal certainty to labour and student matters regarding the mergers of public Higher Education institutions and provides clarity on the ministerial authority to take the decision to merge and to give a name and physical location to a new institution. The Higher Education Amendment Bill (2003) provides for the establishment of National Institutes for Higher Education in Mpumalanga and Northern Cape, the two provinces currently without a HEI within their borders. The institutes will serve as the administrative and governance hubs for the provision of higher education in response to regional needs.
• The Employment of Educators Act (Act 76 of 1998) regulates the professional, occupational, moral and ethical responsibilities and competencies of educators. A recent amendment to the Act enables a PED to control the placement of new recruits and applicants returning from a break in service, without requiring a recommendation from a governing body. It also aims to achieve a fair distribution of qualified educators by allowing provinces to relocate and distribute such educators, especially to schools in rural areas.
• The Adult Basic Education and Training Act (Act 52 of 2000) provides for the establishment of public and private adult-learning centres, funding for ABET provisioning, the governance of public centres, and quality-assurance mechanisms for the sector.
• The South African Qualifications Authority (SAQA) Act of 1995 provides for the creation of the NQF, which establishes the framework for a national learning system that integrates education and training at all levels.
• The South African Council for Educators (SACE) Act of 2000 provides for the establishment of a council to undertake the registration of educators, promote their professional development, and set, maintain and protect ethical and professional standards.
• The Education Laws Amendment Act (Act 50), and the Amendment Act (Act 63), came into effect during 2002. The former makes provision for amending the South African Schools Act (1996), to give clarity and certainty regarding the admission age to Grades R and 1 at public and independent schools. As a result of the amendment, the minimum age of admission has been lowered by six months. The compulsory school-going age remains seven to 15 years, or completion of Grade 9. A new section was also inserted to prohibit initiation practices at schools.

Page 31
Following legislation, the management and administration of education has been informed by vigorous and bold policy development and the development of appropriate institutional mechanisms for effective governance and administration of education. Appendix 3 describes some of this institutional apparatus. 2.4 Enrolment patterns Comparing learner population and learner enrolment, the potential learner population (6- to 18-year-olds) has been increasing from 1999 to 2003, but learner enrolment has been decreasing from 1997 to 2003. The decline in learner enrolment may be attributed to different entry points at Grade 1, increased learner throughput, fertility decline, increase in the proportion of vulnerable children (orphans, girls) with restricted access to school and enhanced provincial EMIS systems (HSRC, 2005). Using population-based data, the school-age population aged 6-13 grew by 1.4% per annum between 1999 and 2001 and by 1.2% per annum between 2001 and 2003. During the period 1999-2001 the school-age population aged 14-18 grew by 0.6% per annum and by 1.2% during the period 2001-2003, taking estimates of the impact of AIDS into consideration.
2.4.1 Numbers of learners by level of education Recent education statistics8 show that in 2003 there were 13 711 564 learners and students in all sectors of the education system – including public and independent ordinary schools, ABET centres, schools providing for Learners with Special Educational Needs (ELSEN), Early Child Development (ECD) sites, public FET colleges, and public and private HE institutions. Figure 2.1 shows the ratio of learners in public, independent and ‘other’ institutions respectively. Fig 2.1: Percentage of learners in the South African school system by category
Learner Distribution amongst Public, Independent and 'Other' Educational Institutions In South Africa
Public85.7%
Independent 2.2% Other Educ Inst.
12.2%
Source: DoE/EMIS, Education Statistics in South Africa at a Glance in 2003 8 Education Statistics in South Africa at a Glance in 2003

Page 32
‘Other’ educational institutions represent all the ABET centres, ELSEN schools, public FET colleges, ECD centres, and the public HEIs. This distribution indicates the extent to which the public ordinary school sector dominates the educational landscape, and thus demands a proportionally high level of attention in terms of policy development and resource allocation. Government priorities need also to take into account the distribution of learners in terms of levels of education. Fig 2.2: Percentage of learners in the South African school system by school level
Percentage Distribution of learners by School Level
Primary52.8%
Secondary29.8%
Combined14.2%
Interm/Middle3.2%
Source: DoE/EMIS, Education Statistics in South Africa at a Glance in 2003 Fig 2.2 illustrates the distribution of learners by school level. The percentages are representative only of those learners in the Ordinary Public and Ordinary Independent schools whose total learner enrolment, in 2003 was 12 038 922. Over half of the learners are in primary school, which is the main site of attention when measuring progress towards achievement of the EFA target of universal access to basic education. 2.4.2 Provincial distribution of learners It is not only the total number of learners and their stage of learning (the school phase in which they are enrolled) but also their geographical location that affects the demand for and distribution of educators in South Africa. Of the 12 million learners in ordinary schools in South Africa in 2003, 97 per cent were in public schools and 2.4 per cent were in independent schools. Distribution of learners between the nine provinces is unequal. If distribution of financial resources and human resources (mainly classroom teachers) is to be equitable, preference needs to be given to provinces proportional to the size of their learner cohorts. KwaZulu-Natal had the largest number of learners in ordinary schools (over thirteen times larger than the smallest province, Northern Cape), and the Eastern Cape the second largest number.

Page 33
Table 2.2. Number of learners by provincial distribution in ordinary public and ordinary independent schools
Province Ordinary
Public (OP) % of National Total of (OP)
Ordinary Independent
(OI) % of National Total of (OI) Total
Eastern Cape 2,100,024 17.9 16,402 5.6 2,116,426Free State 684,134 5.8 12,021 4.1 696,155Gauteng 1,524,595 13.0 137,222 46.5 1,661,817kwaZulu-Natal 2,726,271 23.2 56,780 19.3 2,783,051Limpopo 1,797,820 15.3 19,032 6.5 1,816,852Mpumalanga 901,732 7.7 13,007 4.4 914,739Northern Cape 199,229 1.7 2,781 0.9 202,010North-West 880,946 7.5 10,090 3.4 891,036Western Cape 929,262 7.9 27,574 9.4 956,836 11,744,013 294,909 12,038,922 EMIS-DoE, Education Statistics at a Glance in South Africa in 2003 The mainly rural provinces (KwaZulu-Natal, Eastern Cape, Limpopo, Mpumalanga and North-West are the largest in terms of learner numbers) tend to have proportionally more schools with fewer learners per school than the more urbanised provinces, which have higher learner: school ratios, an indication of higher population density, which is currently increasing at a rapid rate on account of large-scale urbanization. In 2003 the Eastern Cape, one of the more rural provinces, had 22.4 per cent of the national total of ordinary schools serving 17.9 per cent of South Africa’s learners. By way of comparison, Gauteng, the most urbanised province, had 8.4 per cent of the national total of ordinary schools serving 13.0 per cent of the country’s learners. In these cases, the disparities are stark. The monitoring of trends in teacher demand and supply needs to take into account these geographical imbalances. It also needs to consider the historical pattern in learner enrolment in public schools and its roll-on effect on teacher demand. Enrolments at primary school level have grown at a slow rate over the period, increasing by only 6 per cent over 10 years. In the most recent period enrolment has declined. Secondary enrolments have expanded more smoothly by more than 70 per cent over the same period. Typical gender disparities in enrolment (favouring males over females) have been reversed, with females outnumbering males in both the primary and secondary school sectors. The preponderance of female learners has, in fact, increased during recent years at the secondary school level. 2.4.3 Educator Numbers and Trends Figure 2.3 shows a clear trend in educator numbers. A five-year high teacher cohort in 1999 declines during 2000-2001, then increases significantly in 2002-2003. According to PERSAL, however, the total number of public educators declined from 386 735 in 1997/98 to 366 320 in the 2002/03 financial year. This represents a net change of educators of -5.3% from 1997/98 to 2002/03. The number of permanent educators remained stable, while temporary educators
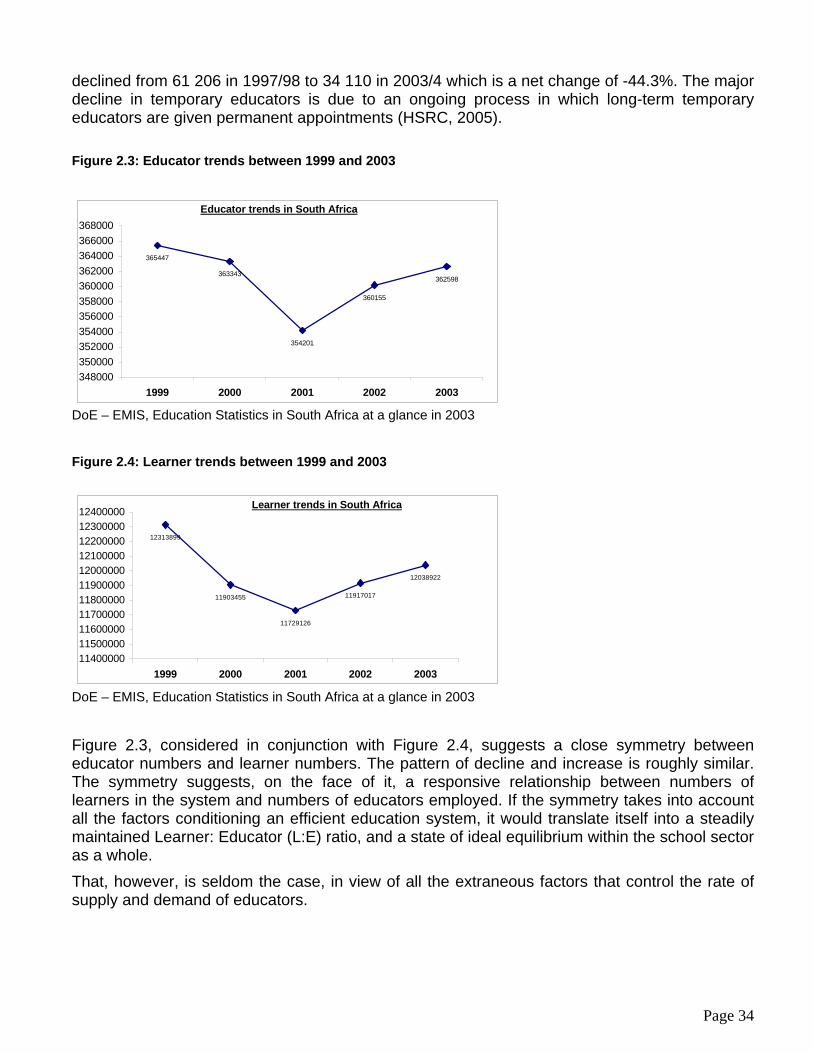
Page 34
declined from 61 206 in 1997/98 to 34 110 in 2003/4 which is a net change of -44.3%. The major decline in temporary educators is due to an ongoing process in which long-term temporary educators are given permanent appointments (HSRC, 2005). Figure 2.3: Educator trends between 1999 and 2003
DoE – EMIS, Education Statistics in South Africa at a glance in 2003
Figure 2.4: Learner trends between 1999 and 2003
DoE – EMIS, Education Statistics in South Africa at a glance in 2003
Figure 2.3, considered in conjunction with Figure 2.4, suggests a close symmetry between educator numbers and learner numbers. The pattern of decline and increase is roughly similar. The symmetry suggests, on the face of it, a responsive relationship between numbers of learners in the system and numbers of educators employed. If the symmetry takes into account all the factors conditioning an efficient education system, it would translate itself into a steadily maintained Learner: Educator (L:E) ratio, and a state of ideal equilibrium within the school sector as a whole. That, however, is seldom the case, in view of all the extraneous factors that control the rate of supply and demand of educators.
Educator trends in South Africa
365447
363343
354201
360155
362598
348000350000352000354000356000358000360000362000364000366000368000
1999 2000 2001 2002 2003
Learner trends in South Africa
12313899
11903455
11729126
11917017
12038922
1140000011500000116000001170000011800000119000001200000012100000122000001230000012400000
1999 2000 2001 2002 2003

Page 35
If the statistics on which Figures 2.3 and 2.4 are based are correct, then it would be safe to assume that the South African teacher supply and demand scenario is in a state of equilibrium. In other words, if the decline or increase in numbers of learners is matched by a concomitant decline or increase in educators (and the latter trend is fully capable of accounting fully for patterns of attrition and compensatory recruitment), then it would be reasonable to assert that there will be no shortage of teachers in South Africa, either in the short term or at any stage of target period for the achievement of EFA, that is, until 2015. However, the national picture masks certain provincial and regional disparities in learner numbers and changes in teacher supply. This could distort the overall picture. Cognisance must taken of the fact that there is a time lag between the reported state of learner enrolments and school needs, the implementation of the Post-Provisioning Norms (PPN), and the eventual hiring and deployment of teachers to schools in reported need. This lag or “deployment flux” would have the impact of distorting the demand and supply picture at any given time. If learner numbers continue to increase according to the pattern reported for 2002-2003 and the teacher supply were to diminish, then South Africa may well experience a shortage of educators in the very near or not too distant future.
2.4.4 Learner: educator ratios In 2003 the learner to educator ratio, based on SNAP surveys, was 35.1:1. This ratio has remained stable over the past five years. The target of the DoE is 40:1 for primary and 35:1 for secondary schools. DoE data, on the other hand, show that in 2003, the national average learner-to-educator ratio at ordinary schools in the country was 33.2, ranging, by province, from 29.4 in North-West to 35.9 in Mpumalanga. The national average for public ordinary schools was 34.6, and for independent schools, 12.6.9 Despite the DoE’s successes in reducing class sizes in historically disadvantaged schools, and despite a post-provisioning system that currently distributes slightly more educator posts to poor schools than to financially advantaged schools, there are still problems with unacceptably large class sizes in some schools. There are many reasons why this problem might persist including the following: Posts that have been created are not filled; educators are absent from schools, increasingly due to illness and inadequate physical infrastructure in many schools impels the formation of large classes. Fluctuations, during the period 1999-2003, in the learner population may be attributed to the following factors:
• different points and ages of entry into Grade 1;
• increased learner throughput; and
• increases in the proportion of vulnerable children with restricted access to school. 9 Department of Education, 2005.

Page 36
2.5 Curriculum
Curriculum is central to educational policy. When considered in its broadest sense, it provides a vision of what learning and teaching might be - including what is to be learned; processes of learning, teaching and assessment; relationships between learner and teacher; power and authority in the system and in the school. The way that learners experience curriculum in classrooms defines their education, and hence the quality and achievements of the system10.
Curriculum 2005 is the name given to the National Curriculum Framework introduced into schools in 1998 and is based on the concept of Outcomes-Based Education (OBE). The national DoE has since revised Curriculum 2005. The revised curriculum for schools comprise the Revised National Curriculum Statement for GET (Grades R-9) and the National Curriculum Statement for FET (Grades 10-12). Key features of the revised national curriculum include comprehensive outcomes and assessment standards that indicate the knowledge and skills required for each grade and learning area, and indicators of how progress should be assessed.
Although the new curriculum was not developed with the principles of EFA specifically in mind, it provides a vehicle for the provision of quality education for all. The new curriculum has many innovative and positive features, including the following:
• It breaks with the authoritarian and rote-learning styles of the past. • It is fundamentally committed to equality in teaching and training and recognizes the
urgent need to create more and better opportunities for entrance to and from all levels of teaching and training.
• It recognizes the skills and a qualification obtained in job-related training and identifies the need for lifelong learning.
• It promotes a more direct integration of learning and training, of knowledge and skills to educate and train people to apply them to their needs in the real world.
• It advocates more rational integration of knowledge and skills in different learning areas and emphasises co-operative learning and the development of a basic understanding of what is learned and why it is learned.
• It recognises the importance of an outcomes-based approach to teaching and training and promotes critical thinking and civic responsibility11.
The implications of the new curriculum for teacher provisioning are enormous. There has been a redefinition of the type of teacher now required to cater for the needs of the new curriculum. This redefinition has cost and time implications for the training and re-training of teachers. Since the commencement of a phased introduction of the revised curriculum into schools, it has become clear that there is an acute shortage of educators in the system who have received formal training in both Outcomes Based Education (OBE) and its relevance to a successful implementation of the new curriculum.
10 DoE, 2001. 11 Martin Legassick Web document review: http://www.unisa.ac.za/default.asp?Cmd=ViewContent&ContentID=1213&P_ForPrint=1

Page 37
A further complication relates to the fact that there are historical shortages in critical learning areas such as mathematics, science and technology. All this means that an increasing number of highly talented and motivated people need to be attracted to teaching these subjects. These shortages – both quantitative and qualitative – are crucial to consider if EFA targets are to include effective basic education in numeracy and essential technological skills .
2.6 Financing education Increased and more equitable financing can lead to improved access and improved provisioning of quality education. Compared with most other countries, education in South Africa gets a large slice of the national budget - usually about 20% of the total. In the 2005 budget, education was allocated 18 per cent of total expenditure (the combined spending by national government and the provinces will total R82 billion), the highest allocation by far of any line ministry. Of this amount, R12.3 billion goes to the national DoE, and the rest is apportioned to PEDs, mostly for the costs of public ordinary schooling. In addition to greater equity in the provision of financial resources to provinces, the DoE has developed a set of norms and standards to ensure more effective targeting of funds to poorer schools ( a full description of this process is provided in Appendix 5). One of the challenges faced by the PEDs, however, is a consistent growth in the percentage of the budget expended on personnel costs; this threatens to squeeze the funding of other essentials, like new school buildings, upgrading of facilities, and the wide-spread provision of learning support materials. However, collaborative efforts between the national and provincial departments of education are leading to a steady decline in expenditure on personnel. The DoE has set a minimum target of R1.2 billion for the procurement and delivery of learning support materials. Each province allocates a budget for its own learning support material requirements. The total learning support material allocation for the school year 2002 calculated from the individual budget allocations of all the provinces met that minimum target. While the target was reached over a period of three years, the challenge in the coming years will be to maintain this level of funding for learning support. Although the government is intent on rectifying the imbalances in education, the apartheid legacy lingers on. The greatest challenges lie in the poorer, rural provinces such as the Eastern Cape and KwaZulu-Natal. But even in the more affluent provinces like Gauteng and the Western Cape, schools that are generally perceived to be better resourced still experience shortfalls in provision. However, many of the financial problems facing the sector stem from the failure of some provinces to manage their spending properly.
Page 38
2.7 Other factors affecting the provision of quality education The following factors have been found to impact negatively on the quality of teaching and learning in South African primary schools:
• The physical environment of many schools is not conducive to quality teaching and learning. About 25 per cent of primary and combined schools have no access to water within walking distance. Nearly half (48.6 per cent) of primary and combined schools use pit latrines and these are often insufficient in number, over-utilized, unclean and smelly. Another 13.5 per cent have no sanitary facilities at all. Such sanitary conditions pose health hazards to learners and educators alike.
• The majority of schools (56.2 per cent) have no access to electricity. Poor lighting and visual conditions in these schools hamper the learning process. Lack of electricity also prevents the use of modern teaching and learning aids and equipment. About 5 per cent of schools have decrepit and dilapidated buildings that are unsafe and unsuitable for teaching and learning.
• Most schools lack adequate supplies of teaching and learning materials. Even when available the materials are sometimes ineffectively used. The lack of lockable storage facilities makes it difficult to safeguard existing materials. Even where educational technology is available, it is often not used because of concerns for the security of equipment. In other cases, teachers have not been adequately prepared for the use of equipment or learning aids. There is a need for timely and adequate provision of educational materials and lockable storage facilities, as well as the appropriate training of educators in sound application to the classroom of available resources12.
12 DoE; Education for All (EFA) 2000 Assessment

Page 39
3. COMPOSITION OF THE TEACHING STOCK: IMPACT ON TEACHER SUPPLY AND DEMAND 3.1 Teacher Numbers 3.2 Gender Distribution 3.3 Age Distribution 3.4 Geographic Distribution 3.5 Teacher Qualifications 3.6 Professional Development 3.7 New Recruitment The present composition of the teacher stock portrays a profession with an attrition rate that is not balanced by an adequate supply of new educators. What implications these imbalances will have for the EFA target of 2015 for universal basic education can only be deduced from a trends analysis and an examination of critical factors influencing supply and demand. If there is to be equilibrium in the supply and demand of educators, the number of educators leaving the teaching profession needs to be balanced by the number entering the profession. According the DoE in 2004, a reported forecast of teacher demand and supply suggested a large and looming supply-side shortage, arising, inter alia, from the short-term administrative measures taken to control enrolment in teacher training and the lack of enthusiasm by learners to enrol as potential teachers. These factors, coupled with demographic changes and the impact of HIV/ AIDS, have created a situation where future demand is likely to be significantly larger than supply. In this section we analyse the profile of the existing teacher corps by analysing the number of teachers in the system by gender, age, geographic and qualification level distribution. We explore the implications of such composition for the provision of quality education now and in the decade leading to 2015.
3.1. Teacher numbers Research conducted between 1997 and as recently as May 2005, on teacher supply and demand has led to an understanding by stakeholders within the system that there are presently no quantitative shortages. However, the same studies have made it clear that if present attrition and turnover issues are not addressed, whether related to HIV/AIDS or not, the implications can be devastating for the provision of quality teachers to the system. They point to shortages in educator supply and increased costs in recruitment, training, development and mentoring. Projections of quantitative shortages are based on the anticipated effects of • the impact of HIV and Aids on educators; • fewer candidates entering the teaching profession;

Page 40
• attrition rates among educators as a result of factors other than HIV and AIDS; and • trends in learner enrolments.
Although there has been uncertainty about the supply of educators in South Africa, given the large stock of unemployed or under-employed people who have been trained as educators, and of qualified teachers currently employed in sectors outside of education, there would appear to exist the capacity to ease the urgent pressure to train new educators13. It is, however, important to note that while there are teachers who have left the profession but who could become available should there be an immediate shortage, low levels of job satisfaction might impact negatively on the ready supply of these and other potential educators14. According to the DoE, as at 30 July 2004 there were 369,575 teachers in the public system, with more than half of this number aged less than 35 years old and one third having less than five years experience15. The majority of educators, however, have had at least 10 years teaching experience. This figure reflects an increase in comparison with 2003 and previous years. Figure 3.1 below16 shows 369 575 teachers in the different components and levels of the ordinary public education system. Figure 3.1 also shows a steady decline in teacher numbers between 1999 and 2003. In 1999 there were 351,158 educators, compared to 334,676 educators in 2003. But 2004 shows a peaking, that has yet to be rationally explained. If the previous decline had continued and was not matched by a decline in learner numbers, or matched by an adequate supply of new educators into the system, then South Africa was potentially in a position to experience serious shortages. Figure 3.1: Educator numbers over a 6-year period from 1999 - 2004
Numbers of Teachers in the Ordinary Public School System Between 1999 and 2004
351158348362
339344 339806
334676
369575
310000
320000
330000
340000
350000
360000
370000
380000
1999 2000 2001 2002 2003 2004
Department of Education: “Education Statistics at a Glance” 2003: and PERSAL 2004 13 HSRC 2005, “Factors Determining Educator Supply And Demand In South African Public Schools” 14 Ibid 15 Department of Education, 2004 16 Source: DoE – EMIS Education Statistics at a Glance 2003 and PERSAL 2004

Page 41
The decline during 1999-2003 is believed to be due to a reduction in the number of temporary educators, and also an extensive rationalization process resulting in the granting of voluntary severance packages by PEDs in the mid-to-late 1990s. Fig 3.2 Numbers of teachers in the ordinary independent school system
Department of Education: “Education Statistics at a Glance” 2003: and PERSAL 2004 While the number of permanent educators has remained stable, there is significant provincial variation. The study revealed that the most significant and consistent provincial decline was in the Western Cape where the average number of educators decreased by over 15 per cent in this period, followed by Limpopo and the Free State. The only province to register any noticeable increase in educator numbers was North West.17. The independent schools sector on the other hand, recorded steady growth until 2002, but then experienced a significant increase of 47 per cent in 2003 (Fig. 3.2). Although the 2004 data reflect an increase in the number of ordinary public school teachers, it is too early to conclude that the tide has turned. Projections indicate that, for there to be sustainability, the education system requires a steady flow of newly qualified teachers. Normal attrition from the system runs at between 5 and 5.5 per cent per annum. This implies that South Africa needs approximately between 20,000 and 30,000 new teachers per annum over the next decade18. South Africa’s initial teacher education system is currently not able to produce these numbers. At best the training institutions produce a third of the projected figures (between 5000 and 7000 per annum)19. This indicates that if teacher output does not improve dramatically, the country could face a severe shortage of educators in the next decade.
17 HSRC MTT STUDY 2005 18 Crouch – An analysis of teacher supply and demand (April, 2001) 19 A National Framework for Teacher Education in South Africa June 2005
Numbers of Teachers in the Ordinary Independent Schooling System between 1999 and 2003
14 228 14 981 14 857 15 924
23 419
5 000
10 000
15 000
20 000
25 000
1999 2000 2001 2002 2003

Page 42
Fig 3.3 Numbers of teachers in the “other” educational institutions/centres
Department of Education: “Education Statistics at a Glance” 2003: and PERSAL 2004 Figure 3.3 shows the number of teachers in “other” educational institutions. This part of the system comprises the ECD, FET, ABET, ELSEN and HE sub-sectors. Insofar as teacher numbers are concerned, these sub-sectors appear, collectively, to be basically stable, but there is also a considerable degree of transformation occurring within them, with consequent relatively high levels of instability in many of the centres of learning. Reliable data from these sectors will only be available once emerging policy for these sub-sectors has been implemented on a longer-term basis.
3.2. Gender distribution In South Africa, women dominate the profession with respect to numbers. Seventy one per cent of all teachers are women. The dominance of female teachers in the public sector, most particularly in primary schooling (Foundation and Intermediate phases), mirrors an important aspect of gender roles in the society20. The overall gender imbalance in the profession reflects what many educators consider an inadequate presence of male role models in the field of teaching.
20 HSRC, 2005
Numbers of Teachers in the Other Educational Institutions/Centres in South Africa between 1999 and 2003
52 821
60 752 61 175 57 918
63 697
10 000
20 000
30 000
40 000
50 000
60 000
70 000
1999 2000 2001 2002 2003

Page 43
Figure 3.4 Percentage gender distribution of teachers by province
12.8
%5.
4%
4.0%
2.3%
8.9%
3.7%
14.9
%
6.6%
9.0%
7.1%
4.7%
2.6%
1.2% 0.
7%
6.0%
2.7%
4.8%
2.7%
0.0%
5.0%
10.0%
15.0%
20.0%
25.0%
EC FS GA KZ LP MP NC NW WC
Provinces
Gender Distribution of Educators in South Africa
MaleFemale
%
Department of Education PERSAL, October 2004 As is evident from Figure 3.4, the predominance of women in the teaching profession characterizes not only the national scenario, but is a feature in every province, whether the province is mainly rural- or urban-based. This gender ratio has not changed significantly over the past seven years. At primary school level by province, women teachers account for between 67 and 75 per cent (the lowest percentage being in Limpopo).21 At the secondary level female teachers represent approximately half the teaching force. An increased ratio of female teachers has recently manifested itself as a world-wide trend, characteristic of all levels of education, although particularly noticeable in pre-primary and primary education. A by-product of this is a growing shortage of male role models in teaching, which has a number of effects on learners, one of which is that it tends to undermine attempts to attract male candidates into the teaching profession. This has an impact on supply, especially for certain critical subjects which conventionally attract more male than female learners. While the number of female teachers has been rising overall, it has not been increasing, to any comparable or significant degree, in secondary specialist areas such as Science and Mathematics. This presents a challenge to education authorities either to encourage more female educators to specialize in these learning areas or to design strategies to attract more males into taking these subjects in the teaching profession. Given the current qualitative shortages and projected shortfalls in these areas, both strategies will probably be necessary. Despite the increasing feminisation of the teaching profession, women are still under-represented in management positions in schools in the majority of provinces. Only pre-primary schools and primary schools are largely under the managerial responsibility of women. 21 HSRC 2005
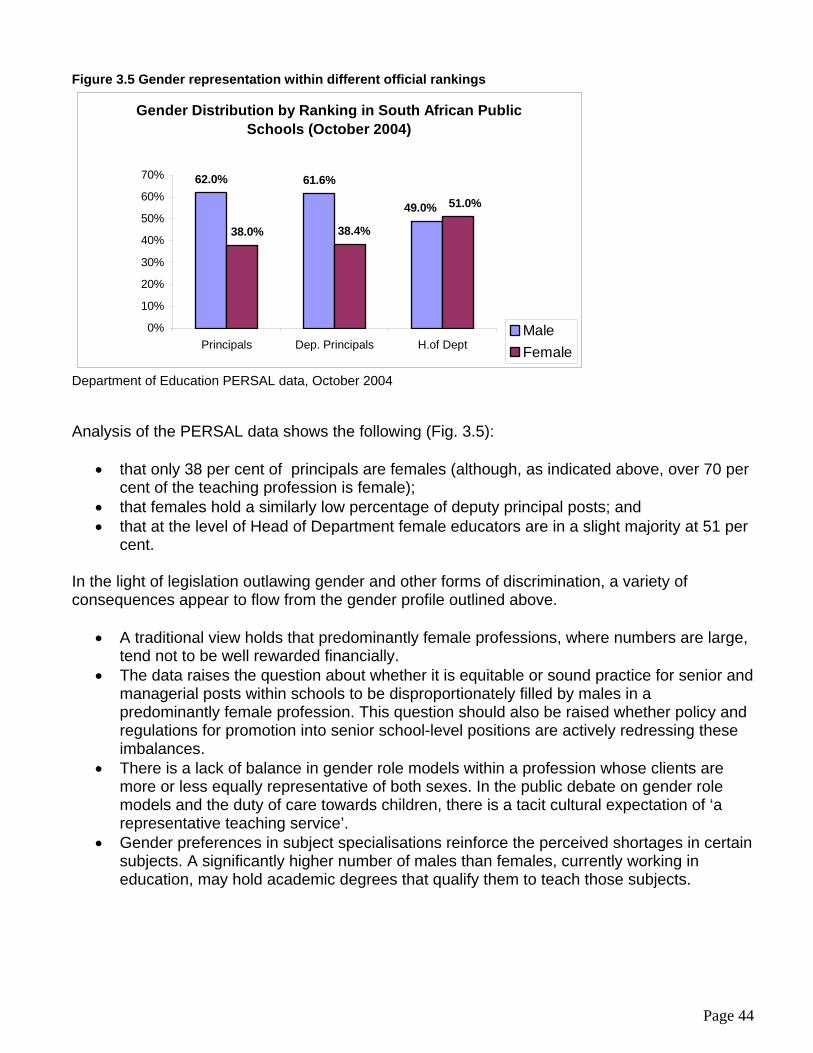
Page 44
Figure 3.5 Gender representation within different official rankings
Gender Distribution by Ranking in South African Public Schools (October 2004)
62.0% 61.6%
49.0%
38.4%38.0%
51.0%
0%
10%
20%
30%
40%
50%
60%
70%
Principals Dep. Principals H.of DeptMaleFemale
Department of Education PERSAL data, October 2004 Analysis of the PERSAL data shows the following (Fig. 3.5):
• that only 38 per cent of principals are females (although, as indicated above, over 70 per cent of the teaching profession is female);
• that females hold a similarly low percentage of deputy principal posts; and • that at the level of Head of Department female educators are in a slight majority at 51 per
cent. In the light of legislation outlawing gender and other forms of discrimination, a variety of consequences appear to flow from the gender profile outlined above.
• A traditional view holds that predominantly female professions, where numbers are large, tend not to be well rewarded financially.
• The data raises the question about whether it is equitable or sound practice for senior and managerial posts within schools to be disproportionately filled by males in a predominantly female profession. This question should also be raised whether policy and regulations for promotion into senior school-level positions are actively redressing these imbalances.
• There is a lack of balance in gender role models within a profession whose clients are more or less equally representative of both sexes. In the public debate on gender role models and the duty of care towards children, there is a tacit cultural expectation of ‘a representative teaching service’.
• Gender preferences in subject specialisations reinforce the perceived shortages in certain subjects. A significantly higher number of males than females, currently working in education, may hold academic degrees that qualify them to teach those subjects.
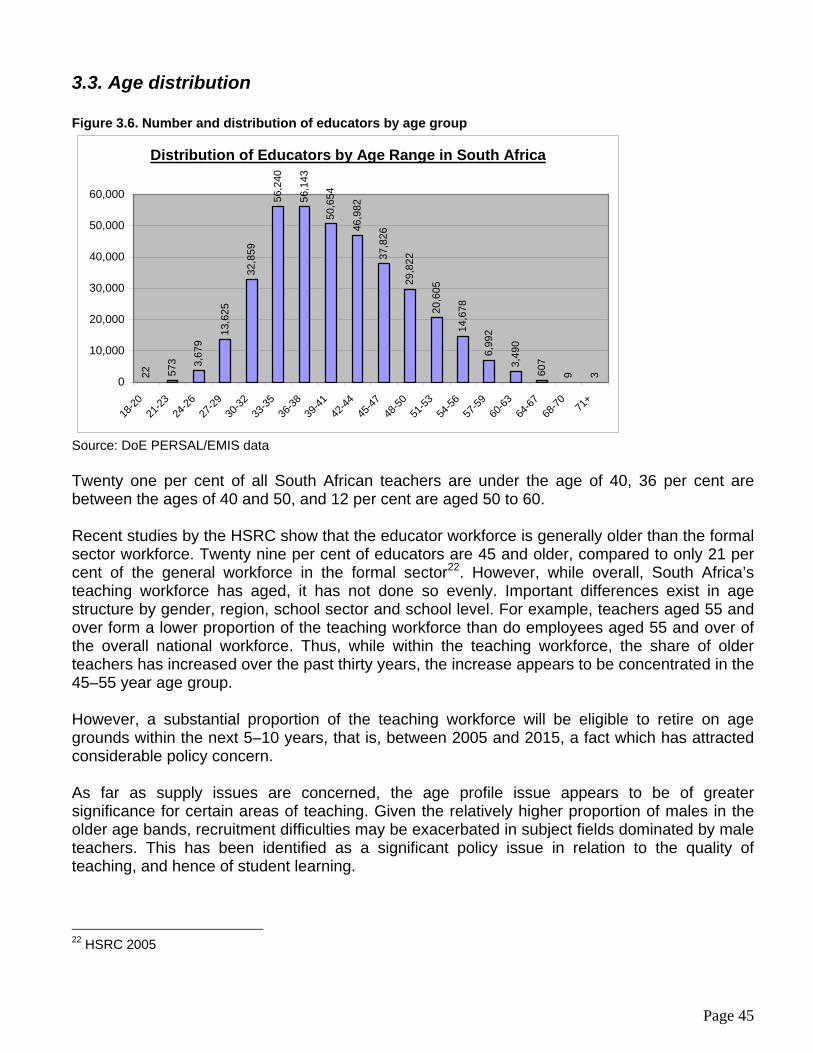
Page 45
3.3. Age distribution Figure 3.6. Number and distribution of educators by age group
Distribution of Educators by Age Range in South Africa22 57
3 3,67
9
13,6
25
32,8
59
56,2
40
56,1
43
50,6
54
46,9
82
37,8
26
29,8
22
20,6
05
14,6
78
6,99
2
3,49
0
607
9 30
10,000
20,000
30,000
40,000
50,000
60,000
18-20
21-23
24-26
27-29
30-32
33-35
36-38
39-41
42-44
45-47
48-50
51-53
54-56
57-59
60-63
64-67
68-70 71
+
Source: DoE PERSAL/EMIS data Twenty one per cent of all South African teachers are under the age of 40, 36 per cent are between the ages of 40 and 50, and 12 per cent are aged 50 to 60. Recent studies by the HSRC show that the educator workforce is generally older than the formal sector workforce. Twenty nine per cent of educators are 45 and older, compared to only 21 per cent of the general workforce in the formal sector22. However, while overall, South Africa’s teaching workforce has aged, it has not done so evenly. Important differences exist in age structure by gender, region, school sector and school level. For example, teachers aged 55 and over form a lower proportion of the teaching workforce than do employees aged 55 and over of the overall national workforce. Thus, while within the teaching workforce, the share of older teachers has increased over the past thirty years, the increase appears to be concentrated in the 45–55 year age group. However, a substantial proportion of the teaching workforce will be eligible to retire on age grounds within the next 5–10 years, that is, between 2005 and 2015, a fact which has attracted considerable policy concern. As far as supply issues are concerned, the age profile issue appears to be of greater significance for certain areas of teaching. Given the relatively higher proportion of males in the older age bands, recruitment difficulties may be exacerbated in subject fields dominated by male teachers. This has been identified as a significant policy issue in relation to the quality of teaching, and hence of student learning.
22 HSRC 2005

Page 46
On the one hand, while older teachers may be highly experienced and confident in their teaching role, there is also a need for updated curriculum knowledge and pedagogical procedures, as well as for rethinking the structure of a teaching career. However, this need not entail ‘new blood’ policies, but might take the form of new opportunities for professional learning for older, highly experienced teachers. Nevertheless, if an increased number of younger candidates do not enter the teaching profession, and remain in it for an extended period, the teaching profession will be impacted on negatively. There will be inadequate numbers to replace those who leave the profession due to age. To avert an imminent shortage, government must embark on an intense drive to interest younger people into the profession.
3.4. Geographic distribution The distribution of educators is uneven. Rural areas experience both qualitative and quantitative shortages. One of the major difficulties experienced by the DoE is recruiting new teachers to rural schools. This problem is exacerbated by the centralization in urban areas of HEIs offering teacher education programmes. Most rural teacher candidates who train in these institutions never go back to their rural context. Instead, they seek employment in the urban environments in which they trained. Teachers in rural contexts also find access to teacher development programmes difficult because of their geographic isolation. If this trend continues, rural schools will continue to experience teacher shortages. To address this problem the DoE must engage in a recruitment drive amongst rural communities with new entrants being offered bursaries together with an induction year in rural areas23. In addition, the DoE needs to consider the establishment of satellite-training centres to encourage candidates to train in their own environment, thereby reducing the migration rate of students, once qualified, from rural areas to urban schools.
3.5. Teacher qualifications Qualified teachers are amongst a nation’s most valuable resources as they contribute towards ensuring quality education, and a continued flow of skilled young people into the economy. Qualified teachers have a noticeable impact on the quality of education.24 However, teacher qualifications per se are only one of the input factors for quality education. Teacher competence is a combination of academic knowledge and methodology; academic skills are not enough to have a positive influence on learners’ results, and a broader teaching competence is also necessary. It is important that teacher qualifications should, through the design of their learning programmes, take into account, and attempt to address the serious lack of educators in critical learning areas such as Mathematics, Science, and Technology; this lack is, at least in part, a result of an absence in the past of adequate planning to ensure that recruitment drives and programme design take into account the actual needs of the school sector, in terms of scarce subject areas and the capacity of teachers to implement outcomes-based approaches to teaching, learning and assessment. 23 Ministerial report on rural education 2005 24 Nilsson, 2003, 4

Page 47
The current qualification framework is specified in the Norms and Standards for Educators, published in 2000. Currently, 77 per cent of South Africa’s teachers have a three-year qualification (a Diploma in Education). The framework has raised the minimum qualification requirement for all new teachers from a three-year post-school level (REQV 13) to a four-year professional degree level (REQV 14). For the present, educators on REQV 13 will continue to be regarded as adequately qualified for employment, but all new educators joining the teaching profession will be required to obtain the minimum of an REQV 14 qualification.
The DoE has introduced initiatives to reduce levels of under-qualification in its teacher workforce, mainly through offering an interim in-service, site-based upgrading qualification, the National Professional Diploma in Education (NPDE). As a result of these initiatives, the total number of unqualified and under-qualified educators has been reduced significantly since 1994, when as much as 36 per cent of the workforce fell into this category, having increased consistently during the previous two decades. By 2001, the proportion of unqualified and under-qualified educators had fallen to 18 per cent. According to an ELRC/HSRC study conducted in 2005, in the previous year the cohort of unqualified or under-qualified educators seems to have further declined to 8.3 per cent25. The rate was higher in primary (11 per cent) than secondary schools (2.8 per cent), higher in rural (9 per cent) than in urban schools (7.5 per cent), higher among Coloured (13.8 per cent) than White educators (2.2 per cent), and above 10 per cent in four provinces: North-West, Free State, Northern Cape and Western Cape. The current distribution of educators by qualification (and REQV) levels is illustrated in Figure 3.7. Qualification and REQV levels do not, however, tell the whole story. For instance, there is a lack of educators with adequate training in Outcomes-Based Education (OBE), and in the new school curriculum (RNCS). Only new graduates would have received training in OBE and RNCS. Although training has been offered to established teachers to enable them to practice OBE in their classroom, critics have highlighted the fact that the training they receive is inadequate and of low quality. The new curriculum introduced requires a different breed of an educator, trained in new skills, and capable of playing diverse educational roles. On-going professional development programmes need to continued, but with greater emphasis being placed on careful assessment of their mpact on actual classroom practice, and their long-term benefits to teaching and learning.
25 The HSRC 2002

Page 48
Figure 3.7: Distribution of educators by REQV level.
6,992 9,289
36,494
134,509
116,632
39,539
14,1111,694
0
20,000
40,000
60,000
80,000
100,000
120,000
140,000
10 11 12 13 14 15 16 17
REQV level
Distribution of Educators by REQV level as per October 2004
Source: PERSAL, October 2004
3.6. Professional development to address qualitative shortages South African teachers participate in a variety of formal and informal professional development activities on a continuing basis throughout their teaching careers. Traditional formats for these activities include half or full-day workshops and programmes sponsored by PEDs, school districts, professional associations, and other organizations; and courses taken outside the teacher education system, such as university extension, adult education or college courses. In 2005, the Ministerial Committee on Teacher Education formulated a National Framework for Teacher Education that will enable the development of a coherent teacher education system. It will also act as a guide to processes aimed at addressing qualitative shortages in the teaching profession. The framework suggested the establishment of a dedicated Continuing Professional Teacher Development (CPTD) project that will try to ensure that the substantial resources currently devoted to the professional development of teachers are effectively used in contributing to the lasting improvement of the quality of teaching, amongst other things. The suggested CPTD will take the shape of activities endorsed by SACE and will be allocated professional development points in line with the NQF26. In addition, both a Teacher Development section and an Educator Human Resource Planning Chief Directorate have been established in the DoE to address the crucial field of teacher and professional development. The focus has been on two areas: ongoing programme delivery, and longer-term planning and policy development. In addition, upgrading programmes (NPDE and Advanced Certificate in Education) programmes have been in place to address qualitative shortages. About 2,000 educators in the fields of
26 A National Framework for Teacher Education In South Africa, June 2005

Page 49
Mathematics, Science and technology have enrolled for these programmes upgrading and improving their content knowledge and teaching skills. A number of projects are being undertaken also by non-governmental organisations with regard to Mathematics and Science. These include:
• PROTEC, which has a number of existing teacher training projects for FET Mathematics, Science and English teachers in Limpopo, Northern Cape, Gauteng and the Free State. PROTEC currently trains intermediate phase Science and technology teachers.
• The Sediba project, which allows teachers to upgrade their qualifications in Mathematics,
Science and technology by doing an NPDE, HED or a B Ed with an accredited institution. It focuses on subject development of teachers at FET and first year university level.
• The Quality Learning Programme, which deals with Mathematics at GET and FET level
but also does Science and school management.
• The Dinaledi project, which is a national project involving 102 schools across the country. It is an improvement program that includes Mathematics and Science teacher training and resourcing of schools.
• The Thinthana project, a national project which focuses on upgrading Mathematics and
Science provisioning at FET level. It was led in the North-West Province by RADMASTE and engages Mathematics and Science teachers in about six days of training on selected topics per year. It supplies schools with VCRs and TVs, Maths and Science videos, Science kits and access to IT facilities set up in hub schools.
All the above projects are critical to the process of upgrading the skills of teacher candidates and teachers in the force, so that the quality of the teaching staff will not become a major stumbling block to the attainment of the EFA 2015 goals. More training for teachers in specialist learning areas is imperative. Furthermore, quality education means much more than improved training qualifications. Qualifications are only one aspect of quality learning - teacher experience, classroom curriculum; teaching and learning conditions including adequate financing of education, school management and school leadership are some of the other factors affecting the provision of quality education. 3.7 New recruitment Younger students, however, appear to be reluctant to adopt teaching as a career. The appeal of teaching as a career has decreased over the years. A recent HSRC27 study showed that a career in education, training and development was considered by only 1.5 per cent of the sample surveyed (Table 3.1) when compared with aspirations towards a career in Business, Commerce and Management at 26.6 per cent, Manufacturing, Engineering and Technology (16.2 per cent) and Health Sciences and Social Services (14.6 per cent). 27 Cosser, 2003
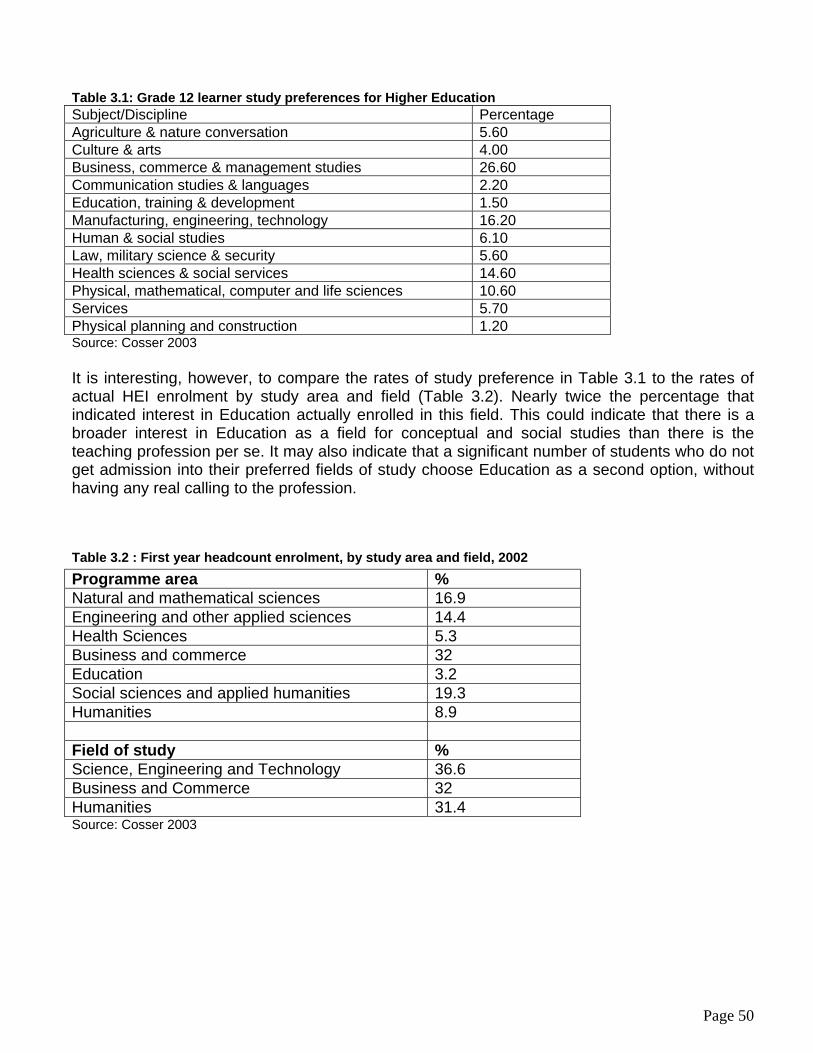
Page 50
Table 3.1: Grade 12 learner study preferences for Higher Education Subject/Discipline Percentage Agriculture & nature conversation 5.60 Culture & arts 4.00 Business, commerce & management studies 26.60 Communication studies & languages 2.20 Education, training & development 1.50 Manufacturing, engineering, technology 16.20 Human & social studies 6.10 Law, military science & security 5.60 Health sciences & social services 14.60 Physical, mathematical, computer and life sciences 10.60 Services 5.70 Physical planning and construction 1.20 Source: Cosser 2003 It is interesting, however, to compare the rates of study preference in Table 3.1 to the rates of actual HEI enrolment by study area and field (Table 3.2). Nearly twice the percentage that indicated interest in Education actually enrolled in this field. This could indicate that there is a broader interest in Education as a field for conceptual and social studies than there is the teaching profession per se. It may also indicate that a significant number of students who do not get admission into their preferred fields of study choose Education as a second option, without having any real calling to the profession.
Table 3.2 : First year headcount enrolment, by study area and field, 2002
Programme area % Natural and mathematical sciences 16.9 Engineering and other applied sciences 14.4 Health Sciences 5.3 Business and commerce 32 Education 3.2 Social sciences and applied humanities 19.3 Humanities 8.9 Field of study % Science, Engineering and Technology 36.6 Business and Commerce 32 Humanities 31.4 Source: Cosser 2003
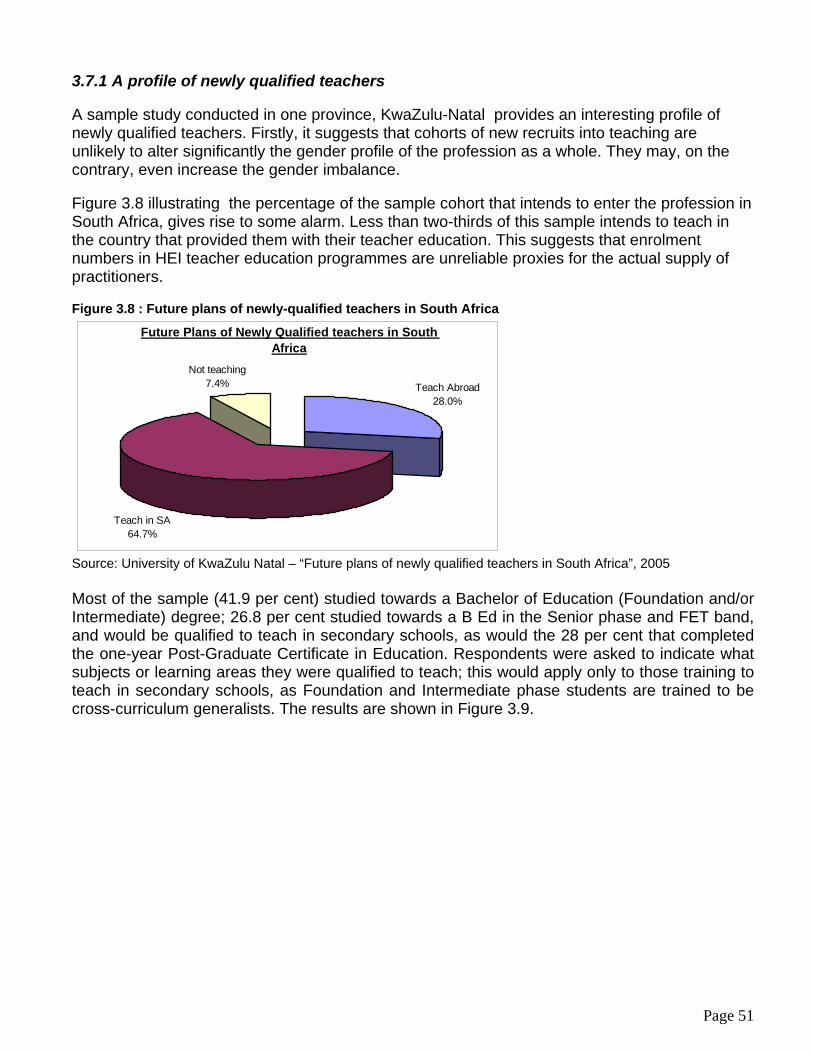
Page 51
3.7.1 A profile of newly qualified teachers A sample study conducted in one province, KwaZulu-Natal provides an interesting profile of newly qualified teachers. Firstly, it suggests that cohorts of new recruits into teaching are unlikely to alter significantly the gender profile of the profession as a whole. They may, on the contrary, even increase the gender imbalance. Figure 3.8 illustrating the percentage of the sample cohort that intends to enter the profession in South Africa, gives rise to some alarm. Less than two-thirds of this sample intends to teach in the country that provided them with their teacher education. This suggests that enrolment numbers in HEI teacher education programmes are unreliable proxies for the actual supply of practitioners. Figure 3.8 : Future plans of newly-qualified teachers in South Africa
Future Plans of Newly Qualified teachers in South Africa
Teach Abroad28.0%
Teach in SA64.7%
Not teaching7.4%
Source: University of KwaZulu Natal – “Future plans of newly qualified teachers in South Africa”, 2005 Most of the sample (41.9 per cent) studied towards a Bachelor of Education (Foundation and/or Intermediate) degree; 26.8 per cent studied towards a B Ed in the Senior phase and FET band, and would be qualified to teach in secondary schools, as would the 28 per cent that completed the one-year Post-Graduate Certificate in Education. Respondents were asked to indicate what subjects or learning areas they were qualified to teach; this would apply only to those training to teach in secondary schools, as Foundation and Intermediate phase students are trained to be cross-curriculum generalists. The results are shown in Figure 3.9.

Page 52
Figure 3.9: Subjects / Learning Areas of specialisation of newly-qualified teachers
Engl
ish
Life
Orie
ntat
ion
Mat
hem
atic
s
Nat
ural
sci
ence
Tech
nolo
gy
Eco
nom
ic &
man
gmt s
cien
ces
Eco
nom
ics
& b
us.s
tudi
es
Geo
grap
hy
His
tory
Acco
untin
g
Phy
sica
l Sci
ence
Afri
kaan
s
0
20
40
60
80
100
120
140 Top 12 Subject / Learning Area choices at HET Institutions
Source: University of KwaZulu Natal – “Future plans of newly qualified teachers in South Africa”, 2005 The figures show that, in this sample, the subjects/Learning Areas that most teachers are qualified to teach are English, Mathematics, Natural Science, Life Orientation and Technology. These figures correlate with the subjects identified by the DoE as ‘scarce’ subjects, so it appears that institutions are attempting to address these needs. It is perhaps, however, of some concern that Physical Science features poorly in the ranks of preferred subjects. Figure 3.10: Sample representation of newly-qualified teachers by population grouping
Source: University of KwaZulu Natal – “Future plans of newly qualified teachers in South Africa”, 2005 The KZN sample shows also that Whites comprises almost 79 percent of newly-qualified teachers and white women made up 66 per cent of the sample.
Sample representation of Newly Qualified teachers by Population Group
Blacks10.9%
Coloureds3.4%
Indians6.9%
Whites78.8%

Page 53
Other features of the sample are that the mean age of the sample is 23.4 years with a minimum age of 20 years and a maximum age of 53 years. The overwhelming majority (91 per cent) of students are South African. Three quarters (74.4 per cent) of the sample completed their own schooling in an urban area, 13.9 per cent in a peri-urban/semi-rural area and 9.7 per cent in a rural area. The high proportion of students coming from urban areas would presuppose that they would be less willing to teach in rural areas, were posts in rural areas to be offered them at some stage. It is probable too that these are the majority of students that would have a better grasp of subjects and learning areas like Mathematics, Science and Technology. If this sample were to be taken as a representative sample of the teacher graduate population, then the country would seem to be headed for serious trouble, with a serious shortage of teachers for the rural areas, and even more so teachers in the scarce subjects.

Page 54
4. TEACHER RETENTION 4.1 The Nature and Magnitude of Attrition 4.2 Factors Influencing Attrition 4.3 Teaching and Learning Conditions 4.4 Job Satisfaction and Morale 4.5 Remuneration and other material incentives The teacher attrition rate is currently estimated at between 5 and 5.5 per cent nationally. In relative terms this is not out of line with international trends but in absolute terms this translates to between 17,000 and 20,000 teachers lost to the system each year. The attrition rate in the educator workforce has fluctuated in the period 1997- 2004. In 1997, the national rate was 6.9 per cent, rising to 7 per cent the following year before declining to 5.6 per cent in 2002.28 The recent slight decline in attrition has been attributed to the phasing out of the rationalization process, necessitated by the legacy of apartheid. The natural attrition of educators is worsened by the fact that a significant number of South African teachers plan or hope to leave teaching if a better career offer comes along. Should those who hint they would leave actually do so, the current teaching pool could decrease by as much as 25 per cent. On average, those teachers who say they will remain in teaching, as long as they are able or until they retire, suggest they would retire at age 61. This is generally below the expected average retirement age of 65. More than two out of five of the current teachers who want to remain in teaching say they plan on retiring within the next 10 years – the period addressed by this study. Despite the slowing growth of the school-age population forecast over the next ten years, it is evident from projected figures and recent research studies that South Africa may face a serious problem with the supply of qualified teachers.
4.1. The nature and magnitude of attrition A recent study29 reported that 54 per cent of educators had considered leaving the education profession. Two-thirds of the educators stating their intentions to quit fell in the technology, natural sciences, economics and management fields. High predictors for leaving the teaching profession were low job satisfaction (in particular: lack of career advancement and recognition, teaching conditions in terms of working hours/load/policies, and lack of discipline and respect), a changed career choice after three years of teaching, high job stress (in particular: problems with teaching methods and administration and problems with the educational system), being white, coloured or Indian/Asian, five to 19 years’ teaching experience and the urban location of the school. Medium predictors were being male, low morale at school and high violence experienced
28 The MTT report 2005 29 HSRC 2005

Page 55
at the school in the past 12 months. Low predictors were low educator support and high educational qualification, and high annual income. In addition, the study revealed that the proportion of educators who considered leaving their profession was higher in the urban provinces - namely in the Western Cape and Gauteng at 73 per cent and 68 per cent respectively. More teachers in urban areas (66 per cent) want to leave the profession than those in rural schools (46 per cent). This is borne out by the higher actual rate of attrition in urban compared to rural schools. Lack of mobility and limited exposure to alternative opportunities in rural areas could limit thoughts of resignation far more than it does in cities. A recent DoE report30 suggests that most teachers want to be posted to urban schools for both professional and personal reasons. The report argues that the extent of the urban-rural divide in most countries creates enormous disincentives to being posted to rural schools. Teachers want to remain in cities and towns for a variety of reasons: most notably the availability of good schooling for their own children; employment opportunities for spouses and other household members; the desire to maintain often close-knit family and friendship networks; opportunities for further study; and poor working and living conditions in rural schools. These findings imply that South Africa may experience shortages at two levels. Firstly, there is likely to be increased shortages of teachers in rural schools due to difficulty in recruitment of educators willing to work in rural contexts. Secondly, there is likely to be a shortage in urban schools with urban teachers leaving to explore other career opportunities. The DoE 2004 study also revealed that more males considered leaving the profession than females, with 37 per cent of men regretting their initial career choice to become a teacher. (If they did in fact leave teaching, their actions would serve to increase the gender imbalance in the profession that was noted in Section 3.2.) In addition, teachers who have obtained higher levels of qualifications were more likely to consider leaving their jobs. In fact, according to the study, a higher percentage of educators who had obtained at least a higher diploma or first degree, were unhappy about the lack of career development opportunities in education. In addition, as Crouch and Perry (2001) observed, the number of educators leaving or joining as a percentage of all educators shows that the educators with REQV 14 were leaving at a faster rate than educators with REQV 13. It appears also that young teachers are already leaving the profession in large numbers, raising concerns about the quality of education in the future and the impact this will have on teacher supply in the period 2005-2015. Educators with between 5 and 26 years of teaching experience were more likely to consider other job opportunities. The market value of these individuals would be enhanced by the educational and managerial experience that they have acquired in the practising of their profession. A mass exit of this group from the system would severely aggravate both quantitative and qualitative shortfalls in the education system. The reasons for departure from the profession need further investigation. It could be that those leaving the profession are mostly either ready for retirement, or are very young and are simply working as
30 DoE 2004

Page 56
teachers while awaiting better prospects. If this is not the case, and the reasons for leaving are more directly related to professional disaffection or antagonism towards the system itself, that should be cause for major concern. Government PERSAL data for state-paid educators indicate that the national gross attrition rate in 1997/98 was 9.3%, dropping to 6.4% the following year and declining to 5.5% in 2000/01 before beginning to rise steadily again to 5.9% in 2002/03. Rates vary significantly by province and have to be seen in the light of the large numbers of educators that left the departments during the years of amalgamation and rationalisation, peaking in 1997/98 and 1998/99. The early years of this study were characterised by high numbers of severance packages and dismissals, whereas more recent years have seen rising proportions of mortality, medical retirement and resignation. Attrition rates peaked in 1997/98 and 1998/97, largely as a result of the unusually large number of educators that left during the early years of amalgamation and rationalisation. Thereafter they dropped to 3.4% (5.5% permanent and long-term) in 1999/00 and 2000/01, and increased to 4.2% in 2002/03 (5.9% permanent and long-term). These data suggest that approximately 15 000 educators were needed nationally to meet replacement demand in the financial year 2002/03, with an additional 6 000 needed as substitute educators for those leaving the service for extended periods (such as maternity leave). It should also be noted that, if the analysis is based on permanent attrition alone rather than on permanent and long-term attrition, the proportion of attrition due to mortality rises significantly. The highest attrition rate in 2002/03 was 6.5% in the Western Cape, followed by 5.6% in Gauteng. The lowest rates were 2.9% in Mpumalanga and 3.2% in Limpopo. The data also show that there are two peaks in attrition: one among educators aged 55 and above (of which an average of 66% are accounted for by retirement and 18% by resignation) and another among educators aged 25 to 34 (where resignations account for 80% of terminations and mortality 15%). The lowest overall attrition rates were in 2000/01 – most age groups have experienced increased attrition since then. Educator attrition rates are generally higher for females than for males and peak at age 55 and above (due to the high numbers of educators in this age band who retire). Attrition rates throughout the study period have been highest for white educators, although they have declined significantly since 1997/98. The overall rate for whites in 2002/03 was 12.0%, close to three times that for black Africans. Data available from the PERSAL database at National Treasury and from the EMIS database collected via the Annual School Survey provide four broad categories of reasons for termination of employment that seem to be on the increase. Other reasons for leaving the system are manageable, in that the numbers affected remain reasonably stable and the causes seem to be more administrative than systemic (for example, transfers to other state departments, dismissals on disciplinary grounds, severance packages). The four categories that seem to contain an increasing number of cases and could spell trouble for the country’s ability to meet educational targets are:
• Resignations
• Retirements
• Medical incapacity and

Page 57
• Death. Figures A6.1 to A6.4 in Appendix 6 track the trends in teachers’ termination of employment, in terms of the four categories mentioned above. The data show overall increases in the percentage numbers of resignations over the period 1997 to 2003. They also show a sharp net increase in the percentage rate of termination through death. While the rate of increase of terminations by resignation has not risen as sharply relative to the 1997 base-line as has termination through death, this category nevertheless comprise over half of all terminations. Compared to 1997 when 39.7 per cent of service terminations were due to resignations, this figure had risen by 2003 to 53.2 per cent. If the trend increases and South Africa continues to lose educators at such a rate due to resignations then, without even considering other factors influencing teacher loss, it appears very likely that there will be a serious shortage of educators in the near future. To address this loss of educators the DoE needs to understand the reasons why teachers leave the system. Whilst other forms of contractual termination were showing very sharp declines (transfers from 5.1 per cent in 1997 to 0.4 per cent in 2003; severance packages, which plummeted from 34.9 per cent to 0.4 per cent; and dismissals from 8.4 per cent to 3.5 per cent), the four categories of reasons for termination mentioned above, and tracked are clearly all causes for concern. Retirement rates rose sharply during the period 1997-2000, from 3.4 per cent to 17.10 per cent but have more or less leveled out since then. This may indicate an improved age profile in the teaching profession as a whole, although increases in the rates of termination for other reasons suggest, on the other hand, that fewer teachers are remaining in the profession right through their working careers until retirement age. The proportion of terminations due to medical reasons grew sharply from 3.8 per cent in 1997 to 9.7 per cent in 2000, and has remained close to this level since then. The impact of HIV/AIDS has been a major contributing factor.
The proportion of termination accounted for by death has followed a similar pattern as the trends of termination for medical reasons, rising from 4.7 per cent in 1997 to 17.6 per cent in 2003. In this case, too, the effects of the HIV/AIDS pandemic have been substantial. While attrition through retirement is unavoidable, there is much that can be done to reduce the rates of termination resulting from other factors. Attrition through medical incapacity and early death needs, in the current context, to be addressed by means of vigorous programmes promoting public health awareness among teachers, with emphasis particularly on HIV/AIDS awareness. However, it is clear that the greatest damage is being done by termination through resignation. It is important, then, to try to understand the reasons why so many teachers are resigning from their posts, so that measures can be put in place to reduce this rate of loss, and ensure the achievement of EFA targets.

Page 58
4.2. Factors influencing attrition As discussed above, a considerable number of those who do decide to join the teaching profession leave for other jobs long before reaching retirement age. Factors contributing to these high rates of teacher attrition include illness and bottlenecks in teacher preparation systems. A variety of unattractive conditions of service also plays a strong role in shrinking teacher supply. These include the perception of low salaries and poor employment benefits, arbitrary teacher deployment systems, unattractive work locations, unprofessional treatment of teachers, lack of professional development opportunities, and insufficient supportive supervision. Another strongly negative factor is the low opinion that society has of teaching. Teaching is considered a low-status career and well-qualified teachers increasingly seek alternative employment opportunities in other sectors of the economy. Some of the other reasons for leaving the teaching professions cited by teachers during interviews (Vumara, 2005) include:
• Disintegration of discipline (thus causing unfavourable working conditions). • Lack of facilities for teaching – especially subjects such as Science and technology. • Severe overcrowding of schools and classrooms – this in spite of a generally acceptable
national average learner-teacher ratio. • Lack of adequate incentives. • Poor parental participation at all levels: school governance and the disciplining of
children. • Policy overload, leading to dissatisfaction with time allocation, and making working
conditions unbearable through the increase in administrative work. • Role conflict. Teachers claim they have to adapt and adopt a multitude of roles depending
on circumstances presented at school. These roles include attention to counseling, teaching, acting as locus-in-parentis, doubling as security personnel and sometimes even performing as midwives.
• Blatant favouritism and nepotism at school governance levels.
4.3. Teaching and learning conditions When employees are not satisfied with their working conditions they are more likely to seek better teaching and learning conditions or opt out altogether. Teaching and learning conditions have a direct effect on teacher levels of job satisfaction. There are some general challenges posed by conditions in which the South African educator operates, some of which are contextually defined. The effect of learning and teaching conditions has been overlooked to a large extent, but the implications are enormous. For EFA, the numbers of teachers leaving due to conditions of learning and teaching can make or break the attainment of that objective by the country.

Page 59
(a) Learner-educator ratios and actual average class sizes The level of provisioning in respect of education human resources is generally expressed as a learner-educator ratio. The allocation of funds by the country’s National Treasury to provinces is largely aimed at ensuring that certain learner-educator ratios apply in schools. However, learner-educator ratios are often confused with class size, and it is a fact that class sizes are generally considerably higher than the prevailing learner-educator ratio. A class size is not only a function of how many learners to a school. It is also dependent on the number of physical infrastructure units available, such as classrooms, how many teachers there are, and what subject combinations the teachers are able to offer. This study found, within some areas, children taking turns to learn under trees and sometimes sharing the teachers’ staff-room as a make-shift classroom. In other cases, two or more grade groups would be housed within one classroom, with their teachers teaching from opposite ends of the room. Such conditions for teaching and learning erode all semblance of quality teaching, and learners can soon become disinterested and disillusioned about the apparent benefits of school attendance. The learner-educator ratios that applied in provinces over 2002 – 2003 periods are indicated in table 4.1. Table 4.1. Learner-Educator Ratios by Province
Province Learners Educators Schools L:E Ratio 2002 2003 2002 2003 2002 2003 2002 2003 E CAPE 2 072 054 2 116 426 65 355 64 865 6 191 6 165 31.7 32.6 F STATE 705 368 696 155 22 517 22 596 2 343 2 186 31.3 30.8 GAUTEN 1 617 017 1661 817 52 601 53 544 2 331 2 345 30.7 31.0
KZN 2 729 834 2 783 051 74 500 77 829 5 722 5 788 36.6 35.8 LIMPOPO 1 839 079 1816852 56263 54298 4763 4251 32.7 33.5 MPU’LAN 914 353 914 739 25 141 25 515 1 934 1 926 36.4 35.9
N WEST 897 342 890 605 30 035 30 319 2 292 2 253 29.9 29.4 N CAPE 196 731 202 104 6 484 6 216 476 457 30.3 32.5 W CAPE 945 239 956 836 27 259 27 248 1 595 1 597 34.7 35.1
S AFRICA 11 917 017 12 038 585 360 155 362 430 27 647 26 968 33.1 33.2
DoE SNAP Survey, 2002 In five out of nine provinces, the learner-educator ratio rose in 2003, as did the national average. Learner-teacher ratios are, however, unequal between schools and, in many classrooms, the ratios are much higher than the official (aggregated) figures suggest. In many schools, too, there is a lack of learning support materials, which makes the teaching of large groups all the more onerous. There could be a number of reasons for increasing learner-teacher ratios, including an unprojected increase in learner numbers that was not catered for by an increase in educators.
(b) School security and levels of violence Security in schools is an issue in all urban centres, particularly in neighbourhoods most exposed to conditions that would foster violence - poverty, prostitution, drugs, delinquency, etc. For some

Page 60
years now, school governing bodies along with such institutions as community organisations, associations for young people, in partnership with the national and provincial educational authorities, have been multiplying their efforts to identify the forms that violence takes within schools in order to develop prevention programmes aimed at teachers, children, adolescents and parents. The national and provincial education authorities as well as school and community organisations have been closely monitoring the development of violence in schools and have put measures in place to counter it. The complete eradication of violence in schools is the determined aim of the authorities: to quell any violence or a climate of incipient delinquency that would effectively cause some learners to stay away from school. This is an indirect infringement on the rights of the individual learner, to have free and unfettered access to quality schooling.
(c) Statutory working hours versus estimates of actual hours of teaching Currently educators in South Africa are expected to be at school for 1800 hours per annum. This translates into seven hours per day that should be spread over 257 days, but is commonly compressed into 200 days per annum. Educators are also expected to perform a variety of duties in school, extracurricular activities and utilize up to 80 hours professional development time per annum.
(d) Teacher workloads According to the Education Labour Relations Council (ELRC), one of the major causes of educator attrition is work overload. Educators are often perceived to have favourable working hours as well as the benefits of long school holidays. However, as letters from educators to the media reveal, in addition to tutoring, educators also have to be available after hours and over weekends for extramural activities such as sport, parents’ evenings, school functions and training sessions. There is also the time spent at home on preparation, assessment and paperwork31. There is little doubt that the administrative responsibilities expected of teachers (for example, the elaborate recording of assessment results and profiles) have increased over recent years, and have come to be regarded as burdensome. Not only do teachers feel that real-time workloads often exceed the official norms, but that the emotional and psychological pressures of classroom teaching (especially in over-crowded environments) cannot adequately be factored in to workload models. Teacher workload has become a highly contentious issue internationally, even more so in the last ten years. Internationally, the research focused on educator workload is connected with teacher stress and burnout. Teacher stress has been linked to greater demands being made on teachers and the changing roles of educational personnel in the context of educational restructuring - a phenomenon characterizing the educational reform efforts of the last two decades32.
31 ELRC, 2005; Factors Determining Educator Supply and Demand in South African Public Schools 32 Vandenberghe and Huberman, 1999

Page 61
National policy on educator workload was interpreted to expect educators to spend a maximum of 1720 hours on their various activities per annum. For the 2005 year, this translated into a Monday – Friday working week of 43 hours per week in a 8.6 hr working day, excluding week ends and school holidays. An additional 80 hours is provided for professional development, and it is expected that this occurs outside school hours. The formal school day is expected to be 7 hours long, and the formal school week 35 hours long. This means that educators are expected to spend some time (8 hours over the week) outside formal school hours on their activities. Heads of Department and teachers are required to spend a minimum of 85% of their time teaching, and the rest of their time on preparation and planning, assessment, extra-mural activities, management and supervision, professional development, pastoral duties, guidance and counseling and administration. Workload would constitute those activities or issues that add to the quantity or intensity of work. While there is some literature on teacher workloads available that explores the issue in a global context, limited comparable research conducted in the South African context reveals clear disenchantment in teachers about the perception of significantly increased workloads, occasioned by policy changes, new expectations and accountability requirements. These factors are regarded as spurs to increased workloads, and have a threat of intensification33. Factors influencing increased workloads have been cited34 as:
• Administrative tasks as a result of new curricula, associated with more complex assessment methods and procedures.
• Location (rural, urban, semi-rural): the nature and scale of responsibilities vary considerably.
• Contextual relations between school and community, often resulting in expectations for the school to function as a broad-based community-service centre.
• School size and class sizes, and the effects of over-crowding, shortages, and staff involvement in administrative tasks.
• Gender issues, and imposed gender identities. • Phase and learning area demands: different phases spend different amounts of time on
particular activities, sometimes caused by the nature of the Learning Areas taught. • The effects of OBE: varying reactions to the requirements of OBE and the presence or
absence of teaching and learning resources. • The effect of the requirements of the implementation of the Integrated Quality
Management System (IQMS). • Numerous departmental requirements add to workload, especially that of principals.
33 Stoffels, (2004) and Jansen (1999) 34 Linda Chisholm et al. “Educator Workload in South Africa” – Draft report prepared for the ELRC, (HSRC, 2005)

Page 62
4.4. Teacher job satisfaction and morale Low levels of job satisfaction and low morale are also a problem within the South African teaching fraternity. Issues that have affected teacher morale are: the debilitating effects of HIV and AIDS, the death of learners and colleagues, challenges of the new curriculum, and the perceived low esteem in which teachers are held by the rest of society. According to a recent DoE report, it is argued that the status of teachers in most developed and developing countries, has declined appreciably during recent decades. This has had a psychological impact on educators and has not only led to teachers leaving the profession for perceived better jobs, but also to a decline in the interest in joining the profession. The implications for 2015 under conditions of low teacher morale and low job satisfaction, are that, even if teachers are in their classrooms physically, they may not have the capacity nor the interest to give their full professional backing to the educational enterprise and ensuring that standards are maintained and quality of teaching is sustained. In a study conducted by NAPTOSA in 2002, reasons cited for low teacher morale include:
• Unsatisfactory salary packages. • Inadequate financial compensation for workload and responsibility. • Salaries not keeping up with inflation. • Salary packages not market related. • Inadequate remuneration for qualifications. • Insufficient perks such as housing subsidies, travel allowances, etc. • Unsatisfactory working conditions. Teachers in this study expressed a need for
renovations and repairs of present facilities, and a need for new buildings. • HIV/AIDS, which is impacting on the emotional status of educators. Teacher morale is low
where the impact is high. Studies analysed for this review revealed that teachers believe their own morale to be largely determined by their quality of life within the school. They rate factors such as good relations with pupils and helping pupils to achieve as very important. Interestingly, when asked to name those factors that they felt could have a positive effect on the morale of the profession, teachers’ responses largely related to factors external to the process of teaching itself - more positive portrayal of the teaching profession by the media, increased pay, better conditions and less pressure. It seems that to improve both the morale of individual teachers and the ethos of the profession as a whole, a range of measures are needed, addressing both experiences integral to the work of teaching and factors linked to the structural and social context within which that work is carried out. The main factor found to contribute to the job satisfaction of teachers is working with children. Additional factors include developing warm, personal relationships with pupils, the intellectual challenge of teaching, and autonomy and independence. For Heads of Department, the main factors contributing to job satisfaction include their relationships with others, having responsibility and the success of their school.

Page 63
In contrast, teachers viewed job dissatisfaction as principally contributed to by work overload, poor pay and perceptions of how teachers are viewed by society. As with teachers, administrators and/or Heads cite work overload as a major factor contributing to job dissatisfaction. Variations have been found in the job satisfaction levels of teachers, depending on certain individual and school characteristics. Gender differences include female teachers having higher overall job satisfaction than their male colleagues. They are also more satisfied than men with the curriculum and the recognition they receive for their efforts. Male teachers are more satisfied than women with their influence over school policies and practices. Primary teachers are less satisfied than secondary teachers with the balance between their work and personal lives, whereas secondary teachers are less satisfied with their influence over school policies. Teachers in rural areas report higher levels of job satisfaction than those in urban schools.
4.5. Remuneration and other material incentives Many commentators advocate substantial salary increases as a means of attracting and retaining talented teachers in the school system and of encouraging harder work by current teachers. Salary policies are also cited as important for offsetting changes in demands in competing occupations and for dealing with unattractive working conditions in particular sets of schools35. In an attempt at dealing with some of the working conditions discussed in this section, the department has embarked on several policies. The current Department of Education budget (2005) allocates an additional R6.9 billion to improve the salaries of teachers: R2.7 billion is for the 2004/5 carry-through costs of existing agreements; R4.2 billion is to be used for expanding pay progression, for performance rewards, and for targeted incentives. Attention is also being given to creating alternative classroom-based career paths for experienced educators and improved conditions for school principals. On top of this, Government has earmarked funds for the recapitalisation of school infrastructure, equipment and resources. Teachers leaving the profession to seek better salary packages impact on both qualitative and quantitative shortages. The profession loses young blood that could otherwise bring in new thinking, innovativeness and drive that could grow and improve the skills within the profession. The profession also loses skills in critical learning areas such as Mathematics, Science and technology as these educators are taken up and absorbed in other career choices. The Department of Education is attempting to introduce a range of incentives designed to encourage educators to stay on in the profession. Financial incentives in the form of service bonuses for lengthy service may encourage educators to stay longer in the profession.
35 OECD 2002, Attracting, Developing and retaining Effective teachers

Page 64
5. IMPLICATIONS OF HIV/AIDS FOR TEACHER SUPPLY AND DEMAND A recent study 36 suggested that “the proportion of HIV-positive educators with a CD cell count of 22 per cent is higher than that reported in other studies conducted in sub-Saharan Africa”. The study also suggests that HIV prevalence among educators was higher for those aged 25 – 34 years (21 per cent), with women having a higher HIV prevalence. The latter reflects the fact that women are generally more vulnerable to HIV infection because of their biological makeup, as well as their generally low socio-economic status. In addition, the study found that Africans had a prevalence of 16.3 per cent, compared to less than 1 per cent amongst Whites, Coloureds and Indians. Educators who had a low socio-economic status had a higher prevalence. The study also found that educators residing in rural areas and those working in rural schools had higher HIV prevalence than educators residing in urban areas and teaching in urban schools. It also revealed that educators employed in KwaZulu-Natal and Mpumalanga had the highest HIV prevalence among all the provinces. The highest provincial mortality rate was in KwaZulu Natal among 31-35 year old educators, at 1.18 per cent37. In addition, the pandemic greatly reduces the capacity of the system by increasing teacher absenteeism. It also saps the system’s energy by imposing additional demands on teachers as they provide support for ill students and students with ill family members. At present there is no official procedure for terminating the services of South African teachers with HIV/AIDS. HIV/AIDS will also increase the attrition rate among educators because of the loss of skills in the broader labour market, which could increase competition for teachers. Management capacity is also likely to be affected. Medical aid costs, and the ability to maintain or extend cover, are expected to be significantly affected by HIV/AIDS. The current structure of the Government Employees Pension Fund makes it likely that it will face major cost increases due to HIV/AIDS death and disability. Health and other benefits thus will have a key role to play in alleviating the burden on employees and employees’ dependants. Stakeholders need to review whether current benefits address priority objectives in an era of HIV/AIDS.
HIV/AIDS was not the only factor in the causes of morbidity. Other chronic diseases were found to play a significant role in the health status of educators, which appeared to be poorer than that of the general population. A total of 10.6% of educators had been hospitalised in the previous 12 months, compared to 7% of the general population, reported in 2002. It was also found that at least 75% of educators reported a visit to a health practitioner in the six months before the study. The most frequently reported diagnoses in the past five years were stress-related illnesses such as high blood pressure (15.6%), stomach ulcers (9.1%) and diabetes (4.5%), suggesting that educators may be exposed to high levels of stress. Research reports project that AIDS will soon become the leading cause of deaths among teachers. Up to 3.5 per cent of teachers could die annually from AIDS by 2010. This rate of mortality due to AIDS is similar to that experienced by teachers in other neighbouring countries with established AIDS epidemics. Clearly these high levels of AIDS-related illness and death
36 ELRC 37 MTT 2005

Page 65
among employees will have a significant impact on the education sector. Performance of remote schools or those with small staff complements, such as farm schools, will be particularly vulnerable, as will institutions with high workloads and less reserve capacity to spread loads. A major factor in projections of educator demand is the prevalence of HIV/AIDS among educators and the death rate of educators from HIV/AIDS38. However, the challenge facing research around the impact of HIV/AIDS on teachers is that HIV/AIDS death cases are not easily quantifiable. Instead, assumptions are fuelled by the knowledge that a lot of teachers are known to be ill, increasingly absent from work, and dying while still officially in service. HIV/AIDS is rarely named as the reason39. Despite these research concerns, it has become clear that HIV/AIDS contributes to the quantitative shortages that exist in the teaching profession. The death of teachers and student teachers therefore impacts heavily on both the supply and the demand for teachers40. The combination of teachers leaving the profession in droves and of teachers dying or leaving the profession due to HIV/AIDS could lead to both qualitative and quantitative shortages if not assuaged. The HIV/AIDS pandemic could prove to be one of the biggest singe contributors of a mass shortage of teachers if left to its own course. Despite overwhelming evidence of the impact of HIV/AIDS on the life, longevity of service, and general well-being of teachers, it is encouraging to note that governments, including the government of South Africa, have taken up the fight against HIV/AIDS and its debilitating effects, and are increasing their efforts to ensure that it does not negate attempts to reach EFA targets. State planning has come a long way since the Jomtien meeting in 1990 and the Dakar Conference in 2000, when the impact of HIV/AIDS was not given the prominence it should have had in the minds of the government representatives.
38 Crouch and Perry, 2003 39 Coombe C; “Mitigating The Impact of HIV/AIDS on Education supply, Demand and Quality.” www.unicef-icdc.org/research/ESP/aids/chapter12.pdf 40 Hall 2002

Page 66
6. IMPROVING TEACHER SUPPLY 6.1 Teacher candidates 6.2 Student Teacher Enrolment 6.3 Initial teacher education 6.4 Recruitment and retention strategies Improving teacher supply is one way of mitigating the effects of the losses described in the preceding sections. South Africa faces challenges with its pool of available educators. One of these challenges is that of attracting new educators into the teaching profession and another is the challenge of how to retain those already in the system. At present the country is not producing enough teachers to balance out the effects of annual attrition. In this section we explore the approaches employed to attract new teacher candidates and those used to retain the educators in the profession. We look at how these impact on the teacher supply at present and for the future and how these could be improved to ensure that we have an adequate supply of educators for the period 2005-2015. There has been a decline in students taking the Initial Professional Education of Teachers (IPET) qualifications, namely the undergraduate Bachelor of Education (BEd) and the Postgraduate Certificate in Education (PGCE). Self-reported data from the Deans’ Forum in 2004 indicated that education institutions are producing at best approximately 9 000 graduates of whom at least about 3 000 may already be practising educators (HSRC, 2005). The decline in enrolment is significant among black Africans. Improved career opportunities for black applicants have not only reduced the number of applicants who enter the education sector, but have also had an impact on the supply of educators because even the small pool of education graduates may not necessarily end up teaching. They are likely to seek employment in other fields where their teaching skills are valued, such as in training-related careers or marketing. It was also found that the older patterns of oversupply in urban schools and undersupply in rural schools have persisted and newly trained educators have difficulty in finding posts (even in rural schools). Another supply-side challenge is the international migration of teachers41. Countries such as the United Kingdom, Canada, Australia and New Zealand have recruited a large number of South African educators, mainly because of notions of ‘greener pastures’ – better pay and living conditions. The majority of the educators emigrating are the most experienced personnel, particularly those coming from previously advantaged and white schools, who have the skills for teaching mathematics and science subjects, but this group also includes a significant number with Foundation and Intermediate phase expertise. These specialist subject teachers are also the hardest to replace, making it harder to meet EFA goals if such teachers with scarce skills are not replaced.
41 HSRC 2005

Page 67
In order to improve the pool of new teachers there is a need to understand the profile of the young people who choose teaching as a career. This will inform recruitment strategies, by placing the focus on a clearly defined target group.
6.1 Teacher candidates The present demographic profile of students who take teaching is a cause for concern, with serious implications for the provision of new teachers in traditionally disadvantaged reaches of the schooling system42. The profile of existing teacher candidates reveals that students intending to go into teaching are most likely to be female, young, to be studying the humanities rather than science or engineering, are white, and tend to prefer the primary rather than the secondary school sector. There are relatively few black student teachers, particularly in the Foundation phase. The ‘surprising factor’ is that ‘white participation [has] increased’43. The speculation is that reasons for this may be linked, on the one hand, to the fact that, as the formal economy is opening up at a faster rate for Africans, relative opportunities for whites have waned and, on the other, to the increase in extra teacher posts created by SGBs of formerly white schools44. This has been clearly demonstrated in surveys such as that undertaken at the University of KwaZulu- Natal. This showed that 33 per cent of the sample group already had jobs lined up before the completion of their teaching qualifications. Three-quarters of these posts were ex-Model C (formerly white school) SGB appointments. White students entering the profession tend to have more successful academic results in their matriculation examinations, and most are committed to becoming educators and have chosen teaching as their first option. However there is a view that teaching for these students may be a means to gain overseas employment rather than serving the South African education system. The majority of white student educators have no experience of, nor do they intend teaching in, township (or rural) schools. For many their teaching qualification is their ticket to international travel and employment. Furthermore, although the data tracking undergraduate enrolment in teacher preparation programmes is patchy, there is evidence suggesting that once they become teachers, many individuals are lured away immediately and others leave in their early years of teaching at increasingly alarming rates.
For many new teachers who choose to work in the profession, their appointments at schools are often at the mercy of SGBs that make recommendations to the provincial authorities about the teacher they would prefer in their school. This can mean working with limited benefits and as a temporary teacher for long periods. When an opportunity for permanent employment in another field and with better benefits comes their way, these educators often leave their current employment with no second thought.
42 A National Framework for Teacher Education in South Africa, 2005 43 Crouch and Perry 2003 – “HRD Review”, HSRC 44 Crouch and Perry 2003 – “HRD Review”, HSRC

Page 68
The stark implication of all of this is an increasing shortage of black teachers, particularly in the Foundation phase. White students are not known for having a particular interest in teaching in black schools in particular. But even if they were interested, they would be constrained by an inability to teach in the mother tongue, as is the requirement in the Foundation phase. Strategies to attract black teacher candidates, particularly to specialize in the Foundation phase and the gateway subjects in other school phases, must be put in place to ensure a continual supply of teachers that caters for the areas of main demand.
6.2. Student teacher enrolment The number of students enrolled in initial teacher education programmes sustains the flow of new entrants into the profession. The National Framework for Teacher Education in South Africa (NFTE)45 report notes that the declining number of recruits entering the teaching profession in recent years has been a concern to many, especially HEIs that have seen a drop in enrolment of first year entry students into the undergraduate B Ed degree. There has been a general decrease in the demand for teacher training, with an observed decline in enrolments over the past five years.46. According to recent research on trends in the period 1999-2003, there has been an overall decline in student-educator enrolment by approximately 24.3 per cent. In 1997 there were 142 169 students enrolled for teacher preparation programmes in South Africa. Enrolment dropped to 130 000 in 1998; and of the 107 000 students enrolled at universities in 2001, only 20 321 were enrolled as full-time students. The number of education graduates peaked at 35 628 in 1999 and drastically declined to 22 958 in 2002, although it increased slightly to 25 308 in 2003. In 2003, 81.1 per cent of the education graduates were African and 11.3 per cent were Whites. But this racial profile may be misleading. A significant decline in first-time enrolment of African students has been noted47. The ELRC report indicates that African students are generally not choosing teaching as a profession. This is because of the perceived low status of educators, learners’ observations of teaching while they were at school coupled with an increasing availability of other career options to choose from. Public perception of teachers and the schooling system are also additional discouraging factors. Traditionally, the South African public has respected the role of teachers and this regard is deeply rooted in historical circumstances. Even when teachers did not benefit from good salaries there was regard for their scholarship, the nature of their work and their roles in the community. This has significantly changed. Levels of trust in teachers and the schooling system have been dented. The financial status of teachers has been greatly reduced when compared with other professions. The public’s level of respect for teachers is likely to influence the perceived attractiveness of the teaching profession and the inherent quality of new teachers. 45 National Framework for Educators, 2005 46 HSRC 2005 47 HSRC 2005

Page 69
Furthermore, students’ personal experiences of teachers and teaching have left the impression that the task entails onerous responsibility and duties. Learners experienced first-hand the downsizing/ rationalization of the teaching force during their secondary school years, which included teachers being re-deployed or made redundant. This left the perception that the teaching career was not stable. Teachers themselves often discourage learners from becoming teachers, stressing their own experiences as disadvantages and pointing learners to different career options48. New opportunities for career choices beyond teaching are now more freely available for those students who have the necessary university entry qualification. Forecasts of teacher demand and supply suggest a large and looming imbalance between supply and demand arising from inability to attract enough candidates into teacher education among other factors. These factors, coupled with demographic changes and the impact of HIV/ AIDS, have created a situation where future demands are likely to be many times greater than the current supply.49. This situation warrants urgent intervention on the part of the Higher Education Sector and the Department of Education.
6.3. Initial teacher education The context of initial teacher training plays a significant role in the quest to attract more candidates into teacher education. However the state of teacher education in South Africa has been cited as one of the factors contributing to the decline of new teacher education candidates. 6.3.1. Reforms in teacher training Reforms in the teacher education sector have brought a new set of challenges to the attempts to increase the supply of educators. The field of teacher training has experienced a certain amount of instability over the past decade. The policy of rationalising and restructuring teacher-training colleges inherited from the former (apartheid) education departments culminated in the incorporation of the remaining teacher colleges into universities in 2000-2001. In 1994 there were approximately 150 public institutions providing teacher education to approximately 200 000 students, 80 000 of which were in PED-controlled colleges of education50. The post-apartheid DoE aimed to address fragmentation between historically advantaged and historically disadvantaged institutions – universities, technikons and colleges; English and Afrikaans speaking institutions; high- and low-status institutions; and residential and distance institutions.51 Until the time of change, teacher education was a shared function of national and provincial government52. University teacher education providers fell within the remit of the national Ministry of Education (specifically the Higher Education branch), while colleges of education were under provincial control.
48 Framework on teacher Education 49 Crouch and Perry, 2003 50 Parker B, 2003 51 Reddy J, 2003 52 Sayed

Page 70
At present, there are no colleges of education in South Africa; instead there are 24 Higher Education Institutions involved in teacher education. Critics of reforms in teacher education contend that the sector has become a Higher Education step-child. While the decision to place all teacher education in University and Technikons faculties of education can be easily justified on the basis of cost and quality, little thought seems to have been given to the specific needs of teacher education. HEIs are geared primarily to teach pure knowledge to a largely full-time, undergraduate student body, and to develop pure and, sometimes, applied research. They are not primarily interested in the time-consuming, costly, and often practical, school-located activities of ensuring sound professional education for large numbers of students. Nor do they teach large numbers of mature-aged, part-time, students. Teacher education requires a different kind of teaching and learning process to that understood and supported by HEIs. The funding of teacher education represents another challenge. The DoE funding formula places teacher education in the lowest subsidy-earning category, even lower than business/commerce and the social sciences. It also funds distance education at 50 per cent of a full-time equivalent teaching subsidy for inputs in contact-mode teaching programmes. There will be little financial incentive, therefore, to establish school-based assessment or adequate support for teachers to learn from the places in which they work or will work in future. In most HEIs, therefore, teacher education is not highly regarded.53. 6.3.2. Impact of the reduction of institutions on teacher supply The mergers and closure of colleges led to a decrease in the number of institutions providing teacher education54, most noticeably the virtual elimination of institutions in rural (and largely African-populated) parts of the country. One strength of the old system, namely the geographical spread of colleges through remote rural areas, has now been reversed. The closure of rural-based colleges leaves South Africa with a geographical spread of post-school education institutions less equitable than that which existed before the process of incorporation. Although the rationalization of the colleges of education – rooted as it had been in apartheid ideology – was understandable and politically necessary, it has created a different kind of problem: restricted access to teacher training for candidates from rural backgrounds. Transformation of Higher Education has resulted not only in a reduction in the number of training sites but also impacted on the number of registered student educators over the years.55 There has been a “dramatic decline in student teachers in pre-service programmes: from 70 731 in 1994 to 10 153 in 2000”. The most precipitous decreases occurred in provinces with existing teacher shortages, as shown in Table 6.1. 53 Sayed 54 HSRC 2005 55 Vinjevold 2001

Page 71
Table 6.1 Decline in teacher education enrolment, 1994 to 2000 Province 1994 2000 Percentage Change Eastern Cape 14 162 1373 (90% decrease) KwaZulu-Natal 12 139 1 265 (90% decrease) Mpumalanga 3 643 268 (93% decrease) Northern Cape 5 109 209 (96% decrease)
Moving teacher education to the Higher Education sector has also had an impact on the cost of studies. Tuition fees at HEIs are considerably higher than the fees charged at the former colleges of education prior to incorporation, when, in most cases, both tuition and residence fees were subsidized by PEDs. In a short period the cost-to-student (when costs at a former college are compared with current costs at most HEIs) has more than doubled. From a financial perspective, there is, therefore, a decrease in financial incentive for both the provider and the student. While it is true that transfer of teacher education wholly to HEIs has given student teachers access to NSFAS funding, it is also true that service-contract loans previously offered by PEDs (redeemable on a year-for-year basis through employment in the provincial department) have been frozen in many provinces. While the latter were generally available to most students, NSFAS funding, with the ceiling it places on family income for eligibility, is of benefit to a much smaller cohort of candidates. A large proportion of student teachers have, in the past, come from lower-middle class backgrounds, the children of teachers and other public servants. Many of this cohort no longer qualify for any form of financial assistance. Access for working class students will be limited, as the cost of teacher education increases. Teaching may well come to be regarded as an “elitist” career. The cost to individuals and their supporters of a four-year B.Ed programme is between R84 000 and R120 000 and this is unaffordable for most students (particularly those from previously disadvantaged communities) who aspire to become teachers. Even in cases where PEDs are still offering service-contract bursaries, the system is, by and large, poorly administered and their provision is driven more by the perceived needs of the provincial schooling system than by the national demand situation. NSFAS does not seem to be in a position to offer a system of full cost loans for initial teacher education to more than a very limited number of students56. Equity issues relating to cost are replicated in the issue of admission requirements. The entrance requirement aligned with HEIs normally excludes students without matriculation exemption certificates (unlike those of the former colleges). Universities and technikons face a challenge: do they adhere to those strict entry requirements, or do they adapt these for prospective teachers given the declining number of students with a university entrance pass? Students with exemption are likely to choose other careers. The teaching profession in South Africa competes with other careers at a time when the attractiveness of teaching as a career is declining. All of these factors, resulting from the policy changes in provisioning of teacher education, have a direct impact on the access of teacher education. In summary, access has been greatly limited by
56 A National Framework For Teacher Education in South Africa, June 2005

Page 72
• the entrance requirements into the new qualification,
• the geographic location of HEIs offering teacher education,
• the costs of teacher education.
6.4. Recruitment and Retention Strategies
6.4.1. Recruitment and Employment of teachers Most teaching appointments in South Africa are not filled by assignment, but by a competitive recruitment and appointment process that is organised by each school individually, where the general responsibility for recruiting and selecting staff and for making appointments lies at the level of the school’s governing body. Generally, in South Africa the number of teachers a school employs is determined by the provincial education department, on recommendation by the governing body of the school and on the advice of the principal who will have considered all the relevant issues at national and local level in the context of the school’s overall policy and aims. When a teacher leaves, the governing body, or its sub-committee, will consider whether or not to replace the teacher, and in what manner, given the overall pattern of teachers in the school. They may decide not to replace a teacher directly, or to seek a teacher on a different form of contract from before (temporary, permanent, full-time, part-time). Those seeking employment as teachers apply in response to an advertisement, normally filling in a form that will require specific categories of information, and often also making a specific letter of application. They are also normally expected to supply references from their current employer (if teaching), or their training institution (if newly qualified). Additional references may also be asked for, particularly in the case of denominational schools. The degree of competitiveness and the status of teachers vary with the overall economic situation: anecdotal evidence suggests that teaching becomes a more desirable career when other jobs are less available or unstable. Ultimately, the employment of educators is a provincial department competence that is governed by the post-provisioning model and the level of vacancies.
• The Post Provisioning Model. The number of teachers leaving the profession because of turnover and/or natural attrition, such as retirement, and the extent to which districts are appointing qualified teachers for newly created positions affects the demand for teachers. Since 1998, educator posts have been distributed amongst schools on the basis of an affordability-driven post provisioning model, using as inputs, mainly enrolment, but also the grades in which learners are enrolled, language of learning and teaching, and learning area and subject offerings in Grades 8 to 12. The use in the model of curriculum offerings in the case of secondary schools has caused some controversy, because historically advantaged schools tended to offer more scarce subjects, such as music and certain technical subjects, and therefore enjoyed a slight advantage in terms of the overall learner-educator ratio.

Page 73
Part of the problem has been the slow speed with which curriculum equalisation for Grades 10 to12 has occurred across the schooling system. The post provisioning aspect, though not the curriculum aspect, of the problem was addressed in 2002 with a pro-poor weighting, which effectively cancelled out the advantage that certain middle class schools had enjoyed. The pro-poor weighting currently governs 2 per cent of all educator posts, though this will rise to 5 per cent within some years57. Vacancies The preliminary findings of a study being conducted by the DoE reveal that virtually all of the districts surveyed indicated that they are currently having difficulty recruiting and employing new teachers. Of the 372,689 teaching posts reported by the Department of Education, there are 14,329 unfilled vacancies. Table 6.2.: National educator appointment rates based on new appointments Financial Year Appointments New Appointments Appointment Rate 1998/1999 380 311 7 381 1.90% 1999/2000 368 281 5 388 1.50% 2000/ 2001 362 521 7 207 2.00% 2001/ 2002 360 203 9 640 2.70% 2002/2003 366 320 13 805 3.80%
Source: ELRC/HSRC 2005 The table above shows that the new appointment rate was lowest in 1999/ 2000 where it was 1.5 per cent of total appointments, rising to 3.8 per cent in 2002/2003. In addition, the DoE study shows that in 2002/03, 65 per cent of all new recruits into teaching were aged between 25 and 35. A further 23 per cent were between the ages of 35 and 44. Relatively small proportions were found amongst older age groups (45 to 54 and 55-plus) and those aged less than 24. The proportion of new recruits to teaching amongst 25-34 year olds has increased considerably over the 5 year period 1998/1999 to 2002/2003, from 53 to 65 per cent. Relatively more educators are also being recruited amongst those less than 24 years of age: in 1998/1999 it was 0.01 per cent, but by 2002/2003 it had risen to 3.7 per cent of all new appointments. Despite improved appointment rates, filling of vacancies is still a challenge the Department of Education is faced with. A further analysis of posts which are not being filled, reasons, and geographic distribution of such vacancy posts is necessary. Leaving these vacancies unfilled impacts on the quality of education, because it leads to these posts being filled by unqualified teachers. If that is not the case, then other educators would be overloaded with teaching as they have to share the workload of the vacant post. This causes problems especially when these teachers then have to teach outside of their areas of specialisation.
57 Plan of Action: Improving Access to Free and Quality basic education for all; 2003

Page 74
6.4.2 Recruiting and retaining teachers in rural areas Recruiting educators for rural schools is one of the challenges facing the provincial education departments. The teaching profession in rural areas is characterised by a critical shortage of qualified educators particularly in physical science and mathematics. Morale is low because of poor conditions of service and the dire teaching environment in many schools58. Measures to improve recruitment of rural teachers:
• Administrators must target candidates with rural backgrounds or with personal characteristics or educational experiences that predispose them to live in rural areas. The emphasis on background and experience is crucial for racially or culturally distinct communities.
• Selling points in recruitment efforts should be the benefits of teaching in rural schools, such as fewer discipline problems, less red tape, more personal interaction with colleagues. Many rural teachers were raised close to where they now teach.
• Various “grow-your-own” strategies to offer incentives to local residents with potential to become teachers, such as assisting them in obtaining the needed education and training. For example, one organization encourages students to consider returning to their home communities once they have received teaching credentials.
• Higher Education Institutions must take more of role in recruiting students who demonstrate the characteristics of successful rural teachers.
• HEls should recruit aggressively in high schools, exposing students to peer tutoring, counseling, role modeling, and classes in education theory.
Measures to improve the retention of rural teachers should include the following:
• HEIs need to develop programmes that offer a rural focus in course work and provide ample opportunities for rural experiences. In rural settings, training must be geared to add value to experiential knowledge that teachers already have of a place, so that the appropriate technology can be introduced in a given situation.
• Co-ordinated, school-community orientation can help new rural teachers overcome
feelings of isolation, acquire a sense of community security, and develop professional competence. The community should recognize new teachers’ accomplishments and invite them to participate in various activities. Keeping teachers in rural areas up-to-date is also very important.
58 Ministerial Committee Report on Rural Education: A new vision for rural schooling; 2005

Page 75
• Principals should select a new teacher’s initial assignments carefully, set clear goals, welcome feedback, establish an encouraging and non-threatening environment and provide opportunities to interact with experienced colleagues and parents. New recruits into the system, and teachers on redeployment, have been complaining about the absence of mentorship, induction and assimilation programmes at the new schools of placement. This leads to a lot of wasted time as new teachers try to find their place in the “pecking order” at the school. This is the task of management (Principal and School Management Team).
• Collegial mentoring – that is additional to IQMS (official teacher evaluation) – can be crucial. The school can also ease the way for new teachers by streamlining paperwork, providing a well-planned in-service programme, and arranging release time for visiting other teachers’ classrooms.
• A more compensatory approach by government, perhaps in combination with efforts
by SGBs, to assist teachers who may be staying far from established homes (where some might even have applied for mortgages and are already paying bonds). The compensation could look at covering either the cost of alternative accommodation closer to the school, or transport costs.
6.4.3. Improving conditions of Employment for Educators Improved conditions of service are key to retaining educators in the profession. From the moment the educator begins teaching, employment conditions must be in place to ensure that he/she grows into the profession.
6.4.3.1 Induction Currently there are probationary or induction arrangements in all nine provinces. These have in all cases been substantially revised and developed in recent years in response to various pressures. Induction is now understood in the context of the following factors:
• securing an early foundation for continuing professional development is a necessary element of successful career development;
• newly qualified teachers need particular attention and support that will build on their initial training;
• induction support will help teacher retention in the first year;
• a probationary period acts as a further check on teacher competence. In all cases the revisions relate to a general move to see professional development as a continuous process throughout a teaching career. The competences or standards identified for induction build on those for initial teacher training. In South Africa this is part of a continuous process of development extending into the second and third years of teaching. Coupled with other motivating factors, by creating and promoting a supporting environment for new teachers to grow, induction plays a crucial role in retaining educators.

Page 76
6.4.3.2 Career Pathing Career pathing should provide educators with opportunities to progress either laterally or vertically in the education system but also keep educators involved in classroom teaching by providing teaching and learning related progression opportunities on all salary levels up to director58. In South Africa the development of a clear career structure for teachers has been identified as a major element in the strategy to retain teachers in the profession. Until recently, the career pathing of educators in South Africa had three distinct paths, viz:
• Office-based
• School-based
• College-based employees. For virtually all educators there was no chance of promotion beyond a limited point. A further weakness was that the entry level for educators was based on formal qualification alone. The system made no provision for salary progression. As a result many teachers remain on the same salary level for many years59. This is one of the factors contributing to low job satisfaction and a motivator for seeking better-paying options and careers, mostly out of education. Most positions are on a particular salary scale, and the individual will be assigned to a particular point on that scale on appointment (bearing in mind their previous salary), and normally move up that scale annually until they reach the top of the scale attached to that post. The new Post and Salary Structure ensures that educators are free at any time to choose what they want to be, i.e., either Managers or Classroom Educators, the latter an option that had been missing from career path options. Teachers are no longer being forced to go into management in order to progress in terms of salary. An educator may choose to remain classroom-based and still qualify for salary progression. Finally, the new structure makes a distinction between Post and Salary Structure, where the Post Structure indicates the level of authority and the Salary Structure indicates the complexity of the job.60 This progress has until now been nominally based on satisfactory performance, but it has been extremely rare for a teacher not to be given any due annual increment.
59 ELRC June 2000 study on career pathing and post grading system for educators 60 http://www.naptosa.org.za/Update/first_2003_05.html

Page 77
6.4.3.3 Remuneration/ material incentives
The Department of Education is in a process of investigating the possible introduction of an incentive scheme for educators. This anticipated scheme is aimed at achieving the following objectives:
• attracting educators to teach scarce subjects
• attracting educators to teach in remote areas
• retaining educators currently teaching scarce subject and in remote areas.
6.4.3.4 Post and salary structure, pay progression and performance management In 2001 the education system required that educators with a three year degree (M+3) start on salary level 6, while those with a university degree (M+4) start on level 7. This led to distortion of the grading system and provided exaggerated differentials61. The salaries of all educators have been translated into the new 16-Notch system with effect from 1st April 2003, in line with ELRC Resolution 9 of 2001. This pay system for educators is relatively attractive for new entrants. However, after five to eight years, the salary structure is relatively uncompetitive. The challenge is to redesign the pay structure to retain good, experienced educators, but to also attract new entrants into the profession. If starting salaries are too low, attracting people to the profession becomes difficult. However, if salaries are not increased in real terms as people progress through the system, attrition rates will remain high. Salary progression is also essential in retaining educators in the system. Increased benefits can be based on competency and years of experience. In South Africa progression within a salary level or a promotion from one post to the next should take cognizance of the following:
• Criteria for the assessment should be defined and could include competencies, qualifications and experience.
• Performance should be part of the criteria but we caution against its implementation until a performance appraisal system is developed and accepted by all.
• For practical reasons and comparison purposes, the salary scale for educators should be aligned with the existing public sector salary scale. 62
The Salary Progression is in line with other agreements in the sense that each salary level will have 16 notches and educators will be able to progress from one notch to the next in terms of the instrument contained in ELRC Resolution No.1 of 2003. In terms of the new Post Structure, there are some "categories" where it is possible to move from one salary level to the next through grade progression. For example, an educator on Salary
61 Education Labour Relations Council Annual Report 2001 62 See ELRC study on Career Pathing and Post grading system for educators, June 2000

Page 78
Level 6 may progress (grade progression) to Salary Level 7. The following principles apply in terms of grade progression:
• Grade Progression is not vacancy-based.
• An educator may only progress to the next grade after completion of the last notch in the previous grade, except for Post Level 1 where an educator would be eligible for grade progression after completing the 14th notch.
• An educator will become eligible for grade progression if his/her performance has been "good" for the past three years, in terms of Resolution 1 of 2003. For the first three years of implementation, a phased-in approach will be adopted63.
6.4.3.5 Professional Assessment The main objective of professional assessment is to ensure quality public education for all and to constantly improve the quality of learning and teaching, and for this we are all accountable to the wider community. The Department has the responsibility of providing facilities and resources to support learning and teaching. Successful educational outcomes also depend upon empowering, motivating and training educators. Quality Management seeks to monitor and support these processes. The IQMS can be conceptualized from various angles. It is a system that consists of three inter-related programmes:
• Developmental Appraisal - to appraise individual educators in a transparent manner with a view to determining areas of strength and weakness, and to draw up programmes for individual development.
• Performance Measurement - to evaluate individual teachers for salary progression, grade progression, affirmation of appointments and rewards and incentives.
• Whole School Evaluation - to evaluate the overall effectiveness of a school - including the support provided by the District, school management, infrastructure and learning resources - as well as the quality of teaching and learning.
The introduction of the new Post and Salary Structure, pay progression and performance management, professional development, career-pathing, the multi-faceted incentive scheme as proposed by the Department of Education, the increased re-capitalisation of the education system with a R12.5 billion injection for the current budget year: all these are major steps designed to ensure that South Africa is poised to cater for the adequate provision of highly qualified, motivated and sufficient teachers to meet the EFA target of accessible, quality education for all by 2015.
63 http://www.naptosa.org.za/Update/first_2003_05.html

Page 79
7. CONCLUSIONS, CHALLENGES AND DEPARTMENTAL ACTIONS 7.1. Concluding Summary 7.2. Addressing the Challenges 7.1 CONCLUDING SUMMARY
The responsibility of the Department of Education (DoE) to commit to the Dakar Framework for Action includes the following measures to ensure that by 2015 South Africa has:
A comprehensive early childhood and development programme in place, an ECD programme that will be available to all communities, particularly vulnerable and disadvantaged children That all children have free and compulsory quality primary education That learning needs of all young people and adults are met That there is an improved adult literacy rate That no gender disparities in the participation of learners at primary and secondary
levels are evident That the quality of education is improved especially numeracy, literacy and life skills.
Since 1994, legislative and policy interventions have resulted in the following achievements for the education system:
1. Teachers
The DoE has a dedicated National Teacher Development strategy, which is consolidating gains made after the transition. Since 1994, the DoE has been able to achieve a 30% increase in the proportion of qualified teachers in South Africa. School Improvement and National Teaching Awards are presented annually to acknowledge excellence in the education system. Furthermore, more than 4 000 maths and science teachers have received formal qualifications in the last four years. Finally, a partnership with the Canada-South Africa Teacher Development Project has helped to improve the quality of education by strengthening teacher professional development and support.
2. Rewarding good performance.
A new performance related appraisal system linked to the IQMS has been established. The system will reward teachers that perform well within the public sector whilst keeping them in schools.
3. Near-universal compulsory education.

Page 80
Education interventions have resulted in the sustained participation of over 95% in schooling since the mid to late 1990s and sustained increases in enrolment in all age groups at education institutions. These participation rates are comparable to those in the most industrialised countries.
4. Girls are performing well.
In the Grade 12 Senior Certificate Examination and assessments, girls seem to be doing better at key competency tests. More girls participate in higher education. At higher education institutions, the female share of enrolment has increased over the years from 44.1% in 1993 to 51% in 1999 to about 54% 3.5% in 2001.
5. LOE = X hours @ R118-00 per hour Participation in mathematics, science and technology for female learners is improving, as is participation in higher education of female learners. This augurs well for the creation of knowledge, skills development, research and development envisaged in the Human Resource Development Strategy.
6. Early Childhood Development programme has had a 12% growth in participation in the reception Grade year since 2000, signifying the expansion of access to quality foundation for education by 5 year-olds countrywide.
7. Fewer out of school youth. The DoE has been able to attract more youth back to the school. The number of out of school youth who should be in compulsory schooling has nearly halved since 1996 from 945 000 to 581 000 for 7 - 15 years old, and available data shows that between 1998 and 2000, between 1998 and 2000, the proportion of African students in FET colleges grew from 71% to 76%.
8. Dealing with poverty. The DoE has started a National School Nutrition Programme in our primary schools to provide a meal to children from poor communities. The programme enables participation and enhances learner achievement. The National School Nutrition Programme is projected to be funded to the tune of over R838 million in 2004/5 from an amount of R460 million in 1999. We have established a national financial aid scheme for tertiary education. Students receive financial aid through the NSFAS as bursaries or loans. The average annual increase in higher education enrolment has been just over 12 000 per year since the mid-1990s while the average annual increase in the number of awards made by the financial aid scheme was almost 4 000 (a third of this average annual increase in enrolment). Between 1996 and 2001, the scheme disbursed over R 2,6 billion to almost half a million students in higher education institutions.
9. Curriculum reform and skills development. The government recognizes that the curriculum influences the quality of education outcomes. The curriculum has therefore been modernised to make it more relevant to the needs of citizens of a developing country aiming to achieve sustainable economic and development growth.
10. The development of scarce skills has been a major area of focus for us; Mathematics, Science and Technology have been identified as key development drivers for the country. The Department of Education’s contribution is to improve participation rates in these subjects. Dedicated schools of Mathematics, Science and Technology called Dinaledi

Page 81
schools have been established as part of a National Strategy for Mathematics, Science and Technology aimed at 1) - raising the participation and performance of Black learners (especially females) in Mathematics and Science at Senior Certificate level; 2) providing high-quality education in the three subjects to all learners and 3) increasing and improving human resource capacity to deliver education in the three subjects. Schools of focused learning in the areas of Performing and Visual Arts and Sports have also been established in some provinces. In addition to the Dinaledi schools a White Paper in e-Education and an implementation strategy have been developed to consolidate these interventions in the system, and to create a corps of learners and educators who are fully ‘e’ competent.
11. Dealing with HIV/AIDS in Education. As part of the curriculum, HIV/AIDS education is responsible for the greater awareness on the this subject The DoE has developed and produced HIV and AIDS resource guides that will be used by schools to prepare an action plan to respond to the pandemic. A study is being completed now to identify the factors affecting the supply and demand of educators including the impact of HIV/AIDS.
12. Values in education. The focus of the values in education initiative will be on familiarising learners with Constitutional values and symbols. The revised National Curriculum, completed in 2003, places emphasis on the principles of Social Justice, a Healthy Environment, and Human Rights and Inclusivity. The important role of History in encouraging respect for heritage and diversity in the broader population (in addition to learners) is also recognized. The Revised National Curriculum enhances multilingualism, diversity and respect for different language traditions in a national context and provincial departments of education are obliged to make the necessary arrangements to ensure that the language requirements of learners are met at local level.
Infrastructure in education remains a concern, and the context in which learners learn will receive attention in the coming years.
The challenges facing developing countries such as South Africa are depressingly common and threaten to overwhelm our goals of quality education for all:
• Socio-economic conditions, poverty and unemployment rates in many of our countries encourage dropping out, low achievement and exclusion, particularly for the poor.
• Lack of modern curricula in the right place at the right time. This is particularly true where teacher development and quality are a critical concern.
• Lack of learning opportunities for young people and adults as means to enter the labour market or progress to higher education.
• Lack of maturity of systems of implementation, monitoring, evaluation especially in terms of resource allocation and administrative.
• The problems of coordination of various skills development agencies as well as Government in ensuring coherent quality programmes in Early Childhood, Adult Basic Education and vocational education.
• The drain of teaching skills away from the continent. • The impact of HIV/AIDS on society and how these impact on education and training. • The low levels of development support in African countries especially support which is
not tied with trade.
Page 82
• Challenges of infrastructure degradation and maintenance which play themselves out in many of our rural communities, and the transport and travel of learners to and from rural schools
• Post-primary secondary enrolment, particularly for girls.
Strengthening the participation in, and completion of, programmes in scarce skills areas such as Maths, Science and Technology, South Africa still under performs when compared to other developing countries in the world. The DoE is confident that there is tremendous progress being made in the plans to meet the targets the department has set for itself in achieving the EFA goals.
This report analyses the current stock of teachers, examines factors likely to influence future supply and demand patterns, identifies the challenges relating to ensuring that the education sector is able to develop and sustain a corps of qualified and competent teachers to achieve the EFA goals of access and quality, and finally describes the efforts of the Department of Education in addressing these challenges. Composition of the Teaching Stock Recent research on teacher demand and supply has indicated no quantitative shortages at the present time. However, these same studies project quantitative shortages based on the anticipated effects of: • the impact of HIV and Aids on educators; • fewer candidates entering the teaching profession; • attrition rates among educators as a result of factors other than HIV and AIDS; and • trends in learner enrolments.
However, given the large stock of unemployed or under-employed people who have been trained as educators, and of qualified teachers currently employed in sectors outside of education, there would appear to exist the capacity to ease the urgent pressure to train new educators. It is, however, important to note that while there are teachers who have left the profession but who could become available should there be an immediate shortage, low levels of job satisfaction might impact negatively on the ready supply of these and other potential educators. Gender Distribution Women dominate the teaching profession with over 70 percent of teachers being female. While the number of female teachers has been rising overall, it has not been increasing, to any significant degree, in secondary specialist areas such as Science and Mathematics. This presents a challenge to education authorities either to encourage more female educators to specialize in these learning areas or to design strategies to attract more males into taking these subjects in the teaching profession. Given the current qualitative shortages and projected shortfalls in these areas, both strategies will probably be necessary.

Page 83
Despite the increasing feminisation of the teaching profession, women are still under-represented in management positions in schools in the majority of provinces. Only pre-primary schools and primary schools are largely under the managerial responsibility of women. Age Distribution Recent studies by the HSRC show that the educator workforce is generally older than the formal sector workforce. Twenty nine per cent of educators are 45 and older, compared to only 21 per cent of the general workforce in the formal sector. However, while overall, South Africa’s teaching workforce has aged, it has not done so evenly. Important differences exist in age structure by gender, region, school sector and school level. For example, teachers aged 55 and over form a lower proportion of the teaching workforce than do employees aged 55 and over of the overall national workforce. Thus, while within the teaching workforce, the share of older teachers has increased over the past thirty years, this increase appears to be concentrated in the 45–55 year age group. However, a substantial proportion of the teaching workforce will be eligible to retire on age grounds within the next 5–10 years, a fact which has attracted considerable policy concern. As far as supply issues are concerned, the age profile issue appears to be of greater significance for certain areas of teaching. Given the relatively higher proportion of males in the older age bands, recruitment difficulties may be exacerbated in subject fields dominated by male teachers. This has been identified as a significant policy issue in relation to the quality of teaching, and hence of student learning. While older teachers may be highly experienced and confident in their teaching role, there is also a need for updated curriculum knowledge and pedagogical procedures, as well as for rethinking the structure of a teaching career. Innovative policies may be needed to create opportunities for professional learning for older, highly experienced teachers. Nevertheless, if an increased number of younger candidates do not enter the teaching profession, and remain in it for an extended period, there will be inadequate numbers to replace those who leave the profession due to age. To avert an imminent shortage, government must embark on an intense drive to interest younger people into the profession.
Geographic distribution The distribution of educators is uneven. Rural areas experience both qualitative and quantitative shortages. Teacher Qualifications
The DoE has introduced initiatives to reduce levels of under-qualification in its teacher workforce, mainly through offering an interim in-service, site-based upgrading qualification, the National Professional Diploma in Education (NPDE). As a result of these initiatives, the total number of unqualified and under-qualified educators has been reduced significantly since 1994, when as much as 36 per cent of the workforce fell into this category, having increased

Page 84
consistently during the previous two decades. By 2001, the proportion of unqualified and under-qualified educators had fallen to 18 per cent. According to an ELRC/HSRC study by 2004, the cohort of unqualified or under-qualified educators seems to have further declined to 8.3 per cent. Qualification and REQV levels do not, however, tell the whole story. For instance, there appears to be a lack of educators with adequate training in Outcomes-Based Education (OBE), and in the new school curriculum (RNCS). New Teachers Data is severely lacking on the nature of outputs from the teacher education system. However, a sample study conducted in one province, KwaZulu-Natal provides an interesting profile of newly qualified teachers. First, it suggests that cohorts of new recruits into teaching are unlikely to alter significantly the gender profile of the profession as a whole. They may, on the contrary, even increase the gender imbalance. The study showed also, amongst secondary teachers, that the subjects/learning areas that most teachers are qualified to teach are English, Mathematics, Natural Science, Life Orientation and Technology. These figures correlate with the subjects identified by the DoE as ‘scarce’ subjects, so it appears that institutions are attempting to address these needs. The high proportion of students coming from urban areas would presuppose that they would be less willing to teach in rural areas, were posts in rural areas to be offered them at some stage. It is probable too that these are the majority of students that would have a better grasp of subjects and learning areas like Mathematics, Science and Technology. If this sample were to be taken as a representative sample of the teacher graduate population, then the country would seem to be headed for a serious shortage of teachers in the rural areas, and even more so teachers in the scarce subjects. Teacher Retention The nature and magnitude of attrition The teacher attrition rate is currently estimated at between 5 and 5.5 per cent nationally. In relative terms this is not out of line with international trends but in absolute terms this translates to between 17,000 and 20,000 teachers lost to the system each year. A recent study reported that 54 per cent of educators had considered leaving the education profession. Two-thirds of the educators stating their intentions to quit fell in the technology, natural sciences, economics and management fields. High predictors for leaving the teaching profession were low job satisfaction (in particular: lack of career advancement and recognition, teaching conditions in terms of working hours/load/policies, and lack of discipline and respect), a changed career choice after three years of teaching, high job stress (in particular: problems with teaching methods and administration and problems with the educational system), being white, coloured or Indian/Asian, five to 19 years’ teaching experience and the urban location of the school. Medium predictors were being male, low morale at school and high violence experienced at the school in the past 12 months. Low predictors were low educator support and high educational qualification, and high annual income.
Page 85
In summary, the findings imply that South Africa may experience shortages at two levels. Firstly, there is likely to be increased shortages of teachers in rural schools due to difficulty in recruitment of educators willing to work in rural contexts. Secondly, there is likely to be a shortage in urban schools with urban teachers leaving to explore other career opportunities. Available data provide four broad categories of reasons for termination that are increasing: resignations, retirements, medical incapacity and death. Factors influencing attrition A survey of teachers conducted as part of the study identified the following factors:
• Disintegration of discipline (thus causing unfavourable working conditions). • Lack of facilities for teaching – especially subjects such as Science and technology. • Severe overcrowding of schools and classrooms – this in spite of a generally acceptable
national average learner-teacher ratio. • Lack of adequate incentives. • Poor parental participation at all levels: school governance and the disciplining of
children. • Policy overload, leading to dissatisfaction with time allocation, and making working
conditions unbearable through the increase in administrative work. • Role conflict. Teachers claim they have to adapt and adopt a multitude of roles depending
on circumstances presented at school. These roles include attention to counseling, teaching, acting as locus-in-parentis, doubling as security personnel and sometimes even performing as midwives.
• Blatant favouritism and nepotism at school governance levels. Other factors that could influence attrition are: lack of safety at schools, low teacher job satisfaction and morale, and inadequate remuneration and other material incentives.
Implications of HIV and AIDS for Teacher Supply and Demand A recent HSRC study suggested that the proportion of HIV-positive educators with a CD cell count of 22 per cent is higher than that reported in other studies conducted in sub-Saharan Africa. The study also suggests that HIV prevalence among educators was higher for those aged 25 – 34 years (21 per cent). In addition, the study found that Africans had a prevalence of 16.3 per cent, compared to less than 1 per cent amongst Whites, Coloureds and Indians. Educators who had a low socio-economic status had a higher prevalence. The study also found that educators residing in rural areas and those working in rural schools had higher HIV prevalence than educators residing in urban areas and teaching in urban schools. It also revealed that educators employed in KwaZulu-Natal and Mpumalanga had the highest HIV prevalence among all the provinces. Research reports project that AIDS will soon become the leading cause of deaths among teachers. Up to 3.5 per cent of teachers could die annually from AIDS by 2010.

Page 86
These high levels of AIDS-related illness and death among employees will have a significant impact on the education sector. Performance of remote schools or those with small staff complements, such as farm schools, will be particularly vulnerable, as will institutions with high workloads and less reserve capacity to spread loads.
Improving Teacher Supply Improving teacher supply is one way of mitigating the effects of the losses described in the preceding sections. South Africa faces challenges with its pool of available educators. One of these challenges is that of attracting new educators into the teaching profession and another is the challenge of how to retain those already in the system. At present the country is not producing enough teachers to balance out the effects of annual attrition. There has been a decline in students taking the Initial Professional Education of Teachers (IPET) qualifications, namely the undergraduate Bachelor of Education (BEd) and the Postgraduate Certificate in Education (PGCE). Self-reported data from the Deans’ Forum in 2004 indicated that education institutions are producing at best approximately 9 000 graduates of whom at least about 3 000 may already be practising educators. The decline in enrolment is significant among black Africans. Improved career opportunities for black applicants have not only reduced the number of applicants who enter the education sector, but have also had an impact on the supply of educators because even the small pool of education graduates may not necessarily end up teaching. They are likely to seek employment in other fields where their teaching skills are valued, such as in training-related careers or marketing. It was also found that the older patterns of oversupply in urban schools and undersupply in rural schools have persisted and newly trained educators have difficulty in finding posts (even in rural schools). Another supply-side challenge is the increasing pattern in the international migration of teachers. Teacher Candidates The present demographic profile of students who take teaching is a cause for concern, with serious implications for the provision of new teachers in traditionally disadvantaged reaches of the schooling system. The profile of existing teacher candidates reveals that students intending to go into teaching are most likely to be female, young, to be studying the humanities rather than science or engineering, are white, and tend to prefer the primary rather than the secondary school sector. There are relatively few black student teachers particularly in the Foundation phase. Student Teacher Enrolment The number of students enrolled in initial teacher education programmes sustains the flow of new entrants into the profession. According to recent research on trends in the period 1999-2003, there has been an overall decline in student-educator enrolment by approximately 24.3 per cent. In 1997 there were 142 169 students enrolled for teacher preparation programmes in South Africa. Enrolment dropped to 130 000 in 1998; and of the 107 000 students enrolled at

Page 87
universities in 2001, only 20 321 were enrolled as full-time students. The number of education graduates peaked at 35 628 in 1999 and drastically declined to 22 958 in 2002, although it increased slightly to 25 308 in 2003. Initial Teacher Education Key issues highlighted in the report in this regard relate to the impact on supply (especially in the rural areas) of reforms in teacher training (colleges of education vs. universities), the equity issues relating to cost of study at the universities as opposed to the former colleges of education and the higher admission requirements at the universities. Recruitment and Retention Strategies With regard to vacancies, the preliminary findings of a study being conducted by the DoE reveal that virtually all of the districts surveyed indicated that they are currently having difficulty recruiting and employing new teachers. Of the 372,689 teaching posts reported by the Department of Education, some 14 000 posts remain unfilled. Despite improved appointment rates, filling of vacancies is still a challenge the Department of Education is faced with. A further analysis of posts which are not being filled, reasons, and geographic distribution of such vacancy posts is necessary. Leaving these vacancies unfilled impacts on the quality of education, because it leads to these posts being filled by unqualified teachers. If that is not the case, then other educators would be overloaded with teaching as they have to share the workload of the vacant post. This causes problems especially when these teachers then have to teach outside of their areas of specialisation.
Recruiting and retaining teachers in rural areas Recruiting educators for rural schools is one of the challenges facing the provincial education departments. The teaching profession in rural areas is characterised by a critical shortage of qualified educators particularly in physical science and mathematics. Morale is low because of poor conditions of service and the dire teaching environment in many schools. The report suggests a number of measures to improve recruitment and retention of rural teachers.
Improving conditions of Employment for Educators Improved conditions of service are key to retaining educators in the profession. From the moment the educator begins teaching, employment conditions must be in place to ensure that they grow into the profession. Among the issues analysed in the report in this regard are the following: induction; career pathing; remuneration/material incentives; post and salary structure; pay progression and performance management; and professional assessment.
Page 88
7.2 ADDRESSING THE CHALLENGES This section identifies first some of the teacher-related challenges facing the Department of Education. Second, it describes how the DoE is already addressing several of these challenges. The challenges relate broadly to:
• Education Policy and Planning;
• Teacher Education and Professional Development;
• Teacher Recruitment and Retention;
• Teacher Remuneration and Material Incentives; and
• Teaching and Learning Conditions
7.2.1 Challenges
7.2.1.1 Education Policy and Planning
• Provincial education departments (PEDs) will need to develop or refine comprehensive data systems that provide information on teacher supply, teacher quality and teacher mobility. This information must be analysed, documented and relayed to the Department of Education to assist with policy formulation.
• To develop effective data systems, a high degree of co-operation among key players is
critical. All necessary parties will have to participate in the data development and collection effort, and ministers and legislature MEC’s must be supportive.
• Policies for recruitment will have to be balanced by policies for retention. These must
include the Department of Education developing a national plan in partnership with educator and labour representatives, parents and other stakeholders64. It is important to listen to the teachers and address their concerns.
• Aligning recruitment policies and practices with the interests and expectations of
prospective teachers will be crucial65.
7.2.1.2 Teacher Education and Professional Development
• The Department of Education and Provincial Education Departments need to ensure accessibility to teacher education through appropriate means of financial assistance, such as contract bursaries.
64 LRC study 65 NFTE report 2005

Page 89
• Every new teacher should be required to participate in a formal induction and/or mentoring programme, to be developed at the local district level or school site to provide extensive and intensive professional development for all new teachers.
• The final year of initial teacher education could be used as a period of site based teacher
development through a “practical internship”.
7.2.1.3 Teacher Recruitment and Retention
• Recent research has suggested that, to ensure that there are adequate numbers of educators to serve the system66, there has to be an immediate increase in the number of students recruited into teacher training.
• The Department of Education needs to assess the supply of educators in rural areas. It
must take into account gender equity and consider the current shortages of trained educators in key learning areas and how recruitment and retraining of unemployed educators can alleviate existing and potential shortages.
• The Department of Education needs to engage in a recruitment drive amongst rural
communities, and provide financial incentives for rural candidates to enter the teaching profession67. Strategies to attract black teacher candidates particularly to specialize in Foundation phase teaching must be put in place to ensure a continual supply of these teachers.
• A countrywide advisory group should be appointed to plan and advocate for policies and
strategies to help school districts succeed in recruiting and retaining well-qualified teachers in difficult-to-fill teaching fields.
7.2.1.4 Teacher Remuneration and Material Incentives
• Salary increases are the most direct and powerful way to demonstrate the value accorded to the education profession. A lack of financial progress following entry into the profession could encourage attrition after a few years and needs to be addressed68.
• Teachers need to be released from administrative tasks and other activities that increase
their workload and distract attention from their fundamental responsibilities.
66 Hall 2002 67 Ministerial Report on Rural Education 2005 68 ELRC study, 2005

Page 90
• Teachers need more steps on their career ladders across their entire career path. The promotion structure should allow for career advancement opportunities that do not remove educators from the classroom69.
• There is a need to create financial incentives to recruit and retain teachers in hard-to-fill
teaching positions. Shortage areas will be defined for this purpose at the level of districts. Incentives might include salary increments, bonuses for continuing in teaching positions, and support for professional development.
• Financial incentives offered by employers, such as scholarships, arrangements to pay
specialist teachers’ accumulated Higher Education contribution scheme (HECS) debt, and assurances of employment (often in specified rural areas), have proved successful in drawing an expanded cohort of suitable people to teaching70.
7.2.1.5 Teaching and Learning Conditions
• The NFTE report suggested interventions that are necessary to sustain the recruitment of candidates into teaching, for example, a campaign for the renewed status of teachers. Media campaigns need to be waged to enhance the image of the profession.
• Public awareness and appreciation of teaching as a profession have to be raised.
• There needs to be carefully designed and effective solutions for the problems relating to
school and classroom discipline. Teachers need to be provided with a workable alternative to corporal punishment and punitive discipline in the classroom, so that learners who want to can do so in an environment conducive to learning.
7.2.2 Departmental Actions
The DoE has taken the following steps to revitalize the teaching profession, and make teaching a “first choice” career.
1. Designed a new teacher career path structure that has been exceptionally well received by the profession. School-based posts of senior teacher and education specialist have been created, which will allow for much greater promotion opportunities. In addition, an entirely new career path in “learning and teaching” will allow a teacher to progress to the most senior levels, equivalent to a school principal, without ever leaving the classroom, and the next step would be into the subject advisory services. Such teachers would however play a mentoring role in the induction of new recruits, and in supporting other teachers of the subject.
69 ELRC study, 2005 70 NFTE Report 2005

Page 91
2. The Minister of Finance allocated R4.2 billion over the next three years to improve the service conditions of teachers. The money are distributed to
recruiting scarce skills into the profession, such as the appointment of 400 new maths and science teachers in the specialised dinaledi schools, ensure well-qualified teachers in some of our poorer urban and rural schools pay additional rewards for our top-performing teachers, over and above the current 1%
payable for “satisfactory” service provide career path benefits to ordinary teachers by creating a longer salary scale, up to
level 9 of the public service. This will allow a classroom teacher to progress to higher salary levels, where they would be able to earn up to R155 000 per annum.
3. The department has allocated and ring-fenced a substantial portion of the National Student Financial Aid Scheme that has supported a number of trainee teachers. Regrettably, this amount (R50 million per year) has not been fully utilised, and there is an acknowledged need to review this approach to the funding of student teachers.
One option that is promoted and increasingly being used is the payment of “full-cost” bursaries to trainee teachers by a provincial education department in return for a service contract for an equivalent period. This enables a department to target its support to students in particular fields, like maths and science, and to safely plan for the future. As needs arise, provinces will increase the number of bursaries to meet the demands.
4. Learnerships are also being pursued in the education sector, with the ETDP SETA supporting some 880 “learner teachers”, of whom the first cohort will be graduating at the end of this year. These “learner teachers” are currently studying through a university, while employed in a school at rates determined by the minister of labour. This is a flexible and cost effective approach to teacher education, and can be used to address urgent needs, but the difficulties of quality assurance in this new mode of delivery require ongoing attention.
Page 92
BIBLIOGRAPHY
1. Arnold CL, Choy SP, Bobbitt SA. Modelling Teacher Supply and Demand, with Commentary. National Center for Education Statistics; 1993.
2. Badat S. Black Student Politics, Higher Education and Apartheid: From SASO to SANSCO. 1968 – 1990. Pretoria: Human Sciences Research Council (HSRC); 1999.
3. Ballou D. Do Public Schools Employ the Best Applicants? Quarterly Journal of Economics, (1996); 111(1), 97.
4. Beer M, Eisenstat R A, Spector B. Why change programmes don’t produce change. In Howard R, ed. The learning imperative: managing people for continuous innovation. USA: Harvard Business Review; 1990.
5. Bisschoff T, et al. Project Management in Education and Training. Pretoria: Van Schaik; 2004.
6. Bot M, Pienaar L. TUATA: Transvaal United African Teachers’ Association. Pretoria: HSRC; 1999.
7. Burger JF, Vermaak A. Directory of HSRC-rated Courses Offered in the Private Education and Training Sector.
8. CEPD. Transformation of African schooling System: a report from the third year of education 2000 plus; a longitudinal study to monitor education policy implementation and change. 2002.
9. Chinapah V. With Africa for Africa: Towards Quality Education for All. Pretoria: HSRC; 2000.
10. Chisholm L, Vally S. The culture of learning and teaching in Gauteng schools. Johannesburg: EPU; 1996.
11. Christie P. Right to Learn: The Struggle for Education in South Africa. 2nd ed. Randburg: Ravan Press; 1991.
12. Coombe C; Mitigating The Impact of HIV/AIDS on Education supply, Demand and Quality. www.unicef-icdc.org/research/ESP/aids/chapter12.pdf
13. Cosser M. The shape of skills to come: higher education and the supply demand complex in South Africa, 2001.
14. Cross M, et al. eds. Dealing with Diversity in South African Education: A Debate on the Politics of a National Curriculum.
15. Cross M. Resistance and Transformation: Education, Culture and Reconstruction in South Africa. Johannesburg: Skotaville; 1992.
16. Crouch L, Perry H. Educators in HRD Review 2003; HSRC Press: Cape Town; 2003. 17. Darling-Hammond L. Solving the Dilemmas of Teacher Supply, Demand, and Standards:
How Can We Ensure a Competent, Caring, and Qualified Teacher for Every Child? Washington DC: National Commission on Teaching and America’s Future; 2002.
18. Department of Education. A call to action: Mobilising citizens to build a South African education system for the 21st century. Statement by Professor Kader Asmal, Minister of Education, 27 July. Pretoria. 1999
19. Department of Education. Annual Report 2003/4 20. Department of Education. Report to minister on teacher supply and demand: education
human resources planning chief directorate. August 2004 21. Dlamini N. Organising South African industry - university partnership programmes for
viability. South African Journal of Higher Education. 2001; 15(3): 24-31. 22. Du Toit CW, Kruger JS, eds. Multireligious Education in South Africa. Pretoria: 1998.

Page 93
23. Education, Training and Development Practices SETA. Sector Skills Plan; 2005-2009. 24. ELRC. Educator Attrition and Mortality in South Africa: A study into Gross Educator
Attrition Rates and Trends, including Analyses of the causes of these by Age and Gender. Public Schools System in South Africa 1997- 2004.
25. ELRC. Potential Attrition in Education: the impact of job satisfaction, morale, workloads and HIV/ AIDS; 2005.
26. ELRC. Report on HIV positive educators in South African public schools; 2005. 27. ELRC. Report on the Health of our Educators: A focus on HIV/ AIDS in South African
Public schools, 2005. 28. Fleisch BD. Managing Educational Change: The State and School Reform in South
Africa. Sandton: Heinemann; 2002. 29. Garson P. Education in South Africa. 2003. 30. Graaf J, et al. Teaching in the Gap: Implementing Education Policy in South Africa in the
Nineties. Hatfield. 31. Gravett S, Geyser H. Teaching and Learning in Higher Education. Pretoria: Van Schaik;
2003. 32. Hall G. The Impact of the AIDS pandemic on teacher Supply and Demand in South Africa
2001- 2010. 2002. 33. Harber C. State of Transition. Oxford: Symposium Books; 2001. 34. Harley A, et al. A Survey of Adult Basic Education in South Africa in the 90s.
Johannesburg: Sached; 1996. 35. Hartshorne K. Crisis and Challenge: Black Education, 1910 – 1990. Cape Town: Oxford
University Press; 1992. 36. Hartshorne K. The making of education policy in South Africa. Oxford University Press;
1999. 37. Hofmeyer I, James D, Lodge T, eds. Holding their ground: class locality and culture in the
19th and 20th century South Africa. Johannesburg: Ravan. 38. Human Science Research Council. School register of Needs Survey. Education
Foundation, Research Institute for Education Planning; 1997. 39. Hutton B, ed. Adult Basic Education in South Africa. Cape Town: Oxford University Press
Southern Africa; 2004. 40. Hyslop J. School boards, school committees and educational politics. In Bonner: 1989. 41. Ingersoll RM. Teacher Turnover and Teacher Shortages: An Organizational Analysis.
American Educational Research Journal, 2001a: 38(3), 499–534. 42. Ingersoll RM. Teacher Turnover, Teacher Shortages, and the Organization of Schools.
Seattle, Wash.: enter for the Study of Teaching and Policy. 2001b. 43. Kallaway P, ed. The History of Education under Apartheid 1948 – 1994. Cape Town:
Pearson Education; 2002. 44. Kallaway P. Apartheid and Education: The Education of Black South Africans.
Johannesburg: Ravan Press; 1990. 45. Kemmis, McTaggart. The action research planner. Victoria, Australia: Deakin University
Press; 1988. 46. Kraak A, ed. Changing Modes: New Knowledge Production and Its Implications for Higher
Education in South Africa. 47. Kraak A, Young M, eds. Education in Retrospect. Pretoria: HSRC and Institute of
Education; 2001. 48. Lindle JC. Lessons from Kentucky about school-based decision-making. Education
Leadership, 1996: 28(3): 333-349.

Page 94
49. Maree K, Ebersohn L. Lifeskills and Career Counselling. Johannesburg: Heinemann; 2004.
50. Mboya MM. Beyond Apartheid: The Question of Education for Liberation. Cape Town: Esquire Press; 1993.
51. Ministerial Committee. Report on Rural Education: A new Vision for Rural Schooling. February 2005.
52. Mncwabe MP. Post-Apartheid Education. Lanham, Maryland (USA): University Press of America; 1993.
53. Mobile Task Team on the impact of HIV/ AIDS on Education: Educator Attrition and Mortality in South Africa: A study into Gross Educator Attrition Rates and Trends, including Analysis of the Causes of these by Age and Gender, in the Public Schools System in South Africa 1997- 2004. ELRC; 2005.
54. Mokadi A. A Portrait of Governance in Higher Education: Taking a Stand for Education. Johannesburg: Sedibeng PublishingHouse; 2002.
55. Morrow W, King K, eds. Vision and Reality: Changing Education and Training in South Africa. Cape Town: University of Cape Town Press; 1998.
56. Motala S, Mungadi R. From policy to practice: Achieving quality education in post-apartheid South Africa. Presented at: SACHES Conference, 30 September1999; Roodepoort, South Africa.
57. Motala S, Vally S, Modiba M. “A call to action”. A review of Minister K Asmal’s educational priorities. Quarterly Review of Education and Training in South Africa. 1999: 6 (3): 11-13.
58. Motala S. Quality performance indicators and the School Register of Needs; 1997. 59. Murnane RJ, Singer JD, Willett JB. The Influences of Salaries and “Opportunity Costs” on
Teachers’ Career Choices: Evidence from North Carolina. Harvard Educational Review. 1989: 59(3), 325–346.
60. Mwamwenda TS. Educational Psychology: An African Perspective. Johannesburg: Heinemann; 2004.
61. National Framework for Teacher Education: report MCTE; Dec 2004. 62. Nelson D, ed. The A-Z of Careers: The South African Career Encyclopaedia. Cape Town:
Don Nelson; 2004. 63. Nicolaou G, Nicolaou E. The School Guide Book. Johannesburg: G.E.N. Publishing;
1998. 64. Nilsson P. Education for All: Teacher Demand and Supply in Africa. Education
International Working Papers No 12: November 2003. 65. Pandor N. The debate on the Education budget Vote 15; National Assembly, 2005. 66. Parker B. Roles and Responsibilities, Institutional Landscape and Curriculum Mindscape:
A partial View of Teacher Education Policy in South Africa. In Lewin K, Samuel M, and Sayed Y. Changing Patterns of Teacher Education in South Africa. Heinemann; Johannesburg; 2003.
67. Pendlebury S. Transforming teacher education in South Africa: a space-time perspective. Cambridge Journal of Education, 1998; 28(3): 333-349.
68. Pretorius F, ed. Outcomes-Based Education in South Africa. Randburg: Hodder and Stoughton; 1999.
69. Republic of South Africa 1996a. South African Schools Act. Pretoria: Government Printers.
70. Republic of South Africa 1996b. National Education Policy Act. Pretoria: Government Printers.
Page 95
71. Roussouw JP. Labour Relations in Education: A South African Perspective. Pretoria: Van Schaik; 2004.
72. Samoff J. No teacher guide, no textbooks, no chairs: Contending with crisis in African education. In Arnove RF, Torres CA, eds. Comparative Education. The dialectic of the global and the local. Lanham: Rowtree & Little; 1999.
73. Saunders S. Vice-Chancellor on a Tightrope: A Personal Account of Climactic Years in South Africa. Cape Town: DavidPhilip; 2000.
74. Sekete P; et al. Deracialisation and Migration of Learners in South African Schools. Pretoria: HSRC; 2001.
75. Shield PM, Knapp MS. The promise and limits of school based reform. A national snapshot. Phi Delta Kappan. 1997;79(4): 288-294.
76. Shindler J, Bot. Literacy in South Africa - an update. EduSource Data News. March1999. 77. South Africa Yearbook 78. Squelch J. Governance of education. In Lemmer E, ed. Contemporary education: Global
issues and trends. Sandton: Heinemann; 2000. 79. Steyn JC. Education for Democracy. Durbanville: Wachwa Publishers; 1997. 80. Survey. Quarterly Review of Education and Training in South Africa, 5(1): 2-5. 81. Taylor N, Diphofa M, Waghmarae H, Vinjevold P, Sedibe. Systemic and institutional
contexts of teaching and learning. In Taylor N, Vinjevold P, eds. Getting learning right. Johannesburg: The Joint Education Trust; 1999.
82. Vally S, Spreen C. Implementation of Curriculum 2005. Quarterly Review of Education and Training in South Africa. 1998;5(3):13-16.
83. Van Wyk N. Organisation and governance of education in South Africa. In Pretorius F, Lemmer E, eds. South African education and training. Transition in a democratic era. Johannesburg: Hodder & Stoughton; 1998.
84. Walters S, ed. Globalisation, Adult Education and Training: Impact and Issues. London: Zed Books; Cape Town: CACE Publications, 1997.

Page 96
APPENDIX 1 The ILO Framework seeks to achieve the following:
1. To investigate the context of the national education system, by exploring: • The overall structure of the South African education system. • The demographics of the system with regard to learners/students in the system and
providing projections to 2015. • The financing or funding of the system to ensure sustainability of the system towards
meeting its commitment to EFA 2015. • The governance / administration of the system at different levels down to the local school
level. • Teacher education and training requirements. • Public support and constituent considerations for the education system in South Africa.
2. To determine the composition of the teaching profession, by examining: • The numbers of teachers by level of education and component type. • Gender distribution of teachers by level of education and positions of responsibility. • The age distribution of teachers by level of education. • The geographic distribution of teachers by national and provincial sub-units (regions /
districts, etc.). • The existence or non-existence of auxiliary teaching staff or any less than fully-qualified
teachers engaged in part-time or full-time teaching. • Teacher qualifications: this would include the numbers or percentages of teachers at the
official qualification levels by gender, age and geographic distribution. • The professional development of teachers: estimates of numbers or percentages of
teachers having access to and undergoing professional development. • The retention and distribution practices of the system: numbers leaving the profession
and reasons. 3. To explore teacher candidates, recruitment, education and professional development, by looking at: • Perceived difficulties in attracting individuals to the profession. • The qualifications and motivations of persons who choose to enter the profession. • Identified weaknesses in initial teacher training programmes, structure and content
affecting different strata of the teaching sector. • Deficiencies in the skills and competencies of the present working teacher force and
motivation. • Professional development. • Professional assessment tools and methodologies such as the IQMS.

Page 97
4. To examine the employment, careers, teaching and learning conditions, by looking at: • The recruitment and induction practices used in the Department of Education system for
new and returning teachers. • The placement criteria for first assignments. • Mentoring by experienced teachers. • The impact, weaknesses, reforms on recruitment and job satisfaction in rural and
disadvantaged areas. • The transfer and promotion criteria, including their application on vulnerable or
marginalized groups. • Remuneration and material incentives packages. • Teaching and learning conditions. • Leave provisions. • Targeted incentive programmes.
5. To investigate mechanisms of social dialogue and participatory decision-making in education, by looking at and documenting:
• The information sharing process on education policies and planning between education authorities, private school employers and teachers organizations.
• Structures incorporating teachers into EFA and other major education reforms. • The mechanism of consultation between different parties and stakeholders on a variety of
major issues. • Negotiation and collective bargaining mechanisms.
6. To make policy recommendations on: • Education policy and planning with attention to teacher involvement at school and district
level through elected representatives. • Teacher professional development. • Recruitment and retention, career incentives and disincentives. • Teacher remuneration and material incentives. • Teaching and learning conditions. • Social dialogue between employers and unions on teacher shortages issues.

Page 98
APPENDIX 2: Definition of teacher-related concepts A number of concepts used in this study are specific to the context of teacher supply and demand. Teacher Shortages In this report teacher shortages are considered not only in relation to demand and the supply of new recruits, but also in relation to how many are lost each year through early departure. A revolving-door syndrome inflates the demand side of the equation and keeps schools in a perpetual state of intense pressure and de-stabilization. In this study we look at the concept of shortages in terms of both quantitative shortages and qualitative shortfalls. Significant factors leading to both qualitative and quantitative deficits are:
• A recruitment shortage that occurs when too few candidates are attracted to a particular subject area or role or school phase, often because it is seen as too stressful or difficult.
• A training shortage which occurs when there are not enough accessible teacher preparation programmes to produce the number of educators needed for a particular role.
• A distribution shortage which occurs when too few qualified educators are willing to work in or relocate to the school districts having the greatest need.
• A systemic shortage attributable to formulae established by the PPN71 and other deployment drivers.
Educator Supply Educator supply refers to the existing and anticipated pool of available educators, and is usually measured in terms of specific areas of demand (school phases, learning areas and subjects). Some of the issues that should receive attention in discussion of educator supply are pre-service training trajectories, educator demand factors, long-range age and gender profiles of educators, the attractiveness of the educator profession, economic factors that attract and retain educators, and educator attrition. The supply of teachers can be divided into two groups:
• The current supply of teachers. • The potential supply of teachers.
The current supply of teachers comprises those who already serve in the teaching workforce. The potential supply comprises two cohorts, those who are currently in pre-service training, and those who are currently not teaching but who are qualified to teach and would consider teaching if the conditions were right. The supply issues at stake are therefore ones of recruitment and retention, as well as inducements for the return of individuals who have left the profession. Teacher supply can be measured by looking at:
1. Changes in the Pool of Inactive Teachers (PIT). ‘Inactive teachers’ refers to those who were previously in teaching or were trained as teachers and have either left the teaching profession or have not entered into teaching.
2. Changes in the size of the pool of recoverable teachers (PRT).
71 Post-Provisioning Norms and Standards

Page 99
3. Changes in the supply of teachers where the supply is measured according to the Zabalza72 definition.
4. The number of new entrants into teaching. 5. The number of those leaving teaching. 6. The number of people enrolling and leaving teacher training programmes before
qualification 7. Restricted employment prospects due to teacher licensing policy 8. Regulations governing certification by the South African Council for Educators
(SACE).
Educator Demand Educator demand refers to the number of classroom practitioners, school managers, district and provincial officials required by the system. It is constantly affected by population changes and demographic shifts. It depends on the total number of pupils of school-going age in the country, and on national norms for learner / educator ratios. Educator Utilization Some of the issues that should receive attention in terms of educator utilization are: the efficacy of the current post-provisioning approach; district-level deployment of educators; school-level time management; the role of SGBs; class sizes; classroom technology; and systems of support, reward and punishment for educators.
Educator Development Evaluation of educator development strategies includes assessment of the effectiveness of existing training programmes, the capacity of training systems to reach all educators over a planned period of time, appropriateness of current training materials, and school-based and district-based educator development initiatives.
Educator Identity This refers to the way educators view themselves, how they are viewed by their employers, how they are viewed by society, and how their social image and status impact on educator policy and strategy.
Teacher Attrition As indicated in a study conducted by the HSRC for the Education Labour Relations Council 73 during 2004, teacher attrition is usually calculated as a rate measured over a specified period (the number who leave teaching in proportion to the gross number employed). An aggregated attrition number includes those who have departed due to resignation, retirement, death, medical incapacity, dismissal, voluntary retirement, and retrenchment for operational reasons. 72 Zabalza. (1979). Changes in teacher supply measured by measuring the total number of serving teachers.
73 HSRC/MTT Report, 2005
Page 100
APPENDIX 3: Governance, administration and public statutory support Following legislation Good governance and good administration is central to the provision of quality education. Equally important, a clear, regulated, freely accessible interaction between central government, the Department of Education and its public statutory partners in education is a key factor in the continued systemic rollout of the education process, that will cater for the greater good of the communities in which the education system operates. The establishment of bodies and committees that have long-term vision and sustainability is crucial to a country’s social, political, educational, economic, and moral development, so that it can build a citizenry that will be able to devolve the benefits gained now, long into the future and for generations to come. With the guidance offered by the Constitution, the establishment of these bodies becomes necessary to ensure that the constitutional mandates are attained and maintained for the benefit of South Africa and all who live inside its borders. The National Education Policy Act (NEPA) of 1996 makes for provision for the system of governance in the education system. NEPA further establishes the main bodies responsible for governance of the system, beginning with the Council of Education Ministers (CEM).
Council of Education Ministers (CEM) The CEM council consists of the National Minister, the Deputy Minister of Education, and every provincial political head of education (Member of the [provincial] Executive Committee for Education). The national Director-General of Education reports on the proceedings of the Department, and advises The CEM on any other matter relating to the responsibilities of the Department. Meetings of the CEM may also be attended by the chairperson of the Portfolio Committee on Education in the National Assembly. The functions of the Council are to-
• promote a national education policy, which takes full account of the policies of the government, the principles contained in section 4 of NEPA, the education interests and needs of the provinces, and the respective competence of Parliament and the provincial legislatures in terms of the national Constitution;
• share information and views on all aspects of education in the Republic; and • co-ordinate action on matters of mutual interest to the national and provincial
governments.
Heads of Education Departments Committee (HEDCOM) HEDCOM consists of the national Director-General of the Department of Education, the Deputy Directors-General of the Department; and the heads of the PEDs. The functions of the Committee are to-

Page 101
• facilitate the development of a national education system in accordance with the objectives and principles provided for in the NEPA;
• share information and views on national education; • co-ordinate administrative action on matters of mutual interest to the education
departments; • advise the Department on any matter contemplated in respect of education, or on any
other matter relating to the proper functioning of the national education system.
The Committee has the power to establish different subcommittees to assist it in the performance of its functions, and may appoint persons who are not members of the Committee to be members of a subcommittee. The organized teaching profession is entitled to nominate representatives as members of each subcommittee.
In addition to these bodies, the Minister of Education is empowered to establish a National Education and Training Council, whose membership should reflect the main stakeholders in the national education system. This Council advises the Minister on broad policy and strategy, for the advancement of an integrated approach to education and training.
Public statutory support The education support system is comprised of structures within the department, and of public statutory entities. These include: South African Certification Council (SAFCERT), now incorporated as UMALUSI. The Council was established in terms of the South African Certification Council Act of 1986 as amended by the Education Laws Amendment Act of 1999. The Council is primarily responsible for issuing certificates to candidates who have successfully completed school or technical college education. It ensures that such certificates represent consistent standards of education and of examination. This public entity is self-funded and does not benefit from government subsidies or transfers. Revenue comprises fees charged for issuing certificates and interest on investments. UMALUSI has responsibility for assuring the integrity and quality of the Senior Certificate examination process. It is in charge of curricular norms and standards, moderation of assessment, and the certification of school-leaving qualifications. The South African Qualifications Authority (SAQA). This is a statutory body established in terms of the South African Qualifications Act of 1995. It actively oversees the development and implementation of the National Qualifications Framework (NQF). As part of its functions it focuses on ensuring access, quality, redress and development for all learners through an integrated national framework of learning achievements. SAQA provides accreditation of bodies responsible for monitoring and auditing achievements in terms of such standards and qualifications. SAQA also oversees the implementation of the NQF by ensuring the registration, accreditation and assignment of functions to the bodies, as well as registration of national standards and qualifications on the framework. The Council on Higher Education (CHE). The CHE was established in terms of the Higher Education Act of 1997. It is responsible for advising the Minister of Education on all aspects of higher education, in particular the new funding arrangement, language policy and the

Page 102
appropriate shape and size of the higher education system. The CHE is also responsible for designing and implementing a system for quality assurance in higher education, as well as establishing the Higher Education Quality Committee. It promotes access of students to higher education; publishes an annual report on the state of higher education for submission to Parliament; and convenes an annual summit of higher education stakeholders. National Student Financial Aid Scheme (NSFAS). The Scheme was established in terms of the National Student Financial Aid Scheme Act of 1999. Its role is to allocate loans and bursaries to eligible students in public higher education; develop criteria and conditions for the granting of loans and bursaries to eligible students in consultation with the Minister of Education; raising funds; recovering loans; maintaining and analysing a database; undertaking research for the better utilisation of financial resources; and advising the Minister on matters relating to student financial aid. This fund plays an important role in funding access to teacher training, by affording them quality education to become effective practitioners. If this fund was not available, many young, aspiring teachers would not make it to institutions of higher learning. The South African Council for Educators (SACE). Established in terms of the South African Council for Educators Act, 2000, SACE is responsible for the registration and de-registration, promotion and professional development of educators, and for setting, maintaining and protecting the ethical and professional standards of educators. SACE acts to enhance the status of the teaching profession through the promotion of the development of educators and their professional conduct. The powers of the SACE include taking disciplinary measures against teachers who are guilty of professional misconduct. It may also strike teachers from its register - in the same way that the Medical Council scraps doctors from its roll. This is an important step towards making teaching a professional career. SACE does not receive direct funding from government but relies on employees’ membership fees as its main source of revenue. This body provides a quality function towards the attainment of EFA goals. The Education Labour Relations Council (ELRC). This body comprises representatives from the Department of Education, SACE and all educator unions. Its role is to provide a quality, effective, efficient and non-partisan administrative and facilitative mechanism for labour peace and for the development of a quality education sector. The National Board for Further Education and Training (NBFET). This Board advises the Minister of Education on all matters related to the transformation of Further Education and Training Institutions (FETI’s). School Governing Bodies: The South African Schools Act governs the national school sector. The act acknowledges the effectiveness of decentralisation and devolution of power and as such devolved school governance power to school communities. The Act provides for local governance of schools through the formation of school governing bodies or SGBs. These consist of the head of the school (ex officio) and representatives of the educators, learners (in secondary schools only), parents and non-academic staff of schools. Their powers include provision to set fees, subject to parental approval. SGBs also determine the school’s admissions policies, and this provision has led, in some cases, to school populations differentiated by class and race. Participation by both

Page 103
lay governors and school managers is aimed at separating governance from education-specific management. Despite the significant difficulties facing the educational system in South Africa, governing bodies provide a good prospect of enhancing local democracy and improving the quality of education for all learners. However, recent studies on school governance (including focus group interviews conducted for the purposes of this report) have revealed that, although most schools have SGBs, many of them seriously lack capacity. In many rural areas there is a high rate of illiteracy and lack of knowledge and skills to ensure the effective functioning of these governance committees.74 Many SGB members have a low level of education. Some do not appreciate the importance of their involvement in school matters. There are indications that, in many cases, the parent component of the SGB does not attend meetings because they do not get paid for their services. Intense training for SGB members on their roles and responsibilities is critical. This training should be conducted on an ongoing basis, to enhance appreciation of the critical role that can be played by an SGB, and to eradicate any out-dated perceptions of a school committee mentality based on the “bossing” of principals. Focus group responses also noted teachers’ concerns about uneducated SGB members being involved in selection and appointment of staff; this can result, in some cases, in unfair labour practice, even in nepotistic bias. Devolving school governance to communities has given the communities a larger voice in the education of their children. It also provides opportunities for the communities to augment government’s resourcing and provisioning of schools. However, this seems to be a benefit enjoyed mostly by wealthy communities and therefore continues a trend of unequal access to quality education. This apparent paradox is because the wealthier communities who have predominantly educated members of the community on the SGBs can often influence decision-making processes with a view to maintaining the status quo inherited from the previous era. Because of a greater ability to raise their own funds than is the case in rural schools or schools serving less affluent communities, SGBs of well-endowed schools are also in a better position to afford SGB appointments of teachers and other support staff. This would therefore have the effect of increasing the disparity that policy and legislation are designed reduce and, ultimately, eliminate.
74 Research Report on Management and Governance - Challenges of rural and farm schools; 2002; Review of School governance in South African Public Schools: Report of the Ministerial Review Committee on School Governance, 2004.

Page 104
APPENDIX 4: Social dialogue and participatory decision-making in Education South African educators have one the most progressive systems of representation through varying forums and there are many avenues for constructive communication, discussion, and bargaining with employees. A dynamic and thriving collective bargaining facility is important for the maintenance of a body of teachers that will know that their best interests are always at hand and can negotiate for better conditions of employment, conditions of work, adequate and fair remuneration, and for their own professional development, so that ultimately more quality teachers are available for the attainment of constitutional and EFA imperatives.
A4.1. Collective Bargaining A mature and responsible bargaining system prevails in South Africa. Apart from the 1998 national dispute on post provisioning, to which five days of schooling were lost, there have been no national labour stoppages over the past five years. Instead, the bargaining process has culminated in the following key performance related agreements:
• Job descriptions for educators - Duties and Responsibilities. • A workloads agreement, specifying 7 hours per day at school, at least one hour per day in
preparation and marking, and “up to 80 hours per annum” on in-service professional development.
• The system of teacher developmental appraisal. The Labour Relations Act, 1995, has created a new labour relations regime. The Education Labour Relations Council (ELRC) has had to be re-organised to conform to the provisions of this Act. In 1997, the Public Service Co-ordinating Bargaining Council (PSCBC) was established in terms of Sections 35 and 36 of the Labour Relations Act, No. 66 of 1995, to strengthen the ELRC. According to its constitution, the PSCBC may perform all functions of a bargaining council in respect of those matters that:
a) are regulated by uniform rules, norms and standards that apply across the public service; or b) apply to terms and conditions that apply to two or more sectors; or c) are assigned to the State as employer in respect of the public service that are not assigned to the State as employer in any sector.
The ELRC is now well constituted to manage labour relations matters in education. It has its own premises and a full complement of staff. Capacity building of both employer and employee parties has been undertaken through the council. Chambers of the ELRC exist in each province. Given that most of the operational work is undertaken at provincial level, there is a proposal for each provincial chamber to appoint a permanent secretariat.
Page 105
A4.2.Teacher unions South African teachers are highly unionised, the majority of educators are organised through four teacher unions, namely:
• the National Professional Teachers’ Organisation of South Africa (NAPTOSA) • the South African Democratic Teachers’ Union (SADTU) • the National Teachers Union (NATU) • the Suid-Afrikaanse Onderwysers Unie (SAOU).
The role of the unions is to represent educators and their issues in bargaining forums with the employee (in this case the DoE). The Ministry of Education and teacher unions have jointly agreed to a labour-relations framework, which encompasses both traditional areas of negotiation and issues of professional concern, including pedagogy and quality-improvement strategies75.
75 DoE, 2001; EDUCATION IN SOUTH AFRICA. Achievements since 1994

Page 106
APPENDIX 5: Financing education - targeting schools on the basis of need
While it would be desirable for all recurrent funding of ordinary public schools, including personnel allocations, to be driven by a simple per-learner formula, there is a need to redress the poor social and institutional school-level conditions that are prevalent in all parts of the country and tend to perpetuate massive inequality. Redistributive allocation, however, comes to little if the capacity to distribute funds in an efficient manner does not exist. Provincial administrations have unequal fiscal competencies, and school governing bodies have widely varying capacities to ensure timely and well-targeted distribution. Different approaches are necessary to establish and maintain a semblance of equity between provinces, sectors and sub-sector within a province.
Three mechanisms have been put in place to attain this required equity:
• The Provincial Equitable Shares Formula .
• The National Norms and Standards for School Funding.
• The National Post Provisioning Norms. The National Norms and Standards for School Funding became national policy in 1999. These norms and standards are aimed at achieving equality and poverty redress in schools, in terms of non-personnel expenditure within a province.
Table A5.1. Resource targeting table based on condition of schools and poverty of communities
School quintiles, from poorest to
least poor
Expenditure allocation
Cumulative percentage of
schools
Cumulative percentage of non-personnel and non-capital
recurrent expenditure
Per learner expenditure indexed to
average of 100 Poorest 20% 35% of the
resources 20% 35% 175
Next 20% 25% of the resources
40% 60% 125
Next 20% 20% of the resources
60% 80% 100
Next 20% 15% of the resources
80% 95% 75
Least poor 20% 5% of the resources
100% 100% 25
Source: Norms and standards for school funding in terms of the South African Schools Act, 1996 The revised process of non-personnel funding allocation works in the following way. Each provincial education department is required to produce a Resource Targeting list of all ordinary public schools in its province, sorted according to the conditions at the school and the poverty of the community served by the school. Two equally weighted factors are to be used to rank the schools:

Page 107
• The physical condition, facilities and level of crowding of the school. Using the School Register of Needs data, PEDs create indices based on: the range of physical facilities at the school; learner: classroom ratios; the overall condition of plant and need for repairs; and availability of basic services. This factor is weighted 50%.
• The relative poverty of the community around the school. Using census, household surveys or other data, PEDs create indices based on, for example, the proportion of households with electricity and piped water in the community served by the school; the level of education of the parents served by the school; and other similar criteria. This factor is weighted 50%.
Five groupings of schools are identified on the basis of their poverty index - from poorest to least poor. The distribution by quintile will then determine the per learner allocation. Thus, allocations are made on a variable per-learner basis that favours the poorer segments of the population. The most needy and largest schools get priority in funding. Table A5.2. National table of targets for the school allocation (2006) QUINTILE 2006 2007 2008 Q1 – poorest 20% R 703 R 738 R 775 Q2 – next 20% R 645 R 677 R 711 Q3 – next 20% R 527 R 554 R 581 Q4 – next 20% R 352 R 369 R 388 Q5 – least poor 20% R 117 R 123 R 129 Adequacy benchmark R 527 R 554 R 581 Source: Medium Term Expenditure Framework (DoE, 2004) Table A5.2. shows the targets for school allocation for 2006 to 2008. Each amount refers to what the school should receive for each enrolled learner. For example, the target for quintile 1 (or Q1) is R703 for the year 2006. Quintile 1 is the group of schools in each province catering for the poorest 20 per cent of learners. Quintile 2 schools cater for the next poorest 20 per cent of schools, and so on. Quintile 5 schools are those schools that cater for the least poor 20 per cent of learners. The per-learner allocation is approximately proportional to the socio-economic context of the school, based on the weighted factors mentioned above. The ‘adequacy benchmark’ is the school allocation amount that Government believes is the norm required per learner to ensure minimum standards of effective education. In 2006, this amount will be R527. The main effect of the revised formula is that the poorest 40 per cent of schools will receive 60 per cent of the provincial schooling recurrent budget allocation, while the least poor 20 per cent will get no more than 5 per cent of the resources. The essence of this whole school allocation policy is to highlight the South African Government’s commitment to the provision of affordable access to schools for every learner, by applying differential levels of monetary compensation, so that even the poorest of the poor are able to attend school, in their case at virtually no cost. This augurs well for South Africa’s attempts at meeting the EFA target. The Rand amounts are meant as benchmarks only. This means that a PED may, within its total education budget allocation, spend more or less than the per-school target. However, if it

Page 108
distributes less than the per-school benchmark, that would be regarded as a problem, and the national department of education would investigate the problem with the PED. These Norms have contributed to the narrowing of inherited inequalities from the previous regime, with regard to educator: learner ratios and the availability of more educator posts in many historically disadvantaged areas. A 2003 departmental Review of the Financing, Resourcing and Costs of Education in Public Schools76 undertook to improve equity and quality through a range of adjustments to the financing and resourcing of poor schools. The report revealed that despite budget reforms to ensure equality in per-learner expenditure, poorer schools need assistance in procurement of goods and services, and asset management. The high cost of textbooks and an inefficiently managed ordering process, high school uniform and transport costs, as well as poor management of school nutrition programmes, contribute to their financial difficulties. Recommendations included bringing down these costs significantly as well as improving systems for the management of resources. This has echoed those studies that have argued that while resource inputs have improved, the main challenges lie in the management of resources77. Recommendations were also made on the costs of schooling. The subsequent report to the minister argued that
‘although the poorest fifth of all households pay low fees in absolute terms, of around R50 per year, this constitutes a high proportion of household income. The very poorest spend on average 2% of income on school fees, whilst the figure for middle income and high-income groups is around 1%’.
The report went on to note that 85 per cent of parents find the principle of paying school fees reasonable, although only 58 per cent actually pay these, However,
‘the statistics are not inconsistent with a situation… where there is widespread dissatisfaction with the system of school fees. Even if “only” 15% of parents find the system of school fees unreasonable, this is a high enough figure to cause much tension in the schooling system, especially if one considers the strain that school fees places on households, and the risk that children of non-paying parents will be marginalized.’78.
Nevertheless, the report does not see the fee-setting process as the central problem – parents seem to find these reasonable – but it does see the exemption process as critical. The problem here is the ‘lack of parent empowerment through information’79. The report questions the legality of ‘hidden fees’ that schools charge – including the cost of food, transport and uniforms. It proposes capping school fees and introducing more stringently monitored and better informed fee-setting processes, fairer and more effective exemptions processes, transport subsidies for
76 Department of Education 2003b 77 Van der Berg 2001; Van der Berg, Roux and Wood 2002) 78 Report to the Minister on the Review of the Financing, Resourcing and Costs of Education in Public Schools DoE, 2003; 79 ibid

Page 109
the poorest learners, and that these measures should be fully integrated into Government’s poverty alleviation programmes. The Medium Term Expenditure Framework (MTEF) In 1997, the Ministry of Finance introduced the Medium Term Expenditure Framework (MTEF), as part of its reform of the budget process. The main features of the MTEF are:
• Three-year forward estimates of expenditure. • A focus on outputs and outcomes of government spending. • A co-operative approach to expenditure analysis and planning. • More detailed budget information to promote understanding and debate. • Political ownership of budget priorities and spending plans.
An education sectoral MTEF review team, representing national and provincial finance and education departments, has undertaken significant analyses of provincial education spending patterns and policy priorities. This budgetary review process also includes an analysis of cost drivers, a computer model of education spending, and recommendations on the necessity to curb enrolment bloating and to control personnel costs through improved management practices. While the MTEF sectoral review process has brought many benefits, including a collegial spirit between education and finance officials, and important analytical findings, it has not yet shown itself capable of influencing provincial education allocations for the better in the most seriously deprived, administratively vulnerable and poorest provinces. It cannot yet be said that education budgets, taken as a whole, are vehicles for enhanced delivery of education services, or that educational priorities are reflected convincingly in education budgets.
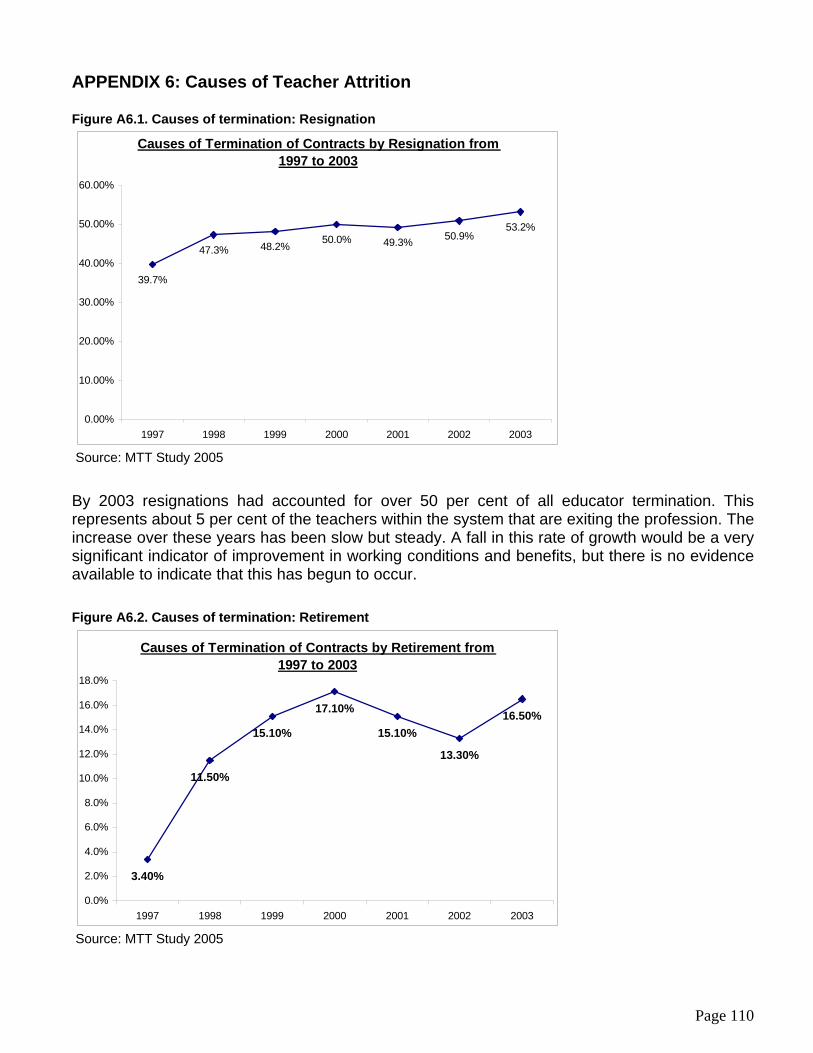
Page 110
APPENDIX 6: Causes of Teacher Attrition Figure A6.1. Causes of termination: Resignation
Causes of Termination of Contracts by Resignation from 1997 to 2003
39.7%
48.2%50.0% 49.3% 50.9%
53.2%
47.3%
0.00%
10.00%
20.00%
30.00%
40.00%
50.00%
60.00%
1997 1998 1999 2000 2001 2002 2003
Source: MTT Study 2005 By 2003 resignations had accounted for over 50 per cent of all educator termination. This represents about 5 per cent of the teachers within the system that are exiting the profession. The increase over these years has been slow but steady. A fall in this rate of growth would be a very significant indicator of improvement in working conditions and benefits, but there is no evidence available to indicate that this has begun to occur. Figure A6.2. Causes of termination: Retirement
Causes of Termination of Contracts by Retirement from 1997 to 2003
3.40%
11.50%
15.10%
17.10%
15.10%
13.30%
16.50%
0.0%
2.0%
4.0%
6.0%
8.0%
10.0%
12.0%
14.0%
16.0%
18.0%
1997 1998 1999 2000 2001 2002 2003
Source: MTT Study 2005

Page 111
Retirement rates rose sharply during the period 1997-2000, but have more or less leveled out since then. This may indicate an improved age profile in the teaching profession as a whole, although increases in the rates of termination for other reasons suggest, on the other hand, that fewer teachers are remaining in the profession right through their working careers until retirement age. The proportion of terminations due to medical reasons grew sharply from 3.8 per cent in 1997 to 9.7 per cent in 2000, and has remained close to this level since then (see Figure A6.3.). The impact of HIV/AIDS has been a major contributing factor. Figure A6.3. Causes of termination: Medical reasons
Causes of Termination of Contracts for Medical reasons from 1997 to 2003
3.80%
6.20%
9.20%9.70%
8.20%9.20%
8.50%
0.0%
2.0%
4.0%
6.0%
8.0%
10.0%
12.0%
1997 1998 1999 2000 2001 2002 2003
Source: MTT Study 2005
Figure A6.4. shows that the proportion of termination accounted for by death has followed a similar pattern as the trends of termination for medical reasons, rising from 4.7 per cent in 1997 to 17.6 per cent in 2003. In this case, too, the effects of the HIV/AIDS pandemic have been very substantial.

Page 112
Figure A6.4. Causes of termination: Death Causes of Termination of Contracts by Death from 1997 to 2003
4.70%
10.40%
14.60% 15.10% 14.70%
18.30%17.60%
0.0%
2.0%
4.0%
6.0%
8.0%
10.0%
12.0%
14.0%
16.0%
18.0%
20.0%
1997 1998 1999 2000 2001 2002 2003
Source: MTT Study 2005 While attrition through retirement is unavoidable, there is much that can be done to reduce the rates of termination resulting from other factors. Attrition through medical incapacity and early death needs, in the current context, to be addressed by means of vigorous programmes promoting public health awareness among teachers, with emphasis particularly on HIV/AIDS awareness. However, it is clear that the greatest damage is being done by termination through resignation. It is important, then, to try to understand the reasons why so many teachers are resigning from their posts, so that measures can be put in place to reduce this rate of loss, and the achievement of EFA targets and Constitutional priorities can be ensured.


