56
Waterwatch Teachers’ Manual Teachers’ Manual
Waterwatch Teachers’ Manual
© Waterwatch Education Trust – November 2017
1
We gratefully acknowledge the support of
We would also like to thank Waterwatch (Australia), HACH, Lincoln University and
Horizons.mw for the information presented in this booklet. The booklet has been
developed to provide additional information for teachers participating in the
WATERWATCH programme.
Teachers’ Manual

Waterwatch Teachers’ Manual
© Waterwatch Education Trust – November 2017
2
CONTENTS
Welcome to WATERWATCH 3
Fresh water issues in New Zealand 4
Learning experiences outside the classroom 5
Resources for teachers 5
Additional useful web sites 5
What can we measure in your waterway? 6
Chemical tests 7
Water quality rating guidelines for chemical tests for Canterbury 8
The pH scale 8
Conductivity (salinity or dissolved salts) 10
Nutrients (phosphates and nitrates) 11
Dissolved oxygen 13
Iron 15
Hardness 15
Physical tests 16
Water temperature 17
Habitat survey field guide 18
Stream flow 20
Turbidity (suspended solids) 22
Riparian environments 24
Aquatic biological tests 26
Aquatic macroinvertebrates 27
Calculating invertebrate diversity 30
Bacteria 31
Microbiological counting method 34
Interesting Facts about Water 36
Review questions from the Student Workbook (and answers) 39
Instruction sheets 41
To contact WATERWATCH:
E-mail: [email protected]
Waterwatch Teachers’ Manual
© Waterwatch Education Trust – November 2017
3
WELCOME TO WATERWATCH
Thank you for your interest in the WATERWATCH programme. WATERWATCH, which is managed by the Waterwatch Education Trust, is an outdoor, environmental education programme provided free of charge to schools and community groups in the Canterbury region. The programme, which has been operating for over 20 years, enables the participants to be actively involved in monitoring and learning about their local waterways, and encourages local initiatives to protect and care for these vital natural amenities.
Waterways are valuable resources which we need to protect from the adverse impacts of farming, industry and modern lifestyles. WATERWATCH helps to protect our water resources by promoting environmental awareness in communities. We have developed simple, interactive methods of teaching the range of techniques needed to comprehensively assess the quality of freshwater.
The WATERWATCH programme is an ideal way for schools to provide inquiry-based learning and to involve students in sustainability issues, both of which are both strongly supported by the New Zealand school curriculum. The New Zealand Curriculum also asserts that students should be confident, connected, actively involved and lifelong learners. WATERWATCH encourages students to be actively involved in collecting samples, become connected to local waterways and to consider the future of these waterways and how they can be better protected. It provides a range of opportunities for students to enhance their skills as well as their knowledge of local waterways. Such skills include sampling techniques, information gathering, processing and interpretation, and technical skills required when using scientific equipment.
The programme is conducted by an experienced team of educators who is committed to providing an excellent outdoor educational experience. WATERWATCH is suitable for a range of ages and abilities from Year 7 to Year 13, and focuses on practical, hands-on activities and student-initiated actions. The required equipment, which is financially beyond the budgets of most schools, is provided at no cost.
A WATERWATCH session with a typical class of around 30 students requires a minimum of 90 minutes; however, 120 minutes is advisable if all of the core tasks are to be completed, and the results recorded and fully discussed.
Many curriculum learning areas can be explored through the WATERWATCH programme and assessment opportunities, both in Unit and Achievement Standards, can be investigated in conjunction with the school. The programme is especially relevant to sustainability education, science, biology, chemistry, social sciences, geography and agriculture. With the expertise of our educators, and using the equipment provided, students are able to measure the physical, chemical and biological indicators of water quality, and consider the implications of their results. Formative and summative WATERWATCH activities and assistance are available on request. We will work with schools to deliver a version of the programme that is most relevant to their students. We also assist with ensuring the WATERWATCH programme is in line with relevant NCEA Achievement and Unit Standards and are happy to advise on useful links to the curriculum as well as assessment tasks. Enquiries from teachers are welcome.
Safety is paramount. We expect schools when preparing for a WATERWATCH excursion to take responsibility for risk management planning for the class or group in advance of the excursion. Our educators are trained in first aid and will not allow students to venture into the water unless their age and conditions are suitable.
We are also happy to visit schools to brief faculty meetings on the WATERWATCH programme, prepare classes for a WATERWATCH excursion, provide follow-up to an excursion, or support students undertaking science fair projects focusing on water.
Waterwatch Teachers’ Manual
© Waterwatch Education Trust – November 2017
4
Freshwater issues in New Zealand (adapted from http://doc.govt.nz/nature/habitats/freshwater/, https://en.wikipedia.org/wiki/Didymosphenia_geminata)
What is freshwater?
Freshwater refers to water from rivers, lakes, reservoirs, underground streams, and other sources. Water is continually evaporated from the oceans and then returned to the land as ice, snow, or rain. Ice and snow melt from mountains to release freshwater to our rivers, streams, lakes, and to resupply underground streams. New Zealand's freshwater habitats range from glaciers and seepages in the mountains, down to lowland rivers and streams that flow into estuaries. They include lakes, ponds, rivers, streams, some wetlands, cave systems, geothermal areas and underground aquifers.
Importance of freshwater habitats
Freshwater ecosystems contribute to biodiversity, the economy, recreational opportunities, cultural significance and ultimately our well-being. Freshwater is required by a wide variety of native plants and animals. Some of these are unique to New Zealand and often highly specialised to the habitats they are found in. Tangata whenua have strong links to water. Their awa (river) is an important part of their whakapapa (geneaology) and freshwaters sustain taniwha, protect waahi tapu (sacred areas) and provide valuable resources such as mahinga kai(harvesting).
Threats
Our freshwater ecosystems are impacted by changes in the water cycle, drainage, pollution and sedimentation, nutrient enrichment, deforestation and invasion by pests. These environmental impacts have had significant consequences for our freshwater biodiversity which is vulnerable to invasion, interbreeding, overharvest and habitat loss and degradation.
Current freshwater problems in New Zealand include:
Competition for water between irrigation (agricultural and horticultural use) and recreation (fishing, boating, etc.)
The intrusion of sewage and other contaminants into waterways, especially after rain. High bacteria levels and other pollutants compromise drinking water quality and in extreme cases can affect recreational uses (eg swimming);
High levels of nutrients, especially nitrates and phosphates, which promote the growth of plants and algae in lakes and stream and can lead to eutrophication of lakes;
A spread of a particular algae didymo* (or “rocksnot”) is of particular concern. It was discovered in New Zealand in 2004, the first time it had been found in the Southern Hemisphere. To restrict its spread, the whole of the South Island was declared a controlled area in 2005. Extensive publicity was carried out to limit its spread, but didymo has been found in an increasing number of rivers there.
The following methods have been recommended to prevent the spread of didymo in New Zealand:
Check: Before leaving the river, remove all obvious clumps of algae and look for hidden clumps. Leave them at the site. If you find clumps later don't wash them down the drain, treat them with the approved methods below, dry them and soak them in bleach for at least 4 hours.
Clean: Soak and scrub all items for at least one minute in either hot (60 °C) water, a 2% solution of household bleach, antiseptic hand cleaner, or dishwashing detergent.
Dry: If cleaning is not practical (e.g. livestock, pets), after the item is completely dry wait an additional 48 hours before contact or use in any other waterway.
WATERWATCH is committed to applying best practice in order to protect the environment. Therefore, to prevent the transfer of didymo and other aquatic pests between waterways, it is our standard practice to soak the nets in a detergent solution after use, and then leave them to dry.
* http://www.biosecurity.govt.nz/files/pests/didymo/south-island-didymo-brochure-112010.pdf
Waterwatch Teachers’ Manual
© Waterwatch Education Trust – November 2017
5
Learning Experiences Outside the Classroom (LEOTC)
WATERWATCH provides programmes that complement and enrich classroom learning, using the
principles of LEOTC. The activities are hands-on, interactive learning experiences for young people
that are provided independently of the school. WATERWATCH and the participating schools work in
partnership to ensure that our programmes meet the learning needs of the students, and support
effective teaching and learning outcomes.
Resources for teachers
Environment Canterbury (ECan) provides two very useful publications that can be downloaded as PDF documents from this web address:
http://ecan.govt.nz/advice/your-school/lesson-resources/Pages/water.aspx
a) Wai/Water - an informative book which comprehensively covers the issues associated with the
Canterbury Water Management Strategy. It is intended for use by communities, schools, and
anyone interested in water usage in Canterbury. It uses case studies based on real people and
includes views from across the region – from rūnanga, farmers, industry, environmental
organisations, and ordinary Cantabrians.
http://ecan.govt.nz/publications/Plans/cw-wai-water-2011-12.pdf
b) Waitaha Wai - Waterways of Christchurch: a useful resource book for teachers of primary and
secondary students in Christchurch.
http://ecan.govt.nz/publications/General/waitaha-wai-waterways-of-christchurch-000610.pdf
c) The Ministry for the Environment has published a very informative overview “Delivering
Freshwater Reform” on the importance of water to New Zealand and the issues our country faces
regarding water availability and quality. The link is:
http://www.mfe.govt.nz/sites/default/files/media/Fresh%20water/Delivering%20freshwater%20reform.pdf
A more comprehensive report has been published by the Commissioner for the Environment:
http://www.pce.parliament.nz/media/pdfs/PCE-Water-Quality-in-New-Zealand.pdf
An update to the above report, published in 2015:
http://www.pce.parliament.nz/media/1008/update-report-water-quality-in-new-zealand-web.pdf
Additional useful web sites:
Excellent information on freshwater invertebrates from Landcare Research:
http://www.landcareresearch.co.nz/resources/identification/animals/freshwater-invertebrates
The Encyclopedia of New Zealand has useful information on water in NZ and links to other sites:
http://www.teara.govt.nz/en/water-quality/page-1
WATERWATCH Australia: http://www.environment.nsw.gov.au/WATERWATCH/
World Water Monitoring Challenge: http://www.monitorwater.org/Guides_Lesson_Plans.aspx
UK Rivers Network: http://www.ukrivers.net/
Waterwatch Teachers’ Manual
© Waterwatch Education Trust – November 2017
6
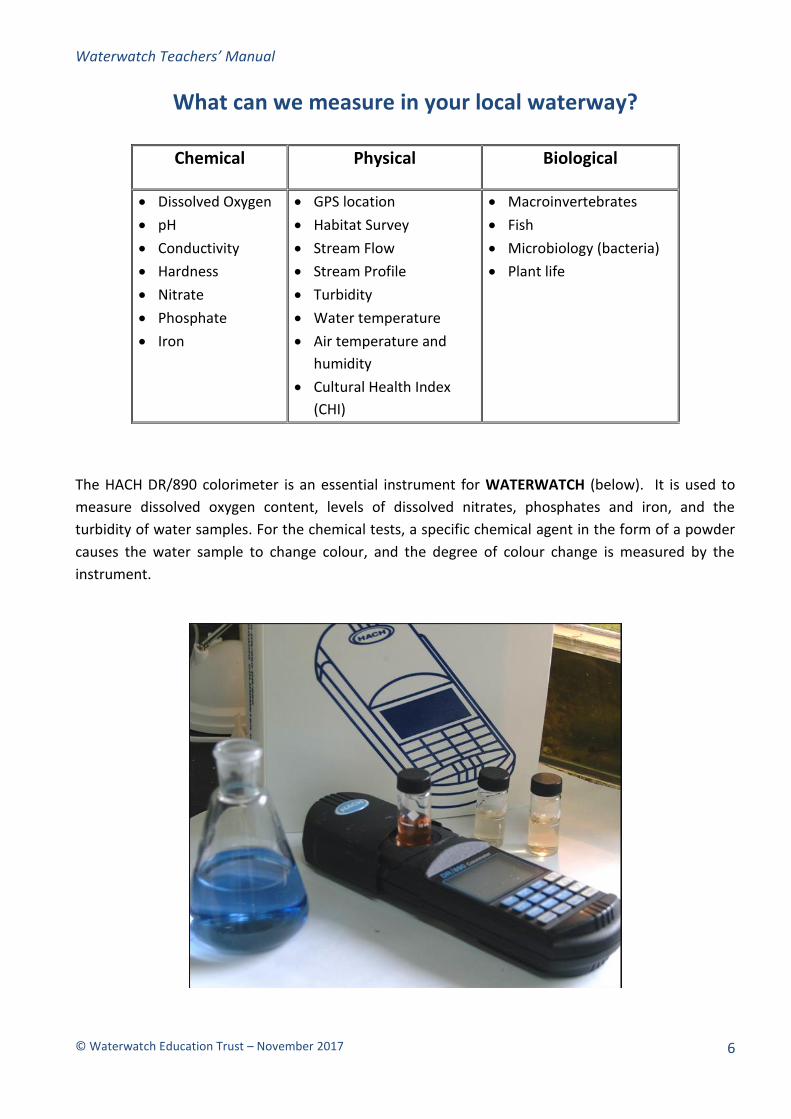
What can we measure in your local waterway?
Chemical Physical Biological
Dissolved Oxygen
pH
Conductivity
Hardness
Nitrate
Phosphate
Iron
GPS location
Habitat Survey
Stream Flow
Stream Profile
Turbidity
Water temperature
Air temperature and
humidity
Cultural Health Index
(CHI)
Macroinvertebrates
Fish
Microbiology (bacteria)
Plant life
The HACH DR/890 colorimeter is an essential instrument for WATERWATCH (below). It is used to
measure dissolved oxygen content, levels of dissolved nitrates, phosphates and iron, and the
turbidity of water samples. For the chemical tests, a specific chemical agent in the form of a powder
causes the water sample to change colour, and the degree of colour change is measured by the
instrument.

Waterwatch Teachers’ Manual
© Waterwatch Education Trust – November 2017
7
Chemical tests
Test What it measures How to measure
pH Acidity or alkalinity of the water,
which affects aquatic life.
Using a pH meter
Conductivity (µS/cm) and Total dissolved solids (mg/L)
Amount of dissolved solids
(mainly salts).
Salinity levels affect aquatic and
terrestrial plant life.
High conductivity can also
indicate the possibility of nitrate
or phosphate contamination
Using a conductivity meter
Multiply conductivity reading by 0.6 to obtain total dissolved solids value
Nitrates (free) (as NO3-N (mg/L))
Amount of nitrate dissolved in
water.
Indicates potential for organic
enrichment.
Toxic at high levels.
Can contribute to formation of
algal blooms.
Using a Hach Kit
(colorimeter and associated
chemistry – cadmium reduction
method).
Phosphates (free) (as PO4
3- (mg/L)) Amount of phosphate dissolved
in water.
Indicates nutrient status and
potential for organic enrichment.
Can contribute to formation of
algal blooms.
Using a Hach Kit
(colorimeter and associated
chemistry – ascorbic acid
method).
Iron * (as Fe3+)
Amount of iron dissolved in
water.
Indicates iron concentration.
Determines suitability of water
for certain uses, i.e. drinking.
Using a Hach Kit
(colorimeter and associated
chemistry).
Hardness * (Total as CaCO3 and some magnesium)
Amount of dissolved calcium
carbonate in water.
Determines the suitability of the
water for certain uses.
Indicates the buffering capacity
of the water.
Using a titration of EDTA into
prepared water sample with
indicator (colour change) to
determine reaction end point.
Dissolved Oxygen (various methods available)
Amount of available oxygen in
the water.
Oxygen is vital to survival of
aquatic organisms.
Using titration (modified
Winkler) method, or
Using a Hach Kit
(colorimeter meter and
associated chemistry), or
New luminescent technology
*Optional tests (not often used)

Waterwatch Teachers’ Manual
© Waterwatch Education Trust – November 2017
8
Water quality rating guidelines*
Test Excellent Satisfactory Poor
Conductivity(µS/cm) less than 100 100-500 more than 500
Turbidity (NTU) less than 2 2-5 more than 5
pH 7-8 6.5-7 or 8-9 less than 6.5 more than 9
Dissolved Phosphate, PO43-
(DRP) (mg/L) less than 0.01 0.01-0.03 more than 0.03
Dissolved Nitrate, NO3-N (mg/L)
less than 0.15 0.15-0.5 more than 0.5
Dissolved Oxygen (%) more than 90 80-90 less than 80
* Guidelines from WATERWATCH Australia
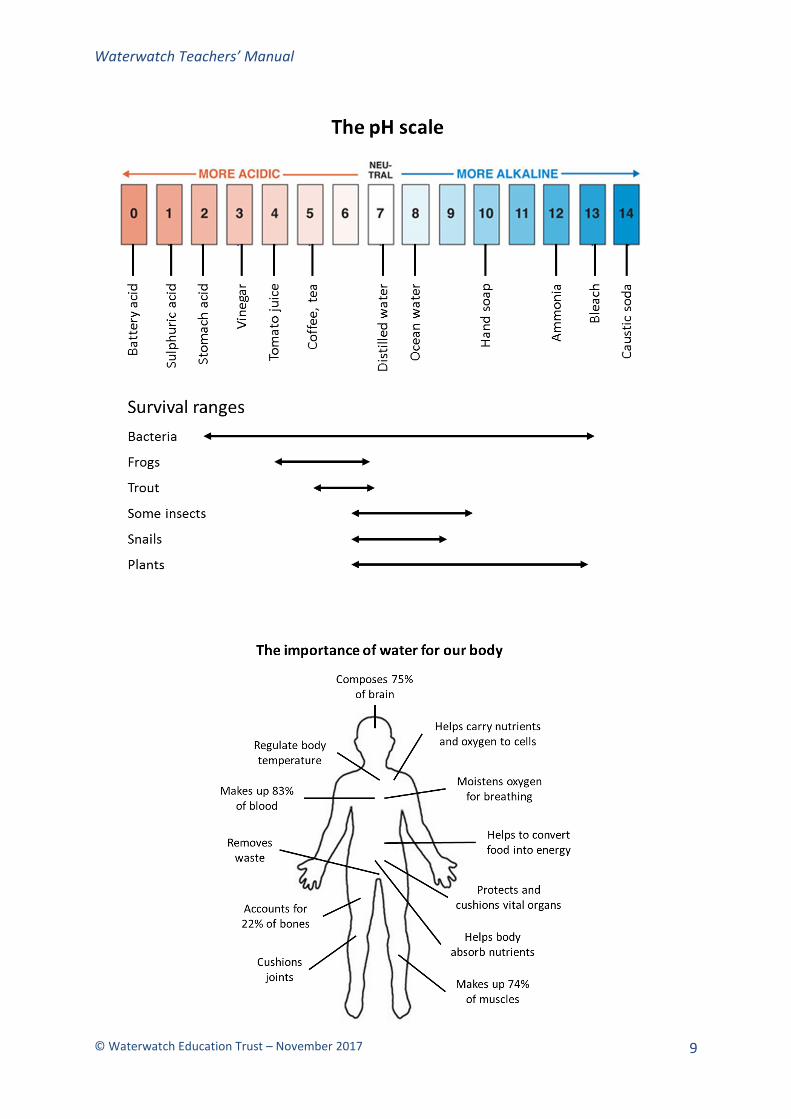
The pH scaleWhat is pH?
pH is a measure of how acidic or alkaline (basic) the water is, on a scale of 1 – 14. It is a measure of concentration of the hydrogen ion (H+). Water (H2O) contains both H+ and OH- ions. Pure, distilled water contains equal numbers of H+ and OH- ions and is considered neutral, ie, pH 7. (See the pH Scale on the next page). Because pH is a logarithmic scale, every unit change represents a ten-fold change in acidity or alkalinity. For example, a change of pH from 5 to 4 means a 10-fold increase in acidity (and in the number of H+ ions).
The pH of water in Canterbury streams, rivers and ponds is usually in the range 6.5 to 8.2 – the safe habitat range. However, wide variations can occur because of catchment geology. It can also be affected by a number of factors including industrial effluent and sewage.
Animals and plants in streams are adapted to certain ranges of pH. Even under natural conditions, the animal and plant communities of acid streams contain many different species to those in alkaline streams. An increase or decrease in pH outside the normal range of a water body will cause a consequential loss of the species depending on their sensitivity. Extremely high or low pH values will lead to the death of all aquatic life. Therefore, to
retain a healthy diversity of life, the pH must be kept within the range of natural variation for the water in question.
Measurements of pH tell us a lot about the natural condition of a water body as well as
indicating whether any pollution is present.
How does it behave in the aquatic environment?
The pH of natural waters is largely determined by the geology and soils of the catchment. Water running off limestone areas tends to have a relatively high pH level (ie, alkaline). On the other hand, streams and lakes in coastal dune areas may have very low pH values (sometimes less than 5) due to the presence of tannins from trees (these cause the brown colouration in the water, as shown on the next page).
Increasing salinity increases pH In a typical estuary, the pH rises with increasing salinity levels from values of 6.5 to 7.5 in the upstream fresh water reaches to between 8 and 8.5 in downstream, fully saline coastal areas (full sea water salinity is around 35 g/L or 35 000 mg/L of total dissolved solids).
Waterwatch Teachers’ Manual
© Waterwatch Education Trust – November 2017
9
Waterwatch Teachers’ Manual
© Waterwatch Education Trust – November 2017
10
Conductivity (salinity or dissolved minerals) What is it? Conductivity is simply a measure of the amount of salts dissolved in the water. Salts are substances such as common table salt (sodium chloride, NaCl), limestone (calcium carbonate, CaCO3) and many others. They are dissolved and carried by the water as it runs over and through the rocks and soils of the catchment. Low levels of these salts are vital to the growth of fresh water aquatic plants and animals but high levels can cause problems for aquatic life, and for human uses such as crop irrigation.
There are two ways to measure conductivity: (1) using total dissolved solids (TDS) or (2) electrical conductivity using a meter. If a conductivity meter is available, this is a more rapid and accurate way to measure the amount of dissolved salts in the water. The SI units used for measuring the conductivity are Siemens per metre (S/m). For water µS/cm are mostly used.
The conversion of conductivity to the total dissolved solids depends on the chemical composition of the sample and can vary between 0.54 and 0.96. Typically, the conversion is done assuming that the solid is sodium chloride, i.e., 1 μS/cm is then equivalent to about 0.64 mg of NaCl per kg of water.
Electrical conductivity This test is based on the fact that the conductivity of water (i.e. how easily it will conduct an electrical current) depends on the concentration of dissolved salts. The higher the level of salt, the more conductive the water. Conductivity is also affected by temperature so it is important to measure the water temperature too.
Conductivity is determined by the geology and soils of the catchment
The amount of salt dissolved in water can vary widely. An example of this variation is the difference in tap waters: soft (low salinity) in some areas and hard (higher salinity) in other areas.
Conductivity varies with flow Values are normally lowest during high flows and increase as flows decrease, with extreme values occurring during drought periods.
Fresh water aquatic plants and animals need the natural salts contained in water for growth
Some species are adapted to the low range of salts found in soft waters while others need the higher levels found in hard waters. However, if conductivity increases above the normal range for a particular body of water, the natural community will become stressed. As levels increase, species will start to disappear, depending on their degree of sensitivity.
Human induced changes to catchments can affect conductivity of runoff water
Small changes can occur due to general agricultural or urban development. Larger changes can occur where changes in vegetation or agricultural activity, particularly irrigation, affect groundwater levels and natural water balances.
For protection of
aquatic ecosystems For drinking water
Fresh waters: Electrical conductivity should not exceed
1500S/cm. Estuarine waters: Salinity will depend upon how far upstream tests are taken. Values at any given point will change depending upon tides and the amount of freshwater flowing into the system. Typical seawater:
30,000-50,000 S/cm.
Electrical conductivity should be less than
1500 S/cm.
Up to 750 S/cm is considered to be of good quality and safe for drinking. Between 800-2,500
S/cm the water is drinkable but it has a salty taste. Toxic for some plants, eg, grapes In the range 2,500 to
10,000 S/cm, water is unsuitable for people and animals to drink, and crops.
Compiled by K Nicolle, original sources uncertain
Waterwatch Teachers’ Manual
© Waterwatch Education Trust – November 2017
11
Nutrients
Phosphorus and nitrogen are nutrients that occur naturally in water. They are believed to be the most important nutrients in the eutrophication of water bodies. Eutrophication is the excessive richness of nutrients in a lake or other body of water, frequently due to run-off from the land, and this causes a dense growth of plant life. When the plant life eventually dies, bacteria multiply as they break down the decaying material. The oxygen in the water becomes depleted as a result, which may lead to the death of fish and other aquatic organisms.
Nutrients are also contained in stream sediments. If these are suspended they can maintain eutrophic conditions (ie, increased plant growth) for many years. Many factors influence how much nutrient in waterways is dissolved (soluble) or attached to particles (particulate).
Phosphorus
Phosphorus is a mineral nutrient which is essential for all forms of life. It plays a major role in energy transfer processes in the cells of living organisms. Phosphorus has the chemical symbol P.
Phosphorus occurs naturally at low concentrations in surface waters and is an essential part of the food chain. Under these conditions it is derived from processes such as weathering of rocks and the decomposition of leaf litter or other organic matter.
Phosphorus concentrations vary considerably under natural conditions, depending on factors such as local geology, soil types and seasonal conditions. Concentrations can be expected to be much higher when wet weather generates runoff and stream flows are high. It is important to consider stream flow rates and recent weather conditions when interpreting phosphorus results.
In streams, rivers, lakes and artesian water, phosphorus occurs in several different forms. These can be broadly categorised as dissolved forms and particulate forms. In the dissolved form phosphorus occurs as phosphates (phosphates are phosphorus atoms bound to oxygen e.g. PO4
3- to form a negatively-charged ion). These may be present as simple ‘reactive phosphate’ (orthophosphate) or as more complex forms of phosphate. Particulate forms include phosphorus bound to clay minerals suspended in the water (for example, from eroded soil) and biological forms such as algae.
The delicate balance of an ecosystem can be upset when phosphorus concentrations become too high, say 0.01-0.1 mg/L. Resulting problems can be algal blooms, excessive growth of aquatic plants and loss of species diversity. Algal blooms lead to increased pH and turbidity, and sometimes the production of toxins and odour.
High concentrations of phosphorus in lakes and waterways are often the result of human activities. Rural and urban runoff, sewage effluent and industrial discharges can all contain large amounts of phosphorus from fertilisers, eroded soil, detergents and plant and animal wastes. Under certain conditions, high phosphorus concentrations in water may come from bottom sediments, where they may have accumulated over many years.
Water tests can express the amount of phosphate present in several different ways, such as the amount of phosphate PO4
3- or total reactive phosphorus P.
To convert a PO43- result to a phosphorus
P result, divide by 3.3. (This is the ratio of the molecular weight of the PO4
3- ion and the atomic weight of P).

Waterwatch Teachers’ Manual
© Waterwatch Education Trust – November 2017
12
Nitrogen What is it?
Nitrogen is a mineral nutrient which is
essential for all forms of life. It is found in
proteins, DNA and many other parts of
living organisms. It has the chemical
symbol N.
Nitrogen occurs naturally at low
concentrations in surface waters and is an
essential part of the food chain. Under
these conditions, decomposition of plant
material and other organic matter is the
source of much of the nitrogen.
Additionally, some aquatic organisms can
introduce nitrogen to the ecosystem by
converting it from the atmosphere.
In natural waters nitrogen is found in
dissolved, particulate or gaseous forms.
Dissolved nitrogen
In the dissolved state nitrogen may be
present in inorganic forms of nitrate,
nitrite and ammonium ions; or in
combined organic forms such as amino
acids, proteins and humic acids.
The Nitrate ion is a combination of
nitrogen and oxygen (its chemical formula
is NO3-). Nitrates are soluble and are very
easily taken up by aquatic organisms.
The Nitrite ion is also a compound of
nitrogen and oxygen (the chemical
formula is NO2-). Generally, nitrites only
occur at very low concentrations in most
waters, but concentrations can increase
following discharges of some organic or
industrial wastes, particularly where
oxygen is in short supply. Nitrites are toxic
to humans and other animals and are
suspected cancer-causing substances.
The Ammonium ion is a product of the
decomposition of organic waste. (Its
chemical formula is NH4+). Generally it
converts to nitrate.
Particulates
Particulates (ie, fragments of
undecomposed organic material, algae
and soil particles) often have nitrogen
bound in them.
Gaseous nitrogen
Gaseous forms include nitrogen gas,
oxides of nitrogen and ammonia.
Ammonia NH3 is a compound of nitrogen
and hydrogen. It can be acutely or
chronically toxic to some species of fish
compared to the ammonium ion (NH4+).
Fresh water aquatic organisms can utilise
both dissolved and some particulate forms
of nitrogen. The delicate balance of an
ecosystem can be upset when nitrogen
concentrations become too high. Resulting
problems can include algal blooms,
excessive growth of aquatic plants and
loss of species diversity. An
overabundance of oxygen-dependent
bacteria will deplete the oxygen content
of the water.
High concentrations of nitrogen in
streams, rivers and lakes are often the
result of human activities. Sources of
nitrogen include fertilisers, eroded soil,
poor septic tank systems, and plant and
animal wastes. Rural and urban runoff,
sewage effluent and industrial discharges
can all contain large amounts of nitrogen
from these (and other) sources.
Recreational swimming and fishing can
also contribute nitrogen to streams
through body contact, discarding of food
wastes, cleaning of fish, etc.
Waterwatch Teachers’ Manual
© Waterwatch Education Trust – November 2017
13
Dissolved oxygen
What is it?
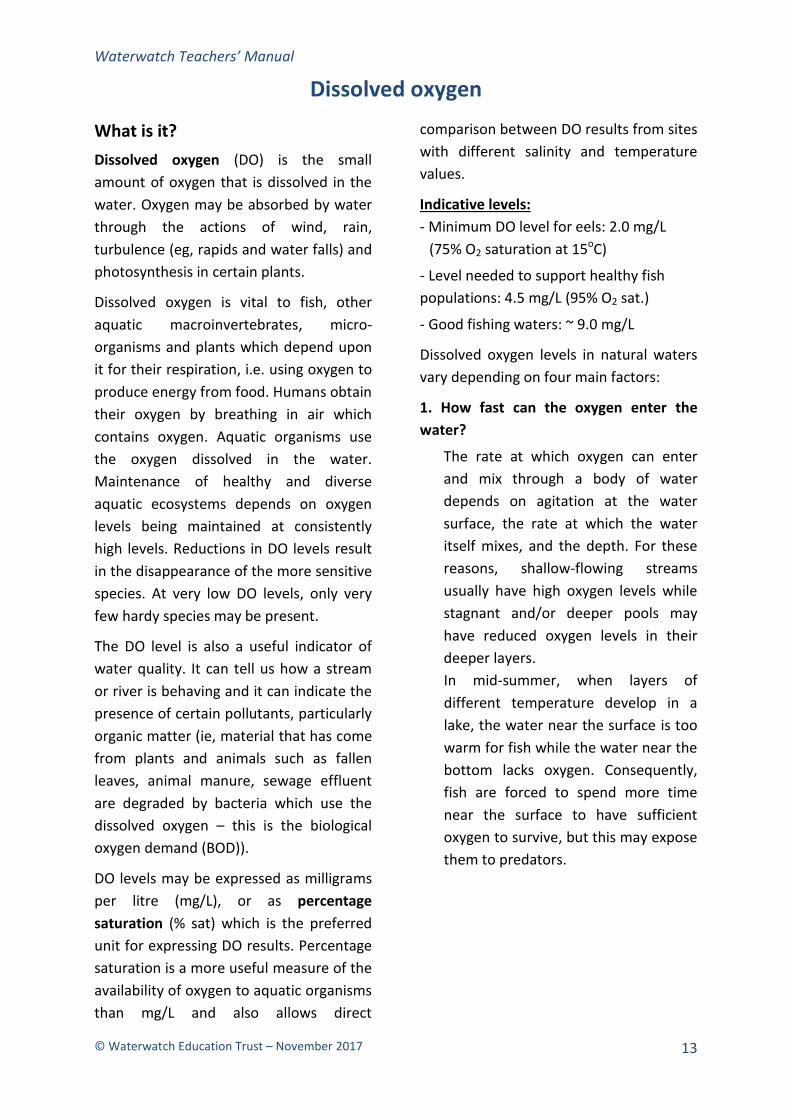
Dissolved oxygen (DO) is the small
amount of oxygen that is dissolved in the
water. Oxygen may be absorbed by water
through the actions of wind, rain,
turbulence (eg, rapids and water falls) and
photosynthesis in certain plants.
Dissolved oxygen is vital to fish, other
aquatic macroinvertebrates, micro-
organisms and plants which depend upon
it for their respiration, i.e. using oxygen to
produce energy from food. Humans obtain
their oxygen by breathing in air which
contains oxygen. Aquatic organisms use
the oxygen dissolved in the water.
Maintenance of healthy and diverse
aquatic ecosystems depends on oxygen
levels being maintained at consistently
high levels. Reductions in DO levels result
in the disappearance of the more sensitive
species. At very low DO levels, only very
few hardy species may be present.
The DO level is also a useful indicator of
water quality. It can tell us how a stream
or river is behaving and it can indicate the
presence of certain pollutants, particularly
organic matter (ie, material that has come
from plants and animals such as fallen
leaves, animal manure, sewage effluent
are degraded by bacteria which use the
dissolved oxygen – this is the biological
oxygen demand (BOD)).
DO levels may be expressed as milligrams
per litre (mg/L), or as percentage
saturation (% sat) which is the preferred
unit for expressing DO results. Percentage
saturation is a more useful measure of the
availability of oxygen to aquatic organisms
than mg/L and also allows direct
comparison between DO results from sites
with different salinity and temperature
values.
Indicative levels:
- Minimum DO level for eels: 2.0 mg/L
(75% O2 saturation at 15oC)
- Level needed to support healthy fish
populations: 4.5 mg/L (95% O2 sat.)
- Good fishing waters: ~ 9.0 mg/L
Dissolved oxygen levels in natural waters
vary depending on four main factors:
1. How fast can the oxygen enter the
water?
The rate at which oxygen can enter
and mix through a body of water
depends on agitation at the water
surface, the rate at which the water
itself mixes, and the depth. For these
reasons, shallow-flowing streams
usually have high oxygen levels while
stagnant and/or deeper pools may
have reduced oxygen levels in their
deeper layers.
In mid-summer, when layers of
different temperature develop in a
lake, the water near the surface is too
warm for fish while the water near the
bottom lacks oxygen. Consequently,
fish are forced to spend more time
near the surface to have sufficient
oxygen to survive, but this may expose
them to predators.

Waterwatch Teachers’ Manual
© Waterwatch Education Trust – November 2017
14
2. How fast is the oxygen used up?
Oxygen is used up through the
“breathing” (respiration) of animals,
plants and bacteria. The most
important of the users of oxygen are
the bacteria which break down organic
matter (fragments of dead plants and
animals). The more organic matter
there is in a stream, the greater the
bacterial population. This results in
increased oxygen use and hence lower
oxygen levels. For example, deep,
muddy, lowland rivers contain more
organic matter than upland streams
and are thus likely to have lower
oxygen levels.
In the heat of summer when DO levels
become depleted, the water becomes
warmer and fish may die.
Storms may wash large amounts of
organic matter into stream. As a
result, DO levels in a water body may
be lower than normal for days or even
weeks following heavy rain.
3. Photosynthesis by plants and algae
Large aquatic plants and algae release
large amounts of oxygen into the
water during daylight hours as a by-
product of photosynthesis. This
causes oxygen levels to vary regularly
over the 24-hour daily cycle. Peak DO
levels usually occur in the early
afternoon, and minimum levels just
before sunrise. Photosynthesis can
cause the water to become
temporarily supersaturated (i.e.
oxygen levels greater than 100%
saturation) during the day.
(Supersaturated water may also be
found at the base of waterfalls.)
The extent of DO variation depends
on the amount of algae and plants in
the water and the degree to which
shading reduces available light.
4. Flow variations
Streams with a reasonable rate of flow
can be expected to have high levels of
dissolved oxygen. Under very low flow
conditions, streams become warmer
and more stagnant and lower oxygen
levels are more likely to occur. During
flood events oxygen levels may be
high, but once flood flows recede the
bacterial breakdown of organic matter
carried in by the flood can lower
oxygen levels in the water for days or
perhaps weeks.
Pollution impacts
When organic matter enters water bodies
from point sources such as sewage
treatment plants, milking sheds and
animal feedlots, the bacterial activity
increases and thus oxygen levels are
reduced. The effect of these inputs is best
assessed by comparing DO at sites
upstream and downstream of a suspected
source.
Special considerations should be applied
in estuaries where tides may carry
pollutants upstream from discharge
points.

Waterwatch Teachers’ Manual
© Waterwatch Education Trust – November 2017
15
Iron Iron is essential to the survival of many
living organisms. In humans, iron is found in
the red blood cells and is vital because
without iron our blood cells could not carry
oxygen around our bodies. Too much iron
(within reason) may hurt you while too little
iron can make you anaemic, lethargic and
sleepy, and long-term can cause serious
health problems. High levels of iron
discolour drinking water taste and make it
taste.
Water that has high iron content causes
water pipes to rust and sometimes you may
produce rust stains on baths, basins and
laundry bowls. This happens because the
iron particles combine with the oxygen in
the water, to form rust. In extreme cases
the rust can clog water tanks, hot water
cylinders and even radiators in cars. Iron
rich-water also encourages the growth of
certain microorganisms, which can also
block pipes, valves and meters.
How does iron get into water?
Sometimes it is associated with the geology
of the area. The water may flow over rocks
that have a high iron content, such as
hematite and magnetite. Waterways flowing
in volcanic areas often have increased iron
levels. Other sources are less natural and
are the result of acid wastes from mines and
industry.
Effects on stock and wildlife
While animals, like human beings, need
iron, too much of it can cause problems.
Animals don’t like the taste of iron rich
water and therefore when forced to drink it
will drink less than their bodies actually
require. This reduced water intake will
affect productivity on a dairy farm as the
cows produce less milk.
Hardness Originally, water was said to be ‘hard’ when
it was difficult to form a lather (ie, foam)
from soap. Today, hardness is defined as the
amount of calcium and magnesium in water
because these are the two minerals
predominantly responsible for hard water.
Why is some water hard?
The natural presence of calcium and
magnesium in water is occurs in areas
where limestone occurs. These two minerals
are a key component in limestone, a soft
rock which is easily worn away by natural
processes. Rivers that run over and scour
limestone rocks, or are in catchments high
in limestone, will have harder water than
those in granite catchments.
Industries involved in preparing foodstuffs
can be affected by water hardness. For
example, in baking, very soft water
produces a sticky bread dough and soggy
bread. On the other hand, hard water used
for cooking, toughens many vegetables and
slows down the fermentation process
required in cheese, yoghurt and beer
manufacture. Hence, these industries
monitor the water they use very carefully.
Effects on living organisms
Soft water (low in calcium, magnesium)
makes heavy metals such as mercury,
copper and lead more poisonous to fish.
Non-metals such as ammonia and certain
acids also appear to be more toxic to fish
living in soft water than in hard water.
Very soft water: less than 70 mg/L
Soft: 70-140 mg/L
Medium Hard: 140-210 mg/L
Fairly Hard: 210-320 mg/L
Hard: 320-530 mg/L
Waterwatch Teachers’ Manual
© Waterwatch Education Trust – November 2017
16
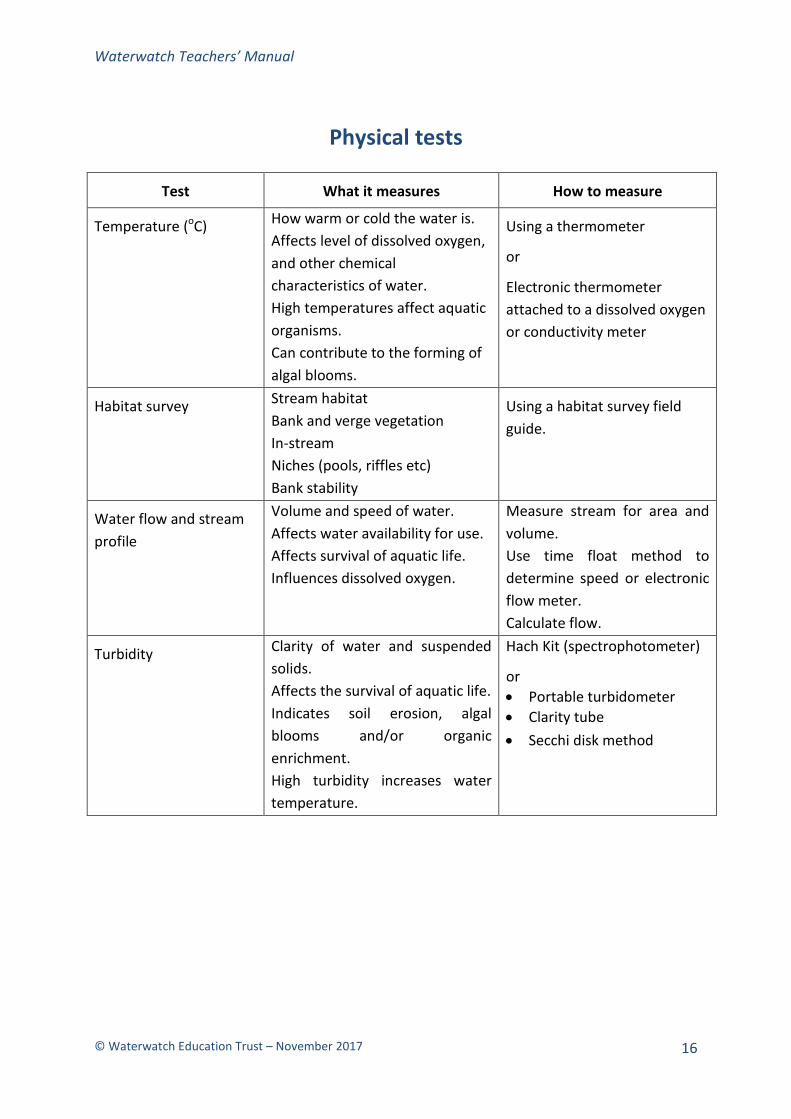
Physical tests
Test What it measures How to measure
Temperature (oC) How warm or cold the water is.
Affects level of dissolved oxygen,
and other chemical
characteristics of water.
High temperatures affect aquatic
organisms.
Can contribute to the forming of
algal blooms.
Using a thermometer
or
Electronic thermometer
attached to a dissolved oxygen
or conductivity meter
Habitat survey Stream habitat
Bank and verge vegetation
In-stream
Niches (pools, riffles etc)
Bank stability
Using a habitat survey field
guide.
Water flow and stream
profile
Volume and speed of water.
Affects water availability for use.
Affects survival of aquatic life.
Influences dissolved oxygen.
Measure stream for area and
volume.
Use time float method to
determine speed or electronic
flow meter.
Calculate flow.
Turbidity Clarity of water and suspended
solids.
Affects the survival of aquatic life.
Indicates soil erosion, algal
blooms and/or organic
enrichment.
High turbidity increases water
temperature.
Hach Kit (spectrophotometer)
or
Portable turbidometer
Clarity tube
Secchi disk method
Waterwatch Teachers’ Manual
© Waterwatch Education Trust – November 2017
17
Water temperature
What is it?
We all know what temperature is, but its significance with regard to water quality is rather complicated. This is because the temperature influences many of the physical and biological characteristics of waterways. Temperature is measured in degrees Celsius (°C).
Water temperature is highly dependent on the depth of the water, season, time of day, cloudiness of the sky, shade from trees and the air temperature. Many of the physical, biological, and chemical characteristics of a river are directly affected by the water temperature.
The temperature of the water influences the amount of oxygen that can be dissolved in the water.
Warmer water cannot hold as much oxygen as cooler water (observe the bubbles of air escaping from a jug of water as it is heated). If the water temperature of streams is affected by warm runoff from urban surfaces such as streets, footpaths and car parks, or from industry cooling processes and industrial wastes, the life in streams and rivers can be adversely affected.
Riparian vegetation keeps waters cool. The clearing of riparian vegetation which shades a stream or river can enable direct sunlight to warm the waterway, thus affecting the capacity of the water to hold oxygen.
Soil erosion, farming practices, road building and general construction may all contribute to the amount of material carried by the river. This increases turbidity which can result in an increased water temperature.
Temperature influences the rate of photosynthesis by algae and large water plants.
Warmer water temperatures enable these plants to grow vigorously. Warm waters tend to be more susceptible to blooms, because bacteria can thrive and therefore suffer from eutrophication.
Temperature influences the sensitivity of organisms to toxic wastes, parasites and diseases.
Warmer water temperatures stress these organisms and they become less resilient to other stresses. The discharge of cold water from reservoirs may lower natural temperature levels. Most aquatic organisms have a fairly narrow temperature range in which they are able to effectively function, so lowering the temperature may also affect the organisms.
Optimal temperature range for trout: 13 – 15oC;
The critical temperature which if exceeded will harm or kill most fish is 23oC (but a few hardy fish living in the tropics can tolerate water temperatures of up to 36oC!)
The temperature of water varies depending on the water body.
For example, ground water can vary greatly depending upon the depth of the bore. Sub-artesian bores can give water which is lower in temperature than the air temperature while some artesian bores supply water above boiling point.
Waterwatch Teachers’ Manual
© Waterwatch Education Trust – November 2017
18
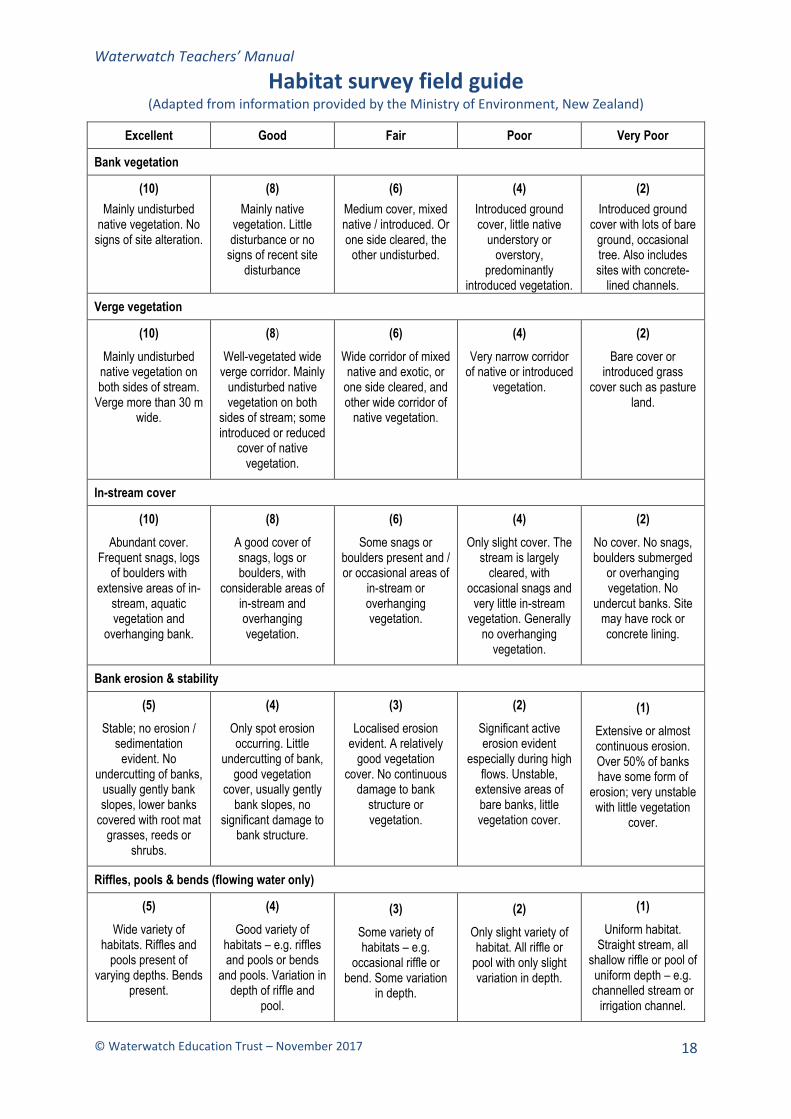
Habitat survey field guide (Adapted from information provided by the Ministry of Environment, New Zealand)
Excellent Good Fair Poor Very Poor
Bank vegetation
(10)
Mainly undisturbed native vegetation. No
signs of site alteration.
(8)
Mainly native vegetation. Little disturbance or no
signs of recent site disturbance
(6)
Medium cover, mixed native / introduced. Or one side cleared, the
other undisturbed.
(4)
Introduced ground cover, little native
understory or overstory,
predominantly introduced vegetation.
(2)
Introduced ground cover with lots of bare
ground, occasional tree. Also includes sites with concrete-
lined channels.
Verge vegetation
(10)
Mainly undisturbed native vegetation on both sides of stream.
Verge more than 30 m wide.
(8)
Well-vegetated wide verge corridor. Mainly
undisturbed native vegetation on both
sides of stream; some introduced or reduced
cover of native vegetation.
(6)
Wide corridor of mixed native and exotic, or
one side cleared, and other wide corridor of
native vegetation.
(4)
Very narrow corridor of native or introduced
vegetation.
(2)
Bare cover or introduced grass
cover such as pasture land.
In-stream cover
(10)
Abundant cover. Frequent snags, logs
of boulders with extensive areas of in-
stream, aquatic vegetation and
overhanging bank.
(8)
A good cover of snags, logs or boulders, with
considerable areas of in-stream and overhanging vegetation.
(6)
Some snags or boulders present and / or occasional areas of
in-stream or overhanging vegetation.
(4)
Only slight cover. The stream is largely
cleared, with occasional snags and
very little in-stream vegetation. Generally
no overhanging vegetation.
(2)
No cover. No snags, boulders submerged
or overhanging vegetation. No
undercut banks. Site may have rock or concrete lining.
Bank erosion & stability
(5)
Stable; no erosion / sedimentation
evident. No undercutting of banks,
usually gently bank slopes, lower banks
covered with root mat grasses, reeds or
shrubs.
(4)
Only spot erosion occurring. Little
undercutting of bank, good vegetation
cover, usually gently bank slopes, no
significant damage to bank structure.
(3)
Localised erosion evident. A relatively
good vegetation cover. No continuous
damage to bank structure or vegetation.
(2)
Significant active erosion evident
especially during high flows. Unstable,
extensive areas of bare banks, little vegetation cover.
(1)
Extensive or almost continuous erosion. Over 50% of banks have some form of
erosion; very unstable with little vegetation
cover.
Riffles, pools & bends (flowing water only)
(5)
Wide variety of habitats. Riffles and
pools present of varying depths. Bends
present.
(4)
Good variety of habitats – e.g. riffles and pools or bends
and pools. Variation in depth of riffle and
pool.
(3)
Some variety of habitats – e.g.
occasional riffle or bend. Some variation
in depth.
(2)
Only slight variety of habitat. All riffle or
pool with only slight variation in depth.
(1)
Uniform habitat. Straight stream, all
shallow riffle or pool of uniform depth – e.g. channelled stream or
irrigation channel.

Waterwatch Teachers’ Manual
© Waterwatch Education Trust – November 2017
19
Recording your results
Circle your stream’s rating on the Stream Habitat Record Sheet as you assess each factor (bank vegetation, verge vegetation, etc) of your stream’s habitat and add up the score from each factor to obtain a total score.
Interpreting your results
Add together all the ratings from the habitat record sheet. Assess your total stream’s habitat rating score using the following table.
Scores
Excellent 36 – 40
Good 29 – 35
Fair 20 – 28
Poor 12 – 19
Very Poor 8 - 11
Stream habitat assessment
Excellent 36 – 40
Site in natural or virtually natural condition; excellent habitat condition.
Good 29 – 35
Some alteration from natural state; good habitat conditions.
Fair 20 – 28
Significant alterations from the natural state but still offering moderate habitat; stable.
Poor 12 – 19
Significant alterations from the natural state, with reduced habitat value; may have erosion or sedimentation problems.
Very Poor 8 – 11
Very degraded, often with severe erosion or sedimentation problems.
Waterwatch Teachers’ Manual
© Waterwatch Education Trust – November 2017
20
Stream flow
Velocity and flow
The speed at which a river flows is its velocity (in metres per second).
The amount of water it carries is the volume of water passing by a certain time (in litres per second or cubic metres per second (cumecs)).
The three main variables that affect the velocity are:
1. How much the river gradient drops per metre;
2. How curved the river is; and
3. Profile of the river (the shape of the river bottom, which determines the cross-sectional area – measured in square metres m2).
River flow is calculated by the formula:
Flow = 1000 x velocity x area (litres/s)
Because of gravity, the steeper the drop the faster the water moves (eg, a waterfall). But, it is less obvious how the profile and curves of the river affect its flow. All things being equal, a river with a smooth bottom will carry away sediments and water faster than one with a rocky bottom. A river that is straight or barely has curves will also carry the water downstream faster than one that has many curves. Curves slow a river down just like curves in the road do when you are driving. Water on the outside of a curve, moves faster than water on the inside and therefore erodes the outside bank and channel more rapidly. For this reason rivers are always faster and deeper on the outside bend.
For flood control purposes, a straight river with a smooth bottom is best because it carries the water downstream most
rapidly. However, such a river does not provide a variety of habitats (riffles, runs, and pools) that are necessary for aquatic plants and animals to thrive. Fish and invertebrate habitats require a rough bottom with rocks, holes and submerged logs. Most natural rivers are a mixture of straight runs and curves and have stony and rocky bottom sections as well as sandy bottoms in places, particularly in the lower reaches.
The velocity is also affected by the season and can even change from day to day. In spring for example, rivers often run faster and carry more water due to snow melt or increased rainfall. In summer water levels are often lower and therefore the velocity is also decreased. After heavy rain, the velocity and volume can increase within hours, regardless of the season. The water velocity also varies from point to point along a river. Usually it gains speed where it narrows and loses speed where it widens.
As velocity and volume are not constant along a stream, the habitats that exist along the length of a waterway also change between seasons and years. Unmodified rivers, although constantly changing, usually provide a variety of habitats that can support a diverse community of aquatic plants, fish and invertebrates. When rivers are modified too drastically (eg, straightened, their flow altered, or a riparian strip removed,) habitats are lost and the plant and animal communities disturbed. This can lead to a loss of diversity throughout the whole ecosystem. For example, reduced invertebrate numbers and species will impact on the fish that feed on them and this alters the balance of the food chain.

Waterwatch Teachers’ Manual
© Waterwatch Education Trust – November 2017
21
Nutrient loading calculation
If the flow of a river is known, the quantity
of chemical such as nitrates or phosphates
passing through a stream cross-section at a
particular point can be calculated using the
following formula:
Amount of chemical passing (mg/s)
= concentration of chemical (mg/L)
x river flow (L/s)
For example:
Nitrate concentration = 1.4 mg/L
River flow = 700 L/s (ie, 0.7 cumecs)
→ Amount of nitrate passing
= 1.4 x 700
= 980 mg/s
This is the nutrient load.
By multiplying the nutrient load in mg/s by
86,400 the nutrient load in mg/day is
obtained.
Furthermore, dividing by 1,000,000 (ie,
converting mg to kg) gives the nutrient
load in kg/day.
In the above example, the nutrient load
calculation is
980 x 86400 / 1000000
= 84.7 kg/day
If we multiply this result by 365, and divide
it by 1000, we obtain the mass of nutrient
(in tonnes) transported by the river in one
year:
84.7 x 365 / 1000 ≈ 30.9 tonne
Waterwatch Teachers’ Manual
© Waterwatch Education Trust – November 2017
22
Turbidity (suspended solids)
What is turbidity?
As erosion occurs within a water catchment tiny particles of clay, silt or small organic particles are washed into lakes, streams and rivers. Industrial wastes and sewage also can be held by the water and are termed suspended solids. The faster the water is moving the more suspended solids it can carry.
The suspended solids can be measured in milligrams per litre (mg/L) by filtering the water and weighing the dried residue.
Turbidity is the result of suspended solids and is a relative measure of the clarity of water: the greater the turbidity, the murkier the water. Increased turbidity reduces the transmission of light. Consequently, this is one of the most important water quality parameters
During dry weather, undisturbed streams usually have low levels of suspended particles and the water looks clear. Following rainfall, particles washed in from the catchment make streams more turbid. The degree of turbidity depends on the nature of the catchment. Where there is good vegetation cover, there may only be small increases in turbidity. In catchments developed for agriculture of in urban catchments, increases in turbidity may be much larger. Measuring the increase in turbidity in a stream following rainfall is a simple way of assessing the condition of the catchment.
Soil type in the catchment also affects turbidity. For example, streams in catchments with clay soils are likely to have much higher levels of turbidity than streams in sandy catchments.
In slow-flowing lowland rivers, high levels of turbidity may persist for long periods. This is due to the low rate of flushing and the fact that very fine particles are held in suspension almost indefinitely.
In situations where there is a limited flow (waterholes, lakes, ponds, etc.) large
populations of plankton may grow and this may give the water a turbid appearance, often with a greenish colouration.
Increased turbidity silts up stream habitats and affects aquatic life
The fine particles settle in downstream areas and make the bottom habitat unsuitable for many organisms. In addition, silt clogs up the gills of fish so they can’t get enough oxygen. Filter feeders may be getting silt rather than food.
Increased turbidity reduces light penetration through the water
This reduces the amount of light for plant growth and thus limits growth of beneficial aquatic plants. Increased light absorption also increases the water temperature, affecting water life.
Increased turbidity affects pollutants
Many types of pollutants (nitrogen and phosphorus, pesticides, metals) attach to particles so that increases in particles washed into a water body will usually result in an increase in the input of other types of pollutants.
Certain practices can reduce turbidity, for example: the retention of vegetation along streams, farming practices such as contouring and stubble retention, and the effective treatment of effluent from sewerage works.
Suggestions about testing procedures
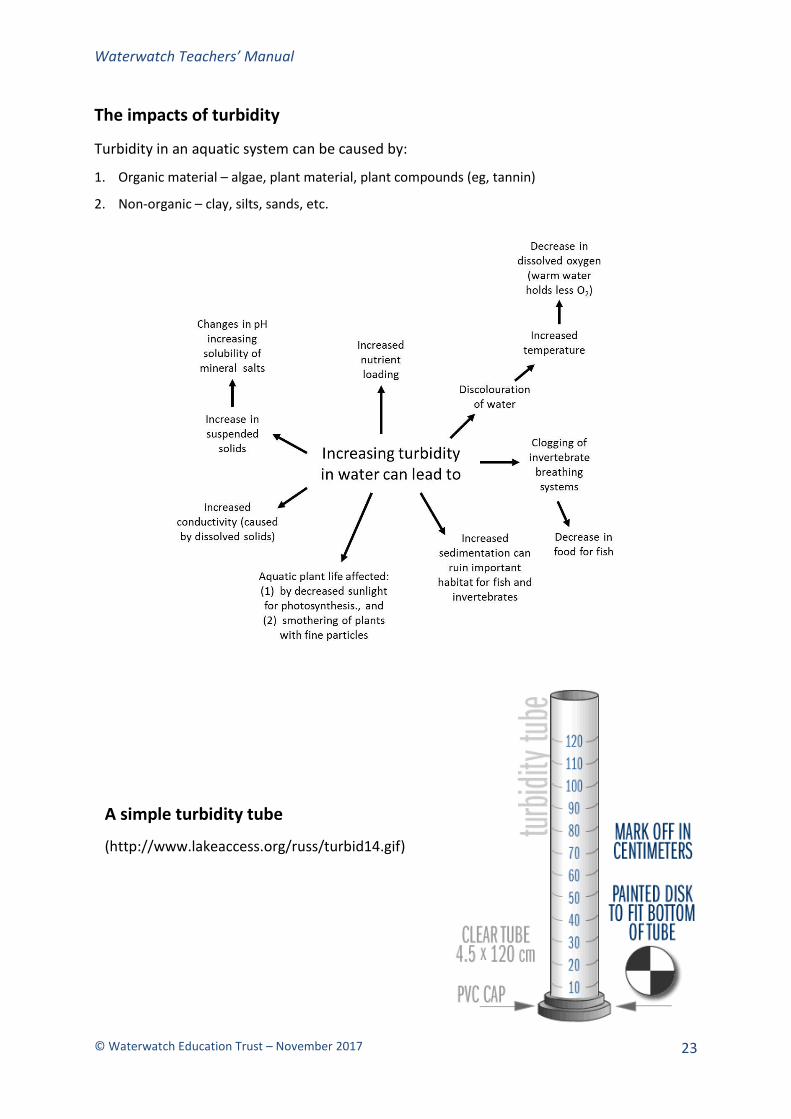
A simple method of testing for turbidity is by using a turbidity tube. For this test you simply collect water and pour into the tube until you cannot see the markings on the bottom. Record the reading from the side of the tube. If possible, stand the tube on a white tile. These tubes are handy because they are cheap and simple to use (see next page). A Secchi disc can also be used. For greater accuracy a nephelometer is used. This instrument determines the scattering of light and is measured in standard Nephelometric Turbidity Units (NTU).
Waterwatch Teachers’ Manual
© Waterwatch Education Trust – November 2017
23
The impacts of turbidity
Turbidity in an aquatic system can be caused by:
1. Organic material – algae, plant material, plant compounds (eg, tannin)
2. Non-organic – clay, silts, sands, etc.
A simple turbidity tube
(http://www.lakeaccess.org/russ/turbid14.gif)

Waterwatch Teachers’ Manual
© Waterwatch Education Trust – November 2017
24
Riparian environments
Bank and verge vegetation
What is the riparian environment?
Plants that grow on the sides of
waterways are extremely important for
the health of those waterways. These
plants grow in two places:
On the banks of the waterway.
On the verge – the strip of land
extending up to perhaps 20 – 30 metres
from the bank of the waterway.
Together the banks and the verge make
up the riparian environment.
The riparian environment as part of the
catchment
Riparian environments function within the
catchment environment, contributing to
the ecology of the area in three significant
ways.
1. Contribute to the ecology of both the
aquatic environment and the
surrounding catchment environment.
2. Contribute to soil stability.
3. Contribute to water quality as a buffer
for catchment runoff.
Contribution to the aquatic environment
Food: Riparian vegetation provides a
range of food for animals living in the
water. This food mainly comes in the form
of falling leaves, bark, branches and logs.
Branches and logs also hold decomposing
vegetation long enough for it to be used
by animals in the stream. Insects attracted
to the riparian zone become part of the
food supply by either falling in the water
or laying eggs.
Protection: Within a stream, river, pond
or lake, many animals depend upon the
logs and branches that fall for shelter.
These larger forms of debris also affect
the flow of the water and thus provide
better living conditions for some of the
animals. Shade from the overhanging
trees lowers water temperatures,
improving conditions for plants and
animals. By reducing the light entering the
water body there is less chance for
imbalance to occur with respect to the
amount of plant growth in the water.
Contribution to the surrounding
catchment environment
Riparian zones represent unique lowland
communities themselves and should be
recognised as such. The introduction of
noxious weeds and vermin can have
devastating effects on these areas and
change their capacity to maintain water
quality. The introduction of stock to these
areas also has a deleterious effect.
The riparian environment has the capacity
of form a corridor which links bush land
remnants into sustainable regional
networks. This is important as our
population grows and more demands are
put on catchment environments.
During time of drought or fire the riparian
zone can provide a refuge for animals.
Contribution to soil stability
Riparian vegetation exerts the major
control over bank stability in the short
term. One study found that bank
sediment, which was made up of 16 – 18%
roots, with a 50 mm deep root mat on the
bank surface, had 20,000 times more
resistance to erosion than comparable

Waterwatch Teachers’ Manual
© Waterwatch Education Trust – November 2017
25
bank sediment without bank vegetation.
These types of studies show us that there
are great benefits in having bank
vegetation in place. By preventing erosion
water quality will improve and thus
benefit the aquatic environment and
landowners.
Some land use practices such as clearing,
stock and human intrusion have lead to
the degradation of riparian areas and the
increase of bank erosion.
Contribution to water quality
Within any catchment there are a number
of potential pollutants that will flow into
water sources during rain events. These
pollutants can either have natural or
human origins. Pollutants can be sediment
loads, nutrient loads (nitrates and
phosphates), pesticides, bacteria, and a
range of substances from urban areas
including oils and detergents.
The riparian zone acts as a buffer to
reduce the amount of these pollutants
entering the water body, thus minimising
the problems of water pollution. The
buffering effect of riparian zones varies
according to vegetation type, slope, and
concentration of runoff contaminants.
Riparian buffer strips have a finite capacity
to deal with these issues, but within their
limits they are a very effective and
efficient way of dealing with maintaining
water quality.
Riparian zones have also been proven to
be able to improve the water quality of
groundwater entering a waterway.
Waterwatch Teachers’ Manual
© Waterwatch Education Trust – November 2017
26
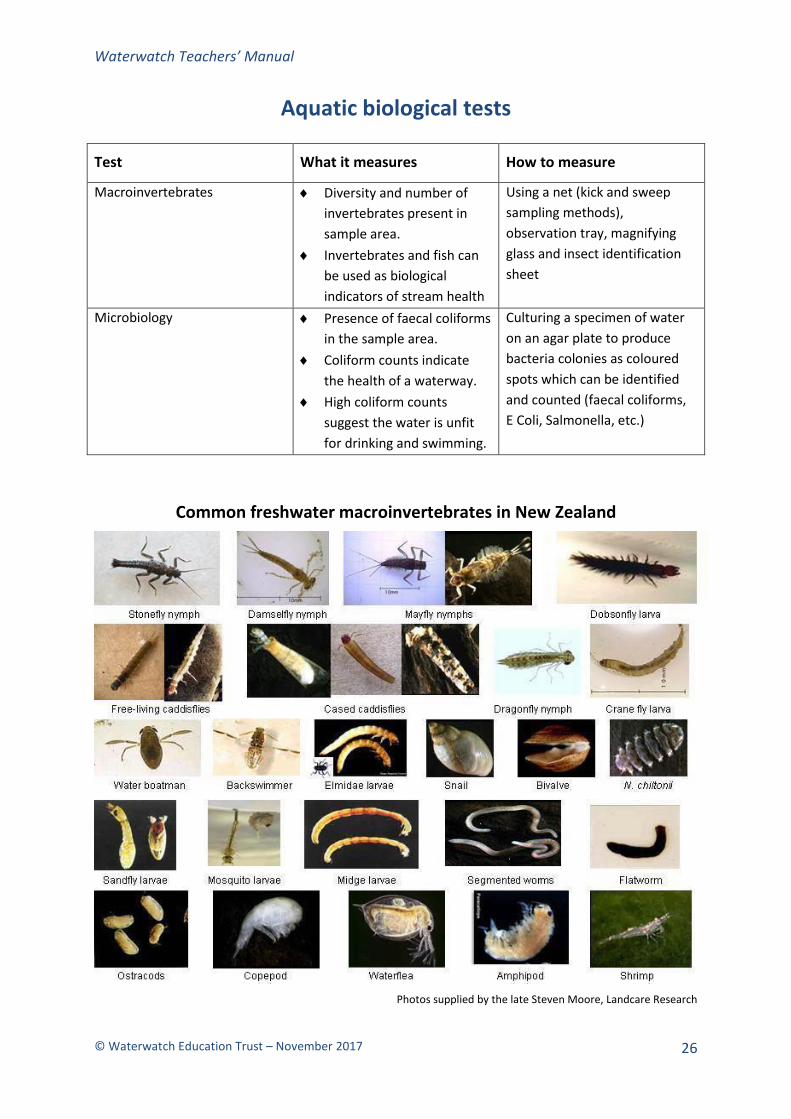
Aquatic biological tests
Test What it measures How to measure
Macroinvertebrates Diversity and number of
invertebrates present in
sample area.
Invertebrates and fish can
be used as biological
indicators of stream health
Using a net (kick and sweep
sampling methods),
observation tray, magnifying
glass and insect identification
sheet
Microbiology Presence of faecal coliforms
in the sample area.
Coliform counts indicate
the health of a waterway.
High coliform counts
suggest the water is unfit
for drinking and swimming.
Culturing a specimen of water
on an agar plate to produce
bacteria colonies as coloured
spots which can be identified
and counted (faecal coliforms,
E Coli, Salmonella, etc.)
Common freshwater macroinvertebrates in New Zealand
Photos supplied by the late Steven Moore, Landcare Research
Waterwatch Teachers’ Manual
© Waterwatch Education Trust – November 2017
27
Aquatic macroinvertebrates Invertebrates are animals without backbones; they include insects, worms, snails, shell-fish, shrimps, etc.
‘Macro’ means we can see them with the naked eye; macroinvertebrates are visible while microinvertebrates are invisible. ’Aquatic’ means they live in water.
Macroinvertebrates form an important part of the aquatic food chain. Sunlight is converted to energy by aquatic plants and algae. The plants are eaten by invertebrates, which in turn are eaten by larger invertebrates, which are in turn eaten by frogs, fish and birds (vertebrates). Some macro-invertebrates also help to decompose organic material.
Macroinvertebrates are useful indicators of stream health because they:
occupy a central position in the food chains of aquatic systems;
many live in the water for over a year;
cannot easily escape pollution (as some fish can);
are sensitive to even quite mild pollutants and changes in water quality;
are relatively easy to sample.
If an examination of the invertebrates in a waterway indicates pollution, chemical tests can be conducted to establish the cause. These two techniques complement each other as the presence (or lack) if invertebrates provide general indications of water quality while chemical tests are very specific. If only chemical testing is conducted and the pollutant is not one of the tests being measured, then it may go undetected.
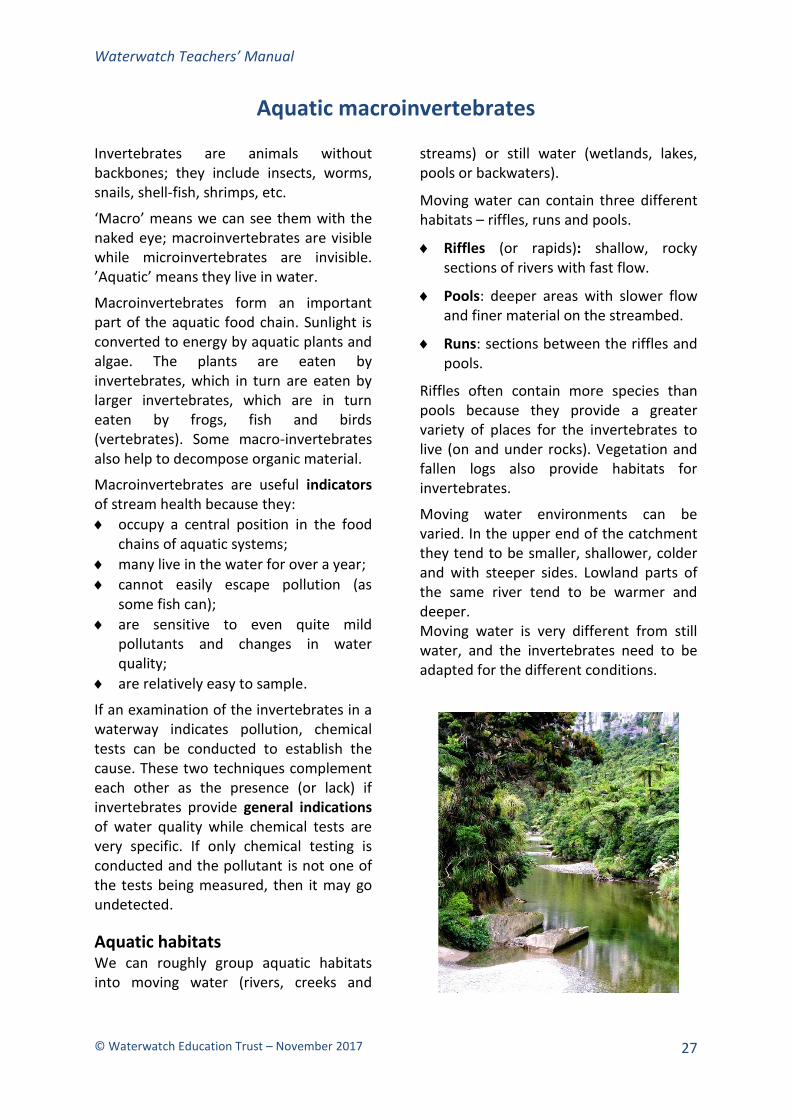
Aquatic habitats We can roughly group aquatic habitats into moving water (rivers, creeks and
streams) or still water (wetlands, lakes, pools or backwaters).
Moving water can contain three different habitats – riffles, runs and pools.
Riffles (or rapids): shallow, rocky sections of rivers with fast flow.
Pools: deeper areas with slower flow and finer material on the streambed.
Runs: sections between the riffles and pools.
Riffles often contain more species than pools because they provide a greater variety of places for the invertebrates to live (on and under rocks). Vegetation and fallen logs also provide habitats for invertebrates.
Moving water environments can be varied. In the upper end of the catchment they tend to be smaller, shallower, colder and with steeper sides. Lowland parts of the same river tend to be warmer and deeper. Moving water is very different from still water, and the invertebrates need to be adapted for the different conditions.
Waterwatch Teachers’ Manual
© Waterwatch Education Trust – November 2017
28
(a) Living in fast-moving water
In fast moving water the invertebrates
need to be able to cling to stones, rocks or
plants or they will be swept away. They
tend to have streamlined or flattened
bodies (for less friction), or special hooks
or suction attachments. They often move
very little in the water and when they do
they slowly creep. Some build ‘houses’
attached to the rocks. Because most of
the food they consume is either filtered
out of the water or grabbed as it passes,
they often have specialised front legs and
mouth-parts.
(b) Living in slow-moving water or
still water
These invertebrates don’t need to hang
on, so they don’t need to be streamlined;
rather they have to be adapted to move.
Food doesn’t come to them, they go to it.
They all have slightly different adaptations
depending on the niche they fill (living on
the surface, bottom, in leaf litter or in
burrows in the banks or bottom).
Human-caused changes in macro-
invertebrate numbers and diversity
In order to survive, macro-invertebrates
need specific ranges of environmental
conditions such as temperature, oxygen
levels, pH and salinity. A decrease in water
quality can therefore affect macro-
invertebrates by reducing their variety
(numbers of different types), leaving only
those species tolerant to poor water
quality. In general, diverse communities
tend to be more stable than less-diverse
ones, and it is generally assumed that high
levels of variety are desirable for a healthy
community.
While pollution can reduce the variety of
species in a community, it may lead to a
greater number of those species more
tolerant of the particular pollutant. The
macro-invertebrate species that survive
under polluted conditions usually increase
in number because of the lack of
competition for food from those species
that are no longer present.
Human activities in a water catchment, or
within the stream itself, can significantly
alter the characteristics of macro-
invertebrate communities, and therefore
affect animals higher up the food chain. As
the following examples show, changes in
sediment load, clearance of stream form
and increases in nutrient and effluent
input can all affect community structure.
Suspended solids can reduce light
penetration and therefore limit
photosynthesis, with consequences for
macroinvertebrate diversity and
numbers.
Sediment deposited on the stream-
bed can smother bottom-dwelling
communities and alter habitat by
filling in holes and depressions.
Riparian vegetation supplies food in
the form of organic material (leaves,
bark etc). Removal of this food source
will not only affect macroinvertebrates
that feed on it, but also increase the
amount of light reaching parts of the
stream that the overhanging
vegetation previously shaded. Loss of
Waterwatch Teachers’ Manual
© Waterwatch Education Trust – November 2017
29
shade may result in an increase in algal
production; conditions that will favour
some macroinvertebrates. Increased
solar radiation may also raise surface
water temperatures, affecting number
and diversity.
Removal of snags (woody debris) and
the formation of channels will alter
diversity significantly, by reducing the
variety of habitat available for
colonisation. It can also affect
invertebrate communities by
destabilising the river-bed.
Barriers can alter the natural flow
regime, temperatures and water
chemistry through controlled releases
from the cold bottom layer of a dam,
disrupting the various life stages of
many stream invertebrates. They also
obstruct the animals drift or
movement down the stream, reducing
any re-colonisation.
Increases in nutrients from catchment
run-off (through erosion, salinity, and
sedimentation) increase the potential
for algal productivity. The macro-
invertebrate community will respond
to changes in food supply and an
increase in grazing invertebrates will
occur.
Sewage and industrial effluents
contain many components, including
toxic substances such as heavy metals
and pesticides that can kill macro-
invertebrates, as can heated water,
which reduces oxygen levels and
disrupts the macroinvertebrate
metabolism.
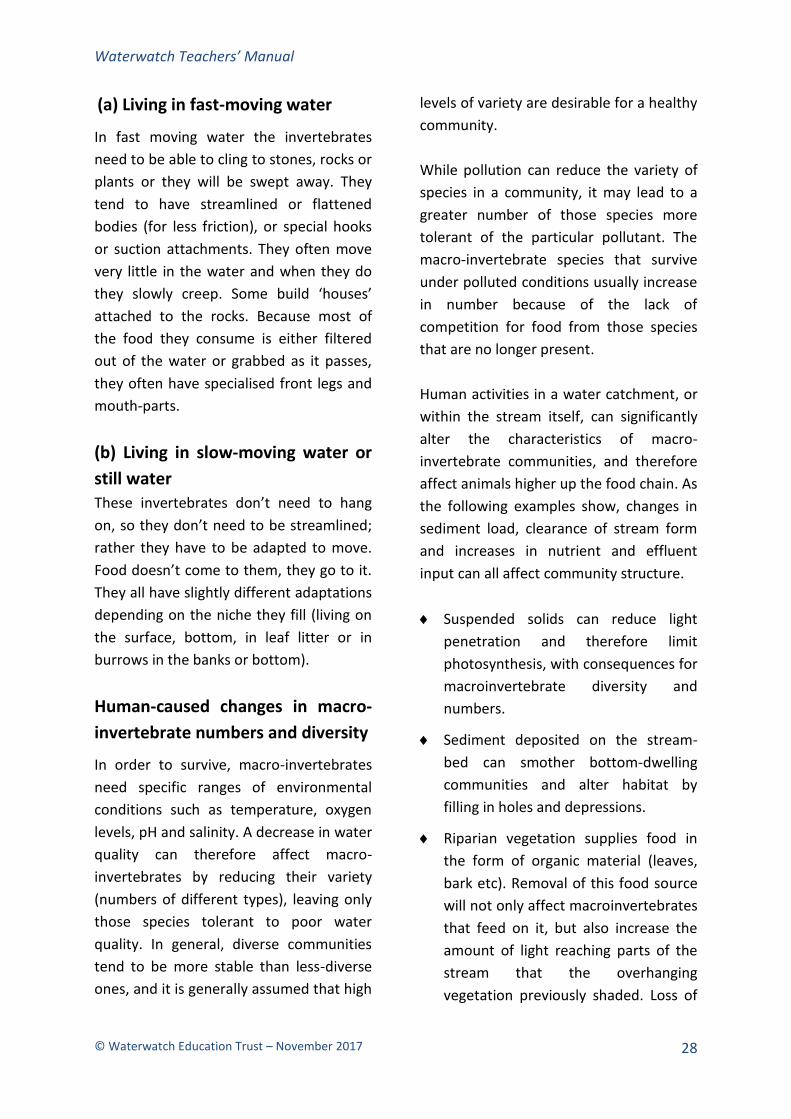
Severe organic pollution causes
depletion of oxygen in the water and
invertebrates are largely eliminated
except for species such as tubificids
(worms) and chironomids (midge
larvae), which can tolerate low levels
of oxygen. With less severe organic
pollution, diversity is reduced but the
abundance of tolerant species
increases. The effect of pollution by
toxic substances like heavy metals
differs somewhat, as different species
have different tolerance ranges.
However, as with organic pollution,
the result is a reduction in species
diversity and a change in the relative
abundance or tolerant organisms.
Waterwatch Teachers’ Manual
© Waterwatch Education Trust – November 2017
30
Calculating invertebrate diversity
Richness
This is an indication of how many different
types of invertebrates there are in a
waterway. The greater the richness the
higher the diversity will be. To calculate
richness, divide the invertebrates
collected into orders (e.g. mayflies,
worms, snails, caddisflies).
Relative abundance
Count the number of individuals in each of
the orders collected to determine relative
abundance. This allows you to
differentiate between streams that have
low numbers of individuals representing
many orders and those with many
individuals but representing only a few
orders.
EPT Richness (E=Ephemeroptera, P=
Plecoptera and T=Trichoptera)
This method is commonly used to
determine diversity of pollution-sensitive
invertebrates. It is a less effective method
in streams that are already very degraded.
To calculate EPT richness it is necessary to
count the number of stone fly, may fly and
caddis fly as they are all sensitive to
pollution.
The percentage of pollution sensitive
invertebrates in the samples is calculated
using the following formula:
% EPT =
Number of EPT individuals
Total number of invertebrates collected
100
1
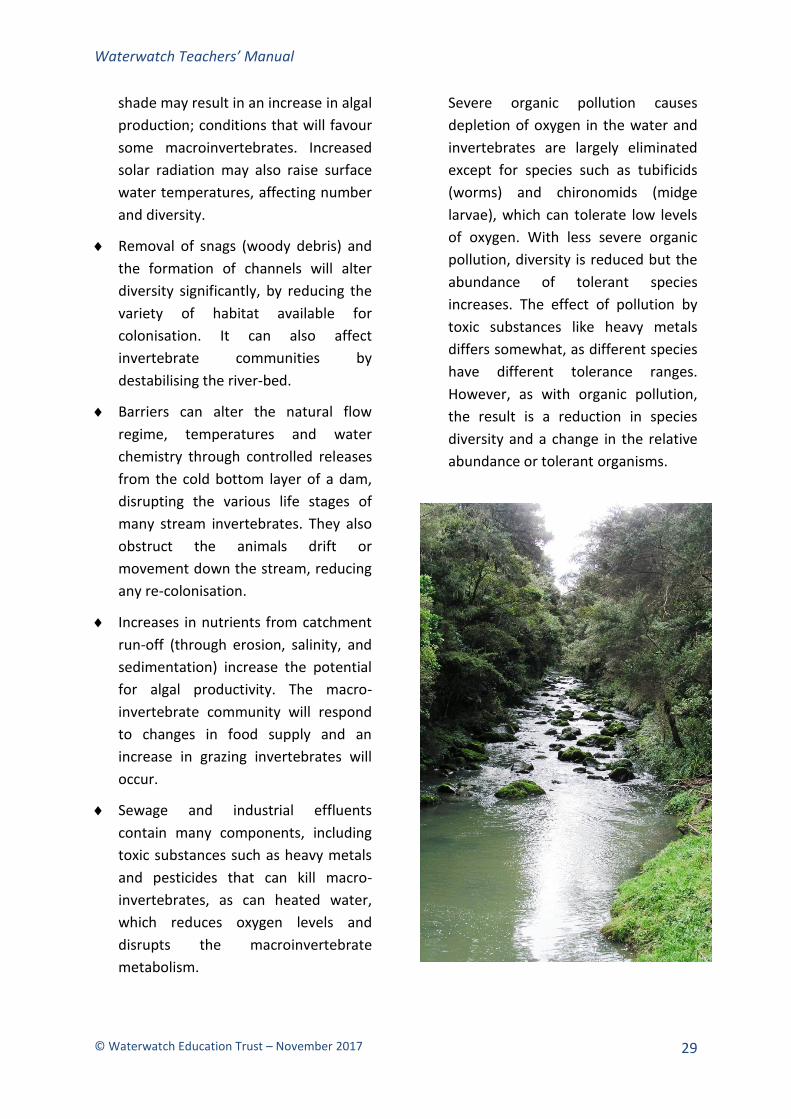
Sequential Comparison Index (SCI)
This method is independent of taxonomic
identification and can be used to indicate
the diversity of invertebrates in a
waterway. To calculate SCI simply add the
number of different types of
invertebrates.
SCI = Number of different types of inverts
Total number of individuals
SCI Stream Quality
1 – 0.9 Excellent
0.89 – 0.60 Good
0.59 – 0.30 Fair
0.29 – 0.00 Poor
Pollution Tolerance Index (PTI)
This index combines information about
diversity and the ability of invertebrates to
tolerate different levels of pollution.
Mayflies and stoneflies = rating 4
Caddisflies and dobsonflies = rating 3
Beetles, damselflies,
dragonflies, amphipods = rating 2
Midge larvae, snails, flies,
worms, water boatmen = rating 1
e.g. A sample that contained 2 types of
mayflies, 2 types of caddisflies, 1 type of
snail and 2 types of flies would be
calculated:
(24) + (2x3) + (3x1) =17
Pollution Tolerance Index = 17
PTI Stream Quality
Greater than 23 Excellent
17 – 22 Good
11 – 16 Fair
Less than 10 Poor
Waterwatch Teachers’ Manual
© Waterwatch Education Trust – November 2017
31
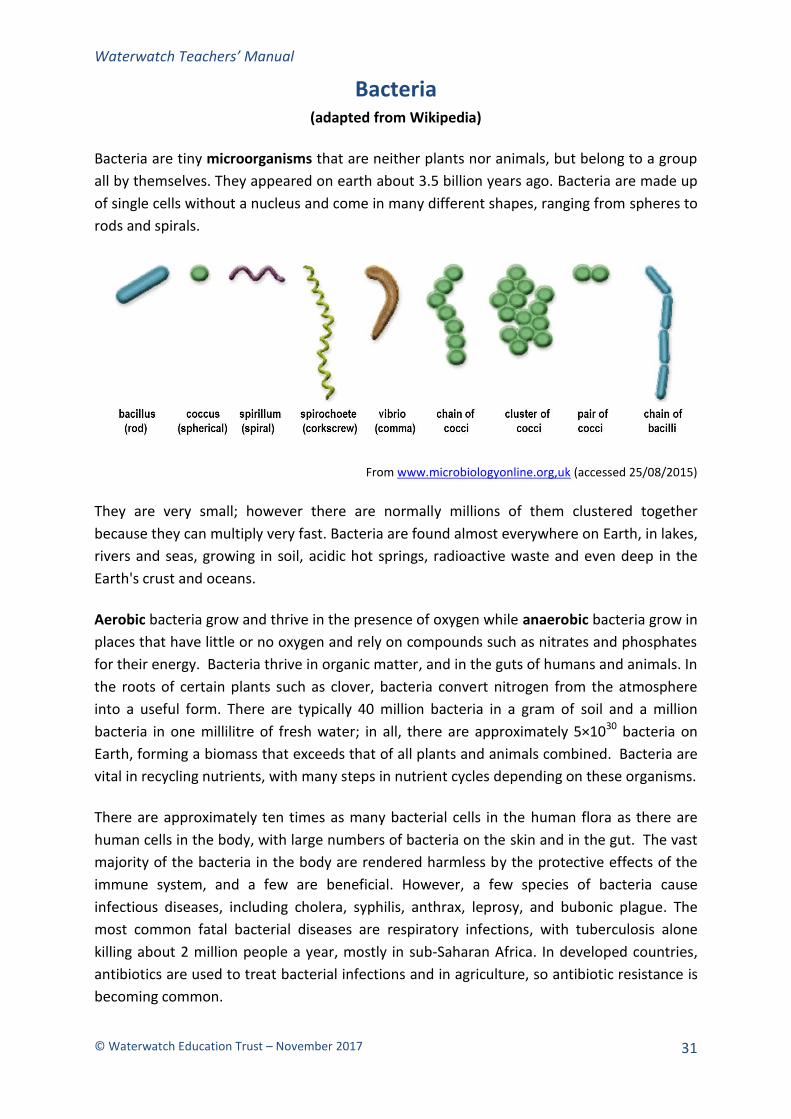
Bacteria (adapted from Wikipedia)
Bacteria are tiny microorganisms that are neither plants nor animals, but belong to a group
all by themselves. They appeared on earth about 3.5 billion years ago. Bacteria are made up
of single cells without a nucleus and come in many different shapes, ranging from spheres to
rods and spirals.
From www.microbiologyonline.org,uk (accessed 25/08/2015)
They are very small; however there are normally millions of them clustered together
because they can multiply very fast. Bacteria are found almost everywhere on Earth, in lakes,
rivers and seas, growing in soil, acidic hot springs, radioactive waste and even deep in the
Earth's crust and oceans.
Aerobic bacteria grow and thrive in the presence of oxygen while anaerobic bacteria grow in
places that have little or no oxygen and rely on compounds such as nitrates and phosphates
for their energy. Bacteria thrive in organic matter, and in the guts of humans and animals. In
the roots of certain plants such as clover, bacteria convert nitrogen from the atmosphere
into a useful form. There are typically 40 million bacteria in a gram of soil and a million
bacteria in one millilitre of fresh water; in all, there are approximately 5×1030 bacteria on
Earth, forming a biomass that exceeds that of all plants and animals combined. Bacteria are
vital in recycling nutrients, with many steps in nutrient cycles depending on these organisms.
There are approximately ten times as many bacterial cells in the human flora as there are
human cells in the body, with large numbers of bacteria on the skin and in the gut. The vast
majority of the bacteria in the body are rendered harmless by the protective effects of the
immune system, and a few are beneficial. However, a few species of bacteria cause
infectious diseases, including cholera, syphilis, anthrax, leprosy, and bubonic plague. The
most common fatal bacterial diseases are respiratory infections, with tuberculosis alone
killing about 2 million people a year, mostly in sub-Saharan Africa. In developed countries,
antibiotics are used to treat bacterial infections and in agriculture, so antibiotic resistance is
becoming common.
Waterwatch Teachers’ Manual
© Waterwatch Education Trust – November 2017
32
While some bacteria (called pathogenic bacteria) cause many diseases in humans and
animals, other bacteria are very useful. In industry, bacteria are important in sewage
treatment and the breakdown of oil spills, the production of cheese and yogurt through
fermentation, the recovery of gold, palladium, copper and other metals in the mining sector,
as well as in biotechnology, and the manufacture of antibiotics and other chemicals.
Types of bacteria
Bacteria are classified into four major groups according to their feeding habits.
1. Saprophytic. These feed on dead organic matter and are commonly called
“decomposers”. Saprophytic bacteria play a significant role in water polluted with
biodegradable wastes because they use up great amounts of oxygen as they break down
the wastes.
2. Commensal. Commensal bacteria take food from a living organism but, in the process,
provide a valuable service to that organism. For example, bacteria present in the
intestines of humans assist in the digestion of many foods. These bacteria couldn’t live
without us and we would have difficulty digesting our food without them!
3. Parasitic. Parasites live off another organism at the expense of its health. All pathogenic
bacteria fall into this category.
4. Autotrophic. These bacteria make their own food from simpler inorganic substances.
Some autotrophic bacteria contain chlorophyll and can carry on photosynthesis.
Autotrophic bacteria live in water or soil containing iron and sulphate compounds. The
end products produced by these bacteria lower the pH of water and soil (ie, make them
more acidic). This may harm some plants and animals. Because potatoes like an acid soil,
potato growers often add sulphur to their soil so sulphur bacteria (autotrophs) will lower
its pH.
Faecal coliforms
Pathogenic bacteria are our greatest concern because of the health problems they pose.
Unfortunately, such pathogens are hard to detect in water because: 1) there usually aren’t
very many of them; and 2) they can’t survive for very long outside the warm confines of the
human or animal body. Nevertheless, if pathogens get into a water supply from animal
wastes or through the release of unprocessed toilet wastes, they may live long enough to
find and infect a human or animal.
Even if we could test easily for the presence of pathogens in water, it would not be a wise
idea because we may get sick from exposure to the harmful bacteria. For this reason we
instead test for the presence of a relatively harmless (commensal) form of indicator bacteria
called coliform bacteria such as E Coli which, like pathogens, can live in the human body.
Faecal coliforms are bacteria that occur naturally in the gut and faeces of humans, other
mammals and birds. When animals defecate, some of these coliform bacteria (and perhaps
pathogenic organisms, too) pass out of their bodies with the wastes. If these wastes find

Waterwatch Teachers’ Manual
© Waterwatch Education Trust – November 2017
33
their way into a water supply, they bring bacteria and other microbes with them.
Consequently, if we find coliform bacteria in a water sample, we can presume there also is
human or animal excrement – and in all probability, pathogens – present, too.
The health risks associated with recreational use of water (eg, swimming, water skiing, etc)
are assessed in terms of the numbers of faecal coliforms present (see the Rating Guidelines
table in the next section). However, because faecal conditions can originate from sources
other than humans, and because they themselves are not disease-causing organisms, the
significance of faecal coliform data requires careful interpretation.
Bacteria such as Escherichia coli (E Coli) are normally measured as the number of colony
forming units (CFU) per 100 mL of water.
Natural variation
E Coli do not live naturally in water. During dry weather, numbers in unpolluted waters are
low and are usually less than 10 CFU per 100 mL.
However, following significant rainfall, the same waters may contain hundreds or even
thousands of bacteria per 100 mL. This is due to bacteria from animal and bird faeces in the
catchment being washed into the water body. When the rain has stopped, the faecal
bacteria numbers in the water fall fairly quickly due to various natural processes and
numbers return to background levels in a few days.
Human impacts
Raw human sewage contains tens of millions of faecal coliforms per 100 mL. Thus, only quite
small overflows or leakages from septic systems or sewerage pipelines can lead to counts of
thousands per 100 mL in affected waters. Runoff from intensive animal feedlots can have
similar effects.
Treated sewage effluent also contains millions of faecal coliforms per 100 mL but in many
cases the effluent is chlorinated. This treatment kills off most of the faecal coliforms so that
numbers below a discharge may not be excessively high. Contamination of a water body by
any of these sources would result in consistently high numbers of faecal coliforms during dry
weather conditions.
Following rain, faecal coliform numbers show increases even in relatively undisturbed
catchments. However, in catchments affected by human development – in particular, in
urban catchments – the increases in faecal coliform numbers may be much greater.
Overflows from septic tanks or sewage pipeline systems are more likely during wet weather
and runoff from animal feedlots will be exacerbated. In urban catchments, the faeces of
domestic animals also contribute to the contamination of water.
Waterwatch Teachers’ Manual
© Waterwatch Education Trust – November 2017
34
Microbiological counting method
Microbiological Counts indicate the presence of bacteria in a sample of water. High
coliform counts, especially E. coli, indicate that the water is unfit for drinking or swimming.
Membrane filter technique (See Methods section for 3M Petrifilm method)
The membrane filter technique allows you to very easily identify the different types of
bacteria that are present in your water sample. To prepare the plates, follow the steps
below:
1. Take a new filter paper and place on the filter funnel using sterilized tweezers.
2. Use a sterile pipette and take 1mL of the sample water.
3. Place about 15mL of sterile water on the filter, this helps spread the bacteria.
4. Drop the sample onto the filter paper
5. Turn on the vacuum until all the water is sucked through, wash sides with vacuum
still on with sterile water
6. Place the filter paper on the pre-prepared agar plate with sterile tweezers.
7. Label the agar plate with spirit based felt trip marker
8. Incubate at 37 ̊C for 24 hours.
Repeat for a 5mL and 10mL sample.
It is very important to use sterile equipment when preparing plates. Remember also to
prepare a ‘blank’ plate by using sterilized water. Sterile water can be acquired by passing
water through a 0.22µm filter. This plate enables you to check how sterile your equipment
was.
After 24 hours incubation: Seal the plates by laminating them to the reverse of this sheet.
The heat and sealing stops the reaction and makes the samples safe to handle. Count the
number of colony forming units (distinct dots) of E. Coli colonies (dark blue-violet), (the
other bacteria are: coliforms (red), salmonella (green) and other Gram (colourless).
Remember: Each ‘dot’ is a colony forming unit (CFU), these represent thousands of bacteria
that have grown from one bacterium in the original sample.
In order to calculate the number of colony forming units per 100mL, [International
standard] use the results of each individual bacterium from all three volumes as shown
below:
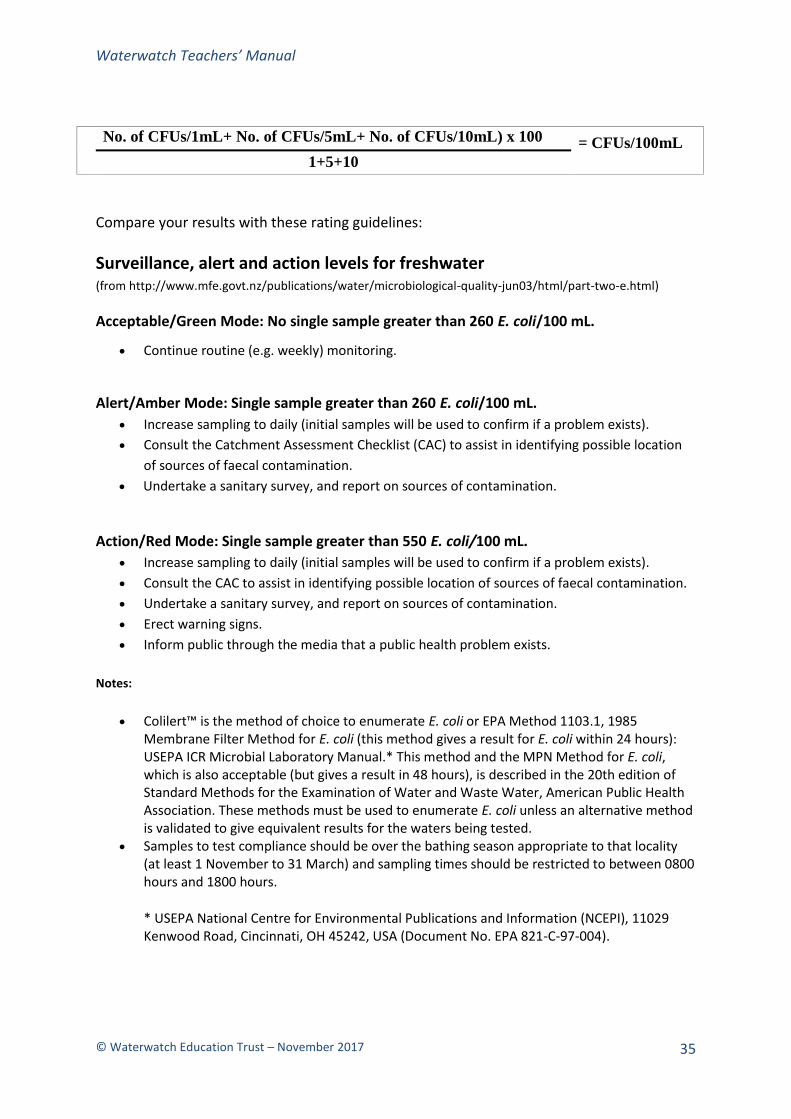
Waterwatch Teachers’ Manual
© Waterwatch Education Trust – November 2017
35
No. of CFUs/1mL+ No. of CFUs/5mL+ No. of CFUs/10mL) x 100 = CFUs/100mL
1+5+10
Compare your results with these rating guidelines:
Surveillance, alert and action levels for freshwater (from http://www.mfe.govt.nz/publications/water/microbiological-quality-jun03/html/part-two-e.html)
Acceptable/Green Mode: No single sample greater than 260 E. coli/100 mL.
Continue routine (e.g. weekly) monitoring.
Alert/Amber Mode: Single sample greater than 260 E. coli/100 mL.
Increase sampling to daily (initial samples will be used to confirm if a problem exists).
Consult the Catchment Assessment Checklist (CAC) to assist in identifying possible location
of sources of faecal contamination.
Undertake a sanitary survey, and report on sources of contamination.
Action/Red Mode: Single sample greater than 550 E. coli/100 mL.
Increase sampling to daily (initial samples will be used to confirm if a problem exists).
Consult the CAC to assist in identifying possible location of sources of faecal contamination.
Undertake a sanitary survey, and report on sources of contamination.
Erect warning signs.
Inform public through the media that a public health problem exists.
Notes:
Colilert™ is the method of choice to enumerate E. coli or EPA Method 1103.1, 1985 Membrane Filter Method for E. coli (this method gives a result for E. coli within 24 hours): USEPA ICR Microbial Laboratory Manual.* This method and the MPN Method for E. coli, which is also acceptable (but gives a result in 48 hours), is described in the 20th edition of Standard Methods for the Examination of Water and Waste Water, American Public Health Association. These methods must be used to enumerate E. coli unless an alternative method is validated to give equivalent results for the waters being tested.
Samples to test compliance should be over the bathing season appropriate to that locality (at least 1 November to 31 March) and sampling times should be restricted to between 0800 hours and 1800 hours.
* USEPA National Centre for Environmental Publications and Information (NCEPI), 11029 Kenwood Road, Cincinnati, OH 45242, USA (Document No. EPA 821-C-97-004).
Waterwatch Teachers’ Manual
© Waterwatch Education Trust – November 2017
36
Interesting facts about water
Water is a paradox! It is a stunningly simple liquid, with its molecule composed of just two hydrogen
atoms and one oxygen atom. It is also wonderfully complex, having more ‘exceptional’ properties
than any other substance – properties that are crucial for life and climate processes. It has extreme
(or close to extreme) values among liquids for: heat capacity, latent head of vaporisation, dielectric
constant, surface tension, thermal conductivity, chemical dissociation, compressibility, thermal
expansion and volume change on freezing.
Water is the only substance that occurs naturally in all three states (gas, liquid and solid) within
the Earth’s quite narrow environmental range.
Water moves around the earth in a water cycle which has five parts: evaporation, condensation,
precipitation, infiltration and surface run-off (see the diagram on page 38).
Nature stopped making water at least three billion years ago; therefore the water cycle is a
closed system and water is neither lost nor gained as it moves between cloud, land and sea.
Water dissolves more substances in greater quantities than any other liquid, even the strongest
acids; this property is essential in countless chemical, physical and biological processes.
Hydrogen bonds between water molecules break and reform again in 200 quadrillionths of a
second. The energy stored in these bonds enables water to absorb heat readily; only ammonia
has a higher heat capacity. Its high heat capacity means water is able to absorb a relatively large
amount of heat before its temperature rises significantly. Therefore water enables humans to
maintain a constant body temperature and slows temperature changes in oceans. The oceans
are vast, powerful heat carriers, redistributing heat and moderating climate around the Earth.
Because oxygen is more electron-friendly than hydrogen, there is a net negative charge on
water’s oxygen atom and the hydrogen atom has a net positive charge. Hence each water
molecule is polarised, creating a strong electrical attraction between them. The tight bunches of
molecules attracted together are hard to separate and this raises the boiling point of water.
The electrical forces between water molecules also give rise to water’s high surface tension and
its capillary forces. Surface tension controls droplet formation in rain and clouds. Capillary
action causes water to move up a narrow tube against the force of gravity. This property is
relied upon by plants such as trees to bring water from the roots up the stem to the leaves.
Water is the only substance that expands when frozen. As it is cooled, liquid water contracts as
expected until 4oC, then it expands slightly as it approaches its freezing point.
Its expansion by about 9% when cooled from 4oC to freezing point leaves more gaps between
the water molecules in ice, making it less dense than liquid water (see the diagram on page 37).
This is why ice floats on water and ice only forms on the surface. If ice was denser than water,
many bodies of water would freeze solid in winter, killing all animal life in them.
Water is essential for our survival. We might survive a month without food but would die in 3-5
days without water. A person must consume 2 litres of water daily to live healthily. Humans
drink an average of 75,000 litres of water throughout their life.
Our bodies are composed of around 60% water. About 40 litres of water sloshes around in a 70
kg person, about the same as the volume as the full petrol tank of a small car. Human brains
contain 75% water, bones 25% and blood 83%.
Waterwatch Teachers’ Manual
© Waterwatch Education Trust – November 2017
37
Most of our food is made up of water; for example - tomatoes (95%), spinach (91%), milk (90%),
apples (85%), beef (61%).
Of the 1.4 billion cubic kilometres of water on the Earth: 92% is sea water, 2.6 % is groundwater
in aquifers, 2% is frozen in the polar icecaps, 0.015% passes through lakes, rivers and streams,
0.001% is in atmospheric moisture, 0.001% is locked in the bodies of living things.
In a 100-year period, a water molecule spends 98 years in the ocean, 20 months as ice, about 2
weeks in lakes and rivers, and less than a week in the atmosphere.
Ground water can take around 50 years to travel one kilometre.
Around 50% of all available water is being taken from natural waterways for human use. In arid
regions that figure is close to 90%. Over the past 100 years, water use per head has increased
six-fold.
In the developing world 90% of all wastewater goes untreated into rivers and streams.
More than 2 billion people on Earth do not have access to safe water. 450 million people in 29
countries suffer from water shortages. Two out of three people on Earth will live in water-
stressed areas by 2025. In Africa 25 countries will suffer water stress (<1700 cubic metres
available for each person per year) by 2025.
Every 21 seconds a child dies from a water-related illness. Lack of access to clean water and
sanitation kills children at a rate equivalent to a jumbo jet crashing every four hours.
Most people in the world walk at least 3 hours daily to fetch water; worldwide, women spend a
total of 200 million hours daily on this task.
Water consumption in the USA is about 1,400 litres (ie, 1.4 tonne) per person per day. This
more than 500 times the daily dietary need. Only 300 litres is for indoor use, the remainder
being used for irrigation, agriculture and industry.
A 5 minute shower uses more water than the average person in a developing country slum uses
in one day.
30 km3 more water is being used each year in China than rain is replacing.
In New Zealand, our consumption (including irrigation) is 1,500 litres per person per day.
However, this consumption is dwarfed by the water used for hydroelectric power generation
(which is 50 times greater).
In New Zealand around 1000 litres of water are required to produce 1 litre of milk; 450 litres to
produce one egg; 35 litres to produce a can of fruit or vegetables; 38 litres to produce one slice
of bread; 2,700 litres to produce one cotton T-shirt; 5,400 litres to produce a barrel of beer;
150,000 litres to produce a new car.
Read more about the fascinating properties of water in the scientific paper “Ode to H2O” by the late
Dr Graham Buchan of Lincoln University. Available at http://hdl.handle.net/10182/333.
This Wikipedia article is very informative: http://en.wikipedia.org/wiki/Water
Here is a YouTube video clip that is worth viewing:
http://www.youtube.com/watch?feature=player_detailpage&v=HVT3Y3_gHGg
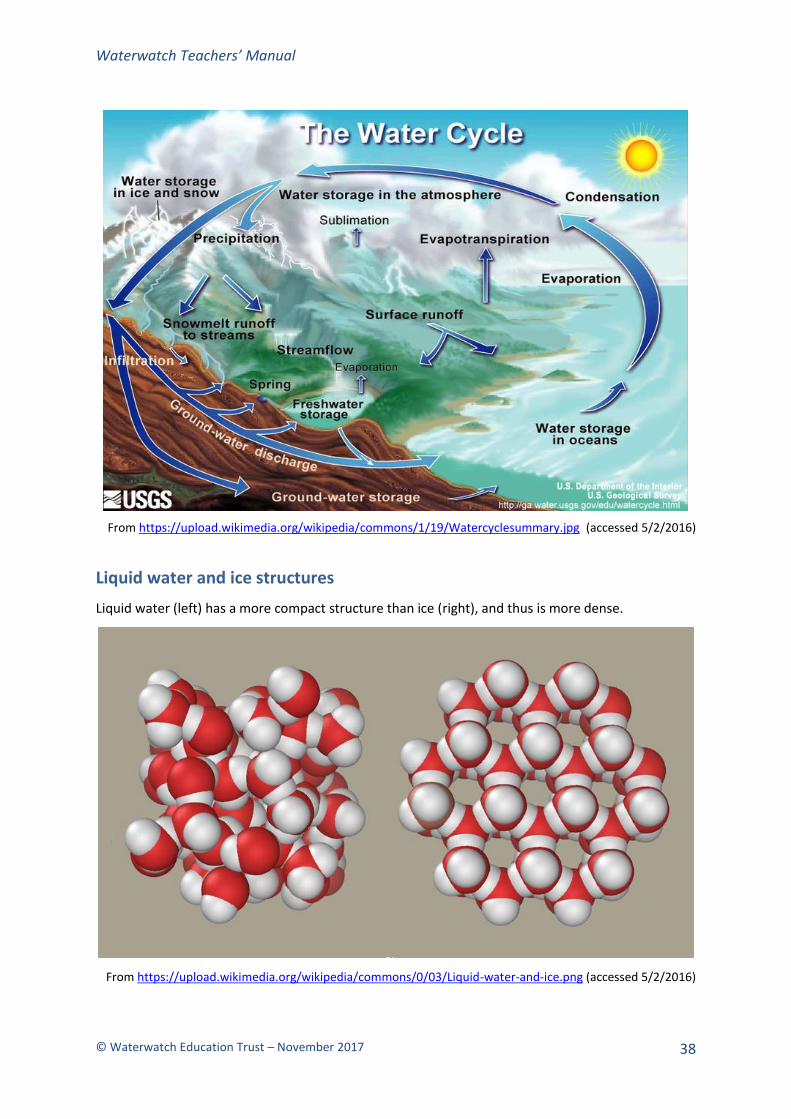
Waterwatch Teachers’ Manual
© Waterwatch Education Trust – November 2017
38
From https://upload.wikimedia.org/wikipedia/commons/1/19/Watercyclesummary.jpg (accessed 5/2/2016)
Liquid water and ice structures
Liquid water (left) has a more compact structure than ice (right), and thus is more dense.
From https://upload.wikimedia.org/wikipedia/commons/0/03/Liquid-water-and-ice.png (accessed 5/2/2016)
Waterwatch Teachers’ Manual
© Waterwatch Education Trust – November 2017
39
Review Questions for the Class (from the Student Workbook)
1. Do the creatures called ‘macroinvertebrates’ include fish? Explain your answer.
2. If many macroinvertebrates which are classed as ‘very sensitive’ are found in a stream, what does this suggest about the quality of its water?
3. When water is heated, bubbles of gas are seen rising to the surface. What is the gas that is being released? Is more of this gas dissolved in the water when the water is cold or when it is hot?
4. Give four ways in which atmospheric oxygen can become dissolved in water.
5. Fish and aquatic macroinvertebrates prefer to live in cold water rather than warm water. Why?
6. A stream is well-shaded by trees and bushes along its banks. What benefits is the shade likely to provide to the fish and invertebrates in the water?
7. Which of the following water temperatures is most likely to be measured in a stream or river in Canterbury during the summer months? (a) 5oC, (b) 15oC, (c) 25oC?
8. The result for a nitrate test (NO3-N) on stream water is 1.5 mg/L. Is this result: (a) excellent (ie, very low), (b) satisfactory, (c) unsatisfactory (ie, too high)?
9. Suggest reasons for the nitrate result reported in Question 8.
10. If a stream is rich in phosphates, what might be the cause of this?
11. A stream becomes rapidly choked with water weed. (a) Why is this likely to occur? (b) What is likely to happen to the oxygen content of the water?
12. What does the ‘turbidity’ of the water measure?
13. What effects does high turbidity have on aquatic life, including plants?
14. Which has the greater ability to conduct electricity, ie, a higher conductivity (a) fresh water from a stream, lake or river or (b) sea water? Explain why.
15. If a large quantity of milk is tipped into a stream, why will most of the fish and macroinvertebrates in the stream die?
16. A sample of stream water is tested for pH and is found to have a pH of 6.0. Does this result indicate that the water is (a) very acidic, (b) slightly acidic, (c) neutral, (d) slightly alkaline, (e) very alkaline?
17. Which creatures may die in water which has a pH of 6.0?
18. A stream will flow slowest where it is (a) wide and deep, (b) narrow and deep, (c) wide and shallow, or (e) narrow and shallow?
19. Give one type of indicator bacteria. Where do these bacteria occur naturally?
20. The water in a stream may be low in nitrates and phosphates and have very low turbidity, yet it is not safe to drink. Suggest why this might be the case?
21. A number of aquatic invertebrates are called “nymphs” or “larvae”. What do these eventually grow into?
Waterwatch Teachers’ Manual
© Waterwatch Education Trust – November 2017
40
Answers to review questions on the previous page
1. Fish are not macroinvertebrates because they have backbones; they are called vertebrates.
2. Sensitive macroinvertebrates required good quality water (ie, low level s of pollutants and turbidity in the water to
thrive. Their presence in reasonable numbers generally indicates good water quality.
3. Bubbles that appear as the water is warmed are air bubbles (oxygen and nitrogen gas). As the water approaches the
boiling point, water vapour bubbles increasingly appear. This demonstration indicates that cold water holds more
oxygen than warm water.
4. Oxygen is dissolved in water (1) through wind disturbing the surface; (2) through raindrops falling on the surface; (3)
through agitation when water flows through rapids or over waterfalls; (4) through photosynthesis by aquatic plants.
5. Cold water is able to hold a higher quantity of dissolved oxygen than warm water.
6. Shade from trees will prevent strong sunlight reaching the stream. Hence the water remains cooler, and hence more
oxygen will be available for fish and other organisms living in the river than for warmer water.
7. The water temperature will be closest to 15 degrees, somewhere close to the mean air temperature in New Zealand
in summer. Artesian water from a well or spring is generally around 12 degrees, all year around.
8. A nitrate level of 1.5 mg/l is about three times higher than the maximum level of the satisfactory range (0.5 mg/l –
see the table on page 2 of the Student Workbook). The stream will be overloaded with nutrients which promote
excessive weed and algae growth, which impedes the flow. When the stream becomes choked with weed, the
excessive growth must be removed mechanically to restore the flow.
9. A high nitrate result can arise from leaching of nitrates from fertilised pastures or from animal urine. Also, certain
plants such as clover have nitrogen-fixing bacteria in the roots that convert atmospheric nitrogen in soil nitrates, and
these encourage plant growth.
10. Two reasons: (1) Naturally high phosphate levels are found in streams in volcanic areas; (2) Phosphates from
fertilised pastures can leach in nearby rivers and streams. Detergents also have quite high levels of phosphate.
11. A stream may become choked with weed if the nitrate or phosphate levels in the water are too high. While the weed
grows it will contribute oxygen to the water, but once it starts to die and break down, due to the action of bacteria,
the oxygen level in the water will drop. This is because bacteria use up oxygen.
12. Turbidity measures the clarity of water, the lower the turbidity reading the better.
13. A river or stream with high turbidity has a large quantity of fine silt particles suspended in the water. The silt can
cover plant surfaces with a film that affects the growth of the plant. The fish cannot see their prey, and their gills
become clogged, affecting their respiration.
14. Sea water conducts electricity much more than fresh water because of the very high level of salts and minerals
dissolved in sea water. When salts such as sodium chloride are dissolved they dissociate into positive (Na+) and
negative (Cl-) ions which move under the influence of an electric field to produce an electric current. For deionised
water, where all the salts and minerals have been removed, the conductivity is close to zero.
15. Milk spilt into a stream will encourage huge growth in bacteria numbers and this will enable to milk to be broken
down. However, the bacteria require oxygen and as they multiply the oxygen in the water will drop to a level that is
insufficient to sustain aquatic life.
16. On the pH scale, a reading of 6.0 is just on the acidic side of the neutral point (7.0). So the water is only slightly acidic.
17. According to the information in the pH Scale on page 2 of the Student Workbook, snails and tadpoles begin to die
when the pH drops to about 6.5.
18. The slowest part of a river is where it has the largest cross-section, ie, where it is both wide and deep.
19. A commonly-used indicator bacteria is Eschirichia Coli ( E.Coli), which is present in the gut of warm-blooded animals.
Their presence indicates that animal excrement, likely to contain other more toxic bacteria, may also be present in
the water.
20. Harmful bacteria, possibly originating from animal excrement, a decaying animal corpse in the stream or sewage
intrusion, may be present. The water may still appear clear and pristine.
21. Larvae and nymphs grow into flies and beetles, which lay the eggs that continues the insect’s life cycle.

Waterwatch Teachers’ Manual
© Waterwatch Education Trust – November 2017
41
Instruction sheets

Waterwatch Teachers’ Manual
© Waterwatch Education Trust – November 2017
42
Using the HACH DR890 colorimeter to test water quality
The DR890 is a sensitive, expensive instrument – PLEASE HANDLE WITH CARE!
WATER MUST NEVER BE POURED INTO THE INSTRUMENT
Most tests are designed for water of low turbidity
To switch the instrument ON press the EXIT key (Turn OFF using the same key)
To select a test program: press PRGM (ie, Key 7) and enter the programme number
When zeroing the instrument, or taking a reading, the light shield must be in place.
1) Dissolved Oxygen (DO): To select programme: Press PRGM, type 70, then press ENTER [display shows O2]
Pour water sample into the plastic container so that it is about 2/3 full. Immerse the small, blue, rubber cap in the water, flat side down.
Take a small glass DO vial and break its tip off UNDER WATER (by placing tip of vial onto the bottom of the container at a 45o angle, and pressing down firmly with your thumb). IMPORTANT: Keep the vial fully immersed until it is filled with water ensuring that NO AIR is sucked into the vial to ruin the test!
While the vial is still immersed, fit the blue rubber cap over the end of the vial to seal it. (TAKE CARE as the broken end may be sharp). Once the vial is capped remove it from the water and turn it upright.
Shake the vial for 5 seconds, and then wait for approximately two minutes.
Meanwhile, insert the large sample tube (containing deionised (DI) water) into the sample cell compartment of the DR890 and place the light shield over it. Press ZERO. When 0.00 is displayed and the two minutes has elapsed, swap the DI sample tube with the clean, wiped vial. Cover the vial with the light shield, then press READ….... DO test result is displayed (in mg/L). Record this result.
Use the nomogram provided, (together with the measured water temperature), to convert this mg/L result into the percent saturation of oxygen (%).
Waterwatch Teachers’ Manual
© Waterwatch Education Trust – November 2017
43
2) Nitrate (NO3-N): To select programme: Press PRGM, type 54, then press ENTER [display shows NO3-N ]
Using the syringe, inject 10ml of the water sample into small sample tube (black cap).
Find the small chemical sachet (aluminium foil labelled HR NITRATE) and open it, (using scissors if necessary).
Use a small plastic funnel (labelled N) transfer ALL of the powder from the sachet into the sample tube. Screw the cap on the sample tube.
Press TIMER key and 1.00 minute will show on display; press ENTER to start timer. Shake the sample tube vigorously over the one minute. After one minute has elapsed the instrument will “beep” and 5.00 minutes will show on the display. Press ENTER to activate the timer again and now cease shaking the sample tube.
While waiting for five minutes, transfer a sample of river water into a large sample tube. This is your zero (or background) sample. Screw on its cap and insert the sample tube into DR890 (with the light shield covering the tube).
Once five minutes has elapsed (indicated by “beeps”) press ZERO ….. 0.00 is displayed.
When 0.00 appears, remove the large tube from the DR890 and insert the small tube containing the chemical (having wiped it dry first). Cover it with the light shield, press READ…..nitrate test result is displayed (in mg/L of NO3-N). Record this result.
NOTE: The five minute waiting period during this test enables other water tests, which do
not involve the DR890, to be carried out. These tests are temperature, pH and conductivity.
The instructions for using the instruments required are on an accompanying sheet.
3) Dissolved Phosphates (DRP): To select programme: Press PRGM, type 79, then press ENTER ; [display shows PO4].
Using a syringe, inject 10ml of the water sample into small sample tube (metal cap).
Open the PHOSPHATE RGT sachet and use a funnel (labelled P) to transfer ALL of the powder into the sample tube and screw its cap on. Shake for 15 seconds ONLY.
Press TIMER; a 2.00 minute time interval will appear; press ENTER to start timer.
While waiting for the two minutes to elapse, insert your river water sample (in a large tube) into the DR890, and cover it with the light shield. Once the timer has signalled the completion of two minutes, press ZERO………0.00 is displayed.
Replace the tall tube with the wiped, small sample tube (containing the chemical which is usually not completely dissolved), cover the tube with light shield, then press READ…..phosphate test result is displayed (in mg/L of PO4). Record this result.
4) Measurement of Turbidity (water clarity) To select programme: Press PRGM, type 95, press ENTER [display shows FRU]
Insert the large sample tube containing DI water into DR890. Cover with light shield.
Press ZERO ……….0.0 is displayed.
Fill another large tube with a sample of water that has been shaken.
Remove the DI water sample tube and replace it with the wiped, shaken sample tube. Cover it with the light shield.
Press READ ………turbidity test result is shown in FRUs [which is the same as the standard NTU international units for turbidity]. Record this result.

Waterwatch Teachers’ Manual
© Waterwatch Education Trust – November 2017
44
Measuring the temperature, pH and electrical conductivity of water
The instruments to be used are sensitive and expensive. Please use them with care and turn them
off after use to save their batteries. They are all to be found in the field kit case.
For all tests, use the large 1 litre plastic bottle, filled with water from a stream or pond.
pH
Remove the pH meter from its black box (two models available, as shown below); remove
the plastic cap for its probe tip and put the cap in the box for safe keeping.
Turn the pH meter on (small red button) and immerse the probe in water, to no more than
half-way.
Move probe around using a gentle stirring action and allow time for the meter to stabilise
before taking a reading (while probe remains immersed).
Result displayed is in pH units. Record this, then remove the meter from the water.
Place cap back on the pH meter, turn it off (small red button) and return the meter to its
box. Put the box back in the field kit case.
Temperature
Use the yellow ‘lollipop’ (a digital thermometer).
Turn the thermometer on (press bottom blue button), remove the cover tube to expose the
metal temperature probe and immerse the probe fully in the water.
Wait at least one minute for the temperature reading to stabilise. DO NOT remove the
thermometer from the water because its reading may change significantly.
Result displayed in oC. Record this, and then remove the thermometer from the water.
Turn the thermometer off by pressing the bottom blue button, put the cover tube back in
place over the probe and return the thermometer to the field kit case.
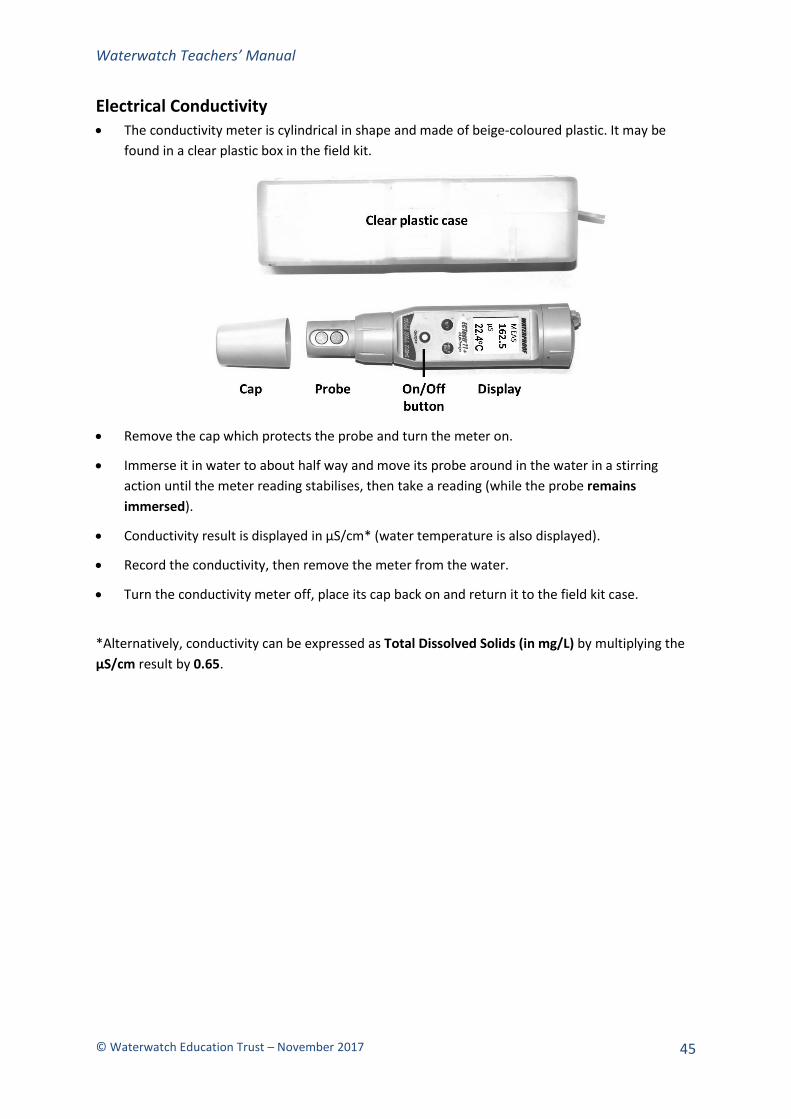
Waterwatch Teachers’ Manual
© Waterwatch Education Trust – November 2017
45
Electrical Conductivity The conductivity meter is cylindrical in shape and made of beige-coloured plastic. It may be
found in a clear plastic box in the field kit.
Remove the cap which protects the probe and turn the meter on.
Immerse it in water to about half way and move its probe around in the water in a stirring
action until the meter reading stabilises, then take a reading (while the probe remains
immersed).
Conductivity result is displayed in µS/cm* (water temperature is also displayed).
Record the conductivity, then remove the meter from the water.
Turn the conductivity meter off, place its cap back on and return it to the field kit case.
*Alternatively, conductivity can be expressed as Total Dissolved Solids (in mg/L) by multiplying the
µS/cm result by 0.65.
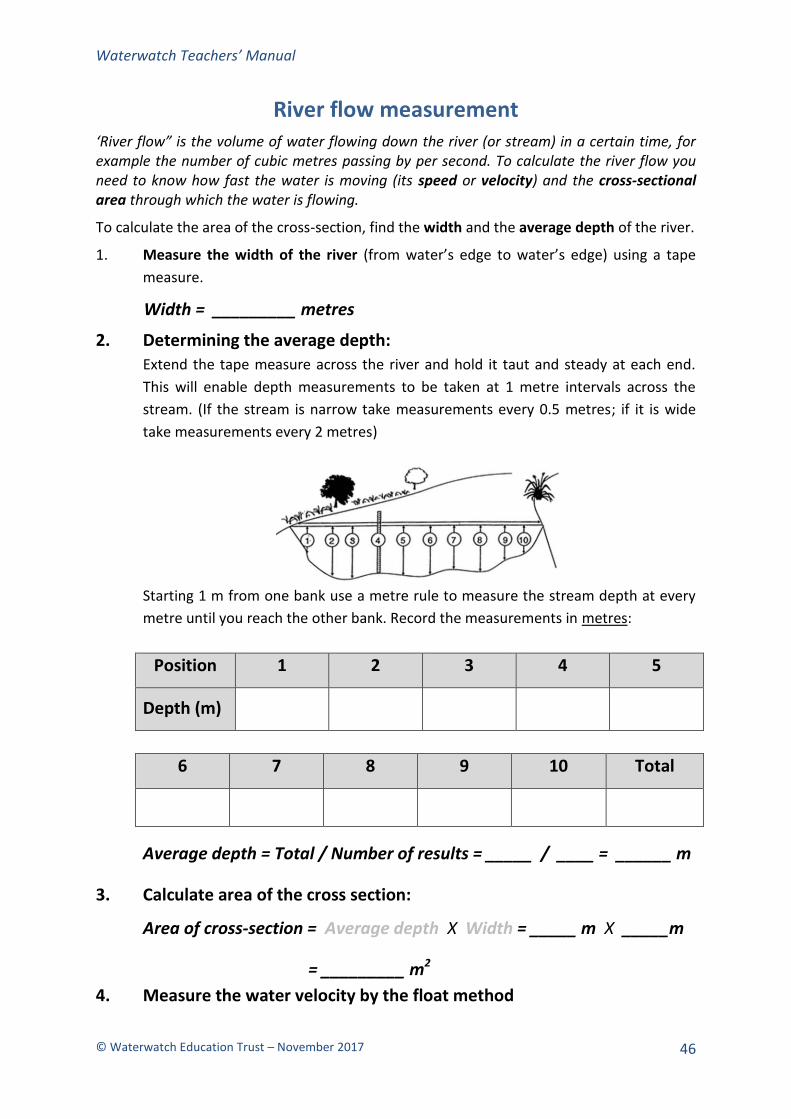
Waterwatch Teachers’ Manual
© Waterwatch Education Trust – November 2017
46
River flow measurement ‘River flow” is the volume of water flowing down the river (or stream) in a certain time, for example the number of cubic metres passing by per second. To calculate the river flow you need to know how fast the water is moving (its speed or velocity) and the cross-sectional area through which the water is flowing.
To calculate the area of the cross-section, find the width and the average depth of the river.
1. Measure the width of the river (from water’s edge to water’s edge) using a tape
measure.
Width = _________ metres
2. Determining the average depth:
Extend the tape measure across the river and hold it taut and steady at each end.
This will enable depth measurements to be taken at 1 metre intervals across the
stream. (If the stream is narrow take measurements every 0.5 metres; if it is wide
take measurements every 2 metres)
Starting 1 m from one bank use a metre rule to measure the stream depth at every
metre until you reach the other bank. Record the measurements in metres:
Position 1 2 3 4 5
Depth (m)
6 7 8 9 10 Total
Average depth = Total / Number of results = _____ / ____ = ______ m
3. Calculate area of the cross section:
Area of cross-section = Average depth X Width = _____ m X _____m
= _________ m2
4. Measure the water velocity by the float method

Waterwatch Teachers’ Manual
© Waterwatch Education Trust – November 2017
47
Use a tape measure to mark a 10 metre distance along the river bank.
Person A releases the ball into the mid-stream flow of the river. At this instant Person B starts the stopwatch. When the ball passes the end of the 10 m stretch, stop the stopwatch. Repeat this five times, recording each result. If the site allows, you could take your five measurements at intervals across the width of the river.
1 2 3 4 5 Total Average Time
Time (s)
Calculate how fast the water is flowing by dividing the distance (10 m) by the average time:
Surface velocity = distance / average time = _____ / _____ = _____m/s
5. Calculate the water flow Q
Now you have collected all the required measurements you can use the Continuity
Equation Q = A x V to calculate the water flow in the stream, that is, how many litres of
water are passing by per second.
Multiply the average surface velocity of the river (m/s) by the cross-sectional area (m2):
Flow (Q)= average surface velocity X cross-sectional area
= __________ cubic metres per second (m3/s or cumecs)
There are 1000 litres per cubic metre of water, so multiply the above result by 1000 to convert the flow to litres per second:
Flow (Q) = flow (m3/s) X 1000 = ________ L/sec
6. Extension exercise
Q measures the water flow of your river. If you know the nutrient loading of the water (eg, the mg per litre of nitrates or phosphates present) you can calculate the indicative amounts of these nutrients carried by the river in one day, one month or a year; for example kg per day or tonnes per year.
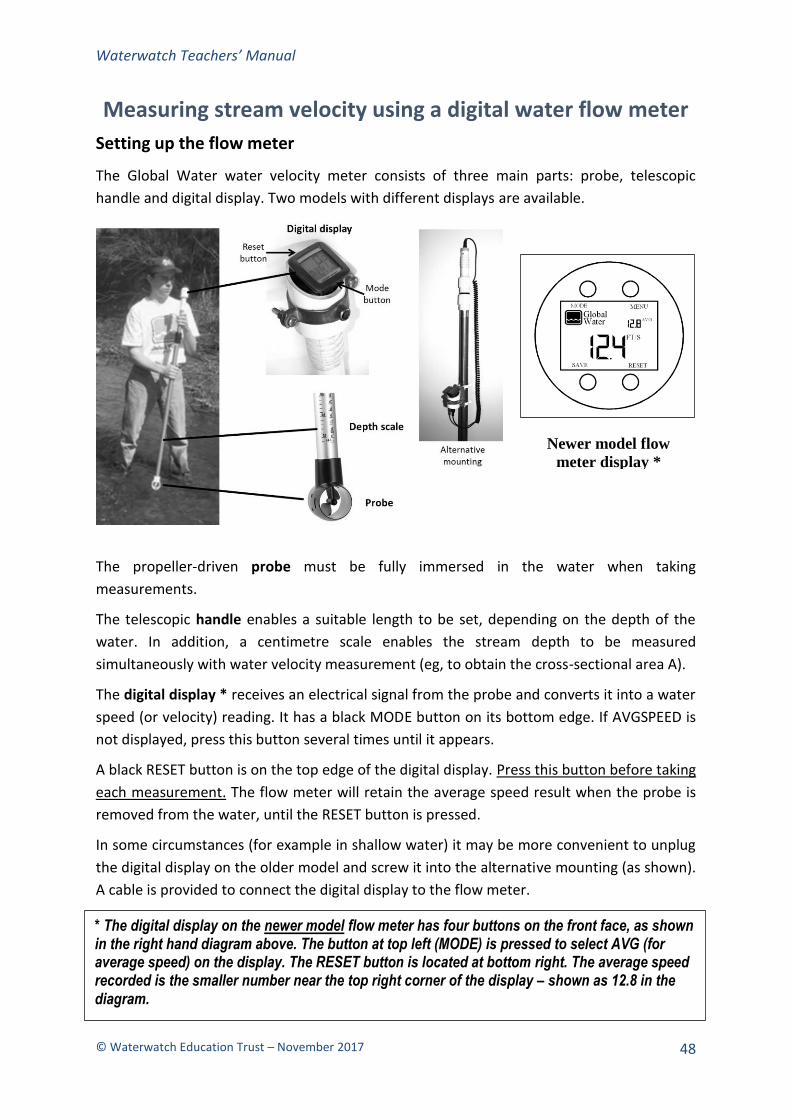
Waterwatch Teachers’ Manual
© Waterwatch Education Trust – November 2017
48
Measuring stream velocity using a digital water flow meter
Setting up the flow meter
The Global Water water velocity meter consists of three main parts: probe, telescopic
handle and digital display. Two models with different displays are available.
The propeller-driven probe must be fully immersed in the water when taking
measurements.
The telescopic handle enables a suitable length to be set, depending on the depth of the
water. In addition, a centimetre scale enables the stream depth to be measured
simultaneously with water velocity measurement (eg, to obtain the cross-sectional area A).
The digital display * receives an electrical signal from the probe and converts it into a water
speed (or velocity) reading. It has a black MODE button on its bottom edge. If AVGSPEED is
not displayed, press this button several times until it appears.
A black RESET button is on the top edge of the digital display. Press this button before taking
each measurement. The flow meter will retain the average speed result when the probe is
removed from the water, until the RESET button is pressed.
In some circumstances (for example in shallow water) it may be more convenient to unplug
the digital display on the older model and screw it into the alternative mounting (as shown).
A cable is provided to connect the digital display to the flow meter.
Newer model flow
meter display *
* The digital display on the newer model flow meter has four buttons on the front face, as shown in the right hand diagram above. The button at top left (MODE) is pressed to select AVG (for average speed) on the display. The RESET button is located at bottom right. The average speed recorded is the smaller number near the top right corner of the display – shown as 12.8 in the diagram.
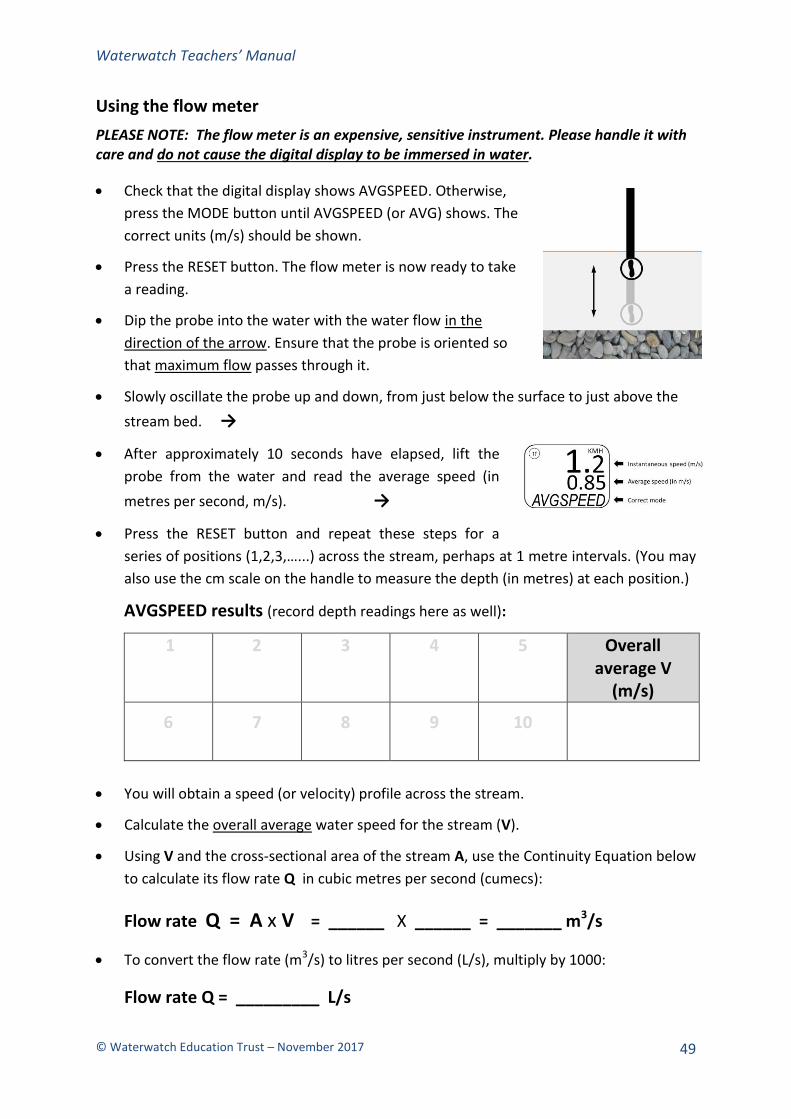
Waterwatch Teachers’ Manual
© Waterwatch Education Trust – November 2017
49
Using the flow meter
PLEASE NOTE: The flow meter is an expensive, sensitive instrument. Please handle it with care and do not cause the digital display to be immersed in water.
Check that the digital display shows AVGSPEED. Otherwise,
press the MODE button until AVGSPEED (or AVG) shows. The
correct units (m/s) should be shown.
Press the RESET button. The flow meter is now ready to take
a reading.
Dip the probe into the water with the water flow in the
direction of the arrow. Ensure that the probe is oriented so
that maximum flow passes through it.
Slowly oscillate the probe up and down, from just below the surface to just above the
stream bed. →
After approximately 10 seconds have elapsed, lift the
probe from the water and read the average speed (in
metres per second, m/s). →
Press the RESET button and repeat these steps for a
series of positions (1,2,3,…...) across the stream, perhaps at 1 metre intervals. (You may
also use the cm scale on the handle to measure the depth (in metres) at each position.)
AVGSPEED results (record depth readings here as well):
1 2 3 4 5 Overall average V
(m/s)
6 7 8 9 10
You will obtain a speed (or velocity) profile across the stream.
Calculate the overall average water speed for the stream (V).
Using V and the cross-sectional area of the stream A, use the Continuity Equation below
to calculate its flow rate Q in cubic metres per second (cumecs):
Flow rate Q = A x V = ______ X ______ = _______ m3/s
To convert the flow rate (m3/s) to litres per second (L/s), multiply by 1000:
Flow rate Q = _________ L/s
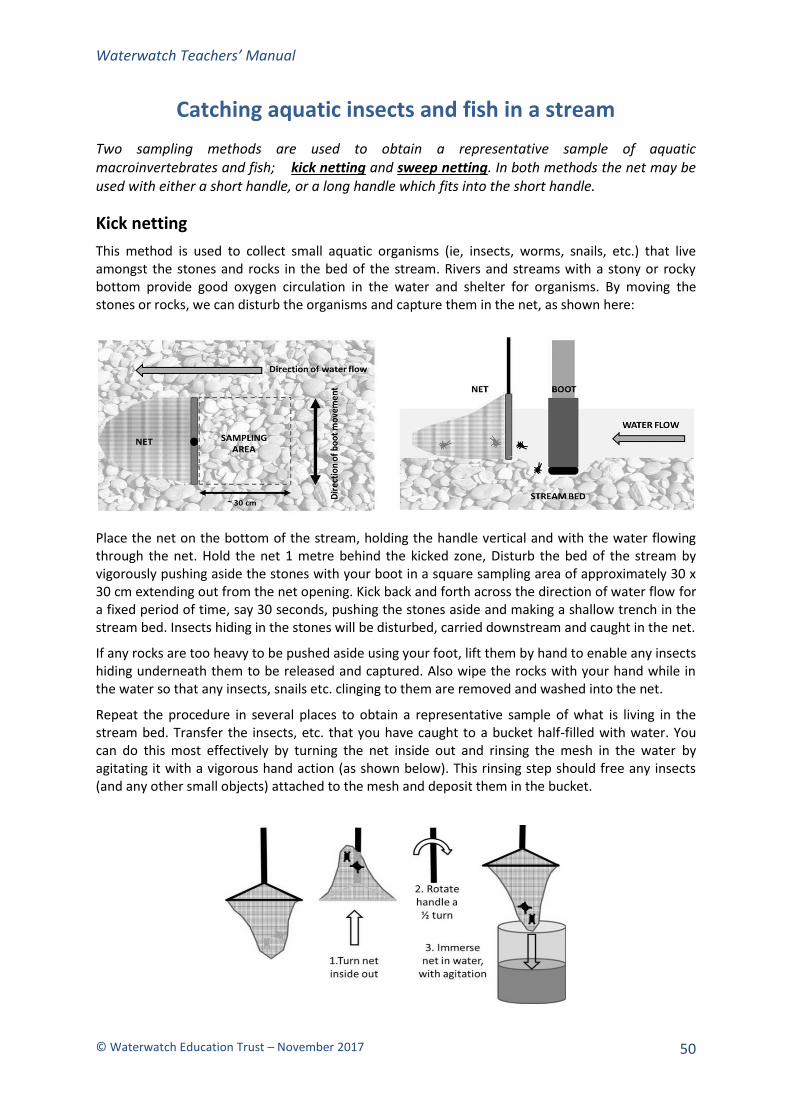
Waterwatch Teachers’ Manual
© Waterwatch Education Trust – November 2017
50
Catching aquatic insects and fish in a stream
Two sampling methods are used to obtain a representative sample of aquatic macroinvertebrates and fish; kick netting and sweep netting. In both methods the net may be used with either a short handle, or a long handle which fits into the short handle.
Kick netting
This method is used to collect small aquatic organisms (ie, insects, worms, snails, etc.) that live amongst the stones and rocks in the bed of the stream. Rivers and streams with a stony or rocky bottom provide good oxygen circulation in the water and shelter for organisms. By moving the stones or rocks, we can disturb the organisms and capture them in the net, as shown here:
Place the net on the bottom of the stream, holding the handle vertical and with the water flowing through the net. Hold the net 1 metre behind the kicked zone, Disturb the bed of the stream by vigorously pushing aside the stones with your boot in a square sampling area of approximately 30 x 30 cm extending out from the net opening. Kick back and forth across the direction of water flow for a fixed period of time, say 30 seconds, pushing the stones aside and making a shallow trench in the stream bed. Insects hiding in the stones will be disturbed, carried downstream and caught in the net.
If any rocks are too heavy to be pushed aside using your foot, lift them by hand to enable any insects hiding underneath them to be released and captured. Also wipe the rocks with your hand while in the water so that any insects, snails etc. clinging to them are removed and washed into the net.
Repeat the procedure in several places to obtain a representative sample of what is living in the stream bed. Transfer the insects, etc. that you have caught to a bucket half-filled with water. You can do this most effectively by turning the net inside out and rinsing the mesh in the water by agitating it with a vigorous hand action (as shown below). This rinsing step should free any insects (and any other small objects) attached to the mesh and deposit them in the bucket.
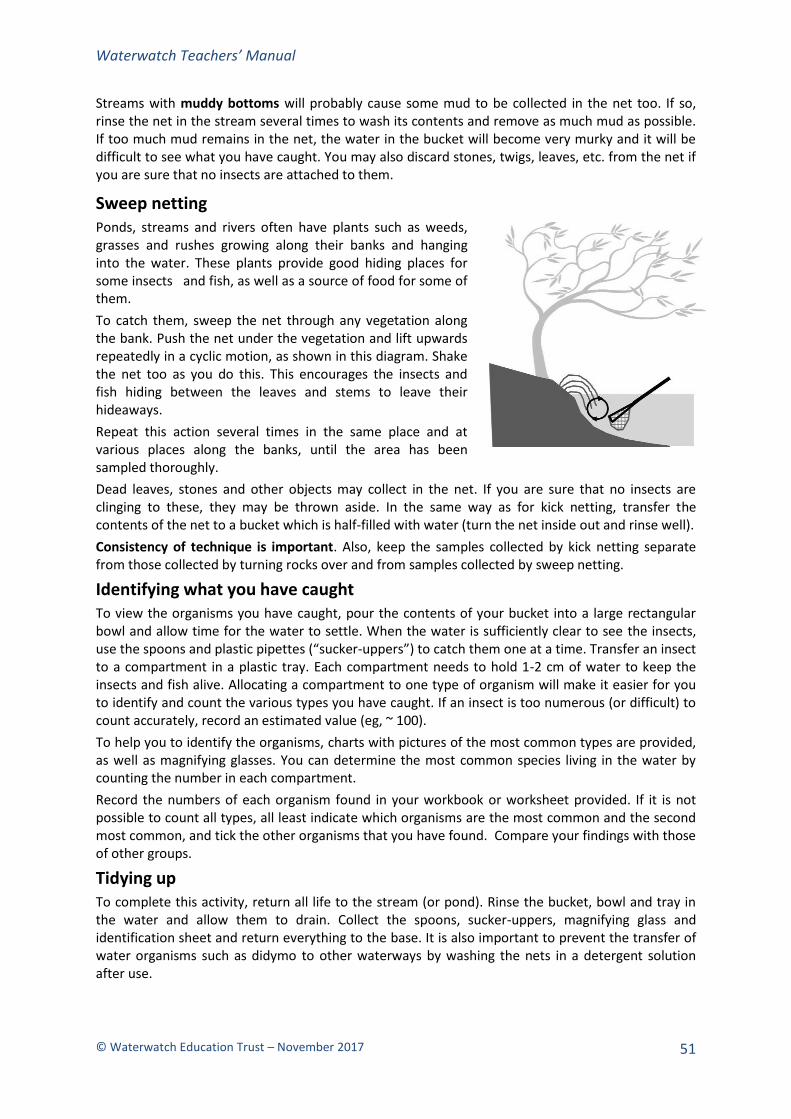
Waterwatch Teachers’ Manual
© Waterwatch Education Trust – November 2017
51
Streams with muddy bottoms will probably cause some mud to be collected in the net too. If so, rinse the net in the stream several times to wash its contents and remove as much mud as possible. If too much mud remains in the net, the water in the bucket will become very murky and it will be difficult to see what you have caught. You may also discard stones, twigs, leaves, etc. from the net if you are sure that no insects are attached to them.
Sweep netting Ponds, streams and rivers often have plants such as weeds, grasses and rushes growing along their banks and hanging into the water. These plants provide good hiding places for some insects and fish, as well as a source of food for some of them.
To catch them, sweep the net through any vegetation along the bank. Push the net under the vegetation and lift upwards repeatedly in a cyclic motion, as shown in this diagram. Shake the net too as you do this. This encourages the insects and fish hiding between the leaves and stems to leave their hideaways.
Repeat this action several times in the same place and at various places along the banks, until the area has been sampled thoroughly.
Dead leaves, stones and other objects may collect in the net. If you are sure that no insects are clinging to these, they may be thrown aside. In the same way as for kick netting, transfer the contents of the net to a bucket which is half-filled with water (turn the net inside out and rinse well).
Consistency of technique is important. Also, keep the samples collected by kick netting separate from those collected by turning rocks over and from samples collected by sweep netting.
Identifying what you have caught To view the organisms you have caught, pour the contents of your bucket into a large rectangular bowl and allow time for the water to settle. When the water is sufficiently clear to see the insects, use the spoons and plastic pipettes (“sucker-uppers”) to catch them one at a time. Transfer an insect to a compartment in a plastic tray. Each compartment needs to hold 1-2 cm of water to keep the insects and fish alive. Allocating a compartment to one type of organism will make it easier for you to identify and count the various types you have caught. If an insect is too numerous (or difficult) to count accurately, record an estimated value (eg, ~ 100).
To help you to identify the organisms, charts with pictures of the most common types are provided, as well as magnifying glasses. You can determine the most common species living in the water by counting the number in each compartment.
Record the numbers of each organism found in your workbook or worksheet provided. If it is not possible to count all types, all least indicate which organisms are the most common and the second most common, and tick the other organisms that you have found. Compare your findings with those of other groups.
Tidying up To complete this activity, return all life to the stream (or pond). Rinse the bucket, bowl and tray in the water and allow them to drain. Collect the spoons, sucker-uppers, magnifying glass and identification sheet and return everything to the base. It is also important to prevent the transfer of water organisms such as didymo to other waterways by washing the nets in a detergent solution after use.

Waterwatch Teachers’ Manual
© Waterwatch Education Trust – November 2017
52
Measuring the oxygen content and conductivity of water using the Hach HQ40d meter
The Hach HQ40d meter provides rapid and accurate measurements of the oxygen content and conductivity of water in situ. The two probes, connected to the meter by cables, can be immersed in a stream or pond to take simultaneous readings of the dissolved oxygen content (mg/L) and conductivity (µS/cm). The probes also measure the water temperature (which is required to calculate the indicated oxygen saturation (%)). The portability of the meter enables measurements to be taken at a various locations at a site, to investigate, eg, the variation of oxygen content with depth, or with width distance from a river bank.
Operating the meter
1. Turn it on by pressing the On/Off button. The meter will start up and take a few
seconds to go through a check procedure.
2. Immerse, and keep the probes in the water.
3. When a measurement is to be taken, press the green Read button.
4. The readings on the display will require some seconds to stabilise – this is indicated by
bars that increase in length as stability is reached.
Information displayed while results are stabilising:
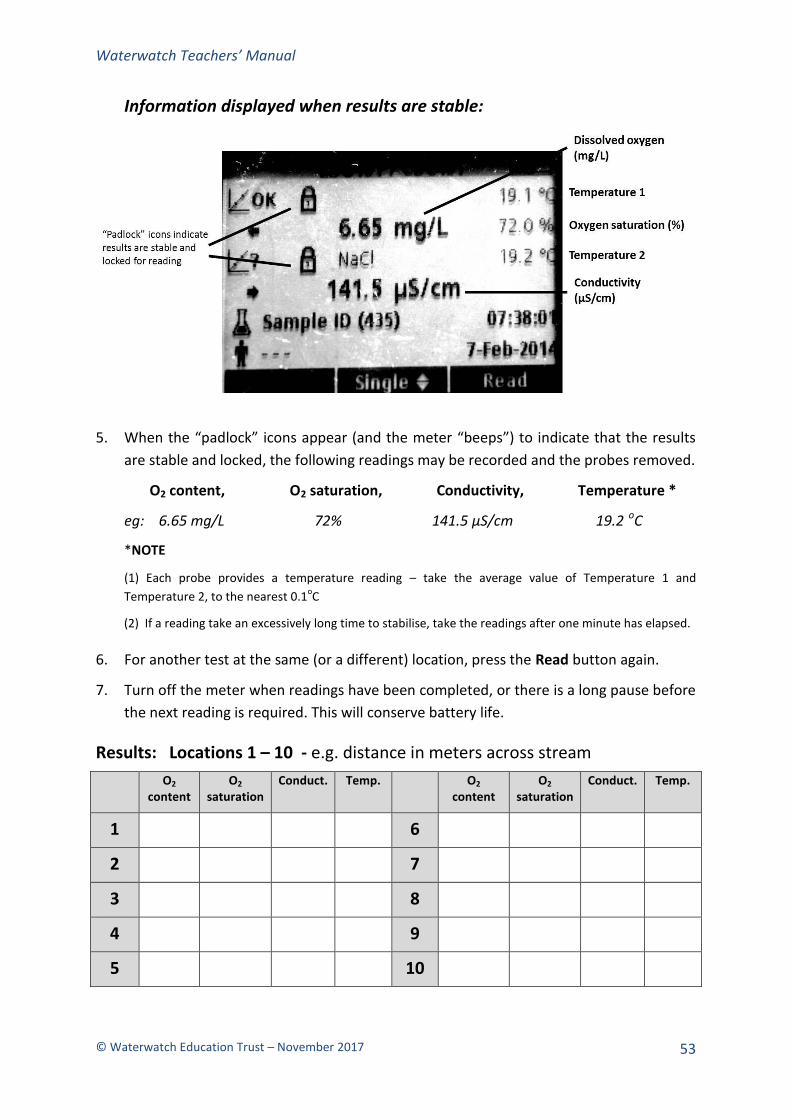
Waterwatch Teachers’ Manual
© Waterwatch Education Trust – November 2017
53
Information displayed when results are stable:
5. When the “padlock” icons appear (and the meter “beeps”) to indicate that the results
are stable and locked, the following readings may be recorded and the probes removed.
O2 content, O2 saturation, Conductivity, Temperature *
eg: 6.65 mg/L 72% 141.5 µS/cm 19.2 oC
*NOTE
(1) Each probe provides a temperature reading – take the average value of Temperature 1 and
Temperature 2, to the nearest 0.1oC
(2) If a reading take an excessively long time to stabilise, take the readings after one minute has elapsed.
6. For another test at the same (or a different) location, press the Read button again.
7. Turn off the meter when readings have been completed, or there is a long pause before
the next reading is required. This will conserve battery life.
Results: Locations 1 – 10 - e.g. distance in meters across stream
O2 content
O2 saturation
Conduct. Temp. O2 content
O2 saturation
Conduct. Temp.
1 6
2 7
3 8
4 9
5 10
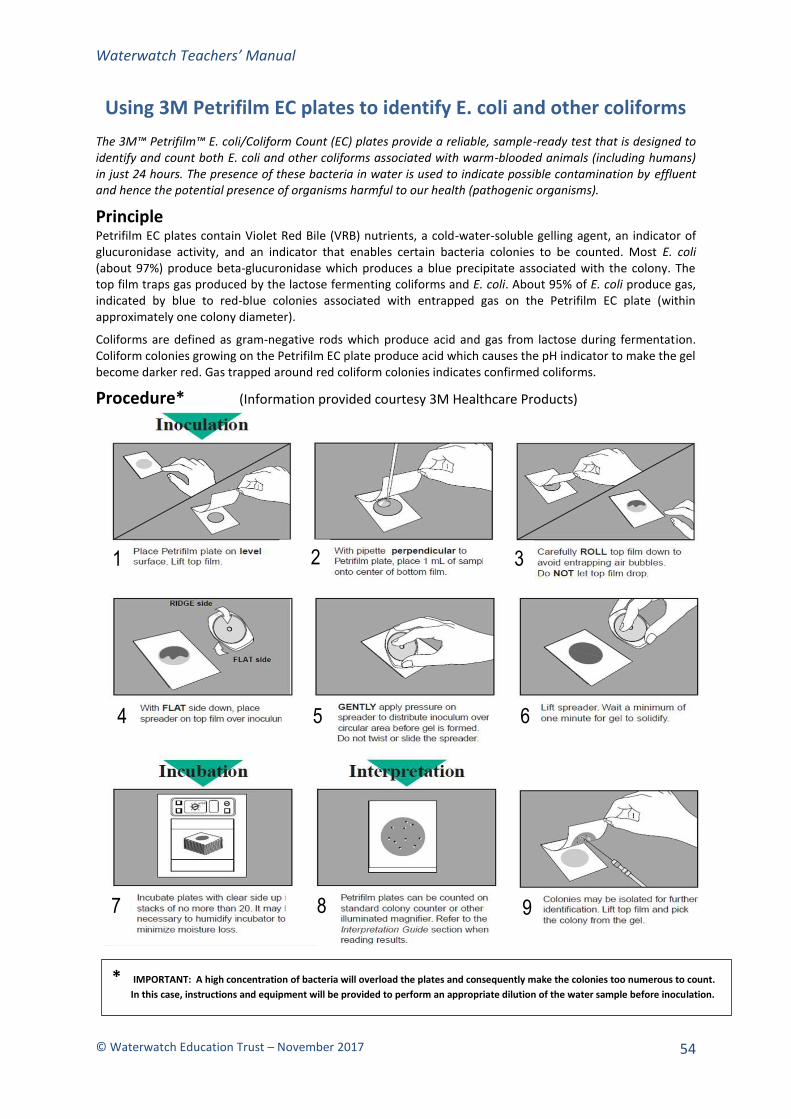
Waterwatch Teachers’ Manual
© Waterwatch Education Trust – November 2017
54
Using 3M Petrifilm EC plates to identify E. coli and other coliforms
The 3M™ Petrifilm™ E. coli/Coliform Count (EC) plates provide a reliable, sample-ready test that is designed to identify and count both E. coli and other coliforms associated with warm-blooded animals (including humans) in just 24 hours. The presence of these bacteria in water is used to indicate possible contamination by effluent and hence the potential presence of organisms harmful to our health (pathogenic organisms).
Principle Petrifilm EC plates contain Violet Red Bile (VRB) nutrients, a cold-water-soluble gelling agent, an indicator of glucuronidase activity, and an indicator that enables certain bacteria colonies to be counted. Most E. coli (about 97%) produce beta-glucuronidase which produces a blue precipitate associated with the colony. The top film traps gas produced by the lactose fermenting coliforms and E. coli. About 95% of E. coli produce gas, indicated by blue to red-blue colonies associated with entrapped gas on the Petrifilm EC plate (within approximately one colony diameter).
Coliforms are defined as gram-negative rods which produce acid and gas from lactose during fermentation. Coliform colonies growing on the Petrifilm EC plate produce acid which causes the pH indicator to make the gel become darker red. Gas trapped around red coliform colonies indicates confirmed coliforms.
Procedure* (Information provided courtesy 3M Healthcare Products)
1 2 3
4 5 6
* IMPORTANT: A high concentration of bacteria will overload the plates and consequently make the colonies too numerous to count.
In this case, instructions and equipment will be provided to perform an appropriate dilution of the water sample before inoculation.
7 8 9

Waterwatch Teachers’ Manual
© Waterwatch Education Trust – November 2017
55
Interpretation Guide
A red indicator dye in the plate colours all colonies red, and a top film traps gas (seen as bubbles) produced by the coliforms. In addition, a glucuronidase indicator forms a blue precipitate around any E. coli colonies that may be present.
No growth = 0 Notice the changes in gel colour in these photos. As the E. coli or coliform count increases, the colour of the gel turns to dark red or purple-blue. Background bubbles are a characteristic of the gel, not a result of E. coli or coliform growth.
E. coli count = 13, Total coliform count = 28 The counting range for the total population on Petrifilm EC plates is 15–150. Do not count colonies that appear on the foam barrier because they are removed from the selective influence of the medium.
E. coli count = 3 Any blue in a colony (blue to red-blue) indicates the presence of E. coli. Front lighting (right) instead of back lighting (left) will enhance the detection of blue precipitate formed by a colony.
E. coli count = 17 Estimated total coliform count = 150 The circular growth area is ~20 cm2. Estimates can be made on plates containing greater than 150 colonies by counting the number of colonies in one or more representative squares and determining the average number per square. Multiply the average number by 20 to determine the estimated count per plate.
Actual count ~ 108 High concentrations of E. coli may cause the growth area to turn purple-blue.
Actual count ~ 106 Petrifilm EC plates with colonies that are too numerous to count have one or more of the following characteristics: many small colonies, many gas bubbles, and a deepening of the gel colour from red to purple-blue. To obtain a more accurate count, dilute the water sample further. (See previous page)
Presumptive E. coli count ~ 8 Estimated total coliform count ~ 108 When high levels of coliforms are present (ie, >10 8), some strains of E. coli may produce less gas and blue colonies may be less definitive. Count all blue colonies without gas and/or blue zones as presumptive E. coli. Pick blue colonies without gas and confirm if necessary.
Total coliform count = 78 Bubble patterns may vary. Gas may disrupt the colony so that the colony “outlines” the bubble. Artifact bubbles may result from improper inoculation or from trapped air within the sample. They are irregularly shaped and are not associated with a colony.

Waterwatch Teachers’ Manual
© Waterwatch Education Trust – November 2017
56
Habitat Assessment
Location: ____________________________________
To assess the habitat of your stream (or pond), walk the length of the monitoring site, being careful not to disturb the site. As you move along, take notice of the state of the habitat on both sides of the stream. The descriptions below will help you assess the quality of the habitat. For each habitat variable circle the rating that best describes your waterway. You will have three ratings circled (one from each row).
Habitat variable 1: Bank stability and erosion
Bank is stable on both sides, no erosion.
Rating: 5
Just a patch of erosion on one bank.
Rating: 4
Some erosion on one bank and a little on the other.
Rating: 3
Some erosion on both banks (<50% of each bank is eroded).
Rating: 2
Much erosion on both banks (>50% of each bank is eroded).
Rating: 1
Habitat variable 2: Stream bed composition and presence of aquatic plants
Stream bed has a mixture of sand, small stones, large stones and rocks with plants growing on bottom.
Rating: 10
Stream bed is mainly sand and small stones with a few large stones and fewer rocks. Some plants growing on bottom.
Rating: 8
Stream bed is mainly sand and small stones with a few large stones. No rocks or plants.
Rating: 6
Stream bed is mainly sand and fine silt with patches of small stones. No rocks or plants.
Rating 4
The stream bed is mainly mud or very fine silt.
Rating: 2
Habitat variable 3: Bank and riparian vegetation
The bank and riparian margin are covered with tall grass and trees with no exposed soil.
Rating: 10
One bank has tall grass and trees; the other bank has short grass with little or no soil.
Rating: 8
Both banks have short grass, or trees with no grass and the soil is exposed.
Rating: 6
One bank has a road along it. The other has short grass. Some soil is exposed.
Rating 4
Soil is exposed on both sides, and one or both sides has a road. Very little vegetation.
Rating: 2
Obtain an overall habitat rating by adding the scores from the three ratings you circled
above. Then assess the habitat quality of your stream (or pond) using the table below.
Overall habitat rating = _____ + _____ + _____ = ______
Overall habitat rating Habitat quality
23 – 25 Very good
18 – 22 Good
13 – 17 Average
8 – 12 Poor
5 – 7 Very Poor
The habitat quality of our stream is: ____________________________


