Milliman Financial Reporting Valuation TEACHERS' PENSION AND ANNUITY FUND OF NEW JERSEY GASB 67 DISCLOSURE Fiscal Year: July 1, 2015 to June 30, 2016 Milliman, Inc. 1550 Liberty Ridge Drive, Suite 200 Wayne, PA 19087 Tel +1 610 687 5644 Fax +1 610 687 4236 milliman.com March 16, 2017
Transcript
Milliman Financial Reporting Valuation
TEACHERS' PENSION AND ANNUITY FUNDOF NEW JERSEY
GASB 67 DISCLOSURE Fiscal Year: July 1, 2015 to June 30, 2016
Milliman, Inc.1550 Liberty Ridge Drive, Suite 200Wayne, PA 19087Tel +1 610 687 5644Fax +1 610 687 4236milliman.com
March 16, 2017
Milliman Financial Reporting Valuation
Certification 1
Executive Summary 3
Overview of GASB 67 and GASB 68 4
Statement of Fiduciary Net Position 5
Statement of Changes in Fiduciary Net Position 6
Money-Weighted Rate of Return 7
Net Pension Liability 8
Changes in Net Pension Liability 9
Long-Term Expected Rate of Return 10
Schedule of Changes in Net Pension Liability and Related Ratios 11
Schedule of Employer Contributions 12
Depletion Date Projection 13
Actuarial Methods and Assumptions Used for Funding Policy 14
Projection of Contributions 15
Projection of Fiduciary Net Position 16
Actuarial Present Value of Projected Benefit Payments 17
Glossary 18
GASB 67 Disclosure for Fiscal Year Ending June 30, 2016
Teachers' Pension and Annuity Fund of New Jersey
Table of Contents
This work product was prepared solely for the State of NJ for the purposes described herein and may not be appropriate to use forother purposes. Milliman does not intend to benefit and assumes no duty or liability to other parties who receive this work. Millimanrecommends that third parties be aided by their own actuary or other qualified professional when reviewing the Milliman work product.
Milliman Financial Reporting Valuation
Certification
GASB 67 Disclosure for Fiscal Year Ending June 30, 2016 Page 1
Teachers' Pension and Annuity Fund of New Jersey
Actuarial computations presented in this report under Statement No. 67 of the Governmental AccountingStandards Board are for purposes of assisting the State of NJ in fulfilling its financial accountingrequirements. No attempt is being made to offer any accounting opinion or advice. This report is for fiscalyear July 1, 2015 to June 30, 2016. The reporting date for determining plan assets and obligations is June30, 2016. The calculations enclosed in this report have been made on a basis consistent with ourunderstanding of the plan provisions. Determinations for purposes other than meeting financial reportingrequirements may be significantly different than the results contained in this report. Accordingly, additionaldeterminations may be needed for other purposes, such as judging benefit security or meeting employerfunding requirements.
This work product was prepared solely for the State of NJ for the purposes described herein and may not be appropriate to use forother purposes. Milliman does not intend to benefit and assumes no duty or liability to other parties who receive this work. Millimanrecommends that third parties be aided by their own actuary or other qualified professional when reviewing the Milliman work product.
We performed a limited review of the census and financial information used directly in our analysis and havefound them to be reasonably consistent and comparable with information used for other purposes. Thevaluation results depend on the integrity of this information. If any of this information is inaccurate orincomplete our results may be different and our calculations may need to be revised.
Future actuarial measurements may differ significantly from the current measurements presented in thisreport due to factors such as, but not limited to, the following: plan experience differing from that anticipatedby the economic or demographic assumptions; changes in economic or demographic assumptions;increases or decreases expected as part of the natural operation of the methodology used for thesemeasurements (such as the end of an amortization period or additional cost or contribution requirementsbased on the plan’s funded status); and changes in plan provisions or applicable law. Due to the limitedscope of the actuarial assignment, we did not perform an analysis of the potential range of such futuremeasurements.
We hereby certify that, to the best of our knowledge, this report, including all costs and liabilities based onactuarial assumptions and methods adopted by the Board or mandated by statute, is complete and accurateand determined in conformance with generally recognized and accepted actuarial principles and practices,which are consistent with the Actuarial Standards of Practice promulgated by the Actuarial Standards Boardand the applicable Guides to Professional Conduct, amplifying Opinions and supporting Recommendationsof the American Academy of Actuaries.
This valuation report is only an estimate of the Plan's financial condition as of a single date. It can neitherpredict the Plan's future condition nor guarantee future financial soundness. Actuarial valuations do notaffect the ultimate cost of Plan benefits, only the timing of Plan contributions. While the valuation is based onan array of individually reasonable assumptions, other assumption sets may also be reasonable andvaluation results based on those assumptions would be different. No one set of assumptions is uniquelycorrect. Determining results using alternative assumptions is outside the scope of our engagement.
In preparing this report, we relied, without audit, on information as of July 1, 2015 as well as asset informationas of June 30, 2016 furnished by the State of NJ. This information includes, but is not limited to, statutoryprovisions, member census data, and financial information. The breakdown as of July 1, 2015 includes140,227 active participants, 13,435 terminated vested and other inactive participants (13,225 non-contributory members are treated as inactive for this purpose), and 98,230 retirees and beneficiaries. Pleasesee Milliman's funding valuation report dated February 18, 2016 for more information on the plan'sparticipants as of July 1, 2015 as well as a summary of the plan provisions and actuarial methods.Furthermore, this report reflects the adoption of the June 30, 2015 Experience Study and a reduction in theinvestment return assumption to 7.65%. Please refer to the Experience Study report dated January 16, 2017for more information on the actuarial assumptions.
Milliman Financial Reporting Valuation
Certification
_______________________________________Scott F. Porter, FSA Richard L. Gordon, FSAConsulting Actuary Consulting Actuary
GASB 67 Disclosure for Fiscal Year Ending June 30, 2016 Page 2
Teachers' Pension and Annuity Fund of New Jersey
This work product was prepared solely for the State of NJ for the purposes described herein and may not be appropriate to use forother purposes. Milliman does not intend to benefit and assumes no duty or liability to other parties who receive this work. Millimanrecommends that third parties be aided by their own actuary or other qualified professional when reviewing the Milliman work product.
On the basis of the foregoing, we hereby certify that, to the best of our knowledge and belief, this report iscomplete and has been prepared in accordance with generally recognized accepted actuarial principles andpractices. We are members of the American Academy of Actuaries and meet the Qualification Standards torender the actuarial opinion contained herein.
Milliman’s work is prepared solely for the use use and benefit of the State of New Jersey Division of Pensionsand Benefits. To the extent that Milliman's work is not subject to disclosure under applicable public recordslaws, Milliman’s work may not be provided to third parties without Milliman’s prior written consent. Millimandoes not intend to benefit or create a legal duty to any third party recipient of its work product. Milliman’sconsent to release its work product to any third party may be conditioned on the third party signing a Release,subject to the following exceptions: (a) the Plan Sponsor may provide a copy of Milliman’s work, in itsentirety, to the Plan Sponsor's professional service advisors who are subject to a duty of confidentiality andwho agree to not use Milliman’s work for any purpose other than to benefit the Fund; and (b) the PlanSponsor may provide a copy of Milliman's work, in its entirety,to other governmental entities, as required bylaw.
No third party recipient of Milliman's work product should rely upon Milliman's work product. Such recipientsshould engage qualified professionals for advice appropriate to their specific needs.
The consultants who worked on this assignment are pension actuaries. Milliman's advice is not intended tobe a substitute for qualified legal or accounting counsel.
The signing actuaries are independent of the plan sponsor. We are not aware of any relationship that wouldimpair the objectivity of our work.
Milliman Financial Reporting Valuation
Executive Summary
GASB 67 Disclosure for Fiscal Year Ending June 30, 2016 Page 3
Teachers' Pension and Annuity Fund of New Jersey
This work product was prepared solely for the State of NJ for the purposes described herein and may not be appropriate to use forother purposes. Milliman does not intend to benefit and assumes no duty or liability to other parties who receive this work. Millimanrecommends that third parties be aided by their own actuary or other qualified professional when reviewing the Milliman work product.
This report presents the results of the actuarial valuation in accordance with GASB 67 as of June 30, 2016for the Teachers' Pension and Annuity Fund. There are several differences in actuarial assumptions andmethods specified by GASB 67 versus those used to determine the statutory contribution in accordance withNew Jersey statute. These differences include treatment of receivable contributions, amortization methods,actuarial cost methods, inclusion of insurance benefits and potentially the discount rate.
The primary assumption in determining the sufficiency of a plan's fiduciary net position relates to expectedState contributions. Beginning with the 2017 fiscal year, 30% of the projected statutory pension contributionswas assumed to be made by the State each year. This assumption represents the percentage of actualState contributions made towards the statutory contribution for the Fiscal Year Ending June 30, 2016 inaccordance with GASB Statement No. 67. To the extent actual contributions are higher (lower) than shown,any date of depletion would be later (sooner) than shown in this report.
Since a date of depletion is determined, the discount rate is much lower than the current 7.65% investmentreturn assumption. After assets are expected to be depleted, projected benefit payments are discountedusing the municipal bond index. The State of New Jersey chose the Bond Buyer GO 20-Bond MunicipalBond Index. The bond index decreased from 3.80% as of June 30, 2015 to 2.85% as of June 30, 2016resulting in a decrease in the single equivalent rate from 4.13% as of July 1, 2015 to 3.22% as of June 30,2016. The combined impact of the decrease in the discount rate and reflection of the 2015 Experience Studyincreased the unfunded liability by approximately $10.8 billion. The unfunded liability, referred to as the NetPension Liability, is $79.0 billion for a funded ratio of 22.3% as of June 30, 2016.
The benefits covered under this valuation include pension benefits and noncontributory group insurancebenefits (NCGI). The depletion date has been determined based on the funding of pension benefits onlywhereas the weighted average discount rate reflects pension and NCGI benefits.
The discount rate is based on the single equivalent rate that results in the same actuarial present value asthe long-term expected rate of return applied to benefit payments, to the extent that the plan's fiduciary netposition is projected to be sufficient to make projected benefit payments, and the municipal bond rate appliedto benefit payments, to the extent that the plan's fiduciary net position is not projected to be sufficient. As ofJune 30, 2016, the plan's fiduciary net position is not projected to be sufficent in year 13 of the projection orby June 30, 2029. The depletion date has increased two years from the prior year GASB 67 valuation.
Milliman Financial Reporting Valuation
Overview of GASB 67 and GASB 68
GASB 67 Disclosure for Fiscal Year Ending June 30, 2016 Page 4
Teachers' Pension and Annuity Fund of New Jersey
This work product was prepared solely for the State of NJ for the purposes described herein and may not be appropriate to use forother purposes. Milliman does not intend to benefit and assumes no duty or liability to other parties who receive this work. Millimanrecommends that third parties be aided by their own actuary or other qualified professional when reviewing the Milliman work product.
The Governmental Accounting Standards Board (GASB) released new accounting standards for publicpension plans and participating employers in 2012. These standards, GASB Statements No. 67 and 68,have substantially revised the accounting requirements previously mandated under GASB Statements No.25 and 27. The most notable change is the distinct separation of funding from financial reporting. TheAnnual Required Contribution (ARC) has been eliminated under GASB 67 and 68 and is no longer relevantfor financial reporting purposes. As a result, plan sponsors have been encouraged to establish a formalfunding policy that is separate from financial reporting calculations.
GASB 67 applies to financial reporting for public pension plans and is required to be implemented for planfiscal years beginning after June 15, 2013. Note that a plan's fiscal year might not be the same as theemployer's fiscal year. Even if the plan does not issue standalone financial statements, but rather isconsidered a pension trust fund of a government, it is subject to GASB 67. Under GASB 67, enhancementsto the financial statement disclosures are required, along with certain required supplementary information.
GASB 68 governs the specifics of accounting for public pension plan obligations for participating employersand is required to be implemented for employer fiscal years beginning after June 15, 2014. GASB 68requires a liability for pension obligations, known as the Net Pension Liability, to be recognized on thebalance sheets of participating employers. Changes in the Net Pension Liability will be immediatelyrecognized as Pension Expense on the income statement or reported as deferred inflows/outflows ofresources depending on the nature of the change.
Milliman Financial Reporting Valuation
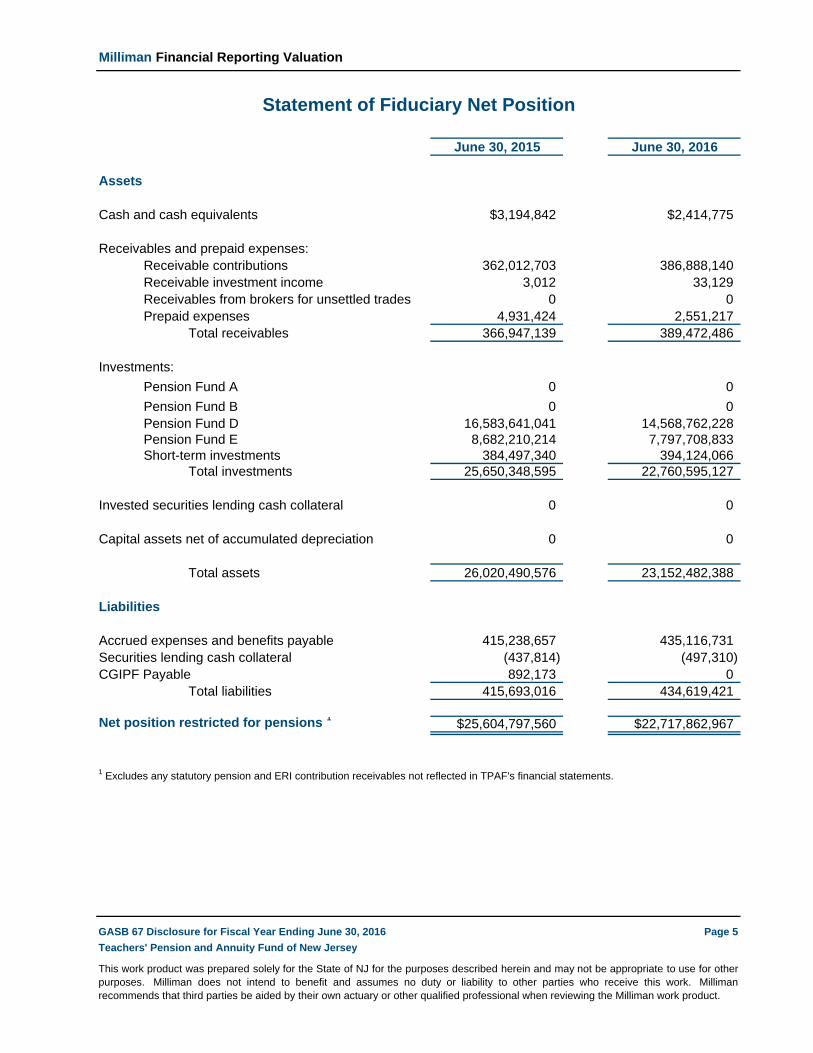
Statement of Fiduciary Net Position
June 30, 2015 June 30, 2016
Assets
Cash and cash equivalents $3,194,842 $2,414,775
Receivables and prepaid expenses:Receivable contributions 362,012,703 386,888,140Receivable investment income 3,012 33,129Receivables from brokers for unsettled trades 0 0Prepaid expenses 4,931,424 2,551,217
Total receivables 366,947,139 389,472,486
Investments:
Pension Fund A 0 0
Pension Fund B 0 0Pension Fund D 16,583,641,041 14,568,762,228Pension Fund E 8,682,210,214 7,797,708,833Short-term investments 384,497,340 394,124,066
Total investments 25,650,348,595 22,760,595,127
Invested securities lending cash collateral 0 0
Capital assets net of accumulated depreciation 0 0
Net position restricted for pensions 1$25,604,797,560 $22,717,862,967
1 Excludes any statutory pension and ERI contribution receivables not reflected in TPAF's financial statements.
GASB 67 Disclosure for Fiscal Year Ending June 30, 2016 Page 5
Teachers' Pension and Annuity Fund of New Jersey
This work product was prepared solely for the State of NJ for the purposes described herein and may not be appropriate to use for otherpurposes. Milliman does not intend to benefit and assumes no duty or liability to other parties who receive this work. Millimanrecommends that third parties be aided by their own actuary or other qualified professional when reviewing the Milliman work product.
Milliman Financial Reporting Valuation
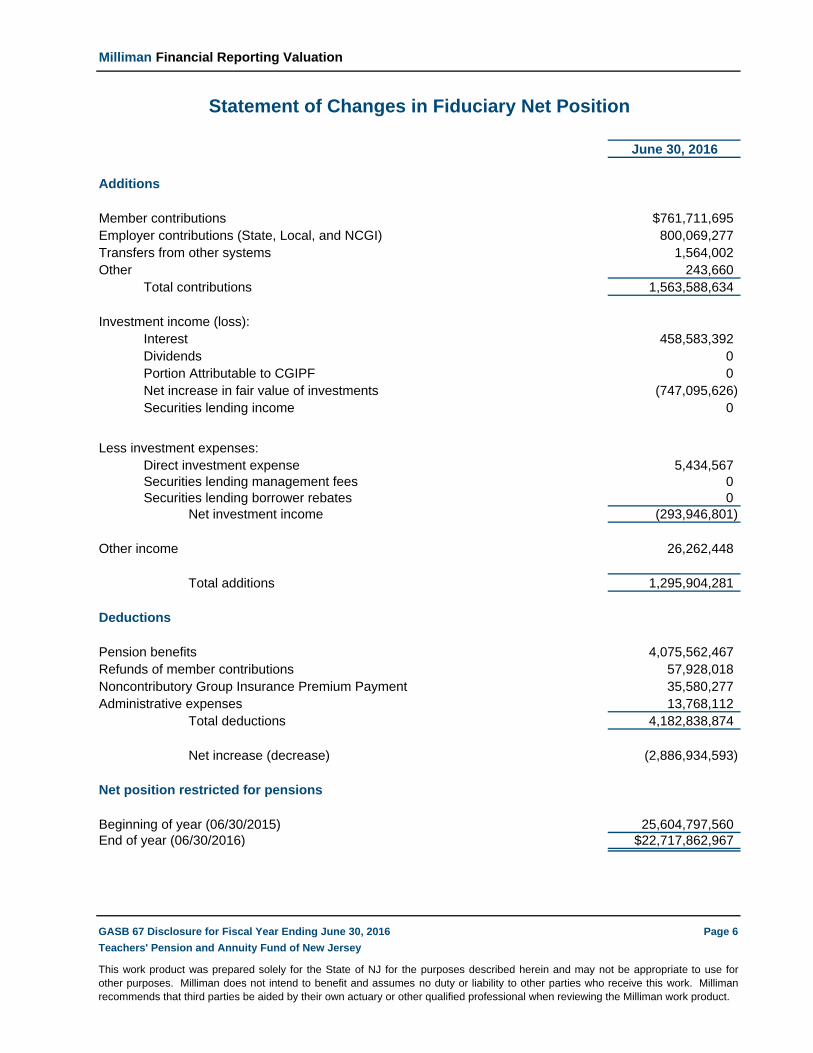
Statement of Changes in Fiduciary Net Position
June 30, 2016
Additions
Member contributions $761,711,695Employer contributions (State, Local, and NCGI) 800,069,277Transfers from other systems 1,564,002Other 243,660
Total contributions 1,563,588,634
Investment income (loss):Interest 458,583,392Dividends 0Portion Attributable to CGIPF 0Net increase in fair value of investments (747,095,626)Securities lending income 0
Pension benefits 4,075,562,467Refunds of member contributions 57,928,018Noncontributory Group Insurance Premium Payment 35,580,277Administrative expenses 13,768,112
Total deductions 4,182,838,874
Net increase (decrease) (2,886,934,593)
Net position restricted for pensions
Beginning of year (06/30/2015) 25,604,797,560End of year (06/30/2016) $22,717,862,967
GASB 67 Disclosure for Fiscal Year Ending June 30, 2016 Page 6
Teachers' Pension and Annuity Fund of New Jersey
This work product was prepared solely for the State of NJ for the purposes described herein and may not be appropriate to use forother purposes. Milliman does not intend to benefit and assumes no duty or liability to other parties who receive this work. Millimanrecommends that third parties be aided by their own actuary or other qualified professional when reviewing the Milliman work product.
Milliman Financial Reporting Valuation
Schedule of Investment Returns
Fiscal Year NetEnding Money-WeightedJune 30 Rate of Return
GASB 67 Disclosure for Fiscal Year Ending June 30, 2016 Page 7
Teachers' Pension and Annuity Fund of New Jersey
This work product was prepared solely for the State of NJ for the purposes described herein and may not be appropriate to use forother purposes. Milliman does not intend to benefit and assumes no duty or liability to other parties who receive this work. Millimanrecommends that third parties be aided by their own actuary or other qualified professional when reviewing the Milliman work product.
The money-weighted rate of return considers the changing amounts actually invested during a period andweights the amount of pension plan investments by the proportion of time they are available to earn a returnduring that period. External cash flows are determined on a monthly basis and are assumed to occur at theend of each month. External cash inflows are netted with external cash outflows, resulting in a net externalcash flow in each month. The money-weighted rate of return is calculated net of investment expenses andhas been determined by the New Jersey Division of Investments.
Milliman Financial Reporting Valuation
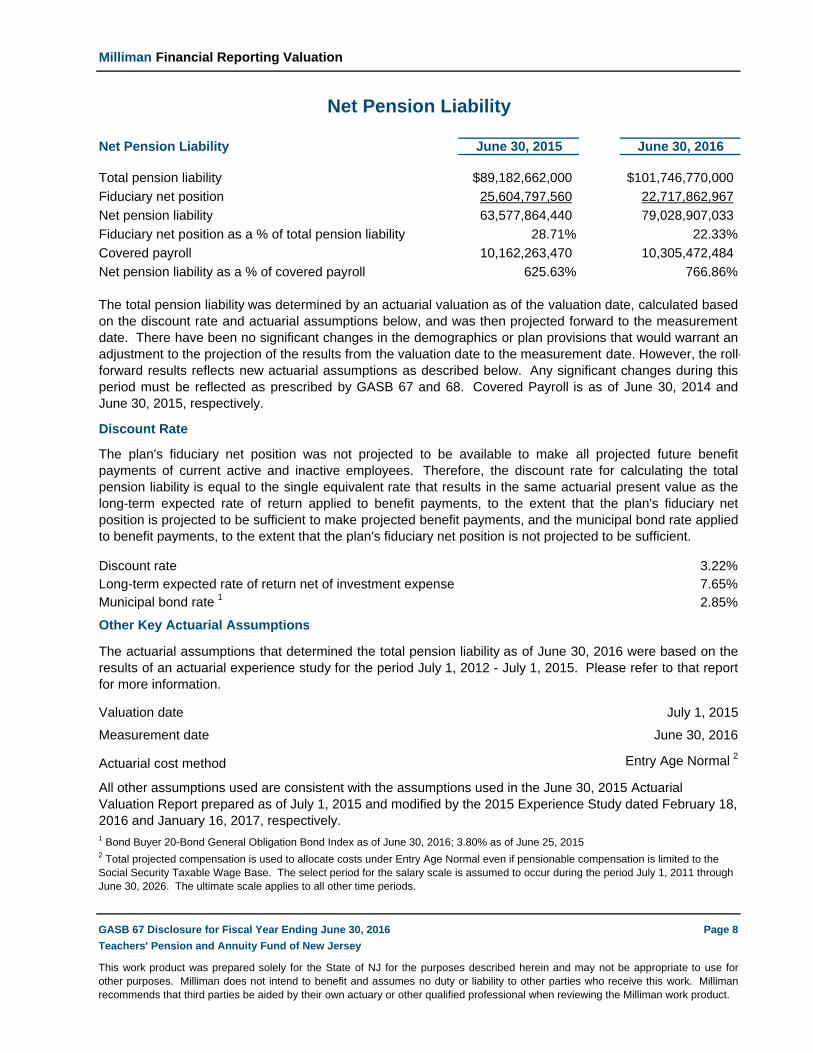
Net Pension Liability
Net Pension Liability June 30, 2015 June 30, 2016
Total pension liability $89,182,662,000 $101,746,770,000
Fiduciary net position 25,604,797,560 22,717,862,967
Net pension liability 63,577,864,440 79,028,907,033
Fiduciary net position as a % of total pension liability 28.71% 22.33%
Covered payroll 10,162,263,470 10,305,472,484
Net pension liability as a % of covered payroll 625.63% 766.86%
Discount Rate
Discount rate 3.22%Long-term expected rate of return net of investment expense 7.65%Municipal bond rate 1 2.85%
Other Key Actuarial Assumptions
Valuation date July 1, 2015
Measurement date June 30, 2016
Actuarial cost method Entry Age Normal 2
1 Bond Buyer 20-Bond General Obligation Bond Index as of June 30, 2016; 3.80% as of June 25, 2015
GASB 67 Disclosure for Fiscal Year Ending June 30, 2016 Page 8
Teachers' Pension and Annuity Fund of New Jersey
The actuarial assumptions that determined the total pension liability as of June 30, 2016 were based on theresults of an actuarial experience study for the period July 1, 2012 - July 1, 2015. Please refer to that reportfor more information.
The plan's fiduciary net position was not projected to be available to make all projected future benefitpayments of current active and inactive employees. Therefore, the discount rate for calculating the totalpension liability is equal to the single equivalent rate that results in the same actuarial present value as thelong-term expected rate of return applied to benefit payments, to the extent that the plan's fiduciary netposition is projected to be sufficient to make projected benefit payments, and the municipal bond rate appliedto benefit payments, to the extent that the plan's fiduciary net position is not projected to be sufficient.
This work product was prepared solely for the State of NJ for the purposes described herein and may not be appropriate to use forother purposes. Milliman does not intend to benefit and assumes no duty or liability to other parties who receive this work. Millimanrecommends that third parties be aided by their own actuary or other qualified professional when reviewing the Milliman work product.
The total pension liability was determined by an actuarial valuation as of the valuation date, calculated basedon the discount rate and actuarial assumptions below, and was then projected forward to the measurementdate. There have been no significant changes in the demographics or plan provisions that would warrant anadjustment to the projection of the results from the valuation date to the measurement date. However, the roll-forward results reflects new actuarial assumptions as described below. Any significant changes during thisperiod must be reflected as prescribed by GASB 67 and 68. Covered Payroll is as of June 30, 2014 andJune 30, 2015, respectively.
2 Total projected compensation is used to allocate costs under Entry Age Normal even if pensionable compensation is limited to the Social Security Taxable Wage Base. The select period for the salary scale is assumed to occur during the period July 1, 2011 through June 30, 2026. The ultimate scale applies to all other time periods.
All other assumptions used are consistent with the assumptions used in the June 30, 2015 Actuarial Valuation Report prepared as of July 1, 2015 and modified by the 2015 Experience Study dated February 18, 2016 and January 16, 2017, respectively.
Milliman Financial Reporting Valuation
Changes in Net Pension Liability
Increase (Decrease)
Total Pension Plan Fiduciary Net Pension
Liability Net Position Liability
Changes in Net Pension Liability (a) 1 (b) (a) - (b)
Balances as of June 30, 2015 $89,182,662,000 $25,604,797,560 $63,577,864,440
Changes for the year:
Service cost $2,344,321,810 2,344,321,810
Interest on total pension liability $3,694,844,118 3,694,844,118
Effect of plan changes $0 0
Effect of economic/demographic (gains) or losses ($134,644,168) (134,644,168)
Effect of assumptions changes or inputs $10,827,093,000 10,827,093,000
Transfers from other Systems $1,564,002 1,564,002 0
Adminstrative expenses (13,768,112) 13,768,112
Member contributions 761,711,695 (761,711,695)
Net investment income (267,684,353) 267,684,353
Employer contributions 800,069,277 (800,069,277)
Other 243,660 (243,660)
Balances as of June 30, 2016 101,746,770,000 22,717,862,967 79,028,907,033
1 Total Pension Liability as of June 30, 2015 is based on a single equivalent discount rate of 4.13%
Sensitivity Analysis
1% Current 1%
Decrease Discount Rate Increase
2.22% 3.22% 4.22%
Total pension liability $117,096,039,000 $101,746,770,000 $89,212,111,000
Fiduciary net position 22,717,862,967 22,717,862,967 22,717,862,967
Net Pension liability 94,378,176,033 79,028,907,033 66,494,248,033
GASB 67 Disclosure for Fiscal Year Ending June 30, 2016 Page 9
Teachers' Pension and Annuity Fund of New Jersey
This work product was prepared solely for the State of NJ for the purposes described herein and may not be appropriate to use forother purposes. Milliman does not intend to benefit and assumes no duty or liability to other parties who receive this work. Millimanrecommends that third parties be aided by their own actuary or other qualified professional when reviewing the Milliman work product.
The following presents the net pension liability of the Teachers' Pension and Annuity Fund of New Jersey,calculated using the discount rate of 3.22%, as well as what the System's net pension liability would be if itwere calculated using a discount rate that is 1 percentage point lower (2.22%) or 1 percentage point higher(4.22%) than the current rate.
Milliman Financial Reporting Valuation
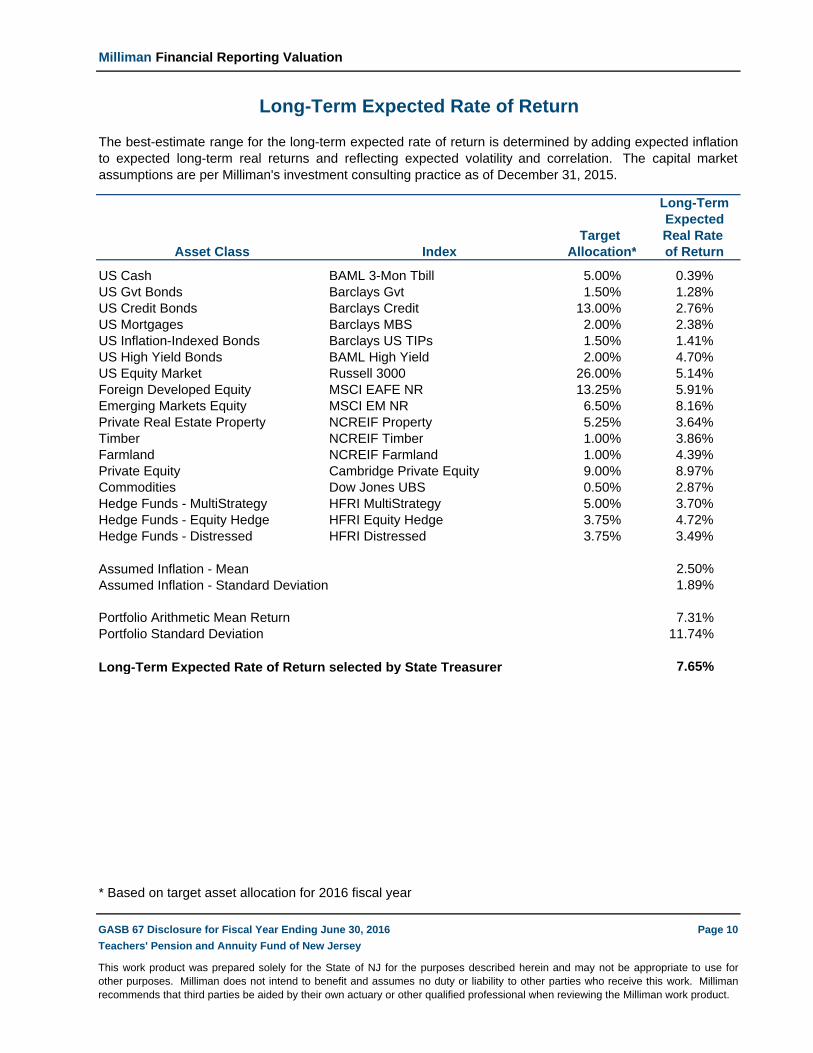
Long-Term Expected Rate of Return
Long-TermExpected
Target Real Rate Asset Class Index Allocation* of Return
US Cash BAML 3-Mon Tbill 5.00% 0.39%US Gvt Bonds Barclays Gvt 1.50% 1.28%US Credit Bonds Barclays Credit 13.00% 2.76%US Mortgages Barclays MBS 2.00% 2.38%US Inflation-Indexed Bonds Barclays US TIPs 1.50% 1.41%US High Yield Bonds BAML High Yield 2.00% 4.70%US Equity Market Russell 3000 26.00% 5.14%Foreign Developed Equity MSCI EAFE NR 13.25% 5.91%Emerging Markets Equity MSCI EM NR 6.50% 8.16%Private Real Estate Property NCREIF Property 5.25% 3.64%Timber NCREIF Timber 1.00% 3.86%Farmland NCREIF Farmland 1.00% 4.39%Private Equity Cambridge Private Equity 9.00% 8.97%Commodities Dow Jones UBS 0.50% 2.87%Hedge Funds - MultiStrategy HFRI MultiStrategy 5.00% 3.70%Hedge Funds - Equity Hedge HFRI Equity Hedge 3.75% 4.72%Hedge Funds - Distressed HFRI Distressed 3.75% 3.49%
Assumed Inflation - Mean 2.50%Assumed Inflation - Standard Deviation 1.89%
Portfolio Arithmetic Mean Return 7.31%Portfolio Standard Deviation 11.74%
Long-Term Expected Rate of Return selected by State Treasurer 7.65%
* Based on target asset allocation for 2016 fiscal year
GASB 67 Disclosure for Fiscal Year Ending June 30, 2016 Page 10
Teachers' Pension and Annuity Fund of New Jersey
The best-estimate range for the long-term expected rate of return is determined by adding expected inflationto expected long-term real returns and reflecting expected volatility and correlation. The capital marketassumptions are per Milliman's investment consulting practice as of December 31, 2015.
This work product was prepared solely for the State of NJ for the purposes described herein and may not be appropriate to use forother purposes. Milliman does not intend to benefit and assumes no duty or liability to other parties who receive this work. Millimanrecommends that third parties be aided by their own actuary or other qualified professional when reviewing the Milliman work product.
Milliman Financial Reporting Valuation
Schedule of Changes in Net Pension Liability and Related Ratios ($ in Millions)
Fiscal Year Ending June 302016 2015 2014 2013 2012 2011 2010 2009 2008 2007
Net pension liability as a % of covered payroll 766.86% 625.63% 536.05% 0.00% 0.00% 0.00% 0.00% 0.00% 0.00% 0.00%
GASB 67 Disclosure for Fiscal Year Ending June 30, 2016 Page 11
Teachers' Pension and Annuity Fund of New Jersey
This work product was prepared solely for the State of NJ for the purposes described herein and may not be appropriate to use for other purposes. Milliman does not intend to benefit and assumes noduty or liability to other parties who receive this work. Milliman recommends that third parties be aided by their own actuary or other qualified professional when reviewing the Milliman work product.
This schedule is presented to illustrate the requirement to show information for 10 years. However, recalculations of prior years are not required, and if prior years are not reported in accordance withthe current GASB standards, they should not be reported.
Milliman Financial Reporting Valuation
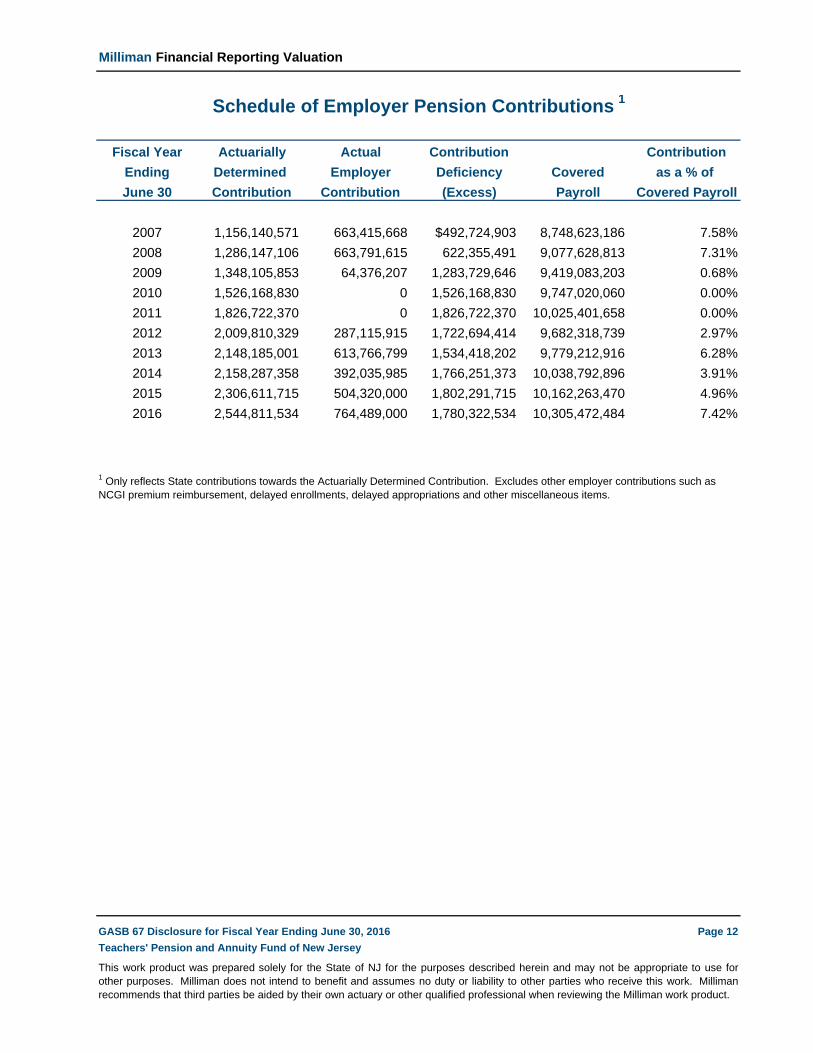
Schedule of Employer Pension Contributions 1
Fiscal Year Actuarially Actual Contribution Contribution
Ending Determined Employer Deficiency Covered as a % of
June 30 Contribution Contribution (Excess) Payroll Covered Payroll
GASB 67 Disclosure for Fiscal Year Ending June 30, 2016 Page 12
Teachers' Pension and Annuity Fund of New Jersey
This work product was prepared solely for the State of NJ for the purposes described herein and may not be appropriate to use forother purposes. Milliman does not intend to benefit and assumes no duty or liability to other parties who receive this work. Millimanrecommends that third parties be aided by their own actuary or other qualified professional when reviewing the Milliman work product.
1 Only reflects State contributions towards the Actuarially Determined Contribution. Excludes other employer contributions such as NCGI premium reimbursement, delayed enrollments, delayed appropriations and other miscellaneous items.
Milliman Financial Reporting Valuation
Depletion Date Projection
-
-
- Benefit payments are projected based on the actuarial assumptions and the current plan provisions.
-
- Terminating and retiring members will not be replaced with new employees.
-
- All cash flows are assumed to occur on average halfway through the year.
- The long-term expected rate of return on pension plan investments is 7.65%.
- The actuarial assumptions do not change.
- The plan provisions do not change.
-
GASB 67 Disclosure for Fiscal Year Ending June 30, 2016 Page 13
Teachers' Pension and Annuity Fund of New Jersey
In order to determine if the plan's fiduciary net position is projected to be sufficient to make projected benefitpayments, we have prepared a depletion date projection using the following techniques and assumptions:
This work product was prepared solely for the State of NJ for the purposes described herein and may not be appropriate to use forother purposes. Milliman does not intend to benefit and assumes no duty or liability to other parties who receive this work. Millimanrecommends that third parties be aided by their own actuary or other qualified professional when reviewing the Milliman work product.
Current active members (non-contributory members are not considered active) contribute the required employee contribution amounts.
Employer contributions are assumed to equal 30% of the State's statutory contribution (see followingpage for details).
Current administrative expenses are assumed to be equal to 0.340% of the expected benefit payments for the fiscal year.
Excludes any liabilities associated with the contributory group life insurance benefits, but includes pay-as-you-go payments for the non-contributory insurance benefits.
Actual results at each point in time will yield different values, reflecting the actual experience of the planmembership and assets.
Members are assumed to receive pay increases, terminate, retire, become disabled, die, and so forthaccording to the actuarial assumptions adopted in the 2015 Experience Study dated January 16,2017.
Milliman Financial Reporting Valuation
Actuarial Methods and Assumptions Used for Funding Policy
Valuation Timing
Actuarial Cost Method
Amortization Method
Asset Valuation Method
Inflation/ SSTWB Inflation 2.3%/ 3.3% until June 30, 2026; 2.6%/ 3.6% thereafter
Salary Increases Varies by years of employment and valuation year
Investment Rate of Return 7.65%
Cost of Living Adjustments None
Mortality
Other Assumptions See June 30, 2015 Experience Study
GASB 67 Disclosure for Fiscal Year Ending June 30, 2016 Page 14
Teachers' Pension and Annuity Fund of New Jersey
Actuarially determined contributions are calculated as of June30, two years prior to the end of the fiscal year in which thecontributions are reported (i.e. June 30, 2014 valuationdetermines June 30, 2016 fiscal year end contributions).
The following actuarial methods and assumptions were used in the July 1, 2015 funding valuation andmodified in the 2015 Experience Study. Please see the valuation report and experience study datedFebruary 18, 2016 and January 16, 2017, respectively for further details.
This work product was prepared solely for the State of NJ for the purposes described herein and may not be appropriate to use forother purposes. Milliman does not intend to benefit and assumes no duty or liability to other parties who receive this work. Millimanrecommends that third parties be aided by their own actuary or other qualified professional when reviewing the Milliman work product.
Level Dollar Amortization: Per NJ Statute, the amortizationperiod is 30 years until the June 30, 2019 valuation at whichtime the period declines by 1 each year until 20 years. Theamortization amount in any future year cannot be lower thenthe amount from the prior year until the plan is fully funded onan actuarial value of assets basis.
Per NJ Statue, 20% of the difference between the expectedActuarial Value and market value is recognized each year indetermining the Actuarial Value of Assets.
Based on experience of TPAF members reflecting mortalityimprovement on a generational basis based on a 60-yearaverage of Social Security data from 1953 to 2013.
Projected Unit Credit, per NJ Statue for pension benefits; Actual claims for noncontributory group insurance benefits are reimbursed monthly.
Fiscal Payroll Payroll Total from Contributions from
Year Current Future Employee Current for Current Future Total
End Employees Employees Payroll Employees Employees Employees* Contributions
2017 $10,322 $0 $10,322 $724 $859 $0 $1,582
2018 10,091 0 10,091 722 943 0 1,665
2019 9,895 0 9,895 725 1,010 0 1,735
2020 9,730 0 9,730 711 1,080 0 1,791
2021 9,514 0 9,514 697 1,163 0 1,860
2022 9,344 0 9,344 686 1,250 0 1,936
2023 9,198 0 9,198 673 1,344 0 2,016
2024 8,982 0 8,982 657 1,442 0 2,099
2025 8,759 0 8,759 642 1,546 0 2,188
2026 8,580 0 8,580 627 1,658 0 2,284
2027 8,331 0 8,331 606 1,777 0 2,383
2028 8,052 0 8,052 588 1,904 0 2,492
2029 7,853 0 7,853 571 2,040 0 2,611
2030 7,573 0 7,573 0 0 0 0
2031 7,233 0 7,233 0 0 0 0
2032 6,933 0 6,933 0 0 0 0
2033 6,580 0 6,580 0 0 0 0
2034 6,191 0 6,191 0 0 0 0
2035 5,839 0 5,839 0 0 0 0
2036 5,461 0 5,461 0 0 0 0
2037 5,072 0 5,072 0 0 0 0
2038 4,719 0 4,719 0 0 0 0
2039 4,370 0 4,370 0 0 0 0
2040 4,019 0 4,019 0 0 0 0
2041 3,705 0 3,705 0 0 0 0
2042 3,401 0 3,401 0 0 0 0
2043 3,055 0 3,055 0 0 0 0
2044 2,774 0 2,774 0 0 0 0
2045 2,403 0 2,403 0 0 0 0
2046 2,032 0 2,032 0 0 0 0
GASB 67 Disclosure for Fiscal Year Ending June 30, 2016 Page 15
Teachers' Pension and Annuity Fund of New Jersey
This work product was prepared solely for the State of NJ for the purposes described herein and may not be appropriate to use forother purposes. Milliman does not intend to benefit and assumes no duty or liability to other parties who receive this work. Millimanrecommends that third parties be aided by their own actuary or other qualified professional when reviewing the Milliman work product.
* Contributions from future employees that are above service cost and, therefore, can be allocated topayment of benefits of current employees under GASB rules.
Milliman Financial Reporting Valuation
Projection of Fiduciary Net Position($ in Millions)
Year Fiduciary Total Benefit Adminstrative Investment Fiduciary
End Net Position Contributions Payments Expenses Earnings Net Position
2017 $22,718 $1,582 $4,246 $14 $1,607 $21,647
2018 21,647 1,665 4,375 15 1,520 20,442
2019 20,442 1,735 4,481 15 1,424 19,104
2020 19,104 1,791 4,588 16 1,317 17,609
2021 17,609 1,860 4,694 16 1,198 15,957
2022 15,957 1,936 4,774 16 1,068 14,171
2023 14,171 2,016 4,862 17 928 12,237
2024 12,237 2,099 4,952 17 776 10,143
2025 10,143 2,188 5,037 17 612 7,890
2026 7,890 2,284 5,120 17 436 5,473
2027 5,473 2,383 5,231 18 246 2,853
2028 2,853 2,492 5,333 18 42 36
2029 36 2,611 5,422 18 0 0
2030 0 0 5,533 0 0 0
2031 0 0 5,648 0 0 0
2032 0 0 5,751 0 0 0
2033 0 0 5,868 0 0 0
2034 0 0 5,978 0 0 0
2035 0 0 6,072 0 0 0
2036 0 0 6,171 0 0 0
2037 0 0 6,256 0 0 0
2038 0 0 6,317 0 0 0
2039 0 0 6,381 0 0 0
2040 0 0 6,427 0 0 0
2041 0 0 6,443 0 0 0
2042 0 0 6,482 0 0 0
2043 0 0 6,495 0 0 0
2044 0 0 6,497 0 0 0
2045 0 0 6,543 0 0 0
2046 0 0 6,536 0 0 0
2047 0 0 6,501 0 0 0
2048 0 0 6,490 0 0 0
2049 0 0 6,448 0 0 0
GASB 67 Disclosure for Fiscal Year Ending June 30, 2016 Page 16
Teachers' Pension and Annuity Fund of New Jersey
This work product was prepared solely for the State of NJ for the purposes described herein and may not be appropriate to use forother purposes. Milliman does not intend to benefit and assumes no duty or liability to other parties who receive this work. Millimanrecommends that third parties be aided by their own actuary or other qualified professional when reviewing the Milliman work product.
Milliman Financial Reporting Valuation
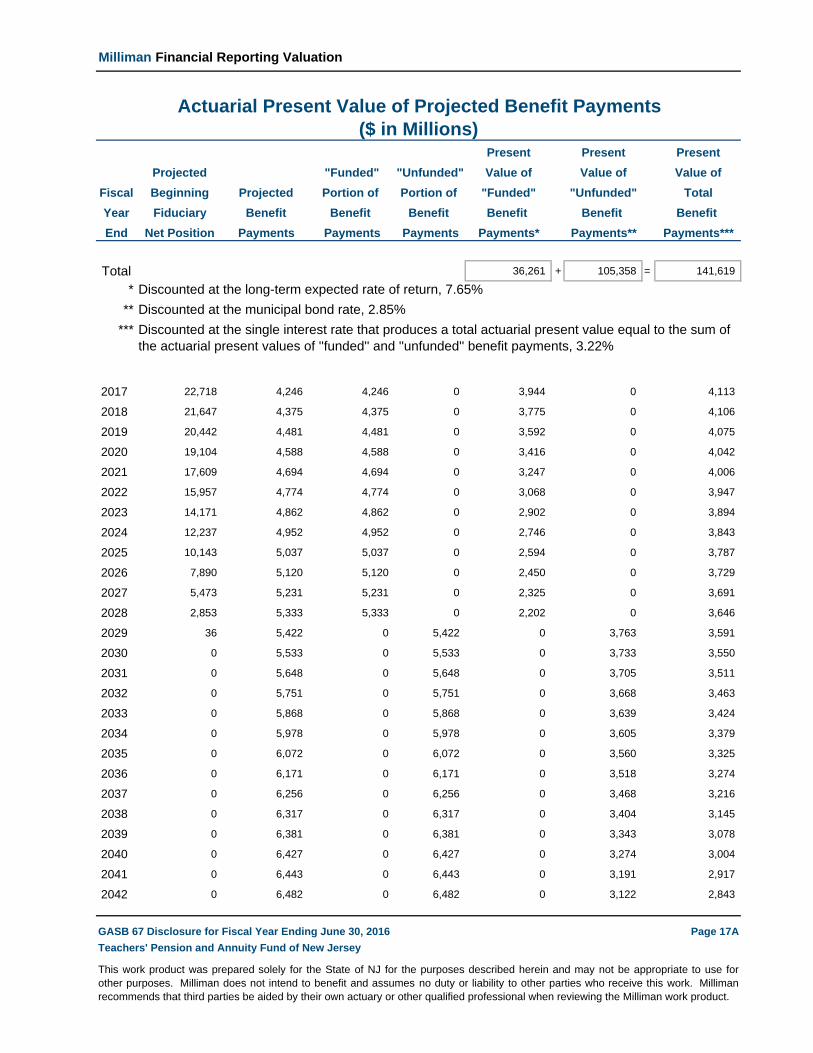
Actuarial Present Value of Projected Benefit Payments($ in Millions)
Present Present Present
Projected "Funded" "Unfunded" Value of Value of Value of
Fiscal Beginning Projected Portion of Portion of "Funded" "Unfunded" Total
Year Fiduciary Benefit Benefit Benefit Benefit Benefit Benefit
End Net Position Payments Payments Payments Payments* Payments** Payments***
Total 36,261 + 105,358 = 141,619
*
**
***
2017 22,718 4,246 4,246 0 3,944 0 4,113
2018 21,647 4,375 4,375 0 3,775 0 4,106
2019 20,442 4,481 4,481 0 3,592 0 4,075
2020 19,104 4,588 4,588 0 3,416 0 4,042
2021 17,609 4,694 4,694 0 3,247 0 4,006
2022 15,957 4,774 4,774 0 3,068 0 3,947
2023 14,171 4,862 4,862 0 2,902 0 3,894
2024 12,237 4,952 4,952 0 2,746 0 3,843
2025 10,143 5,037 5,037 0 2,594 0 3,787
2026 7,890 5,120 5,120 0 2,450 0 3,729
2027 5,473 5,231 5,231 0 2,325 0 3,691
2028 2,853 5,333 5,333 0 2,202 0 3,646
2029 36 5,422 0 5,422 0 3,763 3,591
2030 0 5,533 0 5,533 0 3,733 3,550
2031 0 5,648 0 5,648 0 3,705 3,511
2032 0 5,751 0 5,751 0 3,668 3,463
2033 0 5,868 0 5,868 0 3,639 3,424
2034 0 5,978 0 5,978 0 3,605 3,379
2035 0 6,072 0 6,072 0 3,560 3,325
2036 0 6,171 0 6,171 0 3,518 3,274
2037 0 6,256 0 6,256 0 3,468 3,216
2038 0 6,317 0 6,317 0 3,404 3,145
2039 0 6,381 0 6,381 0 3,343 3,078
2040 0 6,427 0 6,427 0 3,274 3,004
2041 0 6,443 0 6,443 0 3,191 2,917
2042 0 6,482 0 6,482 0 3,122 2,843
GASB 67 Disclosure for Fiscal Year Ending June 30, 2016 Page 17A
Teachers' Pension and Annuity Fund of New Jersey
This work product was prepared solely for the State of NJ for the purposes described herein and may not be appropriate to use forother purposes. Milliman does not intend to benefit and assumes no duty or liability to other parties who receive this work. Millimanrecommends that third parties be aided by their own actuary or other qualified professional when reviewing the Milliman work product.
Discounted at the long-term expected rate of return, 7.65%
Discounted at the municipal bond rate, 2.85%
Discounted at the single interest rate that produces a total actuarial present value equal to the sum of the actuarial present values of ''funded'' and ''unfunded'' benefit payments, 3.22%
Milliman Financial Reporting Valuation
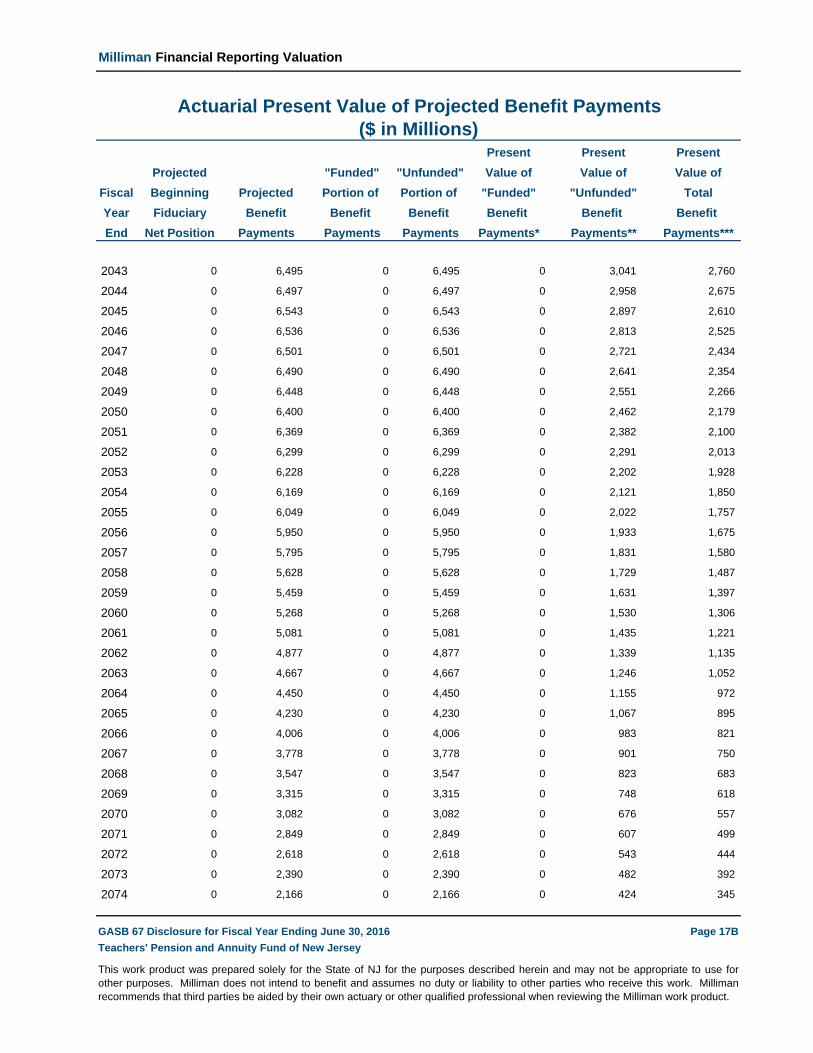
Actuarial Present Value of Projected Benefit Payments($ in Millions)
Present Present Present
Projected "Funded" "Unfunded" Value of Value of Value of
Fiscal Beginning Projected Portion of Portion of "Funded" "Unfunded" Total
Year Fiduciary Benefit Benefit Benefit Benefit Benefit Benefit
End Net Position Payments Payments Payments Payments* Payments** Payments***
2043 0 6,495 0 6,495 0 3,041 2,760
2044 0 6,497 0 6,497 0 2,958 2,675
2045 0 6,543 0 6,543 0 2,897 2,610
2046 0 6,536 0 6,536 0 2,813 2,525
2047 0 6,501 0 6,501 0 2,721 2,434
2048 0 6,490 0 6,490 0 2,641 2,354
2049 0 6,448 0 6,448 0 2,551 2,266
2050 0 6,400 0 6,400 0 2,462 2,179
2051 0 6,369 0 6,369 0 2,382 2,100
2052 0 6,299 0 6,299 0 2,291 2,013
2053 0 6,228 0 6,228 0 2,202 1,928
2054 0 6,169 0 6,169 0 2,121 1,850
2055 0 6,049 0 6,049 0 2,022 1,757
2056 0 5,950 0 5,950 0 1,933 1,675
2057 0 5,795 0 5,795 0 1,831 1,580
2058 0 5,628 0 5,628 0 1,729 1,487
2059 0 5,459 0 5,459 0 1,631 1,397
2060 0 5,268 0 5,268 0 1,530 1,306
2061 0 5,081 0 5,081 0 1,435 1,221
2062 0 4,877 0 4,877 0 1,339 1,135
2063 0 4,667 0 4,667 0 1,246 1,052
2064 0 4,450 0 4,450 0 1,155 972
2065 0 4,230 0 4,230 0 1,067 895
2066 0 4,006 0 4,006 0 983 821
2067 0 3,778 0 3,778 0 901 750
2068 0 3,547 0 3,547 0 823 683
2069 0 3,315 0 3,315 0 748 618
2070 0 3,082 0 3,082 0 676 557
2071 0 2,849 0 2,849 0 607 499
2072 0 2,618 0 2,618 0 543 444
2073 0 2,390 0 2,390 0 482 392
2074 0 2,166 0 2,166 0 424 345
GASB 67 Disclosure for Fiscal Year Ending June 30, 2016 Page 17B
Teachers' Pension and Annuity Fund of New Jersey
This work product was prepared solely for the State of NJ for the purposes described herein and may not be appropriate to use forother purposes. Milliman does not intend to benefit and assumes no duty or liability to other parties who receive this work. Millimanrecommends that third parties be aided by their own actuary or other qualified professional when reviewing the Milliman work product.
Milliman Financial Reporting Valuation
Actuarial Present Value of Projected Benefit Payments($ in Millions)
Present Present Present
Projected "Funded" "Unfunded" Value of Value of Value of
Fiscal Beginning Projected Portion of Portion of "Funded" "Unfunded" Total
Year Fiduciary Benefit Benefit Benefit Benefit Benefit Benefit
End Net Position Payments Payments Payments Payments* Payments** Payments***
2075 0 1,949 0 1,949 0 371 300
2076 0 1,739 0 1,739 0 322 260
2077 0 1,538 0 1,538 0 277 222
2078 0 1,348 0 1,348 0 236 189
2079 0 1,169 0 1,169 0 199 159
2080 0 1,002 0 1,002 0 166 132
2081 0 850 0 850 0 137 108
2082 0 711 0 711 0 111 88
2083 0 587 0 587 0 89 70
2084 0 477 0 477 0 71 55
2085 0 381 0 381 0 55 43
2086 0 300 0 300 0 42 33
2087 0 232 0 232 0 32 24
2088 0 176 0 176 0 23 18
2089 0 131 0 131 0 17 13
2090 0 96 0 96 0 12 9
2091 0 69 0 69 0 8 6
2092 0 48 0 48 0 6 4
2093 0 33 0 33 0 4 3
2094 0 22 0 22 0 2 2
2095 0 15 0 15 0 2 1
2096 0 9 0 9 0 1 1
2097 0 6 0 6 0 1 0
2098 0 4 0 4 0 0 0
2099 0 2 0 2 0 0 0
2100 0 1 0 1 0 0 0
2101 0 1 0 1 0 0 0
2102 0 0 0 0 0 0 0
2103 0 0 0 0 0 0 0
2104 0 0 0 0 0 0 0
2105 0 0 0 0 0 0 0
2106 0 0 0 0 0 0 0
GASB 67 Disclosure for Fiscal Year Ending June 30, 2016 Page 17C
Teachers' Pension and Annuity Fund of New Jersey
This work product was prepared solely for the State of NJ for the purposes described herein and may not be appropriate to use forother purposes. Milliman does not intend to benefit and assumes no duty or liability to other parties who receive this work. Millimanrecommends that third parties be aided by their own actuary or other qualified professional when reviewing the Milliman work product.
Milliman Financial Reporting Valuation
Actuarial Present Value of Projected Benefit Payments($ in Millions)
Present Present Present
Projected "Funded" "Unfunded" Value of Value of Value of
Fiscal Beginning Projected Portion of Portion of "Funded" "Unfunded" Total
Year Fiduciary Benefit Benefit Benefit Benefit Benefit Benefit
End Net Position Payments Payments Payments Payments* Payments** Payments***
2107 0 0 0 0 0 0 0
2108 0 0 0 0 0 0 0
2109 0 0 0 0 0 0 0
2110 0 0 0 0 0 0 0
2111 0 0 0 0 0 0 0
2112 0 0 0 0 0 0 0
2113 0 0 0 0 0 0 0
2114 0 0 0 0 0 0 0
2115 0 0 0 0 0 0 0
GASB 67 Disclosure for Fiscal Year Ending June 30, 2016 Page 17D
Teachers' Pension and Annuity Fund of New Jersey
This work product was prepared solely for the State of NJ for the purposes described herein and may not be appropriate to use forother purposes. Milliman does not intend to benefit and assumes no duty or liability to other parties who receive this work. Millimanrecommends that third parties be aided by their own actuary or other qualified professional when reviewing the Milliman work product.
Milliman Financial Reporting Valuation
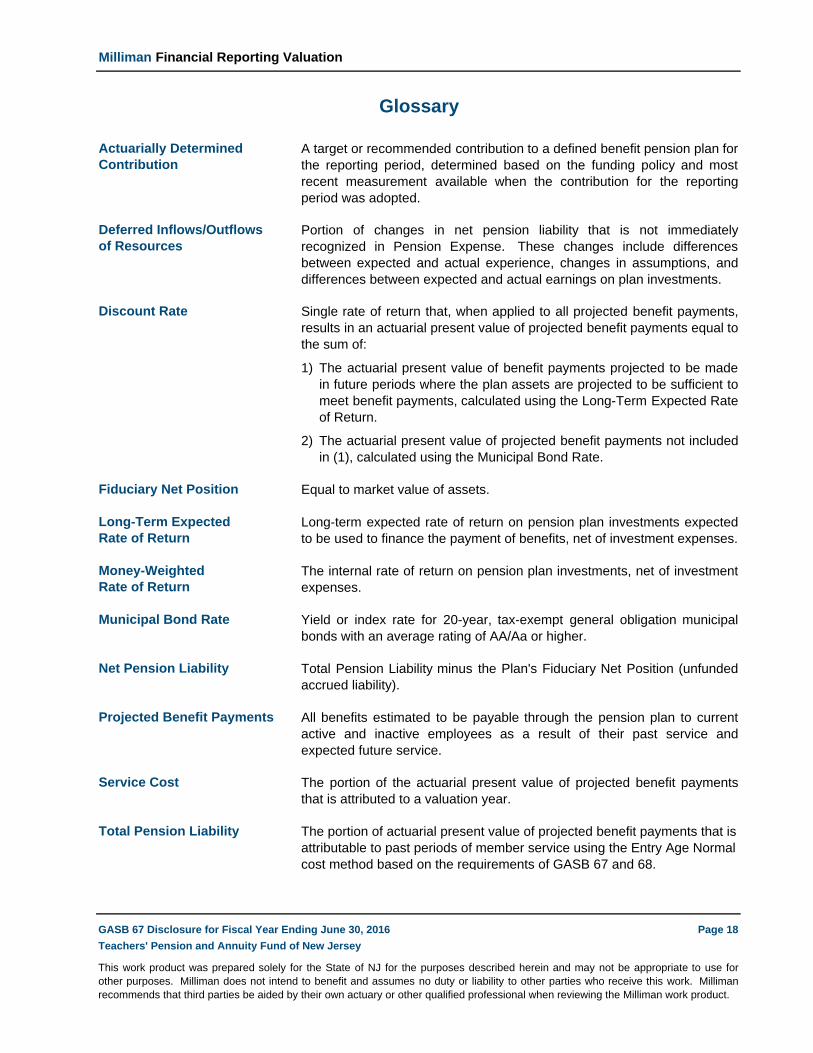
Glossary
Actuarially Determined Contribution
Deferred Inflows/Outflows of Resources
Discount Rate
1)
2)
Fiduciary Net Position
Long-Term Expected Rate of Return
Money-Weighted Rate of Return
Municipal Bond Rate
Net Pension Liability
Projected Benefit Payments
Service Cost
Total Pension Liability
GASB 67 Disclosure for Fiscal Year Ending June 30, 2016 Page 18
Teachers' Pension and Annuity Fund of New Jersey
A target or recommended contribution to a defined benefit pension plan forthe reporting period, determined based on the funding policy and mostrecent measurement available when the contribution for the reportingperiod was adopted.
Total Pension Liability minus the Plan's Fiduciary Net Position (unfundedaccrued liability).
Equal to market value of assets.
This work product was prepared solely for the State of NJ for the purposes described herein and may not be appropriate to use forother purposes. Milliman does not intend to benefit and assumes no duty or liability to other parties who receive this work. Millimanrecommends that third parties be aided by their own actuary or other qualified professional when reviewing the Milliman work product.
Single rate of return that, when applied to all projected benefit payments,results in an actuarial present value of projected benefit payments equal tothe sum of:
Long-term expected rate of return on pension plan investments expectedto be used to finance the payment of benefits, net of investment expenses.
Portion of changes in net pension liability that is not immediatelyrecognized in Pension Expense. These changes include differencesbetween expected and actual experience, changes in assumptions, anddifferences between expected and actual earnings on plan investments.
The internal rate of return on pension plan investments, net of investmentexpenses.
All benefits estimated to be payable through the pension plan to currentactive and inactive employees as a result of their past service andexpected future service.
The portion of the actuarial present value of projected benefit paymentsthat is attributed to a valuation year.
Yield or index rate for 20-year, tax-exempt general obligation municipalbonds with an average rating of AA/Aa or higher.
The actuarial present value of projected benefit payments not includedin (1), calculated using the Municipal Bond Rate.
The actuarial present value of benefit payments projected to be madein future periods where the plan assets are projected to be sufficient tomeet benefit payments, calculated using the Long-Term Expected Rateof Return.
The portion of actuarial present value of projected benefit payments that is attributable to past periods of member service using the Entry Age Normal cost method based on the requirements of GASB 67 and 68.