1 Teaching and Learning Function Transformations Research paper for Masters Degree Submitted to Professor Patrick Thompson Arizona State University Tempe, AZ By Hsinyi Huang Smith Summer 2009
Transcript
1
Teaching and Learning Function Transformations
Research paper for Masters Degree
Submitted to Professor Patrick Thompson
Arizona State University
Tempe, AZ
By
Hsinyi Huang Smith
Summer 2009
2
Introduction
The mathematics topic of function transformation is an important concept for students to
learn. Learning function transformations not only can help our students better understand each
function’s behavior and function relationships, but can also aid them in learning more difficult
mathematical concepts which are related to these earlier concepts in college. Studies have
revealed that learning the function concept is complex, with many high performing
undergraduates (e.g., students receiving a course grade of A in Calculus) possessing weak
function understandings (Breidenbach, Dubinsky, Hawks, & Nichols, 1992; Carlson, 1998;
Thompson, 1994as cited in Oerhtman et al., 2008). Furthermore, through my past experiences,
function transformation is seldom taught as an entire unit to be introduced to students and is most
likely an additional section after the introduction of a specific function. The observation and
research of how teachers approach and introduce these concepts to their students are very
different, and the results of our students’ learning levels also differ greatly. I think it is a good
opportunity to reorganize the lesson sequence and find a way that can help our students to
successfully learn this crucial concept.
Every mathematical function has its own library of family function graphs on a
rectangular coordinate system. Historically, transformation of graphs of functions has been a
major component of many levels of algebra as well as of more advanced courses in mathematics
(Ninness C., Barnes-Holmes D. 2006). However, student understanding of the function
concepts is very limited. Most of the time, I have found that many of our students can solve
mathematical problems by following the steps their teachers taught them to do. In addition, they
use their graphing calculators to find their answers before critically thinking about what has been
asked and do not have a solid understanding of why they are doing it and what those steps mean.
3
I frequently even hear mathematics majors speak of a graph as “stretching” or “getting skinnier”
or “being squished” without any thought being given to the underlying dynamics of functional
relationship (Thompson, 1994). When teaching transformation at the high school level, it is
important to direct students away from thinking of graphs as objects and toward thinking of
function relationships. Also, by asking our students to speak with meaning, rather than using
language such as “stretching” ”narrower” “wider” or “being compressed”, they will be using
covariational reasoning to better understand the relationship between input values and output
values.
Function relationship is never an easy topic to learn for most of the students. Students
are often asked to perform computations of algebraic functions and find solution(s) for some
given function(s). While teachers teach these concepts in the classroom, they usually emphasize
the procedures and fall short of developing student deeper understanding of the concept,
therefore, the foundation of understanding function concepts of students is very weak. On the
other hand, most of the math teachers who teach this concept, function transformation, require
students to memorize certain rules and incorporate them into the questions that teachers give to
them. Students who think about functions only in terms of symbolic manipulations and
procedural techniques are unable to comprehend a more general mapping of a set of input values
to a set of output values; they also lack the conceptual structures for modeling function
relationships in which the function value (output variable) changes continuously in tandem with
continuous changes in the input variable (Carlson, 1998; Monk & Nemirovsky, 1994; Thompson,
1994, as cited in Oerhtman et al., 2008). We want our students to be able to reason how each
change of input values can map to a new set of output values and using the covariational idea to
4
help understand better what functions are. As math teachers, we have the responsibility to
design lessons which can guide our students to learn in a conceptual and meaningful way.
The outline of the function transformation intervention plan is based on the three ideas of
six themes that Dr. Pat Thompson selected and discussed in his paper. I selected these six
themes because of their emergence in the literature as constructs around which a stable
consensus seems to have developed regarding their importance for students’ understanding of
function (Thompson, 1994). According to Dr. Thompson, these themes are related very closely
and are useful in organizing the issues of student learning and will be helpful for teachers
teaching the concept of function transformation. The three themes that I have chosen to focus
on while teaching this concept are as follows:
1. Function as covariation of quantities and function as correspondence
2. Function as action, as process, and as object
3. Operations on numbers and operations on functions
The purpose of this project is to show how the lessons are designed and how they can improve
and deepen student understanding of the concept. I planned to implement this project into two
of my high school junior level math classes. In class, they were asked to use covariation as an
idea to reason and predict how a new function is transformed from its parent function. Also, I
used the Geometer’s Sketchpad computer program to enhance and support student learning and
predictions.
Theoretical Framework
The major goal of this transformation unit is to direct students to use the idea of
covariation to reason about function transformations. By employing covariational reasoning
5
( e.g., coordinating an image of two varying quantities and attending to how they change in
relation to each other), the student is able to transform the image and reason about values of
various parameters as the configuration changes (Oehrtman, 2008). Even so, it is not easy for
students to reason using the idea of covariation. Understanding functions in terms of input and
output can be a major challenge for many students. As one example, 43% of A – students at the
completion of College Algebra attempted to find f(x + a) by adding a onto the end of the
expression for f rather than substituting x + a into the function (Carlson, 1998, as cited in
Oehrtman, 2008).
While most students learn functions, they are either trying to memorize rules or solve
equations procedurally without a clear understanding of the meaning of what they are doing or
trying to find. Students often view functions simply as two expressions separated by an equal
sign (Thompson, 1994b as cited in Oehrtman, 2008). Such an impoverished understanding of
function is insufficient to serve as a base for a rich understanding of more advanced mathematics
(Oehrtman, 2008). For example, in a traditional lesson students were given the following rule:
To graph y – k = f(x – h) start with the graph of y = f(x) and shift it horizontally h units and vertically k units. The vector (h, k) is called the translation vector.
By following this rule, students will be given an example such as,
Graph y = 5 +
The sample response in the textbook is to ask students to change the equation by subtracting 5
from both sides, so that the function is in the form:
y – k = f (x – h)
y - 5 =
y – 5 =
6
Students will conclude that h = -2 and k = 5. Therefore, the graph is shifted 2 units left (because
the h = -2) and 5 units up (because the k = 5). In the sample answer, neither has discussion on
what the parent function is that the translation is based on or how input and output are varying
after we added 5 or added 2 to the parent function. Instead, it requires students to memorize the
given rule and apply it to different functions and get the correct answer. Later on, the book used
more rules to define how functions transformed such as stretches or reflections. Instead of trying
to help students understand the concept conceptually, the textbook is assessing how well students
can memorize the rules and apply them to different functions.
We recommend that school curricula and instruction include a greater focus on
understanding ideas of covariation and multiple representations of covariation (e.g. using
different coordinate systems), and that more opportunities be provided for students to experience
diverse functions types emphasizing multiple representations of the same functions. College
curricula could then build on this foundation. (Oehrtman, 2008) A better approach to the
concept is teaching our students to reason by using the idea of covariation. Students must
develop an understanding of functions as general processes that accept input and produce output
(Oehrtman, 2008). Instead of thinking of the graph of a function as a picture (shape thinking),
students need to understand the behavior of a function which means knowing how input and
output values are related to each other. Also, they need to know that functions can be
represented in multiple ways such as expressions, tables or graphs. Most students are thinking of
the graph of a function as a picture of a physical situation rather than as a mapping from a set of
input values to a set of output values.
After students can fundamentally do the mapping between the input and output values in
their minds and understand how operating a number can affect a function by using the
7
covariational reasoning, then they are ready for teachers to prepare them for the next step, which
is to see a function as an object. At the point where students have solidified a process conception
of function so that a representation of the process is sufficient to support their reasoning about it,
they can begin to reason formally about functions – they can reason about functions as if they
were objects. . . Primary among these is an image of functional process as defining a
correspondence between two sets: a set of possible inputs to the process and a set of possible
outputs from the process. (Thompson, 1994) Because of the covariation, students can recognize
that if one of the function’s solutions is translated or becomes a higher or a lower value, then all
the other solutions will also have the same changes and that can cause the transformation of the
graph.
Good conceptual learning can guide students through a deeper understanding of the
concept and how teachers’ instruction can lead to the inspiration of their students. If we
incorporate our students’ prior knowledge while we teach a new concept, we can make it easier
for our students to learn the new concept. For example, while teaching this unit, the teacher
asked students to think about “Order of Operations” while trying to reason and give explanation
of a given function. It can give students good ideas and guide them through their own reasoning
on how multiplying, dividing, adding, or subtracting a number can change the behavior of the
function or affect the covariation between input values and output values. The process of
conception of function described by Dubinsky and his colleagues emphasizes arithmetic
operations as operations on numbers, so that, for example f(x) = + 3x is the function
determined by evaluating the sum of a number squared and three times the number. . . A
common exercise in secondary school algebra is to show that the graphs of any function in this
family are translations of the graph of another. (Thompson, 1994)
8
In class, students were given an equation such as f(x) = 4 - 5, and they were asked
to reason about how this function transformed from its parent function of g(x) = by using
covariational reasoning. At the same time, the teacher would encourage students using the
concept of order of operations to determine an easier order of how the numbers 4, 2, and 5 affect
the transformation of the new function from its parent function. This means that students will
have to evaluate the equation by thinking, before the number is squared, it has to be subtracted
by two, then after squaring, be multiplied by four, and at last, subtracted by five. While students
wrote their explanations, they were asked to write their answers with meaning. What does that
mean if we subtract 2, multiply by 4 and then subtract by 5? The teacher will expect students to
express their answers such as, “For every input value, it increases by two units and for every
output value; it becomes four times larger and decreases by five units compared to its parent
function.”
For many students, horizontal transformations run contrary to expectation, and many
students have difficulty learning to identify graphed representations of such transformations
when displayed individually or in multiple combinations of horizontal and vertical shifts.
However, our previous investigations have demonstrated that training students to factor via
matching-to-sample procedures allowed them to learn horizontal shifts more efficiently and to
derive more complex transformations for a much wider range of formulas and graphed analogues
(Ninness et al. 2006). Based on this suggestion, the teacher chose to use the factored form to
teach the function transformation unit to enhance students’ understanding of the concept.
To reason formally about functions seems to entail a scheme of conceptual operations
which grow from a great deal of reflection on functional processes. Primary among these is an
image of functional process as defining a correspondence between two sets: a set of possible
9
inputs to the process and a set of possible outputs from the process (Thompson, 1994). A mature
function understanding that is revealed by students using functions fluidly, flexibly, and
powerfully is typically associated with strong conceptual underpinnings. Promoting this
conceptual structure in students’ understanding may be achieved through both curriculum and
instruction including tasks, prompts, and projects that promote and assess the development of
this “way of thinking” in students (Oehrtman, 2008). Students need to learn new concepts
through the conceptual approach to teaching in order to benefit them in the long run.
Method
The purpose of this project is to try to focus on training students to use the idea of
covariation to reason about how functions transform. For this purpose, I know I needed to
modify the way I was teaching and committed my students to a conceptual type of learning in
order to guide them through deeper understanding of the concept. In this chapter, students had
opportunities to experience different types of functions such as quadratic, cubic, absolute value,
radical, exponential, and logarithmic to reason about how functions transform. Also, the
software “Geometer’s Sketchpad” was used in lessons to better students visual on graphs.
By using the software, it would be easier to ask students to focus on reasoning instead of
drawing. Proponents of the incorporation of technology into the algebra curriculum frequently
cite the following benefits to be derived from the use of calculators and computers: a) their
power to support and enhance rich problem-solving environments; b) a decrease in the amount of
time required for skill development, thus allowing for more concentration on conceptual
understanding; c) the graphical advantages of computing utilities; and d) the potential for deeper
student understanding of algebraic ideas (O’Callaghan, 1998). In lessons, students will be asked
10
to focus on the relationship between graphs and tabular values and the relationship between
graphs and algebraic representations. We believe that the emphasis on visualization, besides
restoring the historic emphasis on visual aspects in the study of transformations, allows students
to easily move into the algebra and have some visual meaning for the algebra developed (Borba,
1993).
During the lessons, the teacher served as a guide and facilitator for discussion, provided
feedback to students’ questions, and encouraged reflections on deeper thinking. The activities in
lessons usually required the students to give inputs and predictions; then we used the computer
tool (Geometer’s Sketchpad) to help students visualize and discuss whether their prediction is
correct or not. The purpose is to help students discover important ideas themselves and
relationships among those ideas in algebra through class discussions and their personal
reflections.
The students in my classroom have already completed at least 2 years of high school
mathematics and have demonstrated a great level of interest in math education. These students
have a basic understanding of all six functions that we used and know what function notation is.
The unit is designed for students at that level. There are three parts to the lessons (translation,
stretch, and reflection) and each part will separate into two different sessions (equation to graph
and vice versa) in this unit.
In the unit, the teacher would use questions to guide students using ideas of covariation to
reason function transformations. In the first section of each part of the lessons, students were
required to draw a graph for a given function, and they were asked not to use a graphing
calculator. The following question is one of the examples that we used in class:
11
Please graph the function and its parent function. Describe how they are related. If needed you can use a table!
First, students needed to know how to use the correct function notation to define the new
function. If f(x) represents the parent function, then f(x-2) + 3 or g(x) can represent the new
function. Then the teacher would have discussion with students to come up with two tables, one
for the parent function and the second one is for the new function. This assisted students in
comparing the tables’ values to tell which value is affected. The teacher could also use the
following sample questions to guide her students:
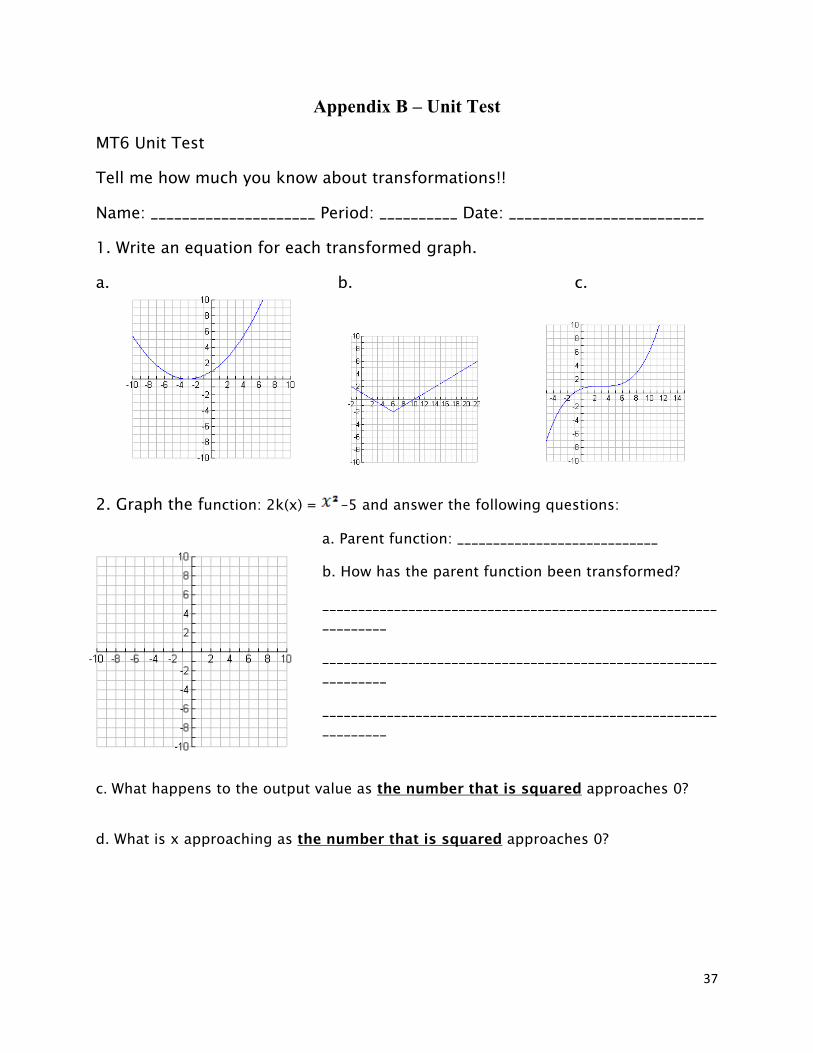
Question 1: What is the parent function that we are trying to compare this function to?
Question 2: What happens to the output value as the number that is squared approaches 0?
Question 3: What is x approaching as the number that is squared approaches 0?
Question 4: Has a single x/ y value been affected or have all the x / y values been affected?
Question 5: How has the x value been affected? How has the output value been affected?
Question 6: What will this say about your graphs?
Through the discussion, students were able to compare the parent function f(x) and the
new function f(x -2) + 3 or g(x). They noticed that:
1. These are quadratic functions and there must be a turning point where the graph
changes from decreasing to increasing or vice versa (in school, we call this point the
vertex) on the graph.
2. Students can use the point, or vertex, to determine how the new function transformed
from its parent function or they can pick at least three more points to compare and see
if all the points would be transformed in the same way. At the beginning of the unit
12
lesson, the teacher usually made tables and picked at least 5 points for both functions
and have students compare the tabular values.
3. Students can recognize that in order to have a same output, the input value has to
decrease by two units and for every y value it increased by five units.
Based on the students’ predications, the teacher then asked the students to come to the
board and draw their graphs. After students came up to the board, then the teacher used the
computer tool (Geometer’s Sketchpad) to show the correct graph in order to compare with
students’ answers that are on the board and have a discussion to clarify students’ questions.
In the second section of each part of the lessons, students were required to give an
equation to define a given graph. For example, the teacher would give the following directions:
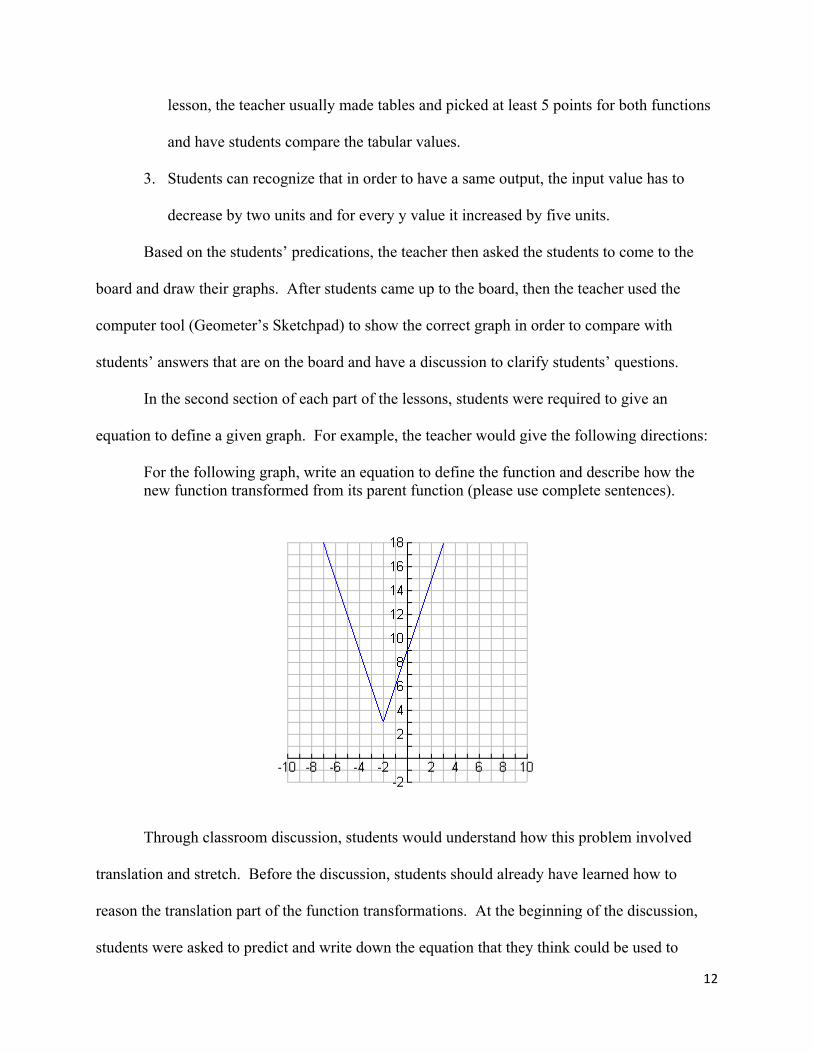
For the following graph, write an equation to define the function and describe how the new function transformed from its parent function (please use complete sentences).
Through classroom discussion, students would understand how this problem involved
translation and stretch. Before the discussion, students should already have learned how to
reason the translation part of the function transformations. At the beginning of the discussion,
students were asked to predict and write down the equation that they think could be used to
13
define the given graph. Then the teacher gave or used the following sample questions to guide
students through their reasoning:
Question 1: What is the parent function? How do the output values vary in relation to the input value in the parent function?
Question 2: Is the new function behaving the same as the parent function? How do the output values vary in relation to the input value in the new function?
Question 3: What is x approaching as the output value approaches 3?
Question 4: How have your vertex and other two key points changed their positions? (Pick three key points from the first graph and compare.)
Question 5: What will this say about your equation? Write an equation to define the function.
Through the discussion, students were able to recognize that these are absolute value functions
and there is a turning point (where the function decreases first then increases) for both functions.
They can see that the absolute value functions are two linear functions combining and the rate of
change from both sides of the turning point is constant but opposite. Also, they will observe the
differences in rate of change between the parent function and the new function. In the parent
function, for each input value that increased the output value is increased by one unit, and in the
new function, for each input value that increased the output value is increased by three units.
When the output value is approaching 3, the input value will be approaching -2 which shows that
the turning point has changed from point (0, 0) to point (-2, 3). This means every x value
decreased by two units and every output value increased by three units, when compared to the
parent function. Most significantly, this transformation happened to each and every point on the
graph. The students were required to write their equation in factored form to define the graph
which is y = 3 .
At the end of the unit, each student was required to complete a unit test (Appendix B).
Also they were separated into groups to complete a project, and the teacher gave detailed
14
instruction and directions (Appendix C). The purpose of the unit test and project was to show
how well students could reason about function transformations, and they were required to write
in complete sentences to explain their thoughts. Then three students were asked to have an
interview with the teacher (Appendix D). In the interview, students were given two different
equations which involved translation, reflection, and stretch. In the questions, they had to
describe how the parent function transformed to the given function and then graph the new
function. Also, there were two given graphs with different type of functions. Students were
asked to describe how the new function transformed from its parent function and to write an
equation to define the given graph. The interviewer proceeded to ask further questions to learn
what the students understood about function notation, function behavior, and function
transformations.
Findings
The main finding of this project is that students became better at using covariational
reasoning to give their explanations on how a new function transformed from its parent function.
Also they grew to better express their answers with meaning and more clearly understand what
they are trying to say. The first day of the unit, students were given a pretest to find out how
much they already knew about the concept. The teacher found that about 88% of students in the
classroom did not know how to graph a transformed function, give an equation to define a given
function graph, and/or state their reasoning clearly. 18 out of 24 students left everything on the
pretest blank. These results indicated that before students learned this unit, they did not
remember they could use a table to graph a given function or they did not know how
transformations work at all.
15
During the first few sections of this lesson study, the teacher was focused on students’
understanding about functions’ behavior and the translation of a function. In class, students
learned to use an x and y table to compare and discover the changes in x or y values to help them
determine how the parent function transformed to a new function. Also, they learned through
several examples modeled during class. The following question is one of many examples:
How is the following function transformed from its parent function?
f(x) = .
Most of the students, at the end of the lesson, were able to tell that by adding six to the function,
it would affect the output values which would increase by six units. When compared to the
parent function’s output value (g(x) = ), the graph will go up six units. But students were
having a difficult time figuring out how adding three to the x value would affect the function.
Then the teacher would guide students by using the following questions using functions such as
g(x) = and f(x) = :
Teacher: If the number that is cubed is approaching zero, what is x approaching? (The teacher pointed out the g(x) function.)
Student 1: The graph would move to the left three units.
Teacher: If the number that is cubed approaching zero, what is x? (The teacher pointed out the f(x) function.)
Student 2: The x would be ….
The answer that was given from the student had shown that students don’t really understand
what the question was asking, and their answer did not really respond to the question that was
asked. One of the ideal answers would be, “x is approaching negative three” (for the first
question), and the second question they are expected to answer “x approaches zero.” Since
16
students were confused about what the questions were asking them to do. I decided to use a
different approach to guide my students. I used an x and y table for both parent function and the
new function to guide students and have them compare and find the changes in either input or
output values.
The table to the left shows the parent function’s input and output
values for .
Using this table, the teacher demonstrated that when the output value
approaches zero, the x value would also approach zero.
Then the teacher referred back to the g(x) function and its table of values and asked the
following questions:
Teacher: When the y value approached zero what is x?
Student 2: X has to become negative three.
Teacher: So, is the input or the output value is affected?
Student 3: The input value.
x y
-2 -8
-1 -1
0 0
1 1
2 8
x y
-4 -1
-3 0
-1 8
0 27
1 64
17
Teacher: Is there only one input value being affected or is every input value going to be affected?
Students: …every one of them.
Teacher: So how is adding three to the x affecting the input values?
Student 3: The graph would move to the left three units.
Teacher: How do you know? What do you mean by that?
Student 3: The three thingee. Yeah!
This was evidence that students still had a difficult time trying to express what they are thinking
but were starting to be aware of what kind of answer the teacher is expecting them to give.
Throughout the entire unit, students were evidently making progress with their reasoning skills
by using language such as, “when x increased one unit the y value would increase three units,”
and were able to express their thoughts more clearly.
At the middle of the unit’s lessons, students were given a new function’s equation and
asked to write how the parent function has transformed to a new function; most of students were
able to use covarying reasoning to state their explanations clearly. The following question is
used in one of the assignments:
Given: g(x) = 2
a) State and graph the parent function
b) Graph the transformed function and state its translation vector
In this problem, students were required to know what the parent function was (f(x) = ) and
how the new function is transformed from its parent function; then they would graph the function.
Through the class discussion, students were able to tell that by subtracting three from x every x
value would be increasing by three units, multiplying by two would make the output value
18
become two times bigger than the parent function’s output value, and subtracting four to the
entire output value would decrease every output value by four units. Through their explanations,
they were able to make the conclusion that the parent function’s graph would shift to the right
three units, and every output value would become two times more, which makes the graph
stretch to become taller, and then the graph shifted up four units. This has shown the evidence of
students starting to get comfortable with the idea of using the relationship of input and output
values to describe the function transformations.
The students were also asked to form groups to complete their final unit project. In the
project, students were asked to choose a type of function, such as a quadratic function, create
twelve different family functions, graph the family functions, and explain how the parent
function has transformed to each new function. Student groups were asked to come up to the
board to present their projects. The teacher found that about 65% of the students could speak
with meaning and use covariational reasoning to express their thoughts about function
transformations.
The first group of students chose this new function: y = . They stated that, “for
every output value, it become 7 times greater than the parent function’s output value.” Then they
showed their graph of the function. This is evidence that this group of students understood that
the output values had been affected, and every one of them was seven times greater than the
parent function’s output value. “What can you say about your graph?” is the question that the
teacher should ask her students in order to understand better how students would interpret their
graph. One of the ideal answers would be, “The graph stretches vertically”.
19
Group two chose the cubic function, and the following was one of their chosen new
functions, their graph and their explanation: f(x) = . Then group two stated that,
“The function’s inputs all increase by 2 units and the outputs all decrease by 6 units compared to
the parent function. The outputs also become 4 times larger than the parent function and all the
positive y values become negative and all the negative y values become positive when compared
to the parent function.”
Evidently the students in this group understood how operations using the numbers 4, 2 and 6 can
affect x and y values and also can explain well how the graph is transformed from its parent
function. Through the presentation, it appeared that all the students in the group were able to
explain their reasoning well and were able to see the function’s graph move as an object.
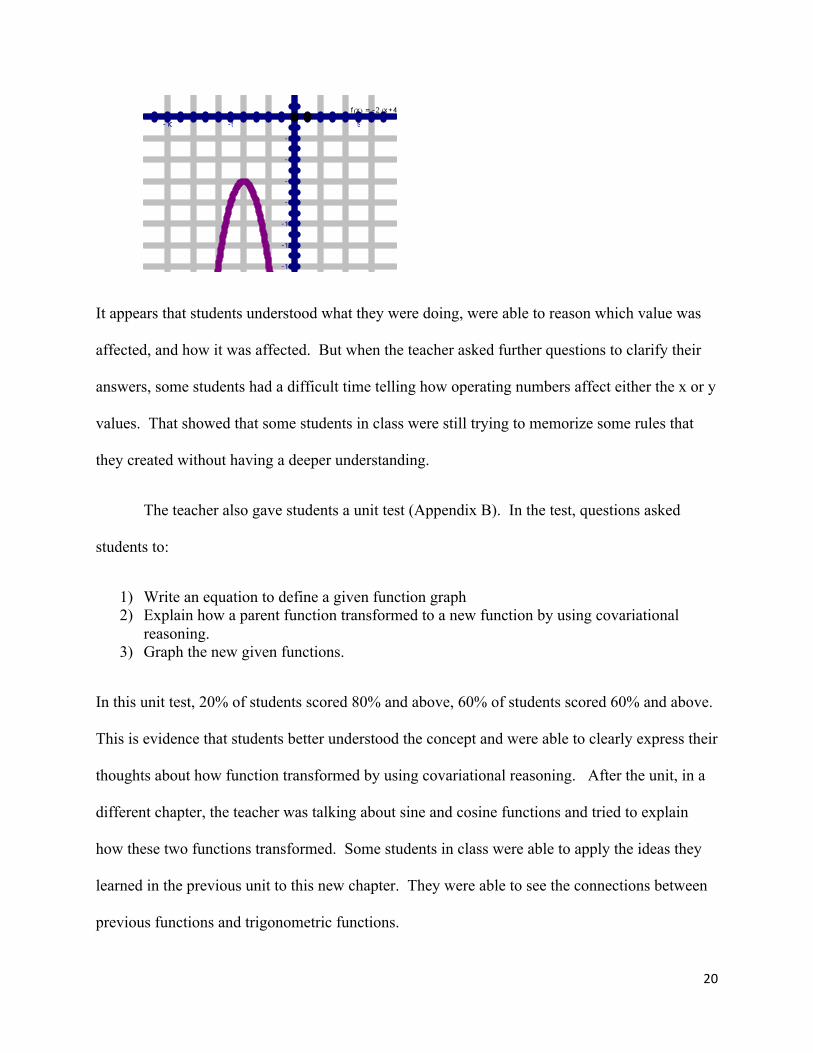
The third group chose the quadratic function, and the following is one of their chosen
new functions: f(x) = . The group three stated that, “The input is decreased by 4
and the output is decreased by 6. The graph is 2 times bigger and all outputs are turned negative
so it faces downward.”
20
It appears that students understood what they were doing, were able to reason which value was
affected, and how it was affected. But when the teacher asked further questions to clarify their
answers, some students had a difficult time telling how operating numbers affect either the x or y
values. That showed that some students in class were still trying to memorize some rules that
they created without having a deeper understanding.
The teacher also gave students a unit test (Appendix B). In the test, questions asked
students to:
1) Write an equation to define a given function graph 2) Explain how a parent function transformed to a new function by using covariational
reasoning. 3) Graph the new given functions.
In this unit test, 20% of students scored 80% and above, 60% of students scored 60% and above.
This is evidence that students better understood the concept and were able to clearly express their
thoughts about how function transformed by using covariational reasoning. After the unit, in a
different chapter, the teacher was talking about sine and cosine functions and tried to explain
how these two functions transformed. Some students in class were able to apply the ideas they
learned in the previous unit to this new chapter. They were able to see the connections between
previous functions and trigonometric functions.
21
At the end of the unit, the teacher had randomly chosen three students from the class to
participate in one on one student interviews (Appendix E). The purpose of the interview was to
help the teacher know how well students have learned from this unit and if they were able to
reason how changes in x or y values can transform a function. The first two interview questions
were trying to recognize if students could speak with meaning, know how x and y values had
been affected by the operating numbers, and then graph the given function. All three students
had no problem recognizing and writing down an equation to define the parent function. When
ask the second or third questions, Student 1 seemed still had a difficult time understanding the
questions. The following was the sample response from the interview with Student 1:
Interviewer: What happens to the value of f as the number that is cubed approaches zero? Student 1: Hum… Interviewer: What do I mean that number is cubed? Which number are we talking about? Student 1: The input value. Interviewer: The number in the parentheses, that’s the number we were talking about, right? Student 1: Yah! Interviewer: So, if that number is approaching zero, what is the f value? Student 1: Hum… 1…-3. Oh! 3! Because 3 minus 3 is zero then multiply by three is zero. Interviewer: Zero plus two is…? Student 1: Two Interviewer: So what is the f value? Student 1: Two.
22
The final answer the student gave was a correct answer, but it did not really come from the
student’s thoughts but through the guidance of the interviewer. This is evidence that Student 1
was still confused about what the question was trying to ask him and had no idea which number
was the number that is cubed. On the other hand, for the other two students, they had no
problem answering these two questions. Student 2 actually used algebra to figure out that the f
value would be two, and Student 3 used mental work to find her answer.
Then the interview kept going to the next question which stated, “Describe how the
parent function transformed to the given function.” All three students had no problem answering
the question. The following are the three responses from the three students:
Student 1: Input is increased by 3 from the parent function’s input value. Output value is increased by 2 from parent function’s output value and output value is 3 times larger than parent function’s output value. Student 2: All input value increase by 3 units from parent function; all output values are 3 times parent function’s output value and increase by 2 units. Student 3: Every input value increases by 3 units compared to the parent function. Every output value is tripled and increases by 2 units compared to the parent function.
After these responses, the next question asked students to graph, and all three students
had no problem graphing the new function. For example, Student 1 graphed the parent function
first to help himself see and reason about where the new function’s graph was going to be.
Student 2 used tables to compare x and y values (both parent function and the new function).
For every increase in x value the new output value is three times greater than the parent
function’s output value. The third student was using mental reasoning and directly plotted the
new function’s graph.
The second part of the interview questions gave students the new function’s graph and
asked students to write an equation to define the new function and describe how the new function
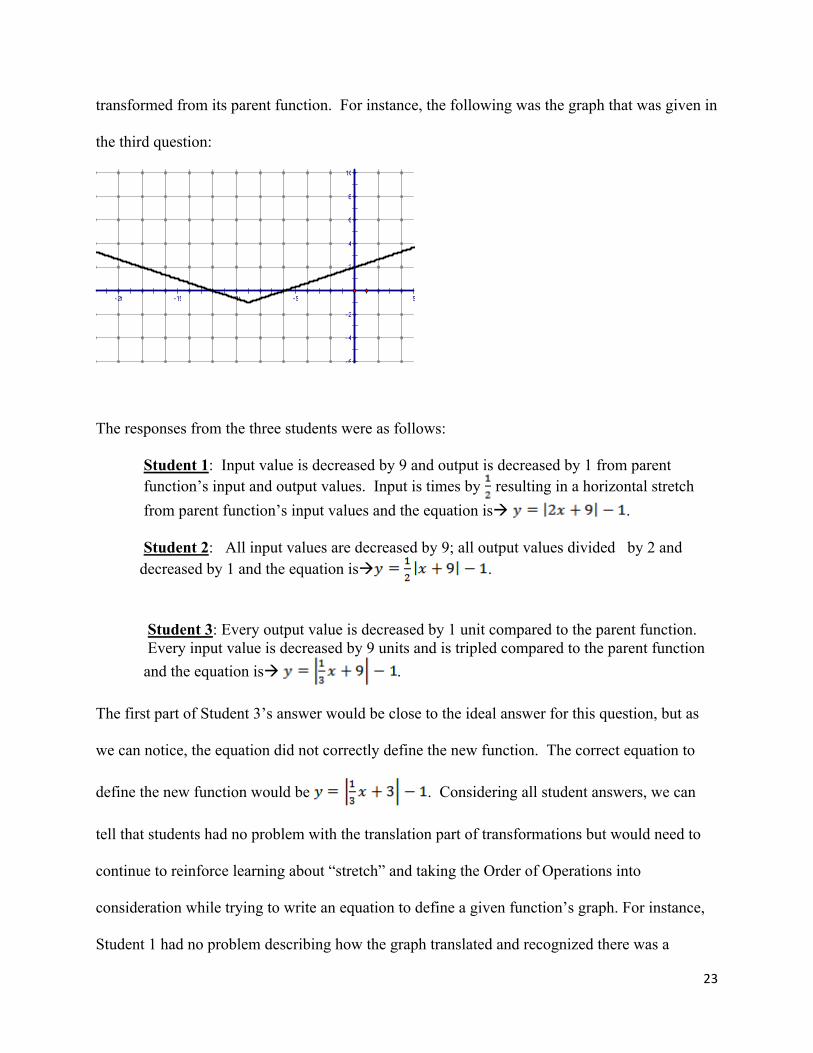
23
transformed from its parent function. For instance, the following was the graph that was given in
the third question:
The responses from the three students were as follows:
Student 1: Input value is decreased by 9 and output is decreased by 1 from parent function’s input and output values. Input is times by resulting in a horizontal stretch from parent function’s input values and the equation is .
Student 2: All input values are decreased by 9; all output values divided by 2 and decreased by 1 and the equation is . Student 3: Every output value is decreased by 1 unit compared to the parent function.
Every input value is decreased by 9 units and is tripled compared to the parent function and the equation is .
The first part of Student 3’s answer would be close to the ideal answer for this question, but as
we can notice, the equation did not correctly define the new function. The correct equation to
define the new function would be . Considering all student answers, we can
tell that students had no problem with the translation part of transformations but would need to
continue to reinforce learning about “stretch” and taking the Order of Operations into
consideration while trying to write an equation to define a given function’s graph. For instance,
Student 1 had no problem describing how the graph translated and recognized there was a
24
horizontal stretch but gave a wrong equation to define the given function’s graph. From Student
1’s answer, we can see that the student still did not quite understand how operating numbers can
affect the x or y values. Student 2 was confused about if the graph was stretched horizontally or
vertically. In addition, he did not take the Order of Operations into consideration while writing
the equation, which means he did not think about how multiplying by can also affect the 9.
From interviewing students, I gained a better idea of where the student’s strong point was and
which part of the lessons they were still struggling with. Taking what I have learned from these
interviews into consideration, I will be able to make changes in my lessons for a better future
outcome.
Conclusion
Through this research project, I had the opportunity to design and teach a function
transformation unit which had a very different approach than the textbook that we have in the
school. I had a lot of fun not only to redirect my thoughts through teaching the lessons but also
enjoyed seeing how my students had grown from a total procedural approach to trying to
understand and reason about how a function can be transformed. While teaching this unit,
students were not allowed to use any of graphing calculators during any quizzes or tests in the
unit, so it would encourage them to do their reasoning mentally.
Through numerous observations, I have found that a lot of students learned to use x and y
table to help them reason how the parent function had transformed to the new function. Also a
lot of students were able to incorporate the idea of Order of Operation to help them to reason and
determine how operating numbers can affect either input values or output values of a function.
Furthermore, some students were able to use the idea of function transformation from this unit
and apply their thinking to the other unit we learned later in the semester such as transformation
25
of trigonometric functions. At the end of the unit, students were able to use meaningful language
to express their thoughts, such as, “for every x value that increases, the y value becomes three
times larger than the parent function’s y value.”
This unit is only a draft of design to help students better learn and understand the
fundamental concept of transformation. There are still a lot of things that can be modified. For
instance, I plan to add some real-life type of questions to make the concept become more
relevant for students to learn. I want to be more aware of students’ explanations while they
express their ideas and thoughts in class and use questions to guide them into deeper
understanding of the function transformation concept. For example, at the beginning of the
lessons, when students answered “left three,” the answer seemed appropriate at the time,. But
later on, when I reviewed my video, I found that instead of continuing to teach the lesson, I
should have stopped and asked student to clarify their answers to find out if they really
understood the meaning behind their answers. I should have asked them to give more
explanation about how they arrived at their conclusions.
As teachers, we have a great responsibility to help our students learn well which will
ultimately benefit them for their future learning. Through the lessons, I discovered that there is
still a lot of work to do to help encourage students to learn math conceptually instead of
memorizing steps and rules. I hope that the unit can be built into our high school’s curriculum,
and the teachers who teach at the same level will be able to get together to brainstorm more ideas
to improve our way of teaching and facilitate our students’ understanding of this crucial unit.
26
References
Thompson P. W. (1994). Students, Functions, and the Undergraduate Curriculum.
In E.Dubinsky, A. H. Schoenfeld, & J. J. Kaput (Eds.), Research in Collegiate Mathematics Education, 1. Issues in Mathematics Education Vol. 4, pp. 21-44.
Oehrtman, M. C., Carlson, M. P., & Thompson, P. W. (2008). Foundational Reasoning
Abilities that Promote Coherence in Students' Function Understanding. Making the Connection: Research and Practice in Undergraduate Mathematics (pp. 27 – 42). MAA Notes. Mathematical Association of America.
Carlson M. P. A Study of Second Semester Calculus Students’ Function Conceptions. Arizona State University. Ninness C. (2005). Transformations of mathematical and stimulus functions, In Barnes-Holmes D., Rumph R. (Eds), CBMS issues in Journal of Applied Behavior Analysis. 2006,36, 299-321. Borba M.& Confrey J. (1993). The Role of the Teaching Experiment: students’ Construction of Transformations in a Multiple Representational Environment. Proceedings of the Annual Meeting of the American Educational Research Association. Available at Education Resource Information Center ERIC # Ed374977.
Boon Kiat Ng & Hu Chun (2006). Use Web-based Simulation to learn Trigonometric Curves. University of Sydney, Australia.
O’Callaghan B. (1998). Computer-Intensive Algebra and Students’ Conceptual Knowledge of Functions. Journal for Research in Mathematics Education Vol. 29, No. 1, 21-40.
27
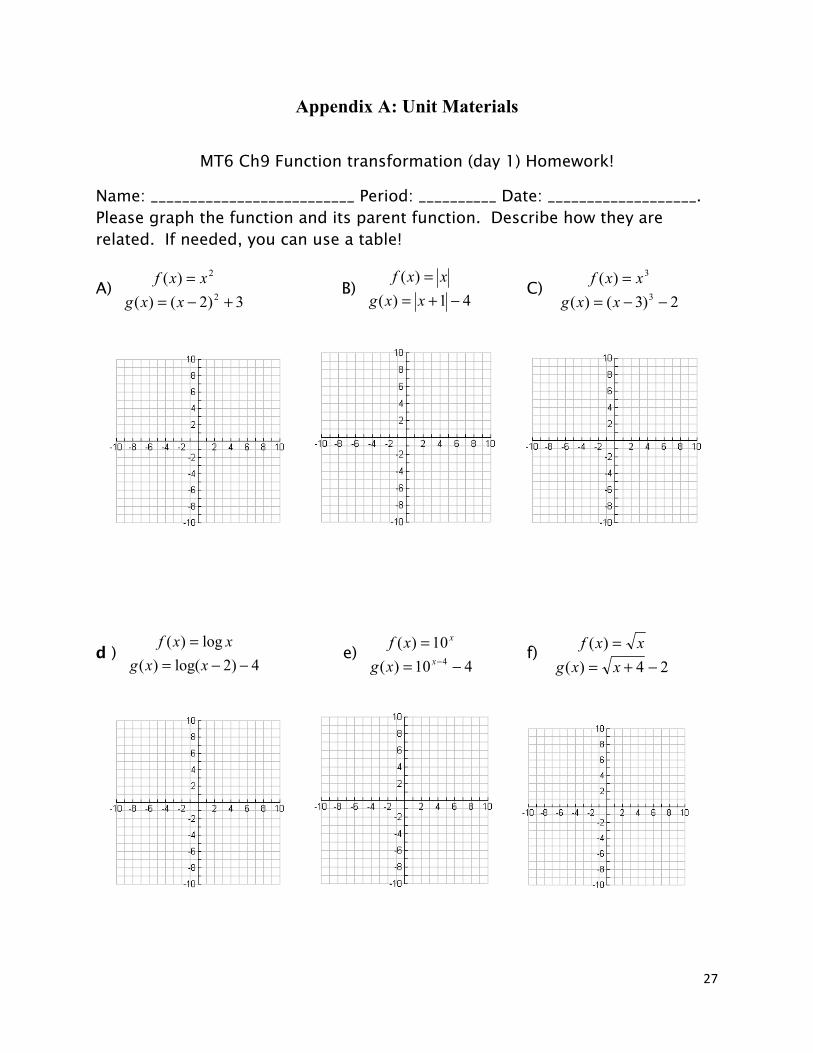
Appendix A: Unit Materials
MT6 Ch9 Function transformation (day 1) Homework!
Name: __________________________ Period: __________ Date: ___________________. Please graph the function and its parent function. Describe how they are related. If needed, you can use a table!
Please read the instructions carefully before starting to answer the question!!
For each parent function, write an equation for the graph after translation by the given vector v.
1. y = log x; v = (3 , 8) 2. y = ; v = (1, -6) 3. y = ; v = (-2, -1)
4. y = ; v=(2 , 3) 5. y = ; v = (-7, 10) 6. Y = ; v = (5, -9)
Sketch the graph of each function, its parent function, explain how the new function is translated from its parent function, and write down the translation vector.
7. y – 2 =
8. y + 3 = log (x – 2)
9. y + 5 =
10. y + 3 =
11. y – 2 =
12. y – 4 =
29
Write an equation to define the following function graphs:
13
14
15
16.
17. 18.
30
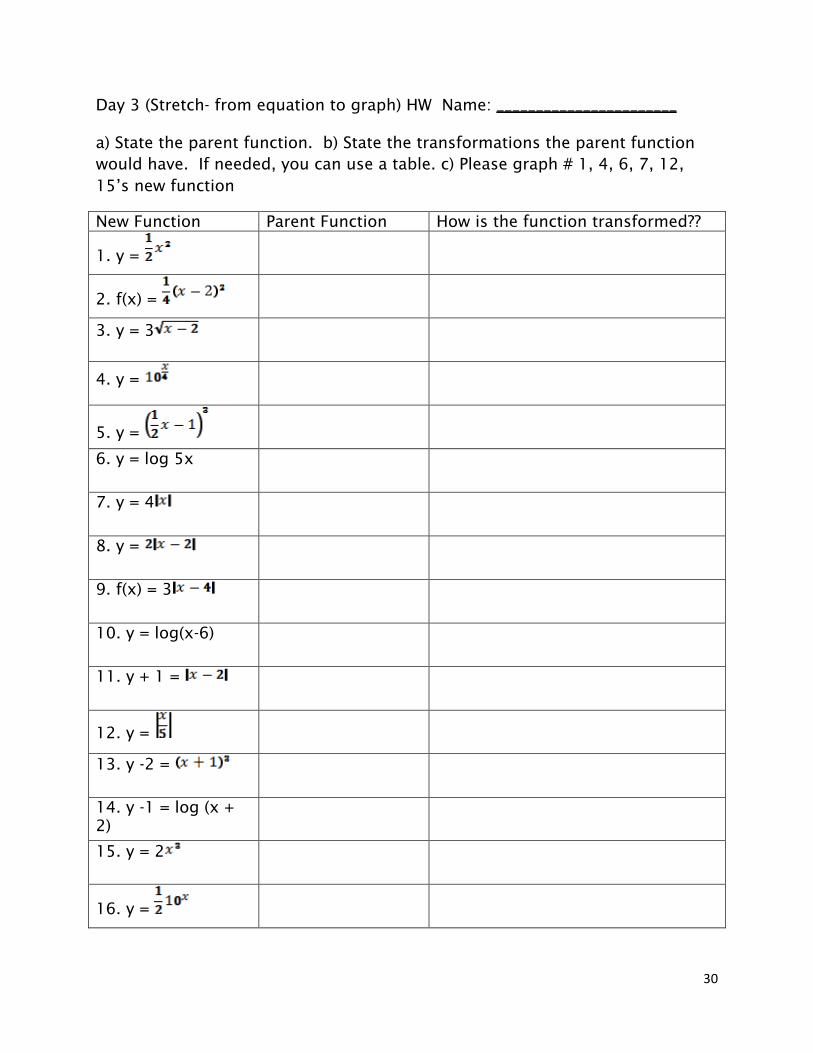
Day 3 (Stretch- from equation to graph) HW Name: _______________________ a) State the parent function. b) State the transformations the parent function would have. If needed, you can use a table. c) Please graph # 1, 4, 6, 7, 12, 15’s new function
New Function Parent Function How is the function transformed??
1. y =
2. f(x) =
3. y = 3
4. y =
5. y =
6. y = log 5x
7. y = 4
8. y =
9. f(x) = 3
10. y = log(x-6)
11. y + 1 =
12. y =
13. y -2 =
14. y -1 = log (x + 2)
15. y = 2
16. y =
31
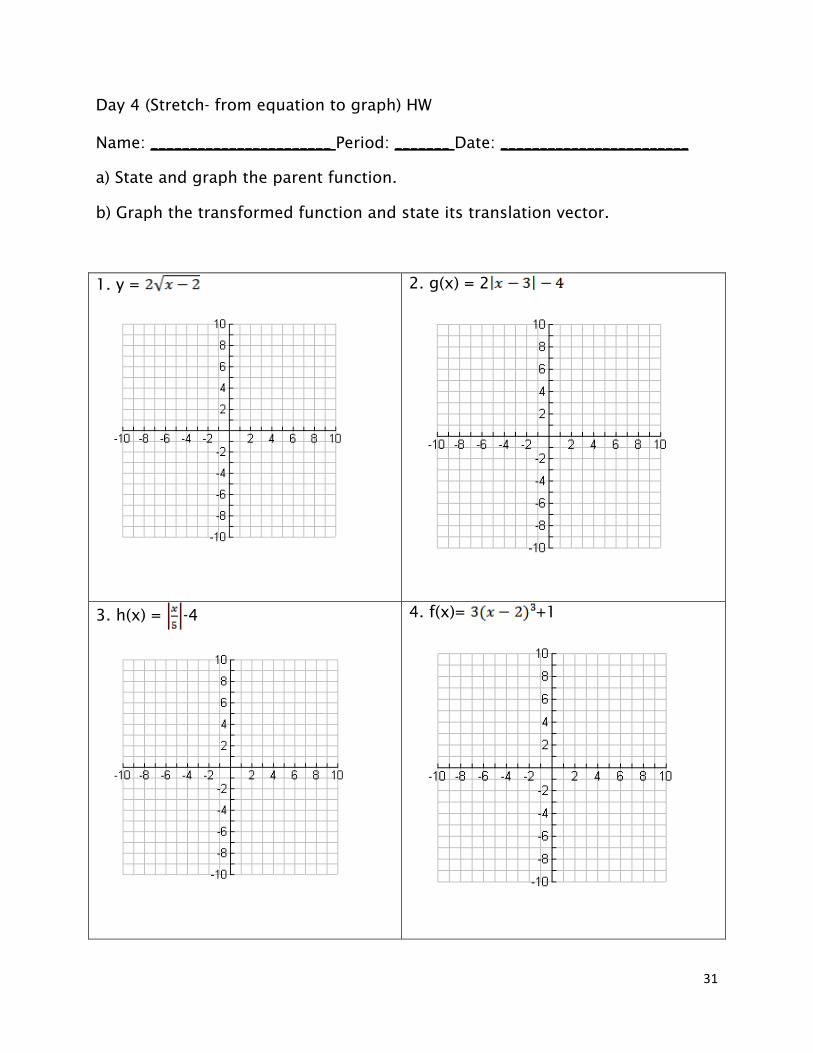
Day 4 (Stretch- from equation to graph) HW Name: _______________________ Period: _______ Date: ________________________
a) State and graph the parent function.
b) Graph the transformed function and state its translation vector.
1. y =
2. g(x) = 2
3. h(x) = -4
4. f(x)= +1
32
5. y+1 = log (2x+2)
6. f(x) =
7. y =
8. y =
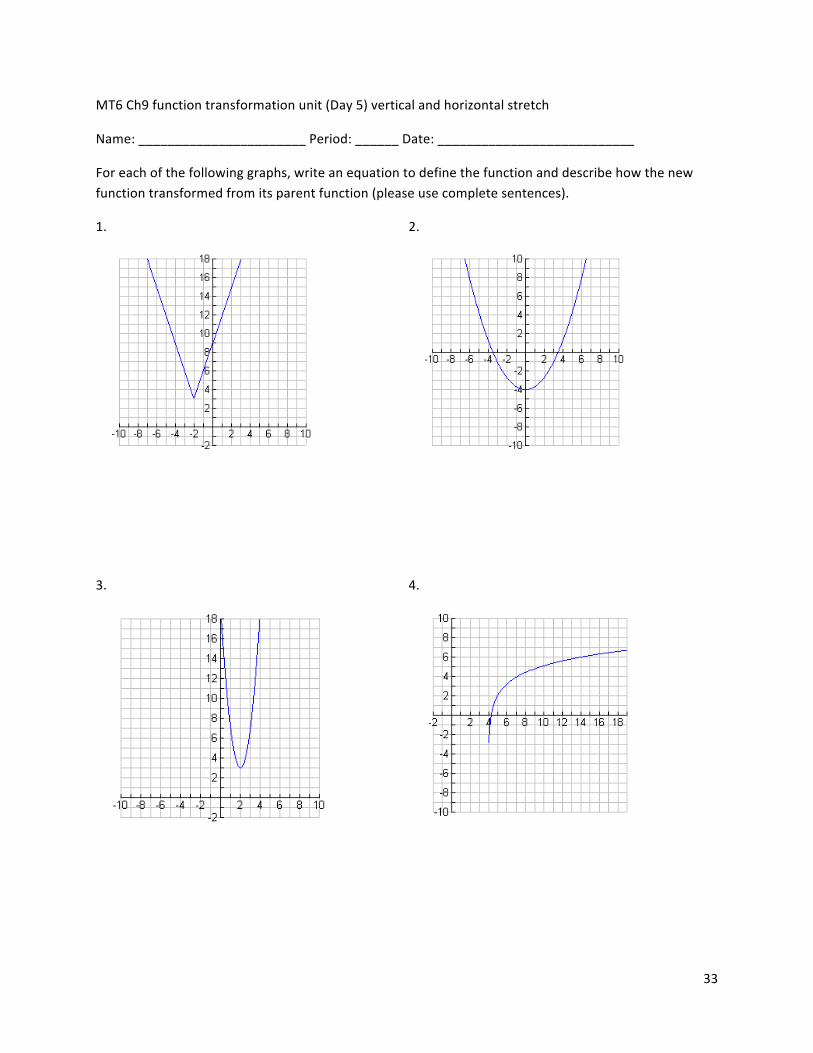
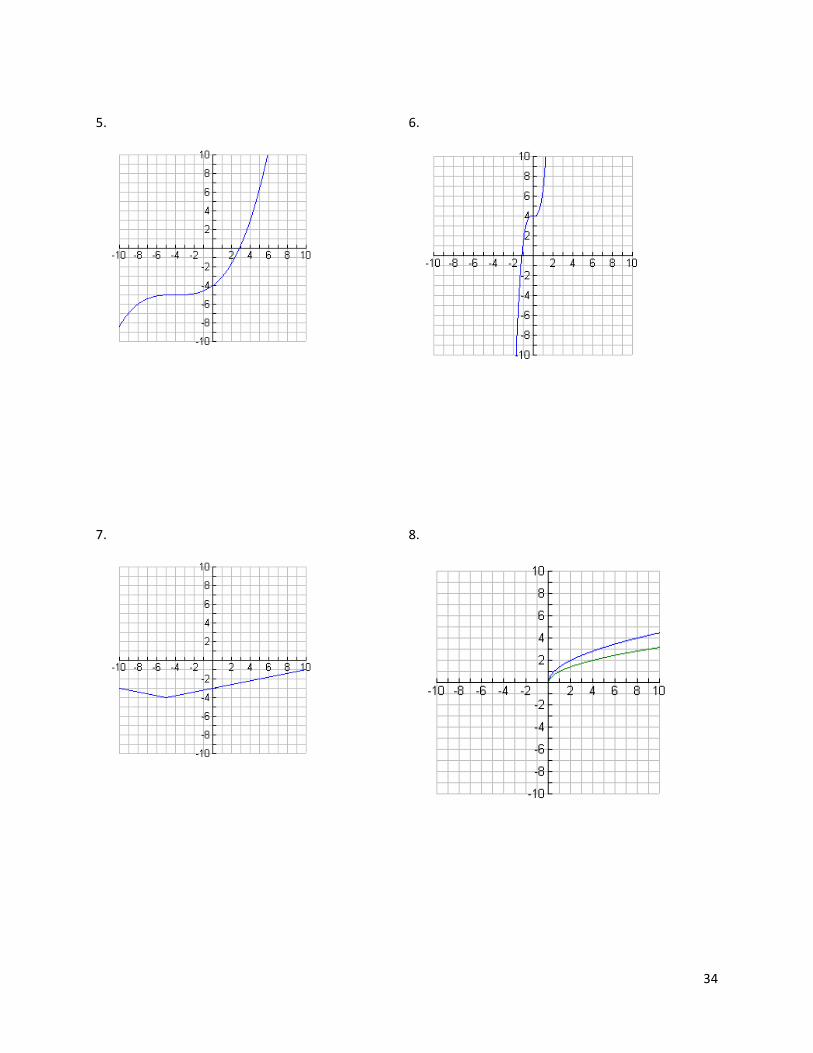
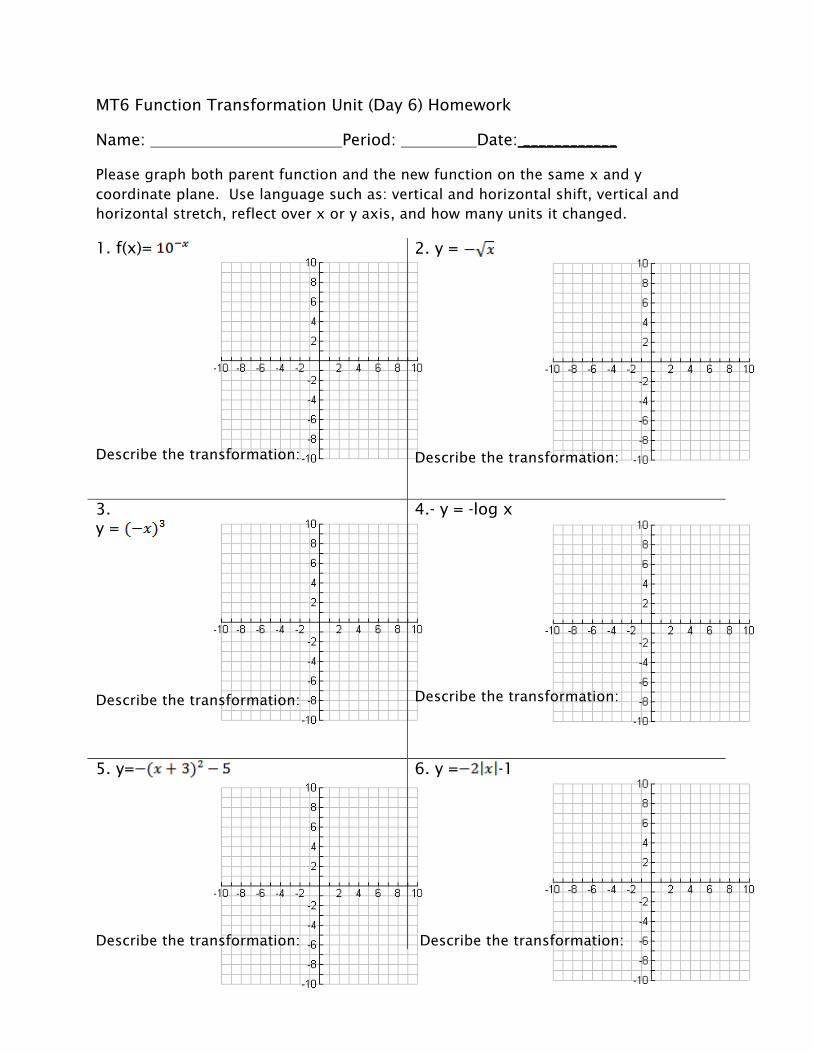
Describe the transformation of each of the following functions.
Please graph both parent function and the new function on the same x and y coordinate plane. Use language such as: vertical and horizontal shift, vertical and horizontal stretch, reflect over x or y axis, and how many units it changed.
1. f(x)= Describe the transformation:
2. y = Describe the transformation:
3. y = Describe the transformation:
4.- y = -log x Describe the transformation:
5. y= Describe the transformation:
6. y = -1 Describe the transformation:
36
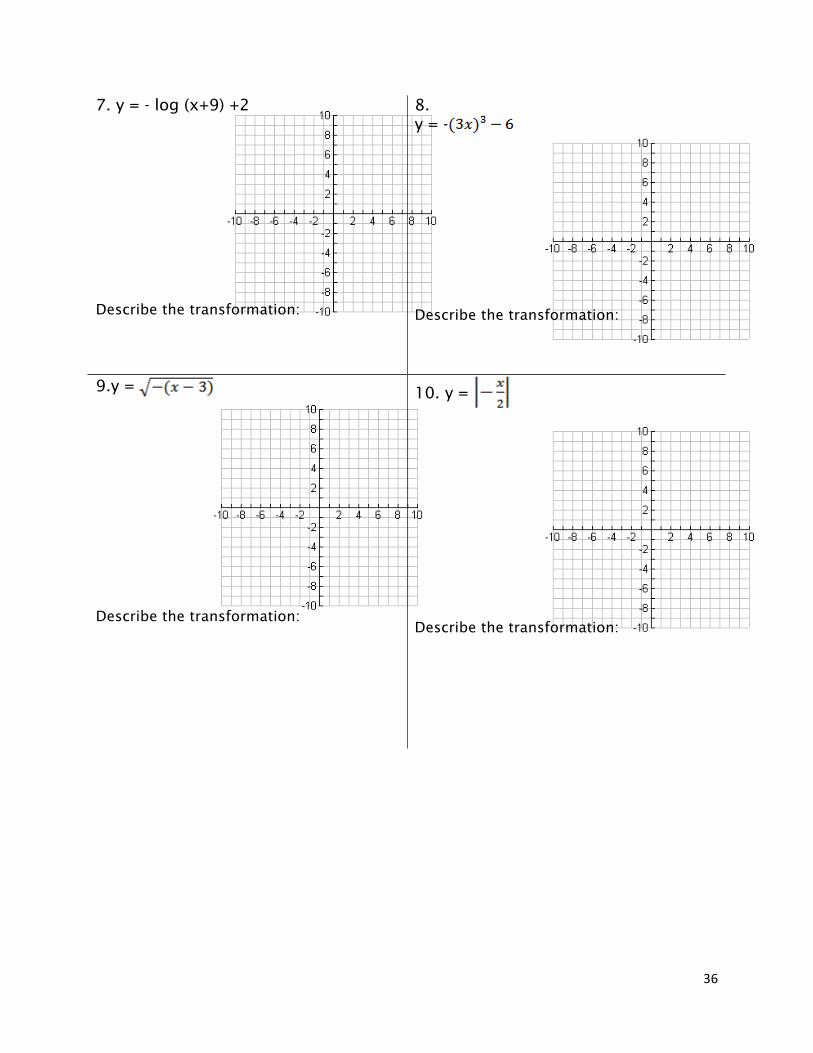
7. y = - log (x+9) +2 Describe the transformation: